Abstract
This paper presents a novel definition of the Weighted Environmental Index (WEI) specifically adapted to integrate with the official land use and land cover (LULC) cartographic historical database employed in Andalusia. This adapted WEI framework was applied to investigate land use changes within municipalities surrounding the Doñana area (South of Spain). The analysis focused on the period 1991–2016, with a detailed examination of land use modifications in thirteen individual municipalities. The results demonstrate the WEI’s adaptability in incorporating information from diverse databases. Furthermore, they highlight the importance of integrating the analysis of WEI evolution over time. This combined approach facilitates a deeper understanding of the socio-economic and environmental drivers influencing land use changes in municipalities around the Doñana area. The findings reveal a sustained decrease in WEI values over the analyzed period. This decline is attributed to the expansion of irrigated cropland at the expense of rain-fed agriculture. Additionally, a significant increase in greenhouse surface area was observed. This intensification of agriculture has contributed to aquifer overexploitation, with potential environmental consequences for the Doñana area.
1. Introduction
One of the most sensitive and fragile environmental areas in Spain is the Doñana area. The Doñana area is administratively delimited by the Territorial Planning Plan of the Doñana Area (defined by Law 7/2021, of December 1, for the promotion of the sustainability of the territory of Andalusia) [1].
In the Doñana area, in addition to the municipalities that are part of it, there is the Doñana Natural Space. Declared in 1999, it is comprised of the Doñana Natural Park and the Doñana National Park [2]. The Doñana Natural Space is one of the most important protected areas in the Andalusian territory and the largest ecological reserve in Europe, hosting a unique biodiversity, with some emblematic species such as the Iberian lynx (Lynx pardina) and the Iberian imperial eagle (Aquila adalberti), which are currently endangered [3]. Additionally, it is part of the Natura 2000 Network as a Special Conservation Area (SCA) and Special Protection Area for Birds (SPAB) and is internationally recognized as a Biosphere Reserve. It is a Ramsar Wetland, and the National Park is a UNESCO World Heritage Site [4]. In addition to this, the area serves as an important stopover point on the migratory route of birds traveling between Europe and Africa [5].
The Doñana area encompasses areas of high ecological and environmental value. However, it faces numerous pressures and impacts, with land occupation and use for human activities, primarily agriculture, posing the greatest threats. The ongoing territorial tensions in the area are largely linked to a gradual process of soil anthropization, increasingly encroaching upon ecologically sensitive natural areas [6]. Thus, the existence of high-quality and fragile ecosystems (marshes, dunes, forests, and coastline) gives the area an ecological and environmental uniqueness that makes it unique in the world [7].
Since the awareness of the need to protect its natural and environmental values in the mid-20th century, which materialized with the creation of the National Park in 1969, an intense planning process has been developed in the area in question; so much so that no other area in Spain has been subjected to such a degree of public intervention. The extreme fragility of the ecosystems of Doñana and the fact that it constitutes the most important wetland in the European continent have been, on the one hand, the main motivations for such interventions. On the other hand is the need to make compatible the existence of these natural areas and the normal development of their ecological processes with the growth and economic development of the area, in which the municipalities that make it up are key elements of these territorial processes [8].
Driven by the ecological importance of the Doñana area as a unique ecosystem and biosphere reserve, this study employed the Weighted Environmental Index (WEI) [9,10] to analyze the evolution of the territory’s environmental value. The WEI is designed to integrate comprehensive information from extensive and detailed Geographic Information System (GIS) databases. In this research, land use information was drawn from the Map of Land Uses and Vegetation Cover in Andalusia (MUCVA) [11]. To facilitate this integration, the original WEI formulation required an update, as explained subsequently.
Environmental indicators have become a ubiquitous evaluation tool across national, regional, local, and field levels [12]. These indicators empower decision-makers with the information necessary to make informed judgments about policies, programs, plans, and projects [13]. Notably, a key advancement in protected area conservation involves the use of environmental indicators to assess management effectiveness [14]. Monitoring programs incorporating environmental indicators have been integrated into the management planning of national parks, playing a crucial role in evaluating their effectiveness [15].
From a sustainability perspective, and particularly in relation to land-use-related human activities that can generate environmental impacts, the 1993 UNESCO program’s emphasis on a shift in urban indicator conception is noteworthy [16]. This shift promotes an ecological interpretation of indicators, enabling the evaluation of material and energy flows, interactions between urban and environmental systems, and the interrelationships between economy, ecology, and urban policy [17].
Consequently, a significant portion of land use indicators established for cities and municipalities aim to serve as a cornerstone tool for evaluating and monitoring local sustainability in relation to land use patterns. From an ecological urban planning perspective, these indicators champion a compact city model. This model prioritizes reduced land consumption, maximizes efficiency in natural resource utilization, and minimizes the pressure exerted by urban systems on supporting ecosystems [18,19,20,21,22,23,24,25]. The increased use of environmental indices and indicators based on land use and land cover for assessing the sustainability of national parks and areas of high environmental value can be partly attributed to the capabilities offered by GIS tools (such as ArcGIS Pro v2.9, which was used in this study) and official databases [18,19,20,21,22,23,24,25].
Land use changes in the Doñana area, a socio-ecological system with unique characteristics and significant societal services (agriculture being particularly prominent) [3,5,26], represent a key human-induced factor driving territorial transformation. This area has faced a decades-long struggle to balance conservation of its environmental values with fostering economic development for a historically disadvantaged region. Land occupation, reflecting a region’s development model, becomes a crucial indicator for understanding sustainability dynamics in Doñana. Here, the territory grapples with a matrix of land uses associated with expanding intensive agriculture, tourism, and urbanization projects [27].
Therefore, the inclusion of an environmental value index like the WEI in this sustainability analysis is inherently justified. By applying this analysis to a space as significant as Doñana, the spatial and temporal evaluation of WEI will provide valuable information for investigating the area’s sustainability.
2. Materials and Methods
2.1. The Doñana Area and the Municipalities under Study
Doñana, a unique territorial area of 2733 km2, occupies the southwestern tip of the Iberian Peninsula. Its physical boundaries are the Guadalquivir River (lower course towards its mouth) to the east, the A-49 highway connecting Seville and Huelva to the north, the Tinto River to the northwest, and the Atlantic Ocean along the entire coastal strip between the mouths of the Guadalquivir and Tinto rivers to the southwest [28].
Encompassing municipalities across two provinces, Doñana’s territorial management plan includes Almonte, Bonares, Bollullos Par del Condado, Hinojos, Lucena del Puerto, Moguer, Palos de la Frontera, and Rociana del Condado in the Province of Huelva, and Aznalcázar, Isla Mayor, La Puebla del Río, Pilas, and Villamanrique de la Condesa in the Province of Seville (Figure 1).
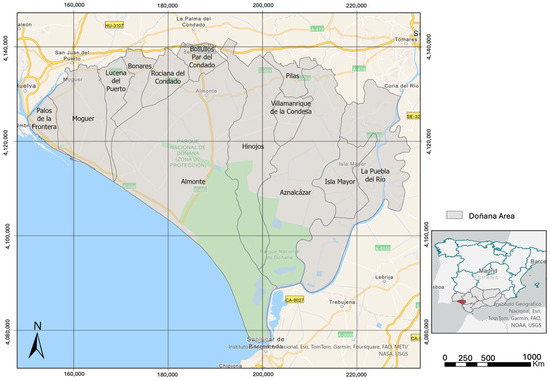
Figure 1.
Location of the municipalities around the Doñana area.
The A-49 highway serves as a crucial element for the Doñana area, functioning as a northern boundary, a transportation link, and a structuring axis. The region’s entire urban system has developed around this corridor, with urban, agricultural, industrial, and infrastructure uses concentrated in its vicinity [29].
South of the A-49 lies a vast expanse with distinct characteristics. This territory is marked by demographic sparsity and a dominance of interactions between the biophysical substrate (the underlying geological and biological foundation) and natural resource utilization [29]. This southern region encompasses the most ecologically and environmentally valuable spaces within Doñana, including the Doñana Natural Space, which incorporates both the Natural and National Parks. All known planning instruments in the area have been developed with the protection of these high-value ecosystems as a primary objective. Table 1 presents the key characteristics of the municipalities included in this study.

Table 1.
Characteristics of the municipalities under study [30].
2.2. The SIOSE Database and the WEI Index
To address the need for more granular land use information at a national scale, the Spanish Land Occupation Information System (SIOSE) was developed in 2005. SIOSE utilizes an object-oriented conceptual data model, featuring 40 simple classes and 46 compound classes, with a spatial resolution of 1:25,000. Polygons serve as the fundamental unit of information, with minimum mappable surface areas established at 2 hectares for agricultural, forest, and natural areas; 1 hectare for urban areas and water bodies; and 0.5 hectares for crops [31].
The SIOSE conceptual model incorporates two superclasses: land use and land cover. Land cover can be either simple (one type per polygon) or composite (multiple simple or composite cover types within a single polygon). In contrast, land use refers to the socioeconomic activity associated with an area and may not directly correspond to a physical characteristic. For instance, a forest cover could have various land use types [31]. Therefore, the SIOSE model allows for assigning one or more simple or composite coverages to a single polygon through its attributes and occupancy percentages, rather than defining a single coverage for each polygon. This approach enables SIOSE to provide more detailed and user-specific land use information [32].
This study employs the Weighted Environmental Index (WEI) [9,10], a recently developed index for analyzing environmental value based on land use. The WEI facilitates the quantification of a specific area’s environmental value by considering its land use characteristics. This index is particularly advantageous for land use assessments that leverage data integrated within Geographic Information Systems. The WEI’s scalability allows for its application at both local and regional levels, enabling detailed studies using high-resolution GIS data. Furthermore, applying the WEI to the same geographical area at different points in time facilitates trend analysis, which can be used to evaluate the effectiveness of corrective measures implemented through territorial, urban, or environmental planning instruments.
As described in [9,10], the assessment of the WEI index involves quantifying the environmental index (EIj) values for each land use. This has been accomplished by considering the combined influence of the following five evaluation factors (Fi):
- F1: Anthropic or natural nature of activity developed in soil.
- F2: Water consumption associated with land use.
- F3: Soil degradation (use of chemicals).
- F4: Environmental sustainability of land use (stability of the ecosystem).
- F5: Landscape value of activity carried out in the analyzed area.
The determination of values of the evaluation factors for each land use is carried out individually so that a quantitative value is assigned for each factor Fi and land use j, in such a way that
For each of the land use categories included in the SIOSE legend, the corresponding environmental index (EIj) has been derived as the weighted average of the values assigned to each of the preceding factors (Fi), taking into account the respective weights (), as illustrated in Equations (2) and (3):
where
- : environmental index of land use j ().assigned weights to factor i.
- : evaluation factor i.
- : land use categories.
The application of is conducted through discretization into irregular polygons of variable surface, collectively constituting the entire area under study.
where
- : total area of study.
- : area of polygon k.
- npol: total number of polygons in the discretization.
Therefore, when utilizing the SIOSE database, after establishing the environmental index values corresponding to each land use, the weighted environmental index of a specific polygon (WEIk) is determined based on the environmental index values of each land use contained within the polygon. This calculation considers the proportions of the area assigned to each land use relative to the total area of the polygon, serving as weights, as shown in Equation (6).
where
- : weighted environmental index of polygon k.
- : environmental index of land use j.
- : area assigned to land use j inside the polygon k.
- : land use weighting factor j in polygon k.
- njk: number of land uses (j) inside polygon k.
The value of the weighted environmental index obtained through Equation (6) ranges between 0 and 100, where values closer to 0 indicate a very low environmental value, while values closer to 100 indicate a high environmental value. This aligns with the five evaluation factors (Fi) considered in defining the environmental index for each type of land use.
Thus, WEIk values are derived from EIj values, which are contingent upon the values assigned to the evaluation factors (Fi) and the weights associated with each factor (). Consequently, the value of the WEI index hinges on the corresponding values of the evaluation factors (Fi) and their respective weights (). The values of Fi and should be determined by the modeler based on expert knowledge, taking into account local advice.
The application of the WEI to each land use category identified by any land use legend enables classification based on the discrimination by ranges outlined in Table 2.
Table 2.
Environmental value as a function of the WEI range.
2.3. The Map of Land Uses and Vegetation Cover in Andalusia (MUCVA)
The Map of Land Uses and Vegetation Cover in Andalusia (MUCVA) is a robust and flexible data model offering an accurate and detailed representation of Andalusia’s land surface. Initiated in 1987 by the Andalusian Department of Environment, this project coincided with the European Union’s CORINE-Land Cover Program [33], which produced the national land use map for Spain as part of a Europe-wide land use mapping initiative. MUCVA was initially developed at a scale of 1:100,000. Data from MUCVA are accessible through the Andalusian Regional Government’s Environmental Information Network platform (REDIAM) [11].
A significant improvement for regional applications came in 1991 with the introduction of the first Andalusian land use map at a 1:50,000 scale. Advancements in information technology and the availability of higher-quality remote sensing products, such as satellite imagery and digital elevation models, have facilitated the development of increasingly detailed and precise cartographic products tailored to regional needs. Currently, vegetation cover maps for Andalusia are available at a 1:50,000 scale for the years 1991, 1995, and 1999 (first version).
As information is updated, particularly through comprehensive photogrammetric flights of the entire region, a cartographic update methodology has been developed to ensure the continuous improvement of map quality. This methodology has facilitated the generation of a second version of the 1999 map, alongside updated maps for 2003 and 2007. The MUCVA has continuously adapted over time to meet environmental management needs and reflect the specific characteristics of Andalusia.
The MUCVA data model is based on the initial structure of the CORINE Land Cover project. This model offers a high level of disaggregation, comprising 112 classes categorized into four main groups: built-up areas and infrastructures, wetlands and water surfaces, agricultural territories, and forest and natural areas. These main groups branch out further into 12 subgroups, 41 classes, 67 subclasses, 31 types, and 7 subtypes, providing increasingly granular detail.
A noteworthy feature of the current MUCVA model is the integration of taxonomic information within the forest and natural areas group. This enriches the map’s content significantly by incorporating details on plant species and vegetation formations, crucial for environmental management and conservation efforts [34]. The inclusion of such data provides finer resolution on the natural vegetation cover, enabling more precise calculations of the WEI index. This ultimately contributes to a more accurate assessment of the environmental state and informed decision making regarding natural resource management in Andalusia.
This study utilizes MUCVA data for 1991 and 1999, complemented by SIOSE data for 2016. While comparative studies between SIOSE and MUCVA are limited, methods have been proposed to convert the object-oriented SIOSE model into a hierarchical structure resembling MUCVA [35]. The Andalusian Department of Environment has undertaken efforts to quantify regional-level discrepancies, identifying an overestimation of built-up areas and an underestimation of agricultural areas in SIOSE. These discrepancies can be primarily attributed to the inherent structural differences of the models, along with variations in nomenclature and spatial element geometries [35]. Nevertheless, the priority of providing comprehensive and up-to-date land use information at the national level necessitates the use of SIOSE data for the year 2016.
Figure 2a,b displays the land uses in the study area using the legend provided by MUCVA in 1991 and 2016, respectively.
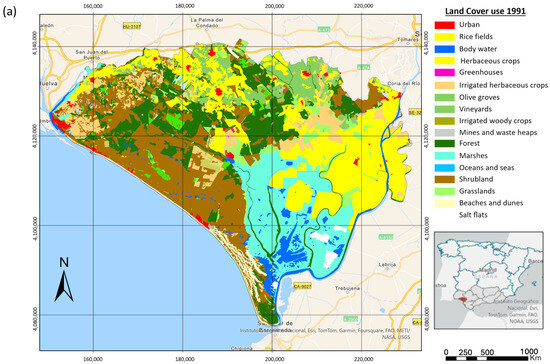
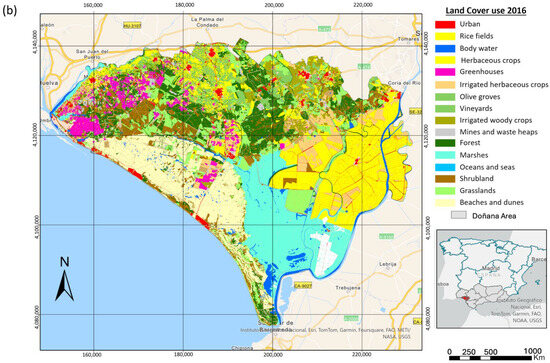
Figure 2.
Land use on the municipalities around the Doñana area for (a) 1991, and (b) 2016.
2.4. Adaptation of the WEI Index to the MUCVA Database
Table 3 presents the assigned values for the Weighted Environmental Index (WEIk) for each land use category as defined by the MUCVA legend. These WEIk values were determined by comparing the MUCVA and SIOSE database legends. Since SIOSE land use values are predefined [9], equivalences were established between the two databases, considering prior efforts to achieve standardization [35]. For land use categories lacking clear correspondences between MUCVA and SIOSE, the corresponding values for each environmental factor (Fi) were defined manually.
Table 3.
Values of the evaluation factors (Fi) for every land use considered by the SIOSE and the MUCVA databases and final value of the WEI Index for each single-use polygon (WEIk).
As detailed in this paper, the values presented in Table 3 for each environmental factor (Fi) are specific to the Doñana area study. For this research, all factors were assigned equal weights (.
3. Results
The Weighted Environmental Index (WEI) was employed to analyze the evolution of the environmental status of the Doñana area between 1991 and 2016. This analysis encompassed the park’s zone of influence, which includes the 13 municipalities described earlier and covers a total area of 2734 km2. The results obtained from applying the WEI index is presented and discussed below.
As stated above, the data used for these studies were downloaded from the Environmental Information Network platform of Andalusia (REDIAM) of the Regional Government of Andalusia [11]. These data included MUCVA information available for Andalusia in 1991, 1999, and SIOSE 2016. In order to compare land uses between both databases, the land use legend of SIOSE 2016 was standardized to the legend of MUCVA 1991 and 1999, using the proposed standardization available on the REDIAM website.
The land use and vegetation cover data for this study adhere to the ETR89 geodetic reference system and the Universal Transverse Mercator (UTM) projection system in zone 30. These data are collaboratively developed and updated through the SIOSE/SIPNA project (Land Use Information System and Natural Heritage Information System of Andalusia) [11]. High-resolution satellite imagery served as the primary temporal reference for the analysis. This imagery allowed for the observation of land use pattern changes over time by providing a broad perspective encompassing large areas within the territory of interest. Additionally, it facilitated the detection of temporal variations, including seasonal changes and long-term land use trends.
Satellite imagery was complemented by high-resolution aerial orthophotos. These orthophotos are geometrically corrected to account for distortions caused by Earth’s curvature and camera angle. They provided a precise geometric reference for accurate distance and area measurements of territorial features. The combined use of satellite imagery and orthophotos ensured comprehensive and reliable data on land uses and vegetation cover.
Understanding the evolution of the WEI over time necessitates examining land use changes within the Doñana area. A comprehensive Excel spreadsheet detailing the surface areas associated with each land use category in the Doñana municipalities between 1991 and 2016 is provided in the Supplementary Materials.
Table 4 highlights the eight land use categories that have undergone the most significant surface area modifications during the 1991–2016 period. Here, we delve into a detailed analysis of the land use exhibiting the most substantial increase from 1991 to 2016.
Table 4.
Most relevant land use changes between 1991 and 2016.
“Tidal marshes with vegetation” (MUCVA code: 211) exemplifies a land use category with a notable area increase. In 1991, this land use covered 1325.94 hectares, constituting only 0.49% of the total study area. By 2016, this area had grown significantly to 33,604.62 hectares, representing 12.31% of the total area. Since “tidal marshes with vegetation” carries a moderate WEI value (WEIk = 60), this substantial increase is likely to have a significant impact on the overall WEI of the study area. Similar analyses can be conducted for the remaining land use categories present within the region.
Spatial data analysis techniques were employed to evaluate the WEI across the Doñana area. This involved querying the MUCVA data model for each polygon within the study area for the years 1991, 1999, and 2016. The query results provided information on land cover type, surface area, and percentage of occupation within each polygon.
This information formed the basis for WEI analysis. The WEI values were then linked to the corresponding GIS polygon identifiers, enabling spatial representation of the index’s evolution across the three years. For consistency, the evaluation factor values (Fi) and weights (αi) were maintained throughout the analyses. The specific evaluation factors used (as shown in Table 3) were chosen through expert judgment, with all factors assigned equal weight.
Figure 3 shows the spatial distribution of the WEI across the Doñana area for 1991, 1999, and 2016. As expected, areas with the lowest WEI values tend to cluster around cities and villages, particularly in the western portion of the study area. This observation aligns with the understanding that urbanization typically leads to a decrease in environmental value due to factors like reduced natural land cover and increased resource consumption.
Figure 3.
WEI values in the municipalities around the Doñana area in (a) 1991, (b) 1999, and (c) 2016.
The successful application of the WEI to analyze the environmental status of the municipalities of Doñana area highlights its potential as a valuable tool for regional environmental assessments. This reinforces the notion that the WEI can be effectively utilized for such purposes, provided there is access to sufficient and accurate land cover data.
Figure 4 illustrates the spatial distribution of WEI changes across the study area between 1991 and 2016. Green areas represent locations where the WEI has increased, indicating an improvement in environmental value. Conversely, red areas represent areas where the WEI has decreased, signifying a decline in environmental value. This figure allows for the efficient identification of zones that have experienced either improvement or degradation in their environmental state during each analyzed period.
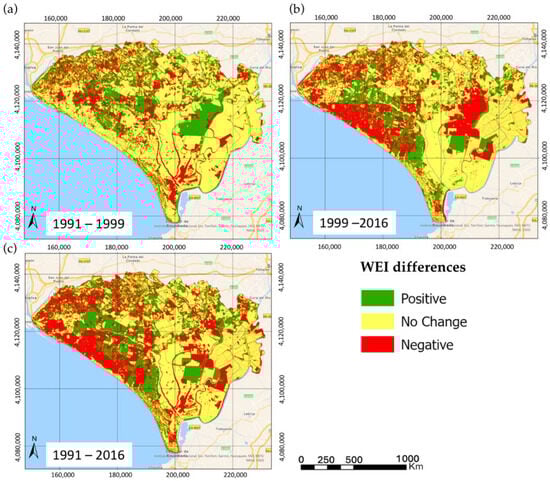
Figure 4.
WEI differences on the study period. (a) Differences between 1991 and 1999, (b) differences between 1999 and 2016, and (c) differences between 1991 and 2016.
The results in Figure 4 reveal the most significant WEI variations occurring between 1999 and 2016. These variations are scattered throughout the study area, with a concentration near the coast and even within Doñana National Park itself.
Figure 5 presents the evolution of the average WEI for the municipalities of the Doñana area between 1991 and 2016. The average WEI was calculated as the area-weighted average of the WEI values within each polygon across the study area.
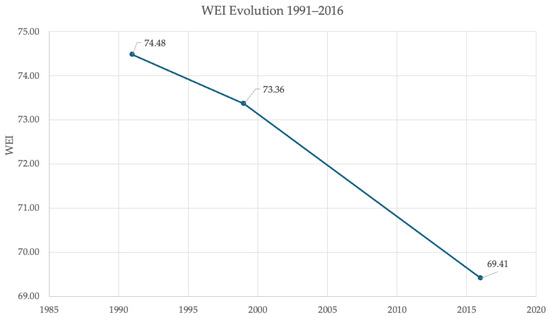
Figure 5.
Average WEI evolution over time in the municipalities around the Doñana area (1991, 1999, and 2016).
An examination of Figure 5 reveals a concerning trend of declining environmental value. In 1991, the average WEI stood at 74.48. By 1999, this value had decreased to 73.36, representing a loss of 1.51% over an eight-year period. This decline continued between 1999 and 2016, with the WEI value dropping to 69.41. Consequently, the overall WEI for the 1991–2016 period reflects a decrease of 6.81%.
This significant decline in the average WEI underscores the urgency of implementing environmental protection policies to reverse this negative trend and ensure the long-term sustainability of the Doñana area’s environment.
Data provided by MUCVA allow for a comprehensive analysis of WEI evolution over time. By leveraging this object-oriented database, the study area was subdivided into polygons, with the number increasing significantly from 2673 in 1991 to 12,894 in 1999 and reaching 69,916 in 2016. Examining the statistical distribution of WEI values across these polygons provides valuable insights into environmental status changes between 1991 and 2016.
Table 5 presents the decile values of the WEI distribution functions for each analyzed year. These values are further explored in Figure 6, which visually represents the corresponding cumulative distribution functions (CDFs).
Table 5.
Deciles of the WEI distribution function in the municipalities around the Doñana area (1991, 1999, and 2016).
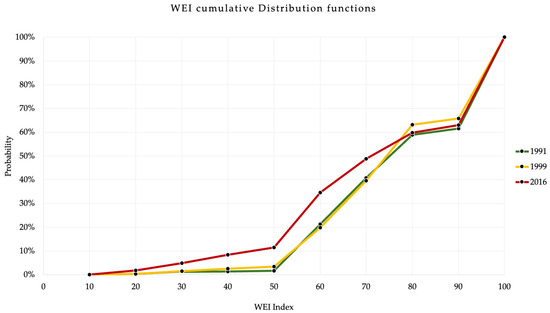
Figure 6.
WEI cumulative distribution functions (1991, 1999, and 2016) in the municipalities around the Doñana area.
Figure 6 shows the cumulative distribution functions (CDFs) of the WEI for the years 1991, 1999, and 2016. These CDFs provide valuable insights into the distribution of WEI values across the study area. A notable observation from Figure 6 is the minimal shift in the WEI distribution function between 1991 and 1999. In contrast, a clear leftward shift in the distribution is observed between 1999 and 2016. This shift signifies a general decrease in WEI values across the study area during this latter period.
Table 6 further reinforces this finding by quantifying the changes in land area associated with different WEI classes. In 1999, areas classified as having high environmental value (70 ≤ WEIk ≤ 100) constituted 60.38% of the total study area. By 2016, this percentage had declined to 51.19%. Conversely, the area classified with low environmental value witnessed a substantial increase, quadrupling from 2.55% in 1999 to 8.41% in 2016.
Table 6.
Evolution of the environmental value in the 1991–2016 period.
These observations collectively point towards a concerning trend of environmental degradation within the study area between 1999 and 2016. The decline in high WEI value areas and the concurrent rise in low WEI value areas highlight the urgency for implementing effective environmental protection measures.
The shapes of the CDFs in Figure 6 suggest a trend of decreasing high WEI values, which aligns with the previously observed decline in the average WEI.
As noted earlier, the average WEI surpassed 70 for all years except 2016. This observation is further supported by a comparison of the deciles (WEI values at specific percentiles) across the three years.
Table 7.
WEI cumulative distribution functions’ (CDFs) decile differences evolution (1991, 1999, and 2016).
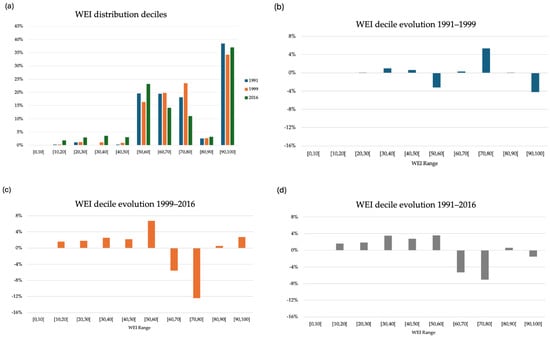
Figure 7.
WEI CDF’s decile differences evolution. (a) Decile values; (b) incremental analysis of the CDF’s decile evolution between 1991 and 1999; (c) incremental analysis of the CDF’s decile evolution between 1999 and 2016; (d) incremental analysis of the CDF’s decile evolution between 1991 and 2016.
Figure 7a presents a detailed analysis of the decile values derived from the WEI CDFs for 1991, 1999, and 2016. The y-axis scale is maintained consistent across all three subplots to facilitate direct comparison.
As expected, the maximum WEI value (10th decile) for each year fell within the 90–100 WEI range, reflecting the presence of the Doñana National Park within the study area. However, a concerning trend is evident in the decile values corresponding to the 60–80 WEI range. These values show a consistent decrease between 1999 and 2016, indicating a decline in areas with moderate environmental value.
Conversely, the decile values for areas classified with low environmental value (10–60 WEI) exhibited a clear upward trend across all classes during the 1999–2016 period. This observation collectively suggests a concerning shift towards environmental degradation within the study area.
Figure 7b provides a visual representation of the incremental changes in surface area for various WEI classes between 1991 and 1999. While this analysis only considers a single time period, it offers valuable insights into the early trends of environmental change within the study area.
Looking at Figure 7b, we observe a concerning decrease of 4.23% in the surface area classified with the highest environmental value (90 < WEIk < 100) between 1991 and 1999. This decline is partially offset by increases in some mid-range WEI classes. The areas with environmental value between 70 < WEIk < 80 and 40 < WEIk < 50 experienced increases of 5.38% and 0.63%, respectively. Additionally, a slight increase of 1.00% is observed for zones classified between 30 < WEIk < 40. However, it is important to note that these mid-range gains were not enough to compensate for the substantial loss in the highest WEI class. Overall, this period (1991–1999) appears to show a trend of decreasing area with high environmental value.
Based on these results, we can conclude that between 1991 and 1999, a trend began to emerge, albeit not very pronounced, towards a decrease in environmental value in the municipalities surrounding the Doñana area. This decline in environmental value, as we will see next, worsened during the 1999–2016 period.
Figure 7c,d shows the incremental changes in surface area for various WEI classes during the two analyzed periods: 1999–2016 (Figure 7c) and 1991–2016 (Figure 7d). While a slight increase (2.72%) is observed in the highest WEI class (90 < WEIk < 100) between 1999 and 2016, this is overshadowed by significant decreases in other high and mid-range classes. The area with environmental value between 70 < WEIk < 80 shows a substantial decline of 12.44%, and the 60 < WEIk < 70 class experienced a decrease of 5.58%. These substantial losses in high value areas necessarily imply a corresponding rise in areas with lower environmental value. This trend is confirmed by the increases observed in all lower WEI classes (0 < WEIk < 60) during the period of 1999–2016. The most significant increase occurred in the 50 < WEIk < 60 class, with a growth of 6.76%.
Figure 7d reinforces this pattern for the entire 1991–2016 period. While the changes between 1991 and 1999 were less pronounced (as discussed earlier in Figure 7b), the overall trend is consistent. There was a qualitative shift towards a larger surface area with lower WEI values at the expense of areas with higher environmental value. This is evident in the decrease in surface area for the 60 < WEIk < 70 class (5.29%) and the 70 < WEIk < 80 class (7.06%) between 1991 and 2016. Similar to the 1999–2016 period, all lower WEI value classes (0 < WEIk < 60) witnessed increases in surface area during the entire 1991–2016 timeframe.
4. Discussion
Table 8 shows the changes in land use during the period 1991–2016 in the Doñana area and the corresponding values of the WEI for each land use. The table has been ordered according to the predominant land uses in 2016 and displays the results corresponding to land uses covering 90% of the total study area. The complete results are included in the Supplementary Materials.
Table 8.
Changes in land use during the period 1991–2016 in the Doñana area.
An interesting trend emerged when examining marshlands (MUCVA Codes 211 and 215) within the study area. While the total marshland area remained relatively constant between 1991 and 2016 (35,253.78 hectares in 1991 and a comparable area likely implied for 2016 based on the provided data), a significant shift in the typology of these marshlands is observed. In 1991, tidal marshes (MUCVA Code 211) constituted a minor portion of the total marshland area (around 0.49% or 1325.93 hectares). However, by 2016, tidal marshes had become the dominant marshland type, covering a substantially larger area (12.31% or 33,604.62 hectares). This is justified by a conversion of non-tidal marshlands (MUCVA Code 215) to tidal marshlands over the study period.
It is important to note that the WEI value assigned to marshlands is independent of their specific type (tidal or non-tidal). Therefore, this change in marshland typology would not directly impact the overall WEI calculations for the entire study area.
It is important to consider a potential limitation when analyzing land use changes based on Table 8. The land use classification system employed in 1991 underwent modifications following the implementation of the SIOSE project’s land use legend in the year 2005 [36]. This change in classification criteria could lead to situations where areas with unchanged land use between 1991 and 2016 might appear differently in the digital mapping due to the revised classification scheme. The example of beach and dune zones within the Doñana study area, which are discussed below, serves as a concrete illustration of this potential issue.
The second most prevalent land use type in 2016 is “beaches, dunes, and sands” (MUCVA Code 421), encompassing 11.85% of the total area (32,354.41 hectares). Interestingly, this same area was classified as “dense shrub with trees: scattered conifers” (MUCVA Code 625) in 1991.
However, a closer examination through satellite image visualization reveals that the land cover itself has not changed between 1991 and 2016. This discrepancy highlights the earlier mentioned limitation arising from the classification system modification following the SIOSE project [32]. In this specific case, the change in classification does not significantly impact the WEI analysis because the WEI value assigned to “beaches, dunes, and sands” (WEIk = 90) is very similar to the average WEI value typically assigned to shrubland.
Table 8 highlights several key land use changes that have likely contributed to the observed decline in WEI across the study area. The most striking change is the substantial increase in greenhouse area. While greenhouses only occupied a negligible portion (0.02% or 62.29 hectares) in 1991, they expanded significantly to cover 3.43% of the total area (9378.08 hectares) by 2016. This expansion is confirmed through historical satellite image analysis (Figure 2) and was not due to classification changes. Since greenhouses have a low WEI value (30), their increased presence has undoubtedly contributed to the overall WEI decrease.
Another noteworthy change is the emergence of irrigated olive cultivation (“irrigated woody crops: olive trees”, MUCVA Code 421) by 2016. This land use type was entirely absent in 1991, as olive cultivation relied solely on rainfall. In 2016, irrigated olive groves occupied 2.01% of the total area (5484.61 hectares), which aligns with observations from other studies conducted in Andalusia [37]. While positive from an economic perspective, irrigated olive cultivation has a lower WEI value (70) compared to traditional rainfed olive cultivation (likely closer to 75–80). This shift in cultivation practices could contribute to the decreasing WEI trend.
5. Conclusions
In this study, we utilized an adaptation of the Weighted Environmental Index (WEI), utilizing land use/land cover data from the MUCVA database, to analyze the environmental status evolution of municipalities surrounding the Doñana area between 1991 and 2016. The WEI index was originally designed for use with the SIOSE database, thus necessitating the redefinition of evaluation factor (Fi) values to appropriately align and complement the land use legend used in MUCVA.
WEI functions as an analytical instrument, offering a comprehensive overview of the environmental condition of the area. Examining its fluctuations over time has yielded insightful findings concerning the progression of environmental significance and the imperative for introducing protective measures. The adaptability of the WEI stems from the user’s capacity to establish or adjust the values of the evaluation factors (Fi) to tailor them to the particular case study under examination.
By applying the aforementioned methodology to the municipalities surrounding the Doñana area, it has been determined that there are no significant changes in the distribution of the WEI index between 1991 and 1999. However, a general decrease in WEI values in the study area was observed during the period from 1999 to 2016. It was seen that in 1999, areas classified with high environmental value (70 ≤ WEIk ≤ 100) accounted for 60.38% of the study area, while in 2016, this percentage had reduced to 51.19%. Furthermore, the surface area of areas classified with low environmental value had multiplied by four in the same period, increasing from 2.55% in 1999 to 8.41% in 2016.
The analysis of the temporal evolution of the WEI highlights the significance of the water stress and agronomic pressure affecting the area surrounding the Doñana Natural Park. The expansion of irrigated areas and greenhouse zones justifies this trend in the WEI evolution.
Future research should focus on understanding the broader environmental implications of the observed land use changes. This could involve investigating potential increases in water usage or pesticide application associated with the greenhouse expansion. Additionally, a more detailed spatial analysis of these changes across the study area might reveal specific zones experiencing the most significant environmental degradation. Finally, a comprehensive assessment that considers the economic benefits of irrigated olive cultivation alongside its potential environmental impact on WEI would provide valuable insights for sustainable land-use management practices within the Doñana area.
Supplementary Materials
The following supporting information can be downloaded at https://www.mdpi.com/article/10.3390/su16104241/s1. Excel file with the details of the land use for the whole study area and detailed calculations.
Author Contributions
Conceptualization, J.-M.S.-G., J.R.-I. and C.P.R.; methodology, J.R.-I., C.P.R. and M.-E.R.-C.; formal analysis, J.-M.S.-G. and J.R.-I.; investigation J.-M.S.-G., J.R.-I. and C.P.R.; resources, J.-M.S.-G., C.P.R. and J.R.-I.; data curation, M.-E.R.-C. and J.R.-I.; writing—original draft preparation, J.-M.S.-G. and J.R.-I.; writing—review and editing, J.R.-I., C.P.R. and M.-E.R.-C.; supervision, J.-M.S.-G. and J.R.-I. All authors have read and agreed to the published version of the manuscript.
Funding
This research received no external funding.
Data Availability Statement
Data are contained within the article or Supplementary Materials.
Acknowledgments
The authors thank the municipalities around Doñana for the support given on the writing of this work.
Conflicts of Interest
The authors declare no conflicts of interest.
References
- Consejería de Fomento Articulación del Territorio y Vivienda. Junta de Andalucía. Available online: https://www.juntadeandalucia.es/organismos/fomentoarticulaciondelterritorioyvivienda/areas/ordenacion/planes-subregionales/paginas/ambito-do%C3%B1ana.html (accessed on 4 May 2024).
- Consejería de Sostenibilidad, Medio Ambiente y Economía Azul. Junta de Andalucía. Available online: https://www.juntadeandalucia.es/medioambiente/portal/landing-page-%C3%ADndice/-/asset_publisher/zX2ouZa4r1Rf/content/espacio-natural-de-do-c3-b1ana-1/20151 (accessed on 4 May 2024).
- Martin-Lopez, B.; Montes, C.; Benayas, J. Influence of user characteristics on valuation of ecosystem services in Doñana Natural Protected Area (south-west Spain). Environ. Conserv. 2007, 34, 215–224. [Google Scholar] [CrossRef]
- UNESCO World Heritage List. Available online: https://whc.unesco.org/en/list/685 (accessed on 4 May 2024).
- Gómez-Baggethun, E.; Reyes-García, V.; Olsson, P.; Montes, C. Traditional ecological knowledge and community resilience to environmental extremes: A case study in Doñana, SW Spain. Glob. Environ. Change-Hum. Policy Dimens. 2012, 22, 640–650. [Google Scholar] [CrossRef]
- Pérez Cano, M.T.; Sánchez Fuentes, D.; Navas Carrillo, D. Armonización de una realidad heterogénea: Doñana y su entorno desde el patrimonio, la urbanística y la ordenación sostenible del territorio. In Doñana y su Entorno Como Zona Patrimonial; Universidad Pablo Olavide y Visibilia: Sevilla, Spain, 2020. [Google Scholar]
- De Andalucia, J.; Blanda, T. Dictamen sobre estrategias para el desarrollo socioeconómico sostenible del entorno de Doñana. In Comisión Internacional de Expertos sobre el Desarrollo del Entorno de Doñana; Junta de Andalucía. Dirección General de Ordenación del Territorio y Urbanismo; Consejería de Obras Públicas y Transportes: Andalusia, Spain, 1992; 123p, ISBN 84-8095-004-81992. [Google Scholar]
- Granados, V.; Román, C. Desarrollo sostenible en Doñana. Estud. Reg. 1993, 37, 167–203. [Google Scholar]
- Rodrigo-Ilarri, J.; Romero, C.P.; Rodrigo-Clavero, M.-E. Land Use/Land Cover Assessment over Time Using a New Weighted Environmental Index (WEI) Based on an Object-Oriented Model and GIS Data. Sustainability 2020, 12, 10234. [Google Scholar] [CrossRef]
- Rodrigo-Ilarri, J.; Rodrigo-Clavero, M.-E.; Romero, C.P.; Suárez-Romero, P. Do Solid Waste Landfills Really Affect Land Use Change? Answers Using the Weighted Environmental Index (WEI). Remote Sens. 2022, 14, 5502. [Google Scholar] [CrossRef]
- REDIAM. Portal Ambiental de Andalucía. Junta de Andalucía. Consejería de Sostenibilidad, Medio Ambiente y Economía Azul. Available online: https://www.juntadeandalucia.es/medioambiente/portal/acceso-rediam (accessed on 6 April 2024).
- Bockstaller, C.; Girardin, P. How to validate environmental indicators. Agric. Syst. 2003, 76, 639–653. [Google Scholar] [CrossRef]
- Cloquell-Ballester, V.A.; Cloquell-Ballester, V.A.; Monterde-Diaz, R.; Santamarina-Siurana, M.C. Indicators validation for the improvement of environmental and social impact quantitative assessment. Environ. Impact Assess. Rev. 2006, 26, 79–105. [Google Scholar] [CrossRef]
- Zorrilla-Pujana, J.; Rossi, S. Environmental education indicators system for protected areas management. Ecol. Indic. 2016, 67, 146–155. [Google Scholar] [CrossRef]
- Jiao, W.; Liu, X.; He, S. Establishing an ecological monitoring system for national parks in China: A theoretical framework. Ecol. Indic. 2022, 143, 109414. [Google Scholar] [CrossRef]
- Flood, J. Urban and housing indicators. Urban Stud. 1997, 34, 1635–1665. [Google Scholar] [CrossRef]
- Feria Toribio, J.M. Indicadores de Sostenibilidad: Un Instrumento Para la Gestión Urbana; Miguel de Cervantes Virtual Library: Alicante, Spain, 2003; pp. 241–253. [Google Scholar]
- Dimobe, K.; Gessner, U.; Ouédraogo, K.; Thiombiano, A. Trends and drivers of land use/cover change in W National Park in Burkina Faso. Environ. Dev. 2022, 44, 100768. [Google Scholar] [CrossRef]
- Dietz, J.; Treydte, A.C.; Lippe, M. Exploring the future of Kafue National Park, Zambia: Scenario-based land use and land cover modelling to understand drivers and impacts of deforestation. Land Use Policy 2023, 126, 106535. [Google Scholar] [CrossRef]
- Kubacka, M.; Żywica, P.; Vila Subirós, J.; Bródka, S.; Macias, A. How do the surrounding areas of national parks work in the context of landscape fragmentation? A case study of 159 protected areas selected in 11 EU countries. Land Use Policy 2022, 113, 105910. [Google Scholar] [CrossRef]
- Qi, T.; Li, Y.; Huang, M.; Luo, B.; Peng, Z.; Wang, W.; Li, S.; Degen, A.A.; Shang, Z. Land intensification use scenarios based on urban land suitability assessment of the national park. Sustain. Cities Soc. 2024, 102, 105229. [Google Scholar] [CrossRef]
- Zhai, Y.; Li, W.; Shi, S.; Gao, Y.; Chen, Y.; Ding, Y. Spatio-temporal dynamics of ecosystem service values in China’s Northeast Tiger-Leopard National Park from 2005 to 2020: Evidence from environmental factors and land use/land cover changes. Ecol. Indic. 2023, 155, 110734. [Google Scholar] [CrossRef]
- Guan, Y.; Qiang, Y.; Qu, Y.; Lu, W.; Xiao, Y.; Chu, C.; Xiong, S.; Shao, C. Environmental sustainability and Beautiful China: A study of indicator identification and provincial evaluation. Environ. Impact Assess. Rev. 2024, 105, 107452. [Google Scholar] [CrossRef]
- Horswill, E.; Martin, J.; Guy, J.A. Establishing a functional framework for monitoring protected landscapes; with a case study of English Areas of Outstanding Natural Beauty (AONB). Ecol. Indic. 2020, 119, 106806. [Google Scholar] [CrossRef] [PubMed]
- Li, J.; Fu, J.; Zhang, Z.; Guo, X.; Hong, W.; Yuan, F.; Cong, Y.; Gao, J. Spatial pattern and screening framework of national park agglomerations in the Greater Shangri-La region, China. Ecol. Indic. 2023, 154, 110552. [Google Scholar] [CrossRef]
- Folke, C.; Colding, J.; Berkes, F. (Eds.) Synthesis: Building resilience and adaptive capacity in social-ecological systems. In Navigating Social-Ecological Systems: Building Resilience for Complexity and Change; Cambridge University Press: Cambridge, UK, 2003; pp. 352–387. [Google Scholar]
- García, F.; Martín, C. Doñana. Water and Biosphere; Ministerio de Medio Ambiente: Madrid, Spain, 2006. [Google Scholar]
- Rivera, J.F.O. Políticas forestales y medio ambiente en Doñana y su entorno. Agric. y Soc. 1992, 11, 303–357. [Google Scholar]
- Plan de Ordenación del Territorio del Ámbito de Doñana. Consejería de Obras Públicas y Transportes. Junta de Andalucía. 2003. Available online: https://www.juntadeandalucia.es/medioambiente/portal_web/web/temas_ambientales/ordenacion_territorio/02_planes_ordenacion_territorio/ambito_donana/POT_Ambito_Donana.pdf (accessed on 4 May 2024).
- SIMA. Sistema de Información Multiterritorial de Andalucía. Portal de Datos Estadísticos y Geoespaciales de Andalucía. Instituto de Estadística y Cartografía de Andalucía. Consejería de Economía, Hacienda y Fondos Europeos. Junta de Andalucía. Available online: https://www.juntadeandalucia.es/institutodeestadisticaycartografia/dega/sistema-de-informacion-multiterritorial-de-andalucia-sima (accessed on 7 April 2024).
- Equipo Técnico Nacional SIOSE. Descripción Del Modelo De Datos SIOSE-Versión 2. D.G.; Instituto Geográfico Nacional: Madrid, Spain, 2015. [Google Scholar]
- Cantarino Martí, I. Elaboración y validación de un modelo jerárquico derivado de SIOSE. Rev. Teledetección 1998, 39, 5–21. [Google Scholar]
- CORINE Copernicus Land Monitoring Service-CORINE Land Cover. Available online: https://land.copernicus.eu/en/products/corine-land-cover (accessed on 4 May 2024).
- González Fernández, A.; Fernández-Palacios Carmona, A.; Moreira Madueño, J.M.; Cadémico, J.; Ruiz Casanueva, J. El Mapa de usos y Coberturas Vegetales del Suelo de Andalucía y su Integración en un Programa de Seguimientos de Cambios del Territorio; Teledetección: Madrid, Spain, 1997; pp. 369–376. ISBN 84-7762-693-6. [Google Scholar]
- Muñoz, Á.B.; Velasco, M.J.P.; Rodríguez, C.H. Evolution of estimated erosion (USLE) and naturbanisation processes in the surroundings of the National Parks of Doñana and Sierra Nevada (Spain). Cuad. Geogr. 2020, 59, 196–223. [Google Scholar] [CrossRef]
- Consejería de Medio Ambiente y Ordenación del Territorio. Pasarela de SIOSE Andalucía 2009 Modelo Relacional a un Modelo plano (Ocupación del Suelo). 2014. Available online: https://www.juntadeandalucia.es/medioambiente/portal_web/rediam/documentos/Pasarela_SIOSEa_Ocupacion.pdf (accessed on 6 April 2024).
- Tanasijevic, L.; Todorovic, M.; Pereira, L.S.; Pizzigalli, C.; Lionello, P. Impacts of climate change on olive crop evapotranspiration and irrigation requirements in the Mediterranean region. Agric. Water Manag. 2014, 144, 54–68. [Google Scholar] [CrossRef]
Disclaimer/Publisher’s Note: The statements, opinions and data contained in all publications are solely those of the individual author(s) and contributor(s) and not of MDPI and/or the editor(s). MDPI and/or the editor(s) disclaim responsibility for any injury to people or property resulting from any ideas, methods, instructions or products referred to in the content. |
© 2024 by the authors. Licensee MDPI, Basel, Switzerland. This article is an open access article distributed under the terms and conditions of the Creative Commons Attribution (CC BY) license (https://creativecommons.org/licenses/by/4.0/).