

Spatiotemporal Effects and Optimization Strategies of Land-Use Carbon Emissions at the County Scale: A Case Study of Shaanxi Province, China

Abstract
1. Introduction
2. Materials and Methods
2.1. Study Area
2.2. Data
3. Methodologies
3.1. Land Use Carbon Emission Estimation Model
3.2. Geodetector
3.3. K-Means Clustering Algorithm
4. Results
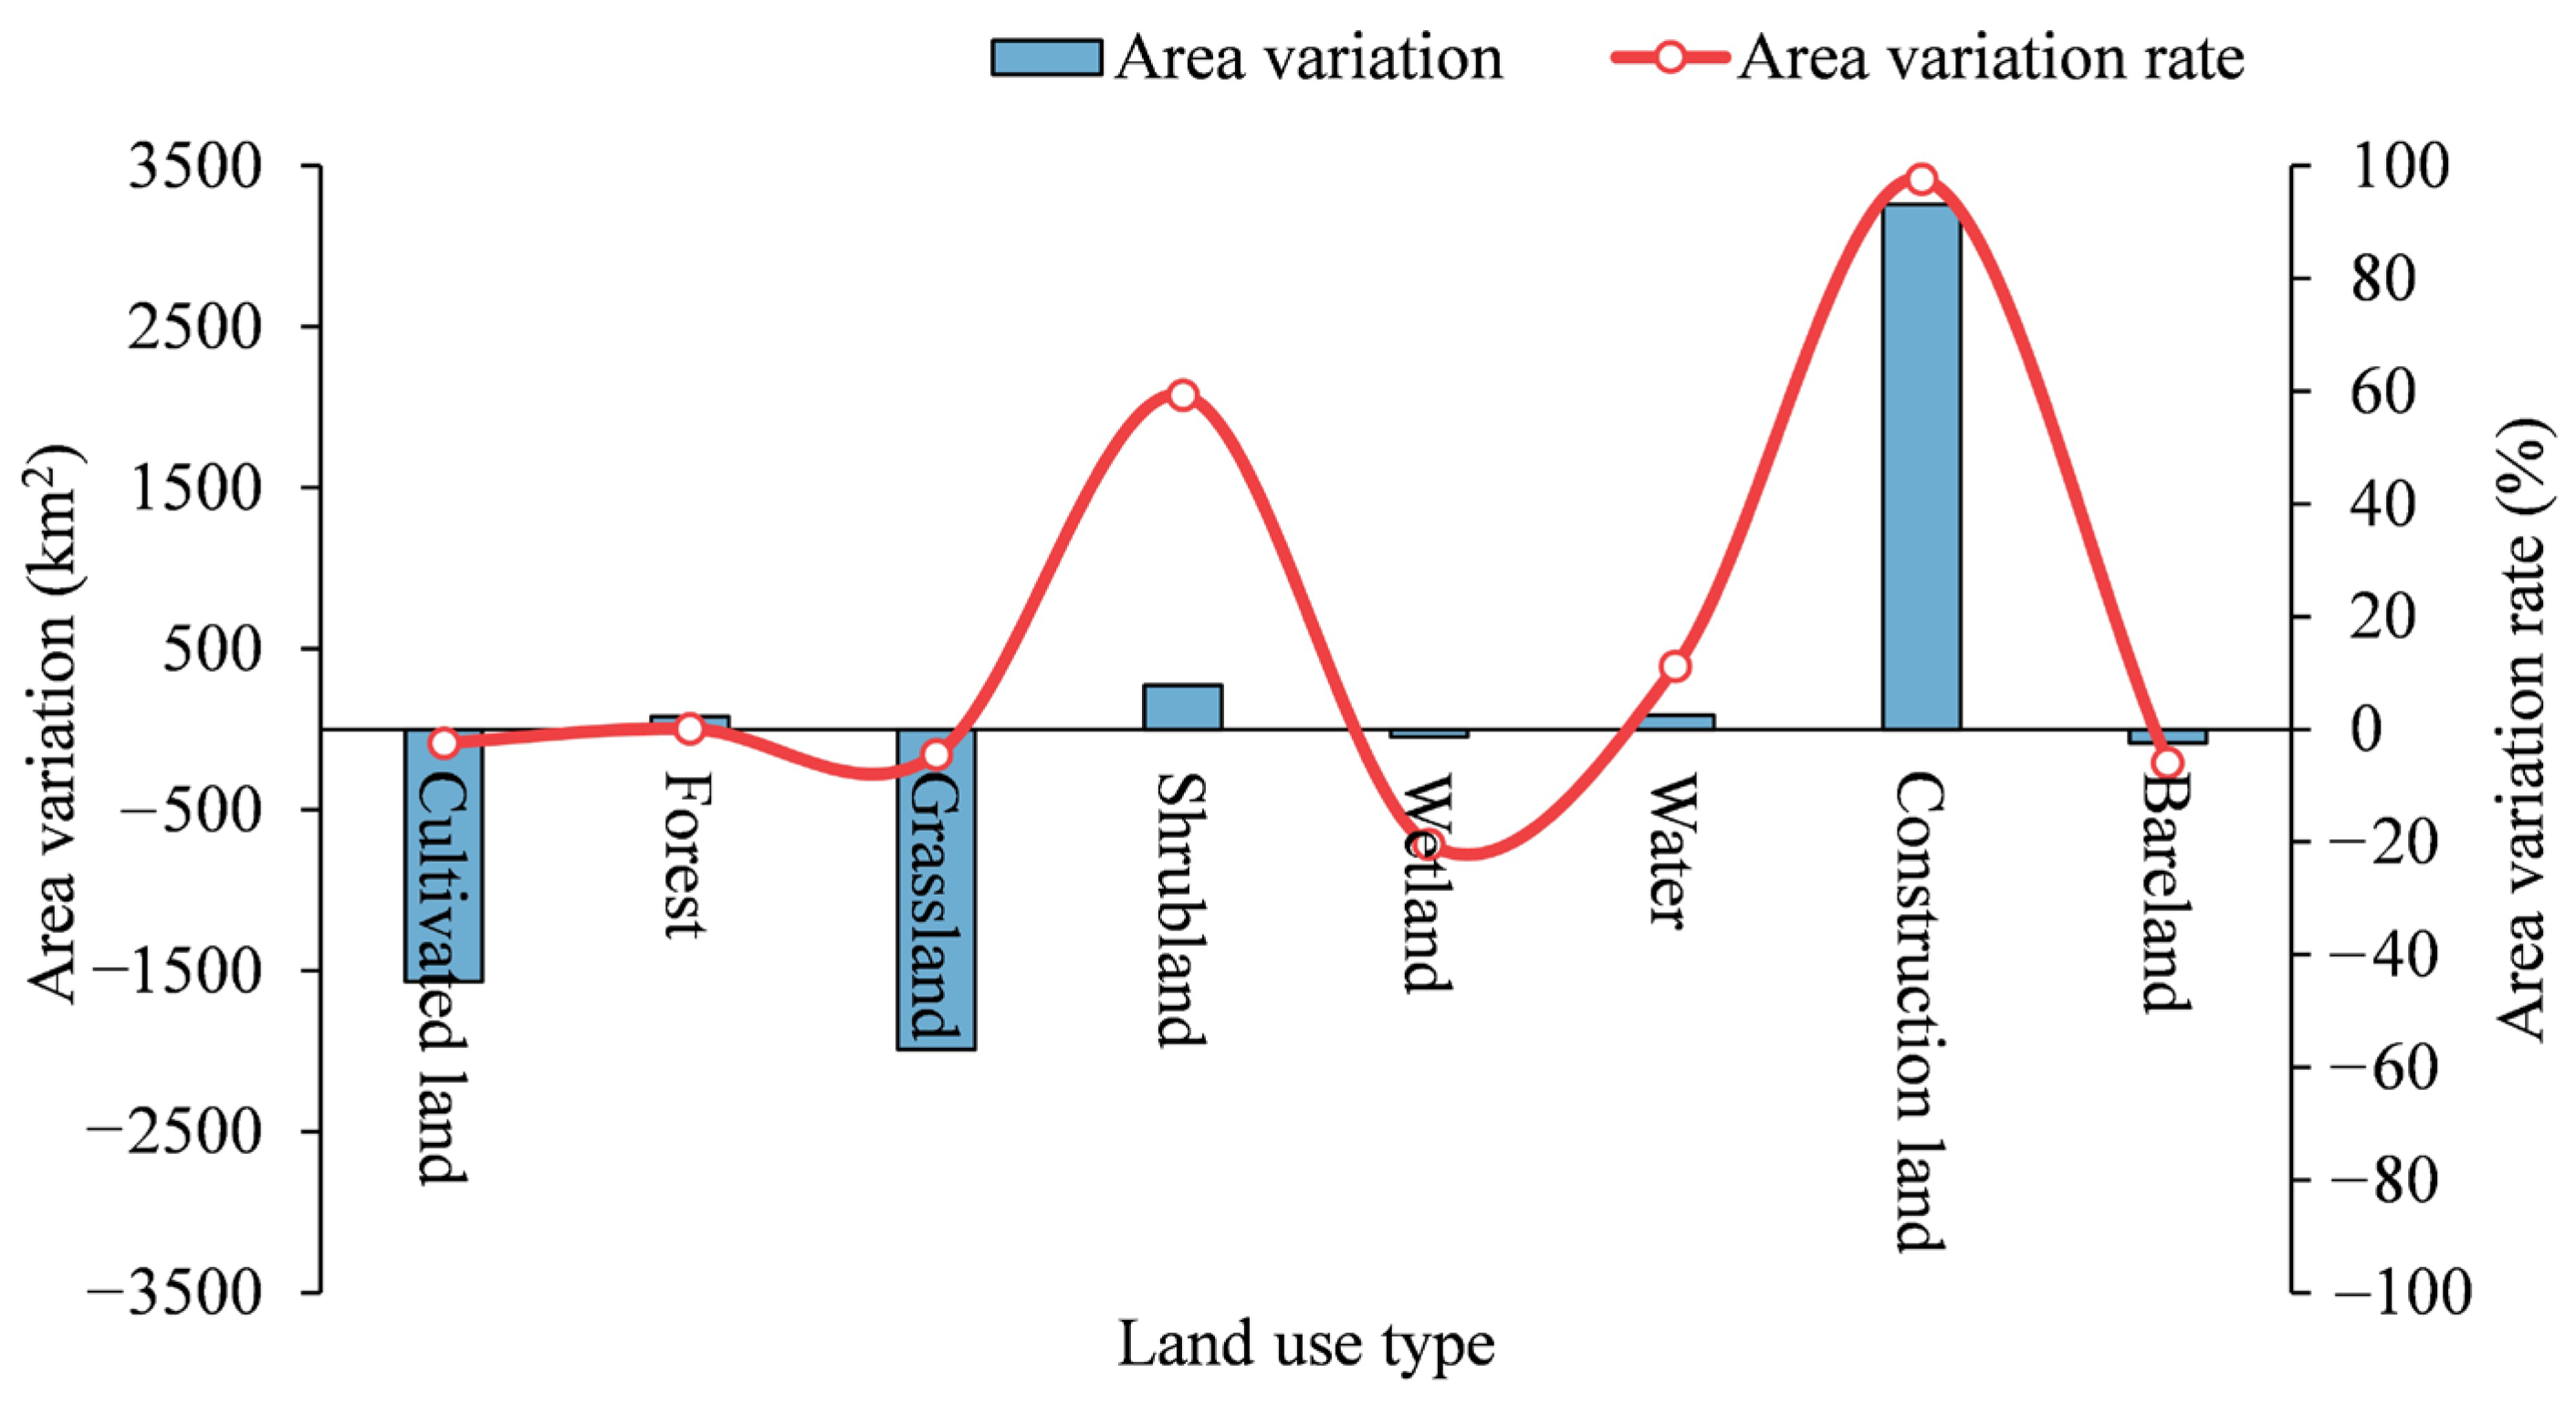
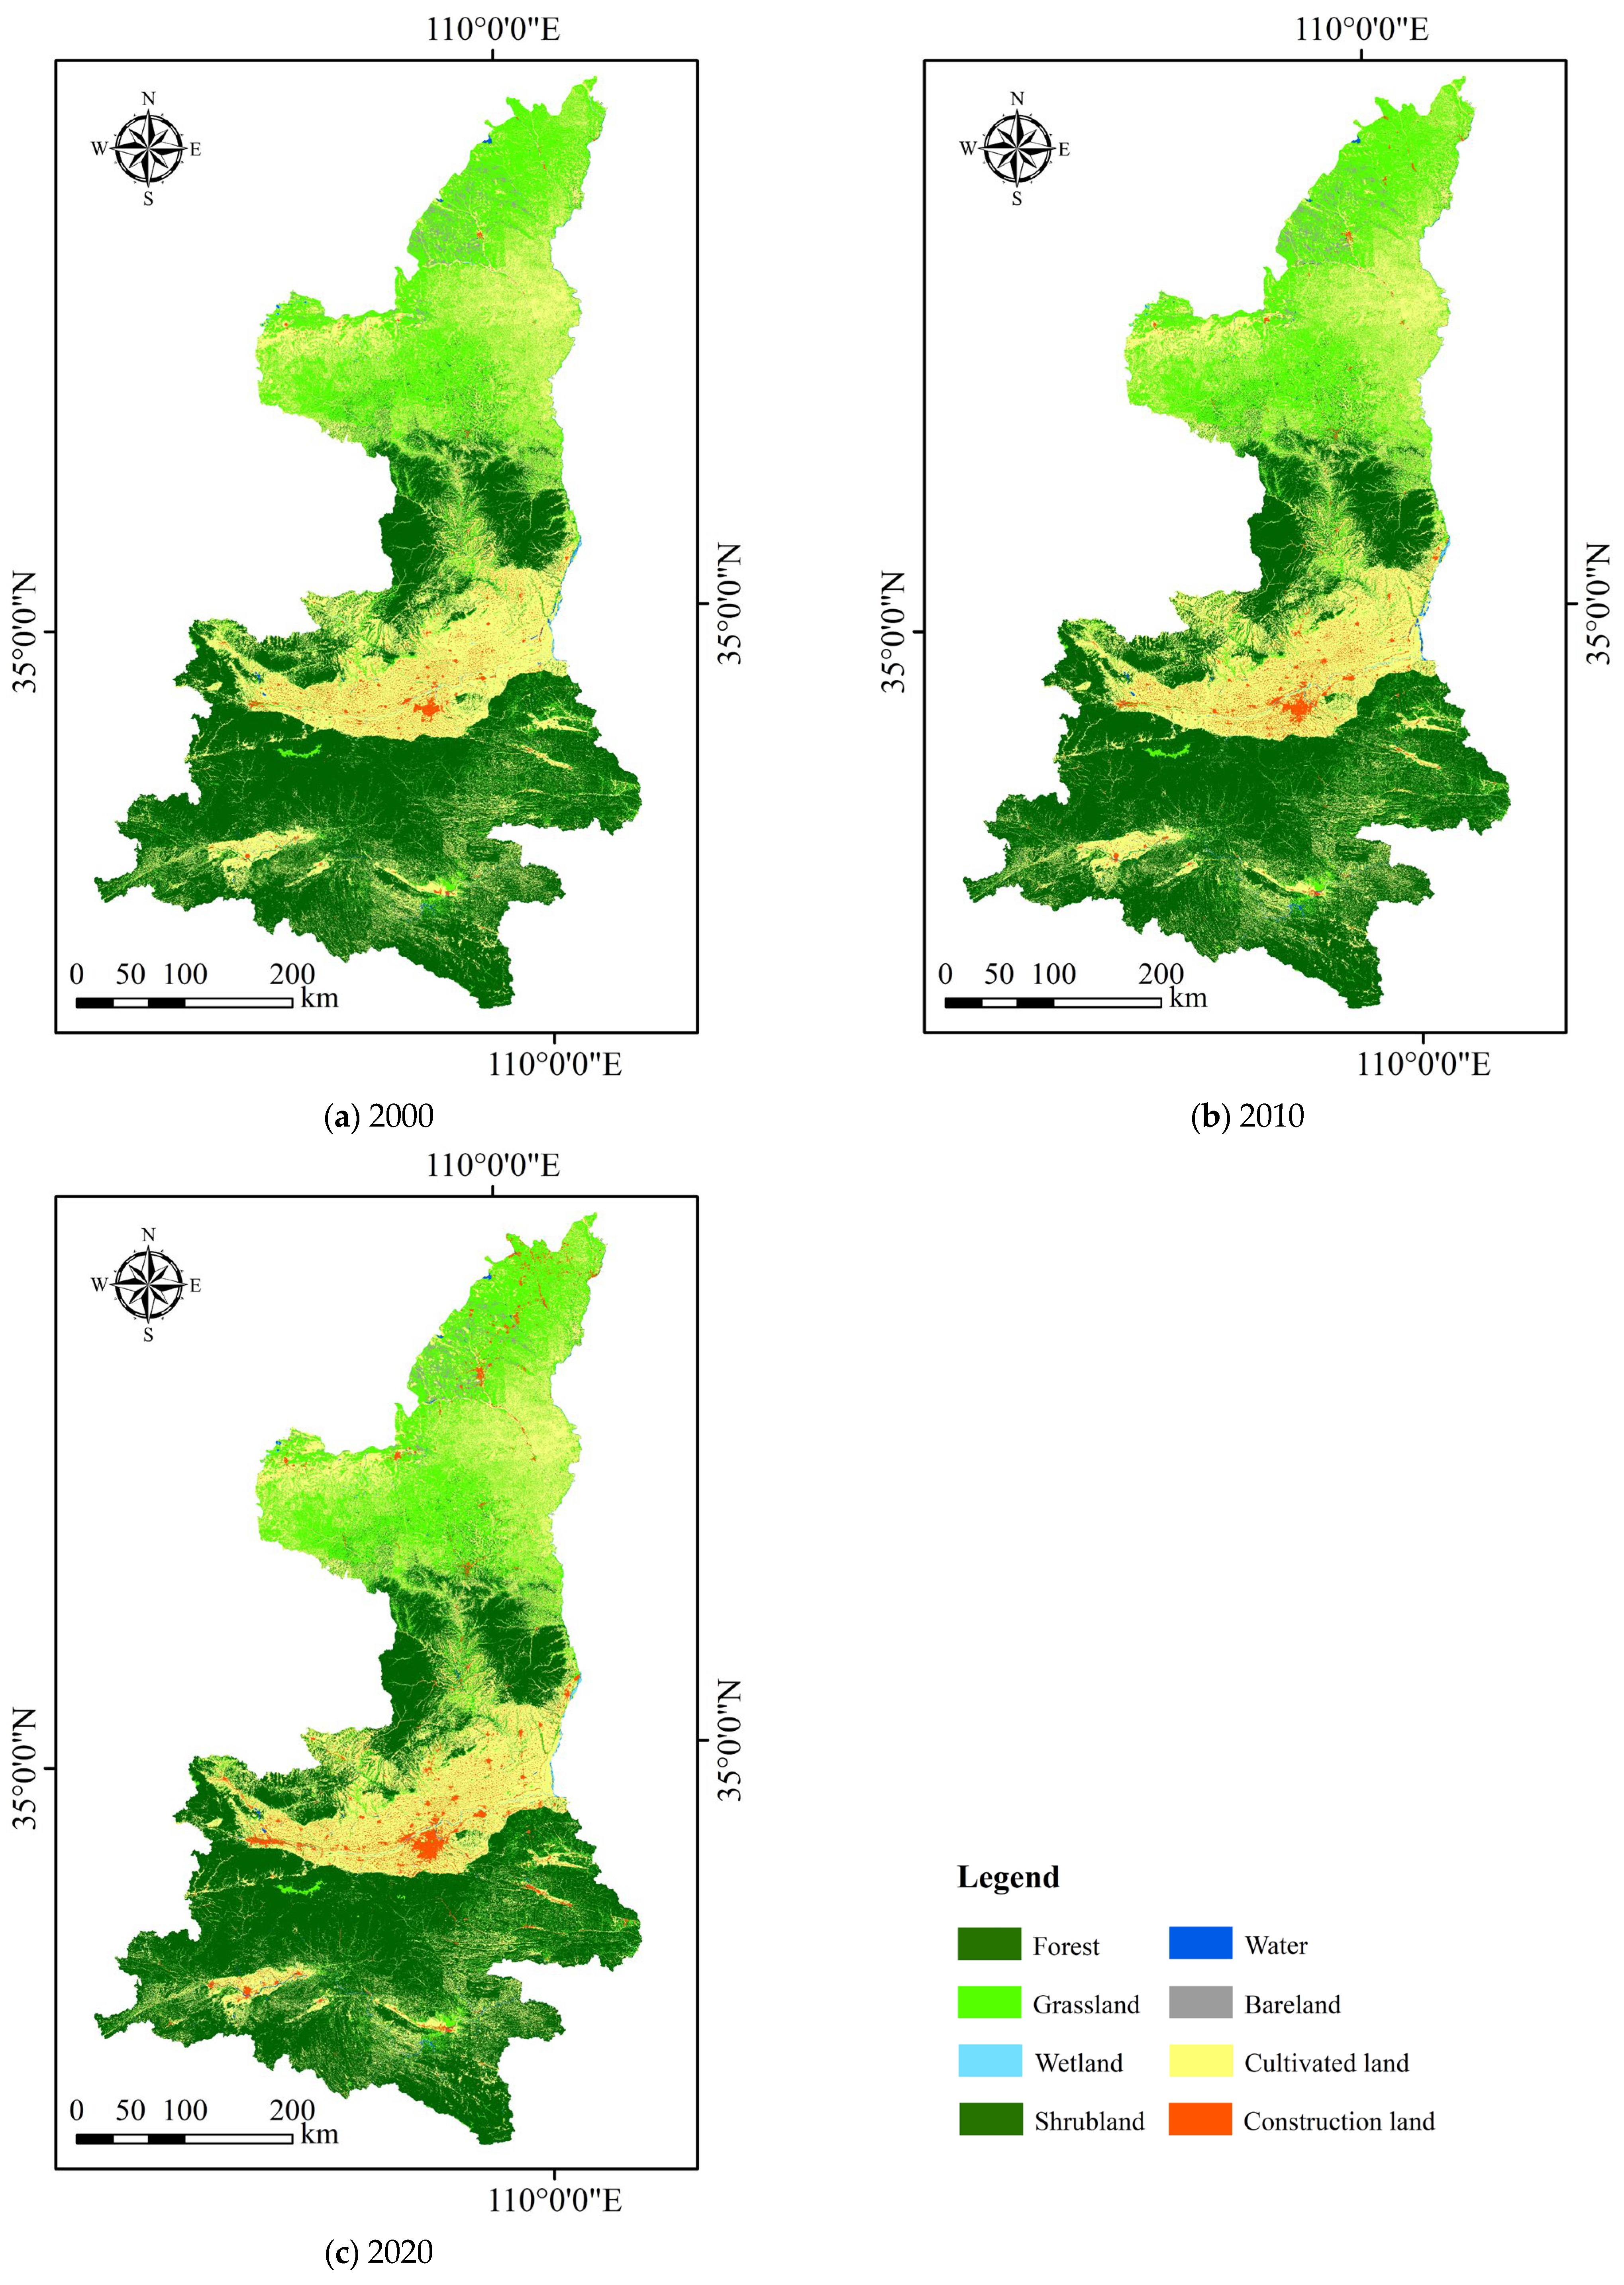
4.1. Spatiotemporal Analysis of Land-Use Change
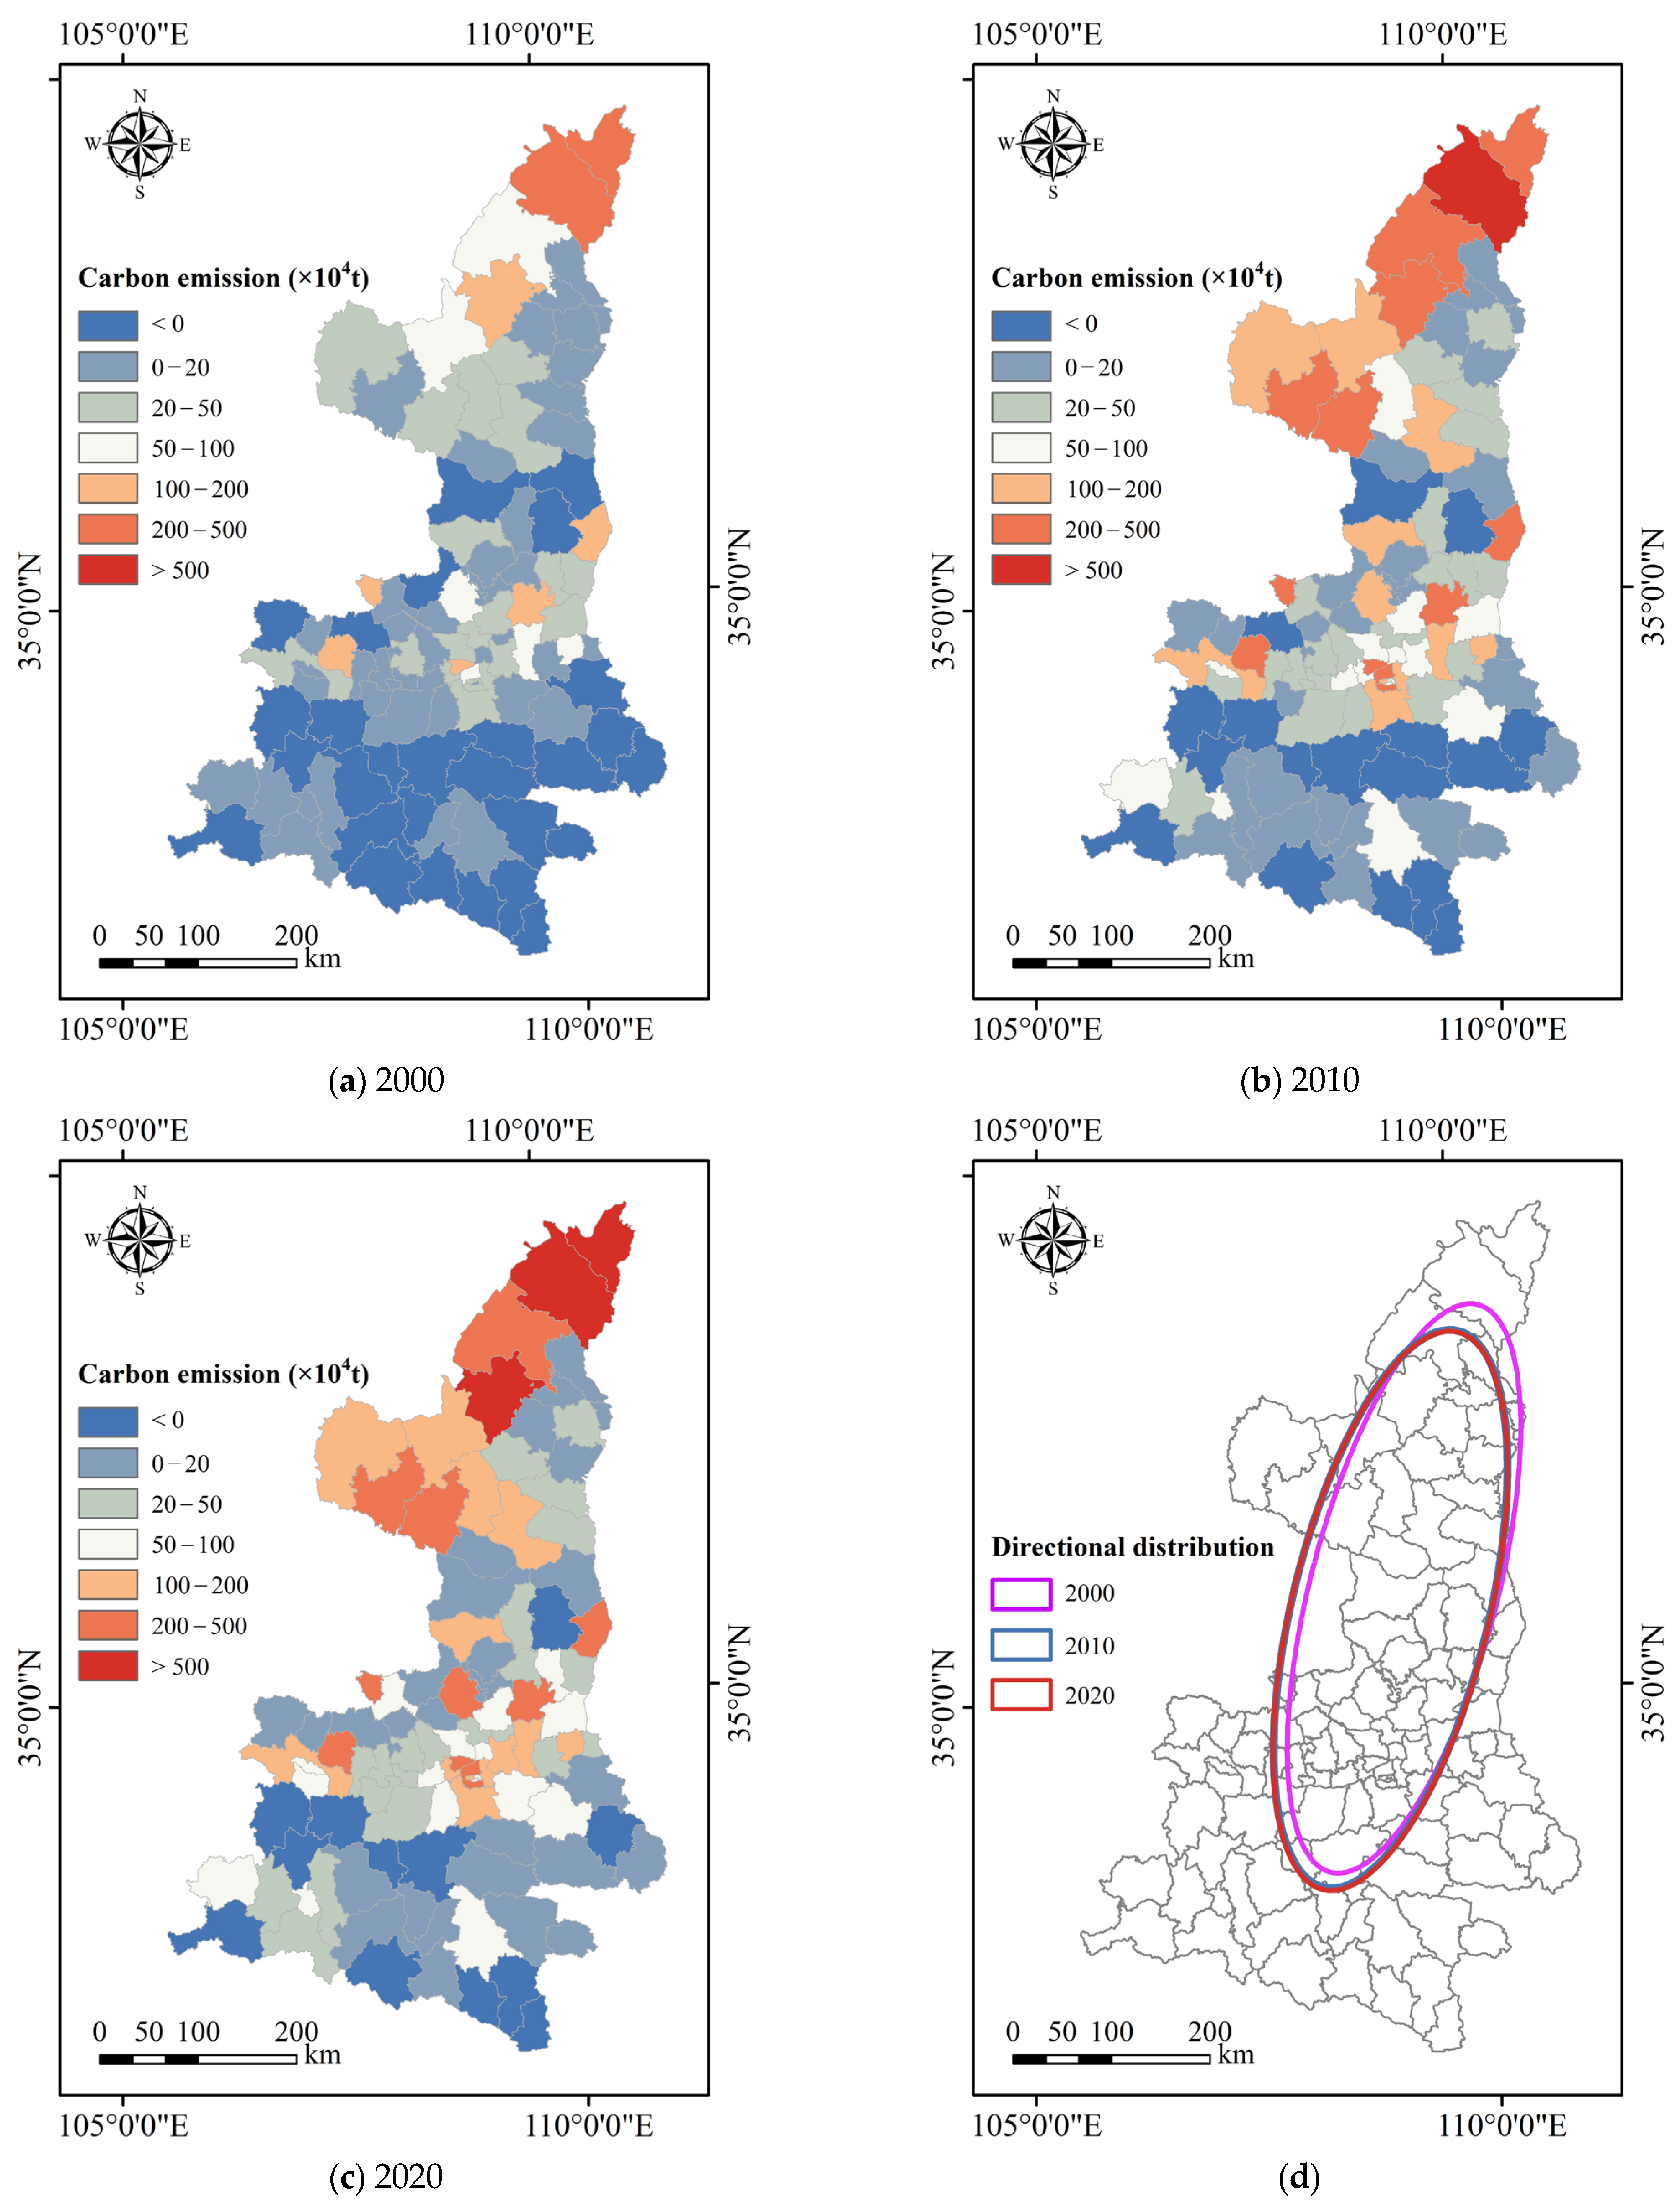
4.2. County-Level Spatiotemporal Effects Analysis of Land-Use Carbon Emissions
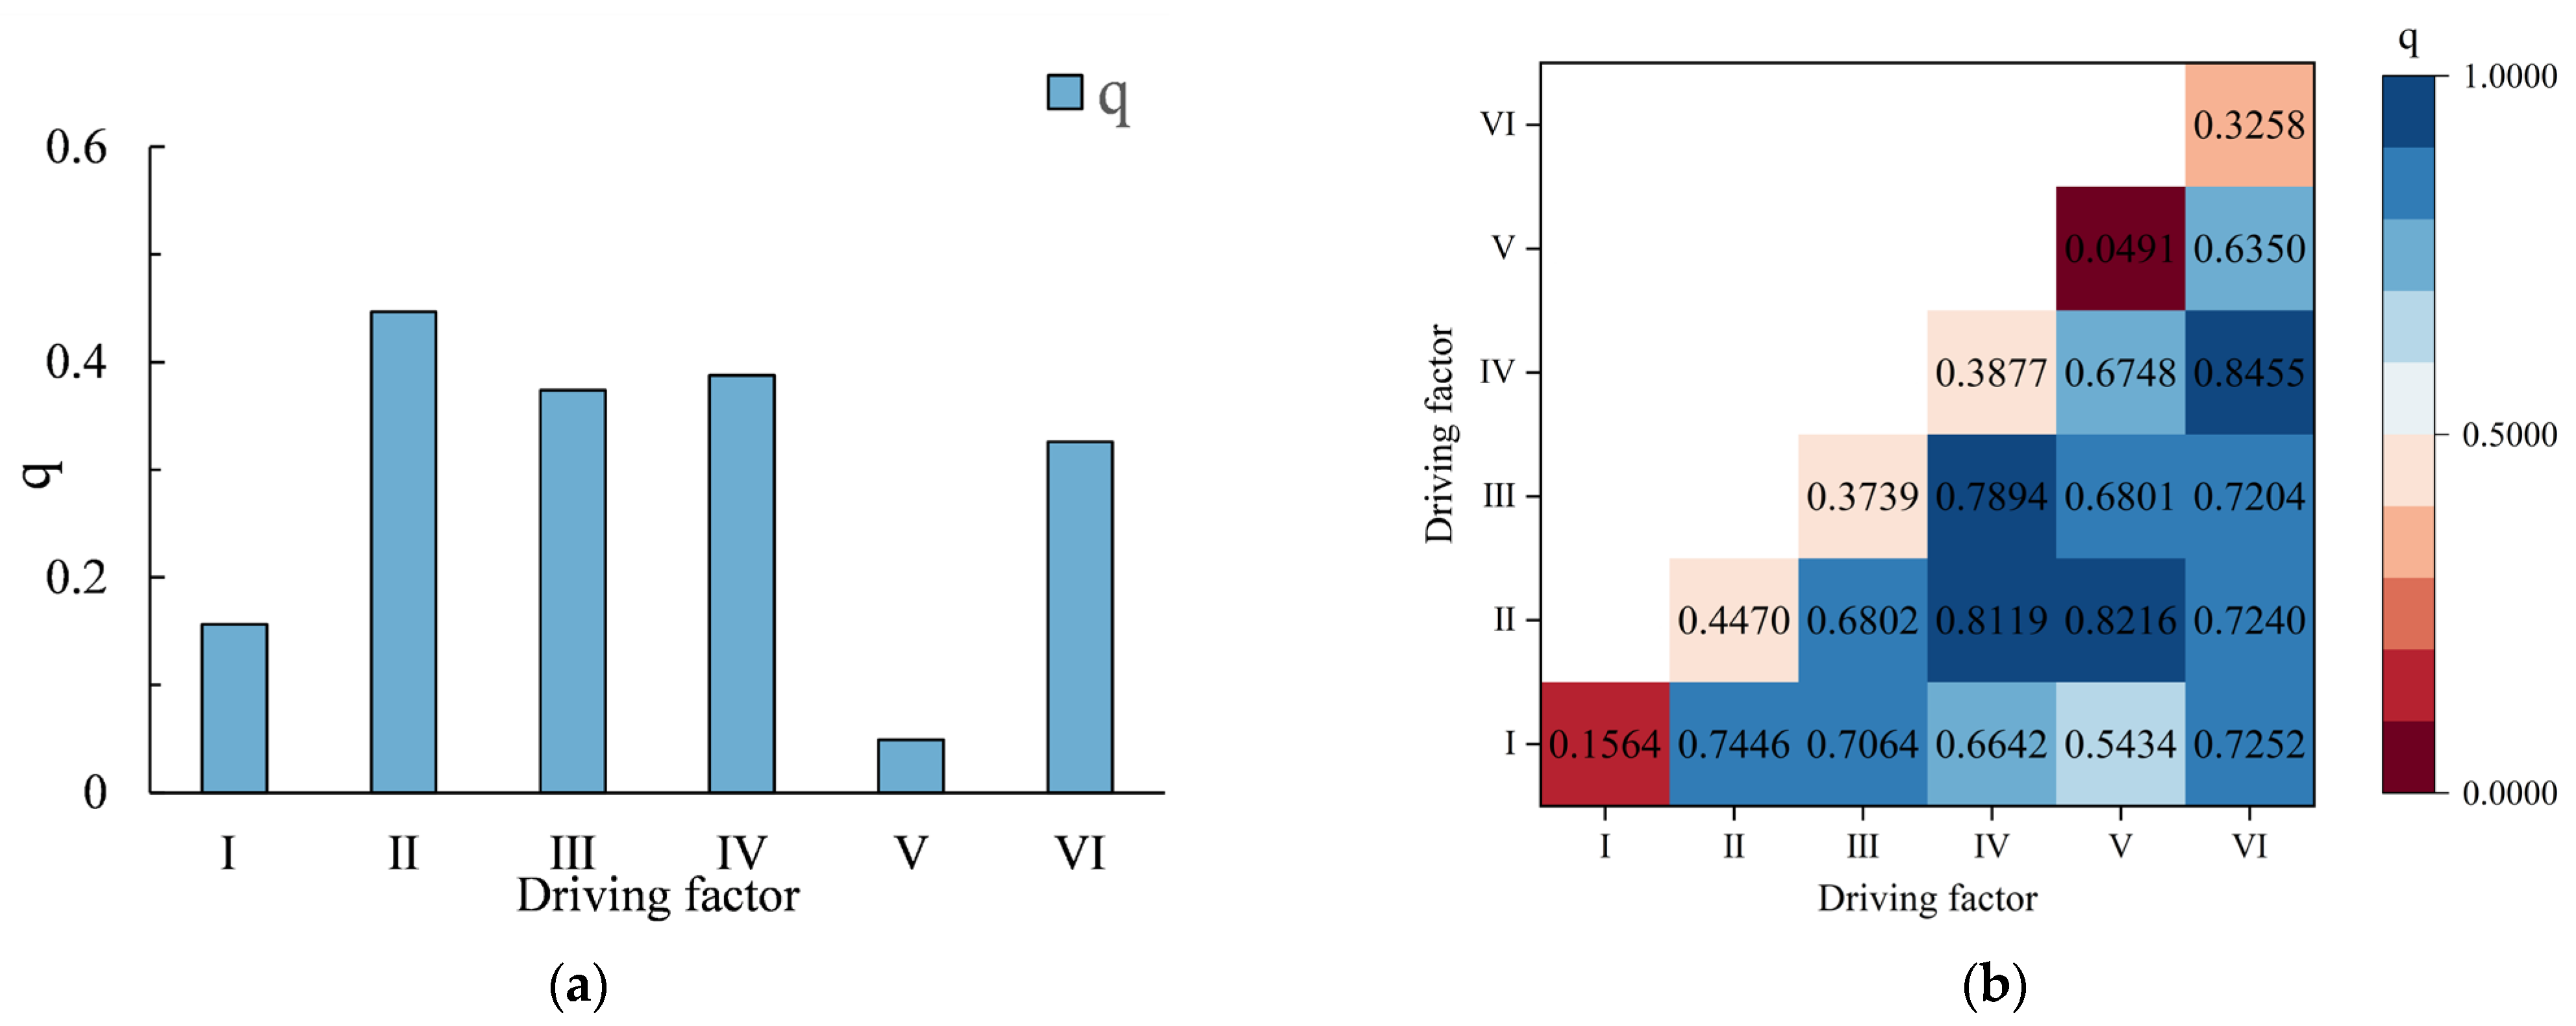
4.3. Analysis of Driving Factors for Spatial Differentiation of Carbon Emissions
5. Discussion
5.1. Optimization Strategies for Land-Use Carbon Emissions under Dual Carbon Targets
5.2. Advantages and Limitations of Research
6. Conclusions
Author Contributions
Funding
Data Availability Statement
Acknowledgments
Conflicts of Interest
References
- Hoegh-Guldberg, O.; Jacob, D.; Taylor, M.; Guillén Bolaños, T.; Bindi, M.; Brown, S.; Camilloni, I.A.; Diedhiou, A.; Djalante, R.; Ebi, K. The human imperative of stabilizing global climate change at 1.5 C. Science 2019, 365, eaaw6974. [Google Scholar] [CrossRef]
- Mora, C.; McKenzie, T.; Gaw, I.M.; Dean, J.M.; von Hammerstein, H.; Knudson, T.A.; Setter, R.O.; Smith, C.Z.; Webster, K.M.; Patz, J.A. Over half of known human pathogenic diseases can be aggravated by climate change. Nat. Clim. Chang. 2022, 12, 869–875. [Google Scholar] [CrossRef]
- Mora, C.; Spirandelli, D.; Franklin, E.C.; Lynham, J.; Kantar, M.B.; Miles, W.; Smith, C.Z.; Freel, K.; Moy, J.; Louis, L.V. Broad threat to humanity from cumulative climate hazards intensified by greenhouse gas emissions. Nat. Clim. Chang. 2018, 8, 1062–1071. [Google Scholar] [CrossRef]
- Walsh, J.E.; Ballinger, T.J.; Euskirchen, E.S.; Hanna, E.; Mård, J.; Overland, J.E.; Tangen, H.; Vihma, T. Extreme weather and climate events in northern areas: A review. Earth-Sci. Rev. 2020, 209, 103324. [Google Scholar] [CrossRef]
- Ridder, N.; Ukkola, A.; Pitman, A.; Perkins-Kirkpatrick, S. Increased occurrence of high impact compound events under climate change. npj Clim. Atmos. Sci. 2022, 5, 3. [Google Scholar] [CrossRef]
- Zhao, X.; Ma, X.; Chen, B.; Shang, Y.; Song, M. Challenges toward carbon neutrality in China: Strategies and countermeasures. Resour. Conserv. Recycl. 2022, 176, 105959. [Google Scholar] [CrossRef]
- Fekete, H.; Kuramochi, T.; Roelfsema, M.; den Elzen, M.; Forsell, N.; Höhne, N.; Luna, L.; Hans, F.; Sterl, S.; Olivier, J. A review of successful climate change mitigation policies in major emitting economies and the potential of global replication. Renew. Sustain. Energy Rev. 2021, 137, 110602. [Google Scholar] [CrossRef]
- Liu, Z.; Han, L.; Liu, M. Spatiotemporal characteristics of carbon emissions in Shaanxi, China, during 2012–2019: A machine learning method with multiple variables. Environ. Sci. Pollut. Res. 2023, 30, 87535–87548. [Google Scholar] [CrossRef]
- Khan, I.; Lei, H.; Muhammad, I.; Khan, A.; Lei, M. Do changes in land use, water bodies, and grazing pastures have a detrimental influence on environmental quality? Opportunities and threats to long-term growth. J. Environ. Manag. 2023, 325, 116609. [Google Scholar] [CrossRef]
- Sun, Y.; Wu, Y.; Yu, H.; Li, Y. County-level urban forms and their correlation with local governance in Jiande, China: Evidence from historical records. J. Asian Archit. Build. Eng. 2024, 1–14. [Google Scholar] [CrossRef]
- Wang, L. Assessment of land use change and carbon emission: A Log Mean Divisa (LMDI) approach. Heliyon 2024, 10, e25669. [Google Scholar] [CrossRef]
- Kang, J.; Zhang, B.; Dang, A. A novel geospatial machine learning approach to quantify non-linear effects of land use/land cover change (LULCC) on carbon dynamics. Int. J. Appl. Earth Obs. Geoinf. 2024, 128, 103712. [Google Scholar] [CrossRef]
- Chen, X.; Yu, L.; Hou, S.; Liu, T.; Li, X.; Li, Y.; Du, Z.; Li, C.; Wu, H.; Gao, G. Unraveling carbon stock dynamics and their determinants in China’s Loess Plateau over the past 40 years. Ecol. Indic. 2024, 159, 111760. [Google Scholar] [CrossRef]
- Padilla, F.M.; Vidal, B.; Sánchez, J.; Pugnaire, F.I. Land-use changes and carbon sequestration through the twentieth century in a Mediterranean mountain ecosystem: Implications for land management. J. Environ. Manag. 2010, 91, 2688–2695. [Google Scholar] [CrossRef]
- Zhang, X.; Fan, H.; Hou, H.; Xu, C.; Sun, L.; Li, Q.; Ren, J. Spatiotemporal evolution and multi-scale coupling effects of land-use carbon emissions and ecological environmental quality. Sci. Total Environ. 2024, 922, 171149. [Google Scholar] [CrossRef]
- Liu, G.; Cui, F.; Wang, Y. Spatial effects of urbanization, ecological construction and their interaction on land use carbon emissions/absorption: Evidence from China. Ecol. Indic. 2024, 160, 111817. [Google Scholar] [CrossRef]
- Zhang, C.-y.; Zhao, L.; Zhang, H.; Chen, M.-n.; Fang, R.-y.; Yao, Y.; Zhang, Q.-P.; Wang, Q. Spatial-temporal characteristics of carbon emissions from land use change in Yellow River Delta region, China. Ecol. Indic. 2022, 136, 108623. [Google Scholar] [CrossRef]
- Hunter, M.L.; Clark, L.; Frei, R.J.; Strachan, I.B.; Roulet, N.T.; Strack, M. Carbon Emissions from Active Horticulture Peat Extraction Sites in Canada: Five Years of Field-based Measurements. In Proceedings of the Copernicus Meetings, Vienna, Austria & Online, 14–19 April 2024. [Google Scholar]
- Li, S.; Yao, L.; Zhang, Y.; Zhao, Y.; Sun, L. China’s Provincial Carbon Emission Driving Factors Analysis and Scenario Forecasting. Environ. Sustain. Indic. 2024, 22, 100390. [Google Scholar] [CrossRef]
- Lawrence, P.J.; Lawrence, D.M.; Hurtt, G.C. Attributing the carbon cycle impacts of CMIP5 historical and future land use and land cover change in the Community Earth System Model (CESM1). J. Geophys. Res. Biogeosci. 2018, 123, 1732–1755. [Google Scholar] [CrossRef]
- Bovensmann, H.; Buchwitz, M.; Burrows, J.; Reuter, M.; Krings, T.; Gerilowski, K.; Schneising, O.; Heymann, J.; Tretner, A.; Erzinger, J. A remote sensing technique for global monitoring of power plant CO2 emissions from space and related applications. Atmos. Meas. Tech. 2010, 3, 781–811. [Google Scholar] [CrossRef]
- Tang, X.; Zhao, X.; Bai, Y.; Tang, Z.; Wang, W.; Zhao, Y.; Wan, H.; Xie, Z.; Shi, X.; Wu, B. Carbon pools in China’s terrestrial ecosystems: New estimates based on an intensive field survey. Proc. Natl. Acad. Sci. USA 2018, 115, 4021–4026. [Google Scholar] [CrossRef]
- Jiang, Y.; Zhao, R.; Qin, G. How does digital finance reduce carbon emissions intensity? Evidence from chain mediation effect of production technology innovation and green technology innovation. Heliyon 2024, 10, e30155. [Google Scholar] [CrossRef]
- Liu, C.; Hu, S.; Wu, S.; Song, J.; Li, H. County-Level Land Use Carbon Emissions in China: Spatiotemporal Patterns and Impact Factors. Sustain. Cities Soc. 2024, 105, 105304. [Google Scholar] [CrossRef]
- Duman, Z.; Mao, X.; Cai, B.; Zhang, Q.; Chen, Y.; Gao, Y.; Guo, Z. Exploring the spatiotemporal pattern evolution of carbon emissions and air pollution in Chinese cities. J. Environ. Manag. 2023, 345, 118870. [Google Scholar] [CrossRef]
- Van Vuuren, D.P.; Stehfest, E.; Gernaat, D.E.; Doelman, J.C.; Van den Berg, M.; Harmsen, M.; de Boer, H.S.; Bouwman, L.F.; Daioglou, V.; Edelenbosch, O.Y. Energy, land-use and greenhouse gas emissions trajectories under a green growth paradigm. Glob. Environ. Chang. 2017, 42, 237–250. [Google Scholar] [CrossRef]
- Zhang, X.; Zhang, D. Urban carbon emission scenario prediction and multi-objective land use optimization strategy under carbon emission constraints. J. Clean. Prod. 2023, 430, 139684. [Google Scholar] [CrossRef]
- Huisingh, D.; Zhang, Z.; Moore, J.C.; Qiao, Q.; Li, Q. Recent advances in carbon emissions reduction: Policies, technologies, monitoring, assessment and modeling. J. Clean. Prod. 2015, 103, 1–12. [Google Scholar] [CrossRef]
- Ding, S.; Liu, S.; Chang, M.; Lin, H.; Lv, T.; Zhang, Y.; Zeng, C. Spatial Optimization of Land Use Pattern toward Carbon Mitigation Targets—A Study in Guangzhou. Land 2023, 12, 1903. [Google Scholar] [CrossRef]
- An, Q.; Zheng, L.; Yang, M. Spatiotemporal Heterogeneities in the Impact of Chinese Digital Economy Development on Carbon Emissions. Sustainability 2024, 16, 2810. [Google Scholar] [CrossRef]
- Tang, X.; Woodcock, C.E.; Olofsson, P.; Hutyra, L.R. Spatiotemporal assessment of land use/land cover change and associated carbon emissions and uptake in the Mekong River Basin. Remote Sens. Environ. 2021, 256, 112336. [Google Scholar] [CrossRef]
- Qin, J.; Duan, W.; Zou, S.; Chen, Y.; Huang, W.; Rosa, L. Global energy use and carbon emissions from irrigated agriculture. Nat. Commun. 2024, 15, 3084. [Google Scholar] [CrossRef]
- Cheng, Y.; Tang, Y.; Zhou, B.; Feng, H. Spatiotemporal analysis of national carbon emission and regional carbon simulation in China. Environ. Sci. Pollut. Res. 2024, 31, 10702–10716. [Google Scholar] [CrossRef]
- Wang, Y.; Wang, W.; Chen, Y.; Wu, L. Projection of ecological water consumption under carbon emission in Chinese provinces. J. Clean. Prod. 2024, 448, 141630. [Google Scholar] [CrossRef]
- Chen, Y.; Lu, H.; Li, J.; Xia, J. Effects of land use cover change on carbon emissions and ecosystem services in Chengyu urban agglomeration, China. Stoch. Environ. Res. Risk Assess. 2020, 34, 1197–1215. [Google Scholar] [CrossRef]
- Carpio, A.; Ponce-Lopez, R.; Lozano-García, D.F. Urban form, land use, and cover change and their impact on carbon emissions in the Monterrey Metropolitan area, Mexico. Urban Clim. 2021, 39, 100947. [Google Scholar] [CrossRef]
- Rivera-Niquepa, J.D.; Rojas-Lozano, D.; De Oliveira-De Jesus, P.M.; Yusta, J.M. Methodology for selecting assessment periods of Logarithmic Mean Divisia Index decomposition techniques. Energy Strategy Rev. 2023, 50, 101241. [Google Scholar] [CrossRef]
- Aziz, S.; Chowdhury, S.A. Analysis of agricultural greenhouse gas emissions using the STIRPAT model: A case study of Bangladesh. Environ. Dev. Sustain. 2023, 25, 3945–3965. [Google Scholar] [CrossRef]
- Rehman, E.; Rehman, S. Modeling the nexus between carbon emissions, urbanization, population growth, energy consumption, and economic development in Asia: Evidence from grey relational analysis. Energy Rep. 2022, 8, 5430–5442. [Google Scholar] [CrossRef]
- Liang, Y.; Xu, C. Knowledge diffusion of Geodetector: A perspective of the literature review and Geotree. Heliyon 2023, 9, e19651. [Google Scholar] [CrossRef] [PubMed]
- Rahman, M.M.; Szabó, G. Multi-objective urban land use optimization using spatial data: A systematic review. Sustain. Cities Soc. 2021, 74, 103214. [Google Scholar] [CrossRef]
- Kongsager, R. Linking climate change adaptation and mitigation: A review with evidence from the land-use sectors. Land 2018, 7, 158. [Google Scholar] [CrossRef]
- Zhang, K.; Wang, S.; Bao, H.; Zhao, X. Characteristics and influencing factors of rainfall-induced landslide and debris flow hazards in Shaanxi Province, China. Nat. Hazards Earth Syst. Sci. 2019, 19, 93–105. [Google Scholar] [CrossRef]
- Tatem, A.J. WorldPop, open data for spatial demography. Sci. Data 2017, 4, 1–4. [Google Scholar] [CrossRef]
- Chen, Z.; Yu, B.; Yang, C.; Zhou, Y.; Yao, S.; Qian, X.; Wang, C.; Wu, B.; Wu, J. An extended time series (2000–2018) of global NPP-VIIRS-like nighttime light data from a cross-sensor calibration. Earth Syst. Sci. Data 2021, 13, 889–906. [Google Scholar] [CrossRef]
- Huang, Y.; Jiang, D.; Fu, J. China km grid GDP distribution data set. Glob. Chang. Sci. Res. Data 2014, 1, 5–8. [Google Scholar]
- Oda, T.; Maksyutov, S.; Andres, R.J. The Open-source Data Inventory for Anthropogenic CO2, version 2016 (ODIAC2016): A global monthly fossil fuel CO2 gridded emissions data product for tracer transport simulations and surface flux inversions. Earth Syst. Sci. Data 2018, 10, 87–107. [Google Scholar] [CrossRef]
- Xie, X.; Deng, H.; Li, S.; Gou, Z. Optimizing Land Use for Carbon Neutrality: Integrating Photovoltaic Development in Lingbao, Henan Province. Land 2024, 13, 97. [Google Scholar] [CrossRef]
- Lamb, W.F.; Wiedmann, T.; Pongratz, J.; Andrew, R.; Crippa, M.; Olivier, J.G.; Wiedenhofer, D.; Mattioli, G.; Al Khourdajie, A.; House, J. A review of trends and drivers of greenhouse gas emissions by sector from 1990 to 2018. Environ. Res. Lett. 2021, 16, 073005. [Google Scholar] [CrossRef]
- Wu, H.; Zheng, X.; Zhou, L.; Meng, Y. Spatial autocorrelation and driving factors of carbon emission density of crop production in China. Environ. Sci. Pollut. Res. 2024, 31, 27172–27191. [Google Scholar] [CrossRef] [PubMed]
- Tian, S.; Wang, S.; Bai, X.; Luo, G.; Li, Q.; Yang, Y.; Hu, Z.; Li, C.; Deng, Y. Global patterns and changes of carbon emissions from land use during 1992–2015. Environ. Sci. Ecotechnol. 2021, 7, 100108. [Google Scholar] [CrossRef] [PubMed]
- Fang, J.; Yu, G.; Liu, L.; Hu, S.; Chapin III, F.S. Climate change, human impacts, and carbon sequestration in China. Proc. Natl. Acad. Sci. USA 2018, 115, 4015–4020. [Google Scholar] [CrossRef] [PubMed]
- Chen, H.; Zhou, S.; Wu, N.; Wang, Y.; Luo, P.; Shi, F. Advance in studies on production, oxidation and emission flux of methane from wetlands. Chin. J. Appl. Environ. Biol. 2006, 12, 726. [Google Scholar]
- Sun, H.; Liang, H.; Chang, X.; Cui, Q.; Tao, Y. Land use patterns on carbon emission and spatial association in China. Econ. Geogr. 2015, 35, 154–162. [Google Scholar]
- Lin, Q.; Zhang, L.; Qiu, B.; Zhao, Y.; Wei, C. Spatiotemporal analysis of land use patterns on carbon emissions in China. Land 2021, 10, 141. [Google Scholar] [CrossRef]
- Likas, A.; Vlassis, N.; Verbeek, J.J. The global k-means clustering algorithm. Pattern Recognit. 2003, 36, 451–461. [Google Scholar] [CrossRef]
- Ma, X.; Zhao, C.; Song, C.; Meng, D.; Xu, M.; Liu, R.; Yan, Y.; Liu, Z. The impact of regional policy implementation on the decoupling of carbon emissions and economic development. J. Environ. Manag. 2024, 355, 120472. [Google Scholar] [CrossRef]
- Bao, H.; Tao, H.; Zhuo, L.; Shi, Q.; Guo, S. Estimation of Economic Spillover Effects under the Hierarchical Structure of Urban Agglomeration Based on Time-Series Night-Time Lights: A Case Study of the Pearl River Delta, China. Remote Sens. 2024, 16, 394. [Google Scholar] [CrossRef]
- Huang, S.; Yu, L.; Cai, D.; Zhu, J.; Liu, Z.; Zhang, Z.; Nie, Y.; Fraedrich, K. Driving mechanisms of urbanization: Evidence from geographical, climatic, social-economic and nighttime light data. Ecol. Indic. 2023, 148, 110046. [Google Scholar] [CrossRef]
- Liang, L.; Liang, S.; Zeng, Z. Extreme climate sparks record boreal wildfires and carbon surge in 2023. Innovation 2024, 100631. [Google Scholar] [CrossRef]
- Cao, X.; Wang, H.; Zhang, B.; Liu, J.; Yang, J. Sustainable Management of Land Use Patterns and Water Allocation for Coordinated Multidimensional Development. J. Clean. Prod. 2024, 142412. [Google Scholar] [CrossRef]
- Zhao, C.; Liu, Y.; Yan, Z. Effects of land-use change on carbon emission and its driving factors in Shaanxi Province from 2000 to 2020. Environ. Sci. Pollut. Res. 2023, 30, 68313–68326. [Google Scholar] [CrossRef]
- Fang, W.; Luo, P.; Luo, L.; Zha, X.; Nover, D. Spatiotemporal characteristics and influencing factors of carbon emissions from land-use change in Shaanxi Province, China. Environ. Sci. Pollut. Res. 2023, 30, 123480–123496. [Google Scholar] [CrossRef]
- Cai, B.; Wang, X.; Huang, G.; Wang, J.; Cao, D.; Baetz, B.W.; Liu, L.; Zhang, H.; Fenech, A.; Liu, Z. Spatiotemporal changes of China’s carbon emissions. Geophys. Res. Lett. 2018, 45, 8536–8546. [Google Scholar] [CrossRef]
- Balta-Ozkan, N.; Watson, T.; Mocca, E. Spatially uneven development and low carbon transitions:Insights from urban and regional planning. Energy Policy 2015, 47, 500–510. [Google Scholar] [CrossRef]


| Data Type | Year | Resolution (m) | Download Link |
|---|---|---|---|
| GlobeLand30 | 2000, 2010, 2020 | 30 | http://www.globallandcover.com (accessed on 2 August 2023) |
| Woldpop | 2000, 2010, 2020 | 100 | https://www.worldpop.org.uk (accessed on 10 October 2023) |
| NPP-VIIRS-like NTL data | 2000, 2010, 2020 | 500 | http://nnu.geodata.cn/data (accessed on 12 October 2023) |
| MOD13Q1 | 2000, 2010, 2020 | 250 | https://ladsweb.modaps.eosdis.nasa.gov/search (accessed on 15 October 2023) |
| 1 km grid GDP data of China | 2000, 2010, 2020 | 1000 | https://www.resdc.cn/ (accessed on 20 October 2023) |
| ODIAC | 2000, 2010, 2020 | 1000 | https://db.cger.nies.go.jp (accessed on 24 October 2023) |
| Administrative boundary | 2020 | \ | http://www.dsac.cn/ (accessed on 10 August 2023) |
| Land Use Type | Carbon Emission Coefficients (kg·m−2·a−1) |
|---|---|
| Cultivated land | 0.0422 [17] |
| Forest | −0.0644 [17] |
| Grassland | −0.0022 [17] |
| Shrubland | −0.02300 [52] |
| Wetland | −0.000006132 [53] |
| Water | −0.0253 [54] |
| Bareland | −0.0005 [55] |
| Year | Cultivated Land | Forest | Grassland | Shrubland | Wetland | Water | Construction Land | Bareland |
|---|---|---|---|---|---|---|---|---|
| 2000 | 64,148.62 | 91,486.90 | 44,172.23 | 458.97 | 247.33 | 759.57 | 3338.24 | 1453.15 |
| 2010 | 63,141.59 | 91,790.55 | 43,416.98 | 763.23 | 209.79 | 789.04 | 4486.25 | 1467.58 |
| 2020 | 62,580.83 | 91,566.22 | 42,182.08 | 731.14 | 196.73 | 844.08 | 6597.07 | 1366.86 |
| 2020 | Cultivated Land | Forest | Grassland | Shrubland | Wetland | Water | Construction Land | Bareland | |
|---|---|---|---|---|---|---|---|---|---|
| 2000 | |||||||||
| Cultivated land | 54,878.04 | 2512.98 | 3253.37 | 84.41 | 32.26 | 188.73 | 3168.40 | 26.42 | |
| Forest | 2453.69 | 85,852.26 | 2837.83 | 114.77 | 4.02 | 124.43 | 80.11 | 5.56 | |
| Grassland | 4086.25 | 3108.97 | 35,259.45 | 435.71 | 20.62 | 99.71 | 725.79 | 428.01 | |
| Shrubland | 57.60 | 21.12 | 283.99 | 86.84 | 0.14 | 2.32 | 4.82 | 1.95 | |
| Wetland | 75.56 | 3.58 | 27.12 | 0.45 | 83.72 | 44.74 | 4.48 | 6.76 | |
| Water | 180.90 | 37.36 | 75.91 | 3.85 | 54.30 | 373.20 | 21.19 | 7.78 | |
| Construction land | 749.35 | 9.50 | 25.96 | 0.63 | 0.08 | 6.10 | 2546.32 | 0.29 | |
| Bareland | 95.62 | 3.00 | 413.27 | 4.30 | 0.03 | 0.57 | 45.70 | 889.85 | |
| Year | Carbon Source | Carbon Sink | Total Carbon Emissions | ||||||
|---|---|---|---|---|---|---|---|---|---|
| Cultivated Land | Construction Land | Forest | Grassland | Shrubland | Wetland | Water | Bareland | ||
| 2000 | 270.6975 | 2982.3491 | −589.1127 | −9.7170 | −1.0554 | −0.0002 | −1.9140 | −0.0726 | 2651.1747 |
| 2010 | 266.4473 | 8173.5850 | −591.0677 | −9.5509 | −1.7551 | −0.0001 | −1.9889 | −0.0734 | 7835.5962 |
| 2020 | 264.0798 | 10,425.9585 | −589.6232 | −9.2792 | −1.6813 | −0.0001 | −2.1289 | −0.0683 | 10,087.2573 |
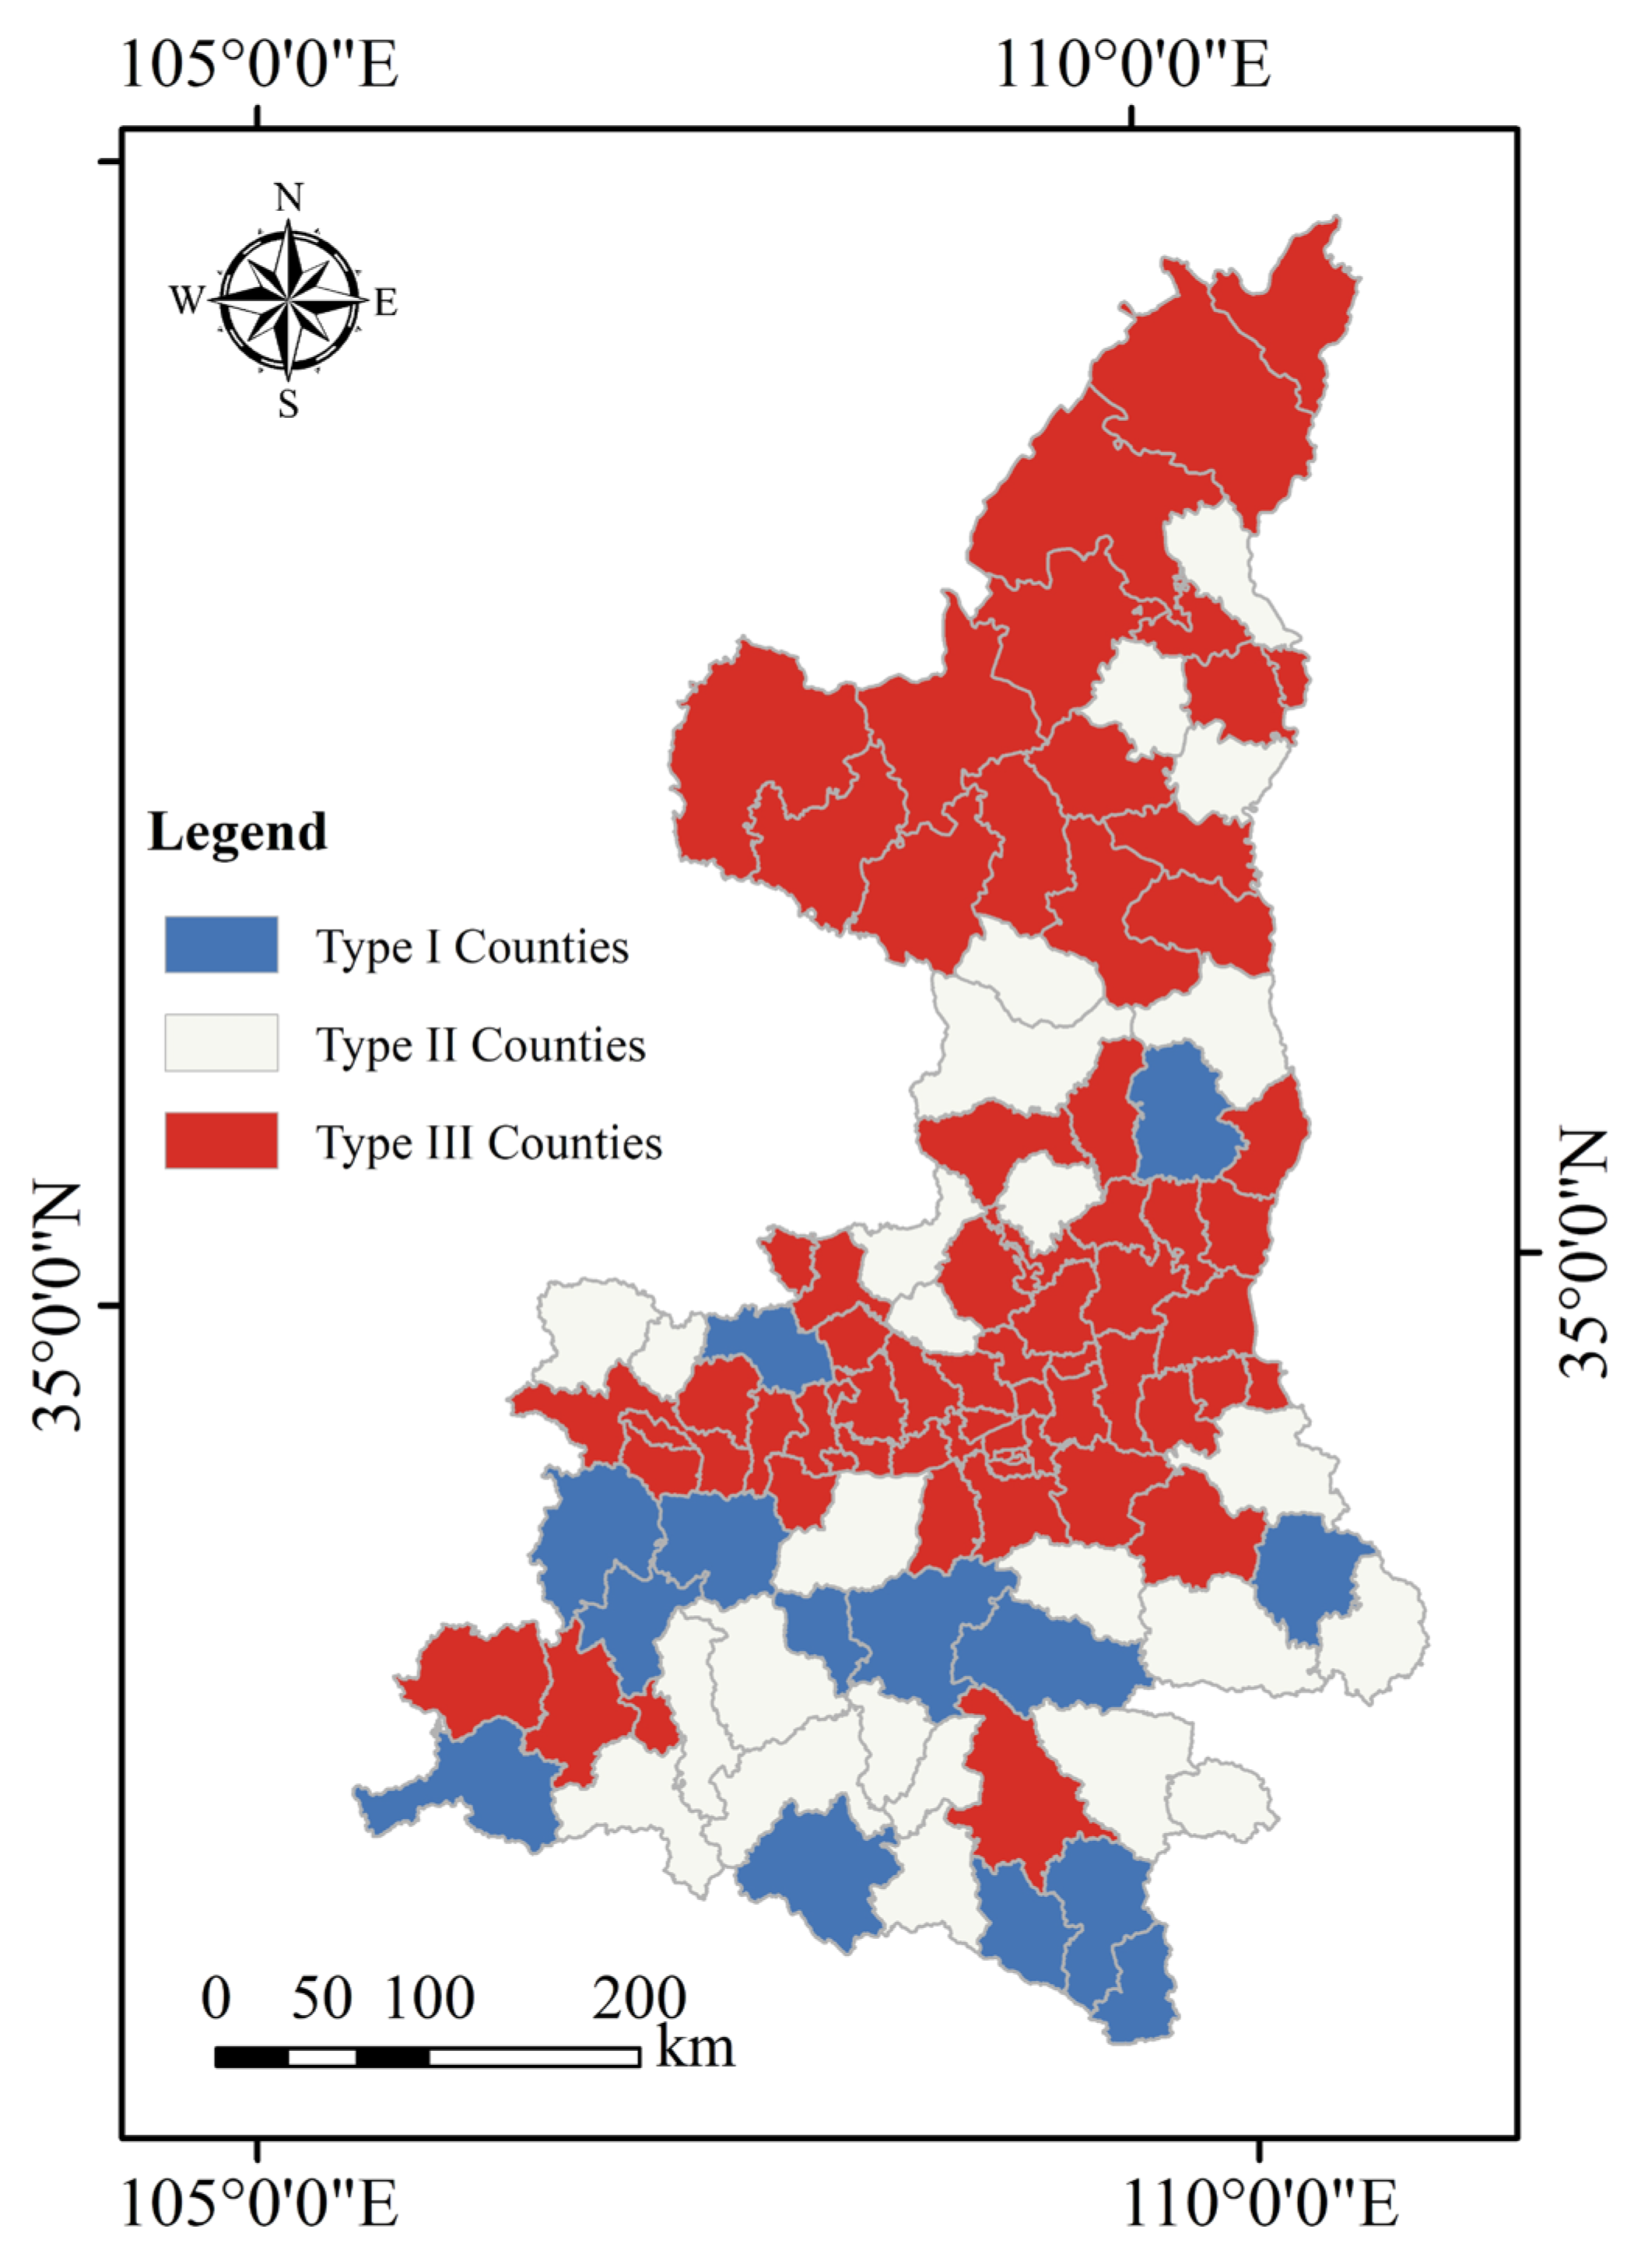
| Emission Type | Number | Proportion (%) | County Name |
|---|---|---|---|
| Low-carbon emission (Type I) | 14 | 13.08 | Danfeng County, Feng County, Foping County, Huanglong County, Langao County, Liuba County, Linyou County, Ningshan County, Ningqiang County, Pingli County, Taibai County, Zhen’an County, Zhenba County, Zhenping County. |
| Medium-carbon emission (Type II) | 25 | 23.37 | Baihe County, Chenggu County, Chunhua County, Fufeng County, Ganquan County, Hanyin County, Long County, Luonan County, Qianyang County, Shiquan County, Shanyang County, Xixiang County, Xunyi County, etc. |
| High-carbon emission (Type III) | 68 | 63.55 | Baishui County, Baota District, Beilin District, Binzhou City, Chang’an District, Changwu County, Chengcheng County, Chencang District, Jingbian County, Fugu County, Hengshan County, Shenmu County, etc. |
| Emission Type | Optimization Strategies |
|---|---|
| Low-carbon emission (Type I) | Enforce rigorous regulations to safeguard ecological land use, preventing the transformation of carbon sink land into non-carbon sink land. Optimize land management systems to sustain and enhance the carbon sequestration capabilities of currently established carbon sink zones. Improve carbon sink trading mechanisms to encourage and promote the expansion of the carbon sink industry. |
| Medium-carbon emission (Type II) | Optimize the industrial structure to direct industrial layouts toward green and low-carbon transitions. Plan and implement ecological corridors to enhance the integrity and connectivity of existing carbon sink areas. Enhance land-use efficiency, fostering conservation-oriented and intensive land utilization. |
| High-carbon emission (Type III) | Encourage the development and utilization of green energy to build a low-carbon and efficient energy supply system. Promote the conversion of some non-carbon sink lands into carbon sink lands, optimizing the regional ecological spatial structure. Implement stringent carbon emission standards and establish a comprehensive reward-penalty system for carbon emissions. |
Disclaimer/Publisher’s Note: The statements, opinions and data contained in all publications are solely those of the individual author(s) and contributor(s) and not of MDPI and/or the editor(s). MDPI and/or the editor(s) disclaim responsibility for any injury to people or property resulting from any ideas, methods, instructions or products referred to in the content. |
© 2024 by the authors. Licensee MDPI, Basel, Switzerland. This article is an open access article distributed under the terms and conditions of the Creative Commons Attribution (CC BY) license (https://creativecommons.org/licenses/by/4.0/).
Share and Cite
Zhang, Y.; Li, J.; Liu, S.; Zhou, J. Spatiotemporal Effects and Optimization Strategies of Land-Use Carbon Emissions at the County Scale: A Case Study of Shaanxi Province, China. Sustainability 2024, 16, 4104. https://doi.org/10.3390/su16104104
Zhang Y, Li J, Liu S, Zhou J. Spatiotemporal Effects and Optimization Strategies of Land-Use Carbon Emissions at the County Scale: A Case Study of Shaanxi Province, China. Sustainability. 2024; 16(10):4104. https://doi.org/10.3390/su16104104
Chicago/Turabian StyleZhang, Yahui, Jianfeng Li, Siqi Liu, and Jizhe Zhou. 2024. "Spatiotemporal Effects and Optimization Strategies of Land-Use Carbon Emissions at the County Scale: A Case Study of Shaanxi Province, China" Sustainability 16, no. 10: 4104. https://doi.org/10.3390/su16104104
APA StyleZhang, Y., Li, J., Liu, S., & Zhou, J. (2024). Spatiotemporal Effects and Optimization Strategies of Land-Use Carbon Emissions at the County Scale: A Case Study of Shaanxi Province, China. Sustainability, 16(10), 4104. https://doi.org/10.3390/su16104104