Article

Unveiling Microplastic Abundance and Distribution in an Oceanic Island: Offshore Depository or Local Pollution Indicator

by
Luísa Madalena Amorim
1,*,
José Lino Costa
2,3,
Ana Cristina Costa
4,5,6,
Andrea Zita Botelho
4,5,6 and
Paulo Torres
4,5,7,8
1
Faculdade de Ciências da Universidade de Lisboa, Campo Grande, 1749-016 Lisboa, Portugal
2
Centro de Oceanografia, Faculdade de Ciências da Universidade de Lisboa, Campo Grande, 1749-016 Lisboa, Portugal
3
Departamento de Biologia Animal, Faculdade de Ciências da Universidade de Lisboa, Campo Grande, 1749-016 Lisboa, Portugal
4
Centro de Investigação em Biodiversidade e Recursos Genéticos, InBIO Laboratório Associado Pólo dos Açores, Faculdade de Ciências e Tecnologias, Universidade dos Açores, R. Mãe de Deus 13A, 9500-321 Ponta Delgada, Portugal
5
BIOPOLIS Program in Genomics, Biodiversity and Land Planning, CIBIO, Campus de Vairão, 4485-661 Vairão, Portugal
6
Faculdade de Ciências e Tecnologia, Universidade dos Açores, Rua da Mãe de Deus, 9500-321 Ponta Delgada, Portugal
7
IMAR, Universidade dos Açores, Rua Prof. Dr. Frederico Machado, 9901-862 Horta, Portugal
8
Okeanos, Centro I&D da Universidade dos Açores, Rua Prof. Frederico Machado 4, 9901-862 Horta, Portugal
*
Author to whom correspondence should be addressed.
Sustainability 2024, 16(10), 4103; https://doi.org/10.3390/su16104103
Submission received: 16 March 2024 / Revised: 29 April 2024 / Accepted: 3 May 2024 / Published: 14 May 2024
(This article belongs to the Section Pollution Prevention, Mitigation and Sustainability)

Abstract

:
Millions of tons of solid waste, mostly plastics, are annually dumped into the oceans, posing a major 21st-century environmental threat. Commercial shipping and ocean gyres exacerbate pollution on remote islands, resulting in the widespread presence of microplastics throughout the marine environment. Most of this pollution is plastics, and its fragmentation originates from microplastics (particles smaller than 5 mm). These debris are ubiquitous throughout the marine environment, dispersed among beaches, estuaries, on the water surface, and even on the seafloor. This study was carried out on São Miguel Island, Azores, where sediment samples were collected and analysed for microplastic (MP) abundance and dimension across eight areas covering the entire coastline of the island. Each area was divided into four sites along an inland–coastal gradient, from the stream to the ocean (upstream, downstream, coastal, and submerged marine sediments), following a nested design approach. In addition to this first method, 15 beaches, spread along the island’s shore, were also tested and compared. Fibres were the most common type of microplastic, with varying levels of abundance across different locations. Abundance generally increased closer to the coast, but there were occasional instances of high upstream concentrations due to heavy rains, which then accumulated near coastlines and beaches. This study revealed an important local MP source from an apparently pristine touristic region which, aligned with other recent findings, unveils an important and silent pollution issue potentially affecting oceanic islands that should be seriously addressed in future studies and raise concern for litter management and mitigation and environmental awareness actions.

1. Introduction

Marine litter is defined as any waste of anthropogenic origin intentionally discarded, lost, or placed in the environment that represents a global environmental and ecological threat, affects large bodies of water, harms wildlife and human health, and promotes greenhouse gases [1]. Its abundance and distribution depend on several factors, including its origin (maritime or terrestrial), ocean currents, wind patterns, and physiographic characteristics [2]. Nevertheless, by examining oceanographic models and through empirical observations, it is proven that these discarded residues float on the ocean surface and tend to accumulate in ocean gyres. Consequently, the coasts of oceanic islands, with the action of currents, winds, and waves, usually present high levels of this type of pollution [3] in addition to the inland waste.
Marine litter items are also responsible for affecting a wide range of economic sectors, increasing costs to cleaning budgets carried out by parties involved in maritime activities and impairing tourist activities and the fishing and shipping industries [4]. Nevertheless, there is still a limited worldwide understanding of the economic implications of marine litter for coastal communities, particularly in remote regions. Since human society is predominantly driven by economic interests, economic assessments focused on marine litter could control the entry of these items and promote environmental awareness regarding the consequences of the increasing consumption of plastics [3]. On the other hand, in these remote locations, the resources needed to tackle problems related to marine litter can strongly impact local economies, in addition to sometimes having to process quantities of waste that exceed the capacity of available landfills [5].
Plastic, a major component of marine litter, is a synthetic material produced from hydrocarbons, with a malleability that allows it to have all shapes and dimensions [6]. Its worldwide production and consumption rate prevent it from being recycled in a sustainable way [7]. This material is responsible for 80% of all marine litter found from deep-sea sediments to surface waters [8]. Also, the gradual expansion of the world’s plastic production directly affects greenhouse-gas emissions [9].
MPs are any type of plastic smaller than 5 millimetres [10], grouped into primary and secondary microplastics. Primaries are microscopic in dimension, such as clothing fibres, polyester, and acrylic fibres, which are likely to be admitted into the environment by wastewater treatment plants and industrial drainage systems [10]. Secondaries are derived from the fragmentation of large plastics due to sun exposure and mechanical erosion [10,11]. Depending on their density in relation to seawater, microplastics can remain on the surface or sink, as in the case of polyvinyl chloride (PVC). Plastics such as polyethylene and polypropylene tend to float and drift through marine currents in the open ocean [12].
MPs are ubiquitous throughout the marine environment [10], occurring on beaches, estuaries, water surfaces, and the seafloor, travelling great distances when suspended in water or remaining within sediments on the seafloor [13]. The distribution of plastic debris depends on various elements, such as winds, currents and coastal geography and human factors, such as trade routes and urban areas [14]. An expedition carried out in the Mariana Trench revealed microplastics in the stomachs of all amphipods analysed [15]. Another, performed in the Western Pacific Kuril–Kamchatka Trench, revealed that, at a depth of up to 9450 m, there were between 215 and 1596 MPs per kg in 13 sediment samples [16]. It is also important to note that the presence of MPs has been confirmed to increase water evaporation and the rate of cracking in soil [17], and they negatively affect the oceans’ carbon retention [18]. MPs have been found in marine ecosystems and they are known to bioaccumulate in various organisms [19], including humans, and cross the food chain [20,21,22,23,24].
Marine-pollution studies increased considerably over the last decade, reflecting its importance and worldwide concerns. However, there is still limited information regarding plastic quantification and distribution, particularly around oceanic islands [25].
The Azores archipelago is subjected to different ocean/atmosphere variability and ocean dynamics at diverse scales [26,27], for example, the Gulf Stream influence, seasonal variability, storms and cyclones, microclimates, and upwelling. Studies reported that beaches on several islands presented significant amounts of plastic fragments, with a maximum of 15.000 fragments per m2 [28]. The proximity of the Atlantic oceanic gyres might be responsible for high levels of litter on the coasts of oceanic islands, specifically the Azores Archipelago [29]. This trend tends to increase in the winter and spring months, due to the migration to the south of the polar-front jet [1]. Nevertheless, there is still limited knowledge about the presence and quantification of MPs in Macaronesian Archipelagos. Studies focused on the Northeast Atlantic Ocean showed that MP pollution is ubiquitous, with an average abundance of 2.46 particles per m3 [30], with polyesters (49%) and blends of polyamide or acrylic/polyester (43%), with fibres (94%) being predominant, and the average microplastic abundance is 1.15–1.45 particles per million [31]. MPs are also a significant issue in the coastal and marine environments of the Western Atlantic Ocean, with river and fishery activities as the main sources, and their impact on marine life is still poorly understood [32].
This study aims to (1) estimate the abundance, category, and dimension of MPs along the coast of São Miguel Island, following an inshore–offshore gradient from a stream to the ocean; (2) identify the categories of MPs detected; and (3) identify and discuss the differences and factors that may contribute to its distribution.

2. Materials and Methods

2.1. Study Area

This study was carried out on São Miguel Island, Azores (36–40° N, 24–32° W; Figure 1). It is the largest island of the archipelago, with a surface area of 748.82 km2, a coastline with a full extension of 1.170 km, and an estimated human population of 133,390 [33].
The climate is temperate and oceanic and regulated by the Atlantic Ocean and the Gulf Stream, resulting in milder temperatures, higher humidity, and reduced temperature extremes compared to continental climates. Rainfall is regular and increases in the winter [34]. It is frequently hit by storms characterised by strong winds and precipitation from September to March due to the migration of jet streams in the atmosphere from the southern migration of jet streams in the atmosphere from the polar front [1].
This archipelago has one of the largest Exclusive Economic Zones in the European Union, about 1,000,000 km2 in the middle of the Atlantic Ocean, and the main economic pillars are maritime activities, such as fishing and tourism [29]. It condenses a great diversity of marine species associated with a large diversity of habitats and ecosystems, such as coastal reefs, island slopes, seamounts, deep water corals, reefs, and sponge aggregations, as well as deep hydrothermal vents and abyssal plains, along with a diverse pelagic fauna [29].

2.2. Data Collection

Two distinct sampling designs were performed.
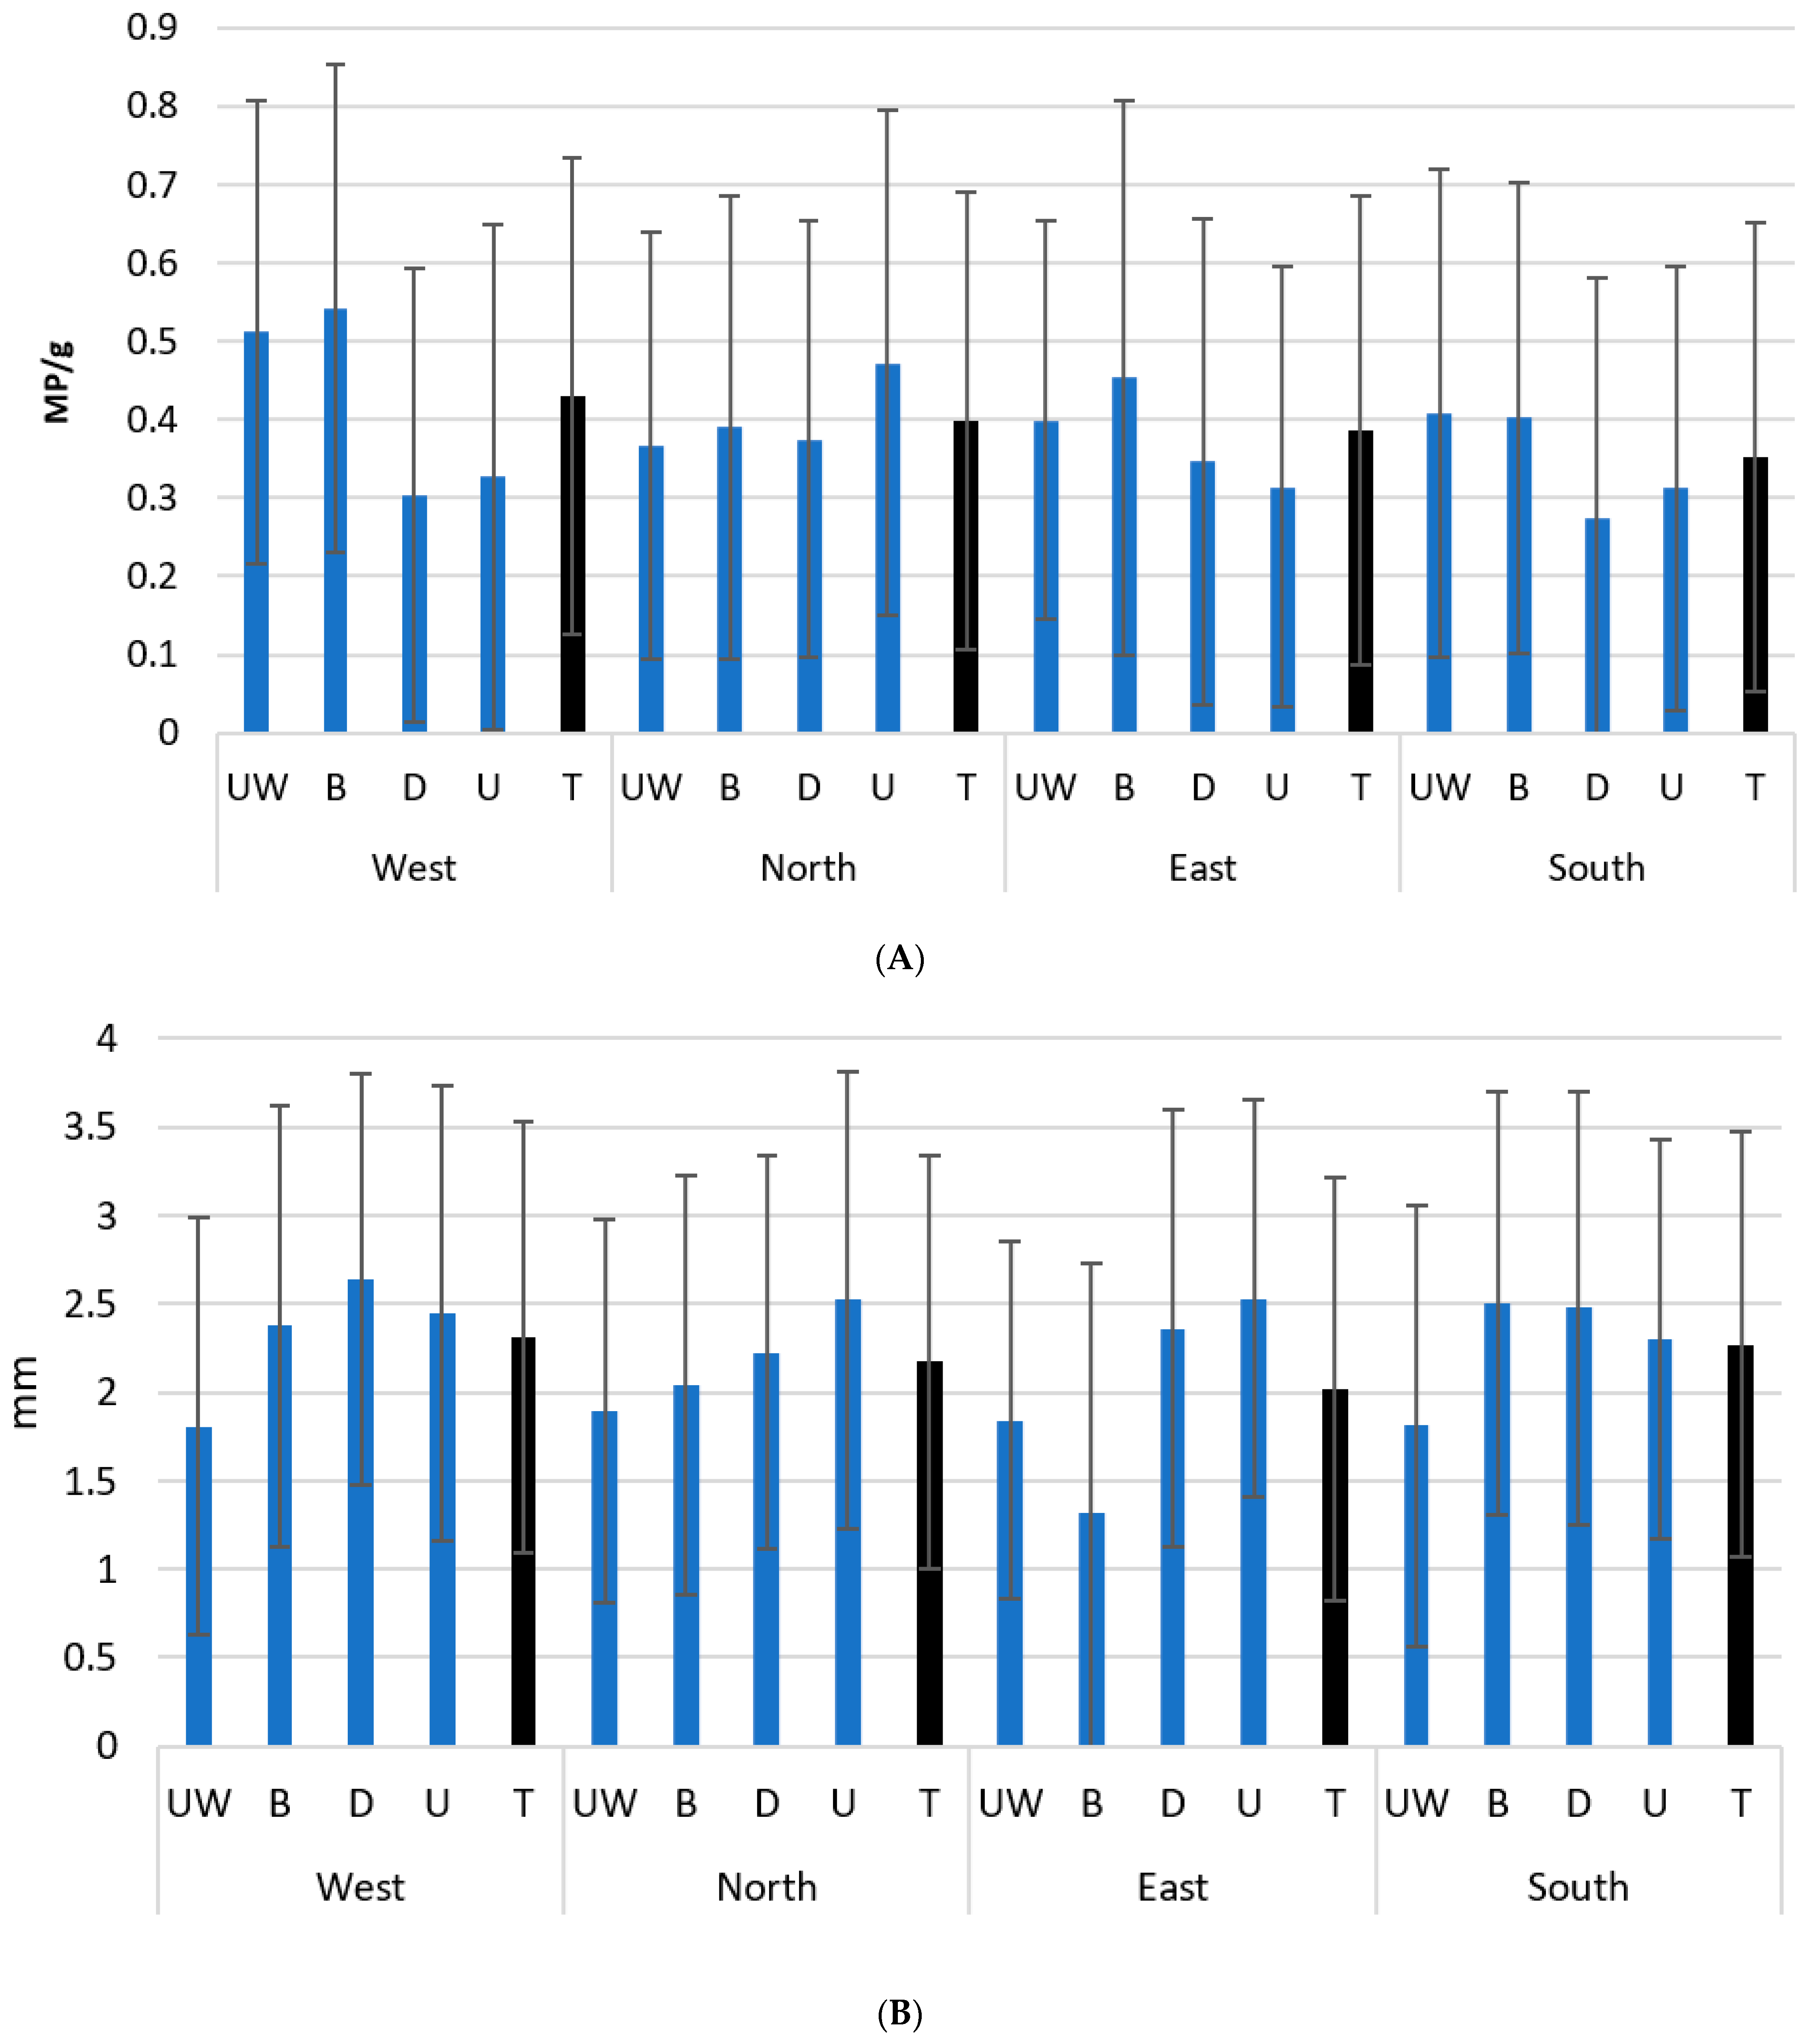
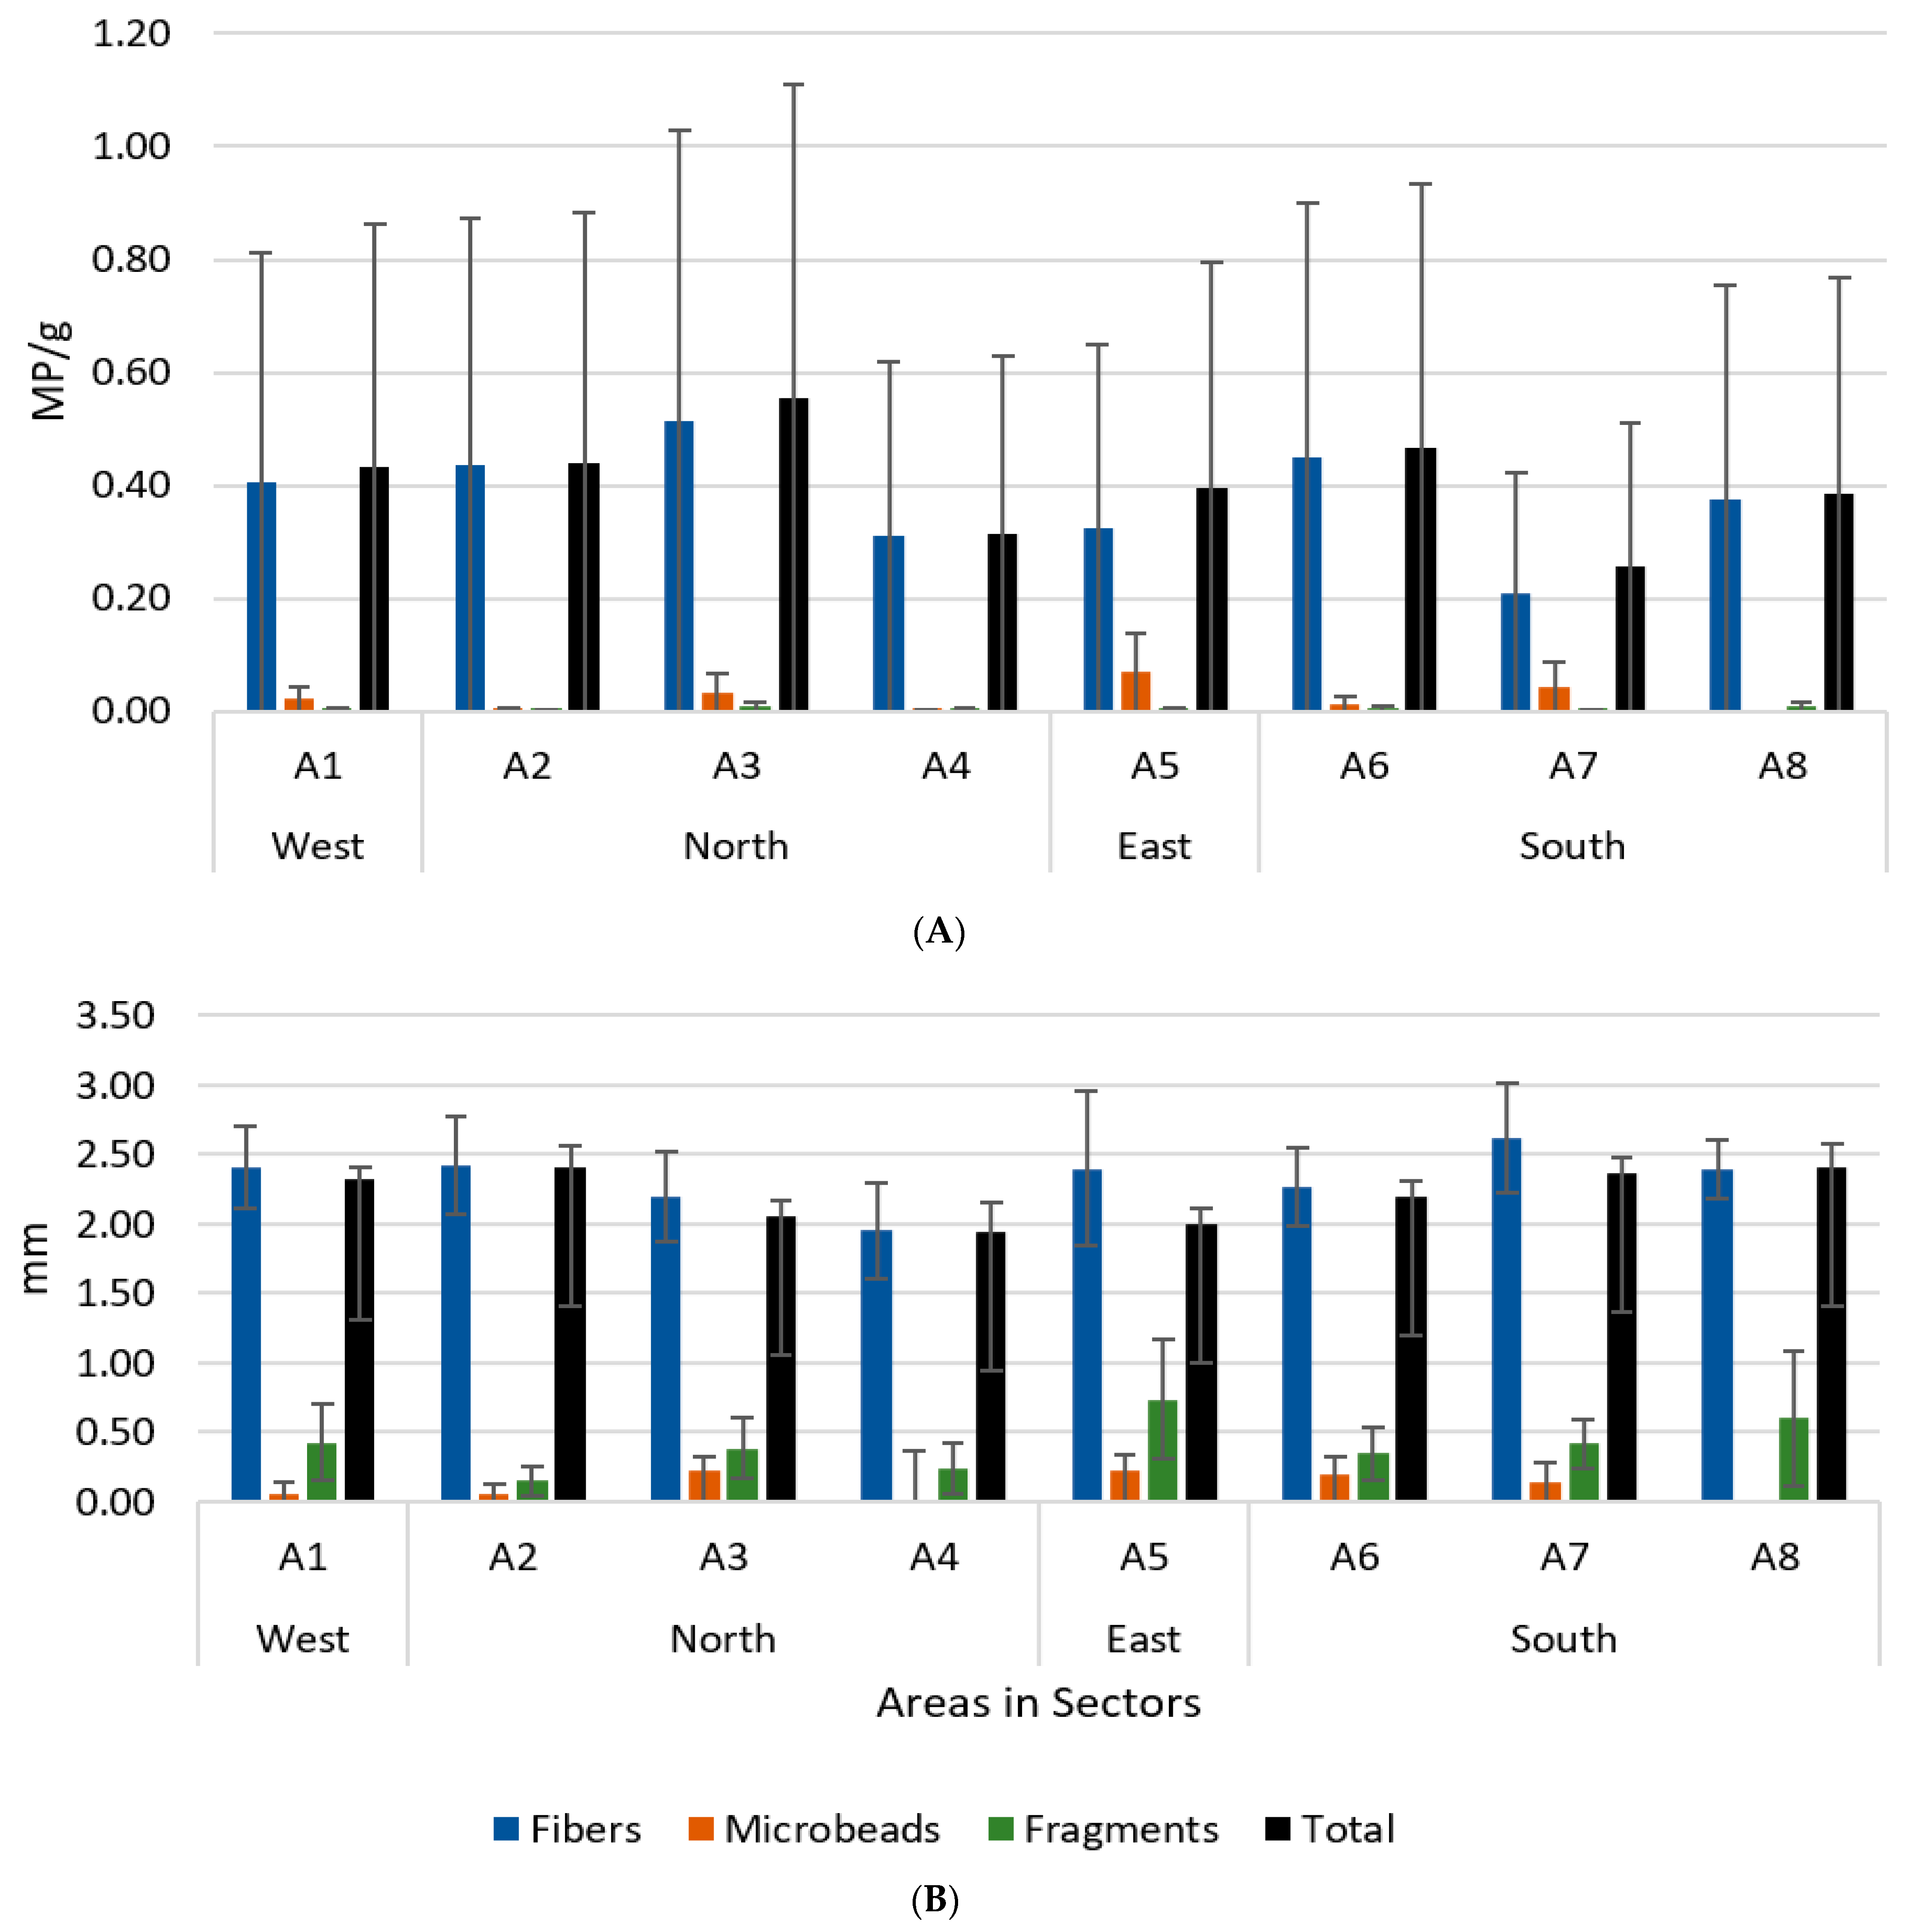
  • First, sediment samples were collected at four sites, namely upstream (U) and downstream (D) stretches of water courses, adjacent beach (B), and underwater marine environment (UW), distributed among eight areas (A1–A8; marked with black circles in Figure 1), covering all the coastline of São Miguel in the four sectors (north, south, east, and west), following a nested approach (sector, area, and site). Sites were separated by a minimum of 300 m apart, and, in each one, 5 replicates were collected approximately 10 m apart. Underwater samples were collected from the higher sediment blanket (at 15 m depth), and the same process was used in overflood streams. The design was used to analyse the microplastic composition and abundance gradient from inshore areas until the sea;
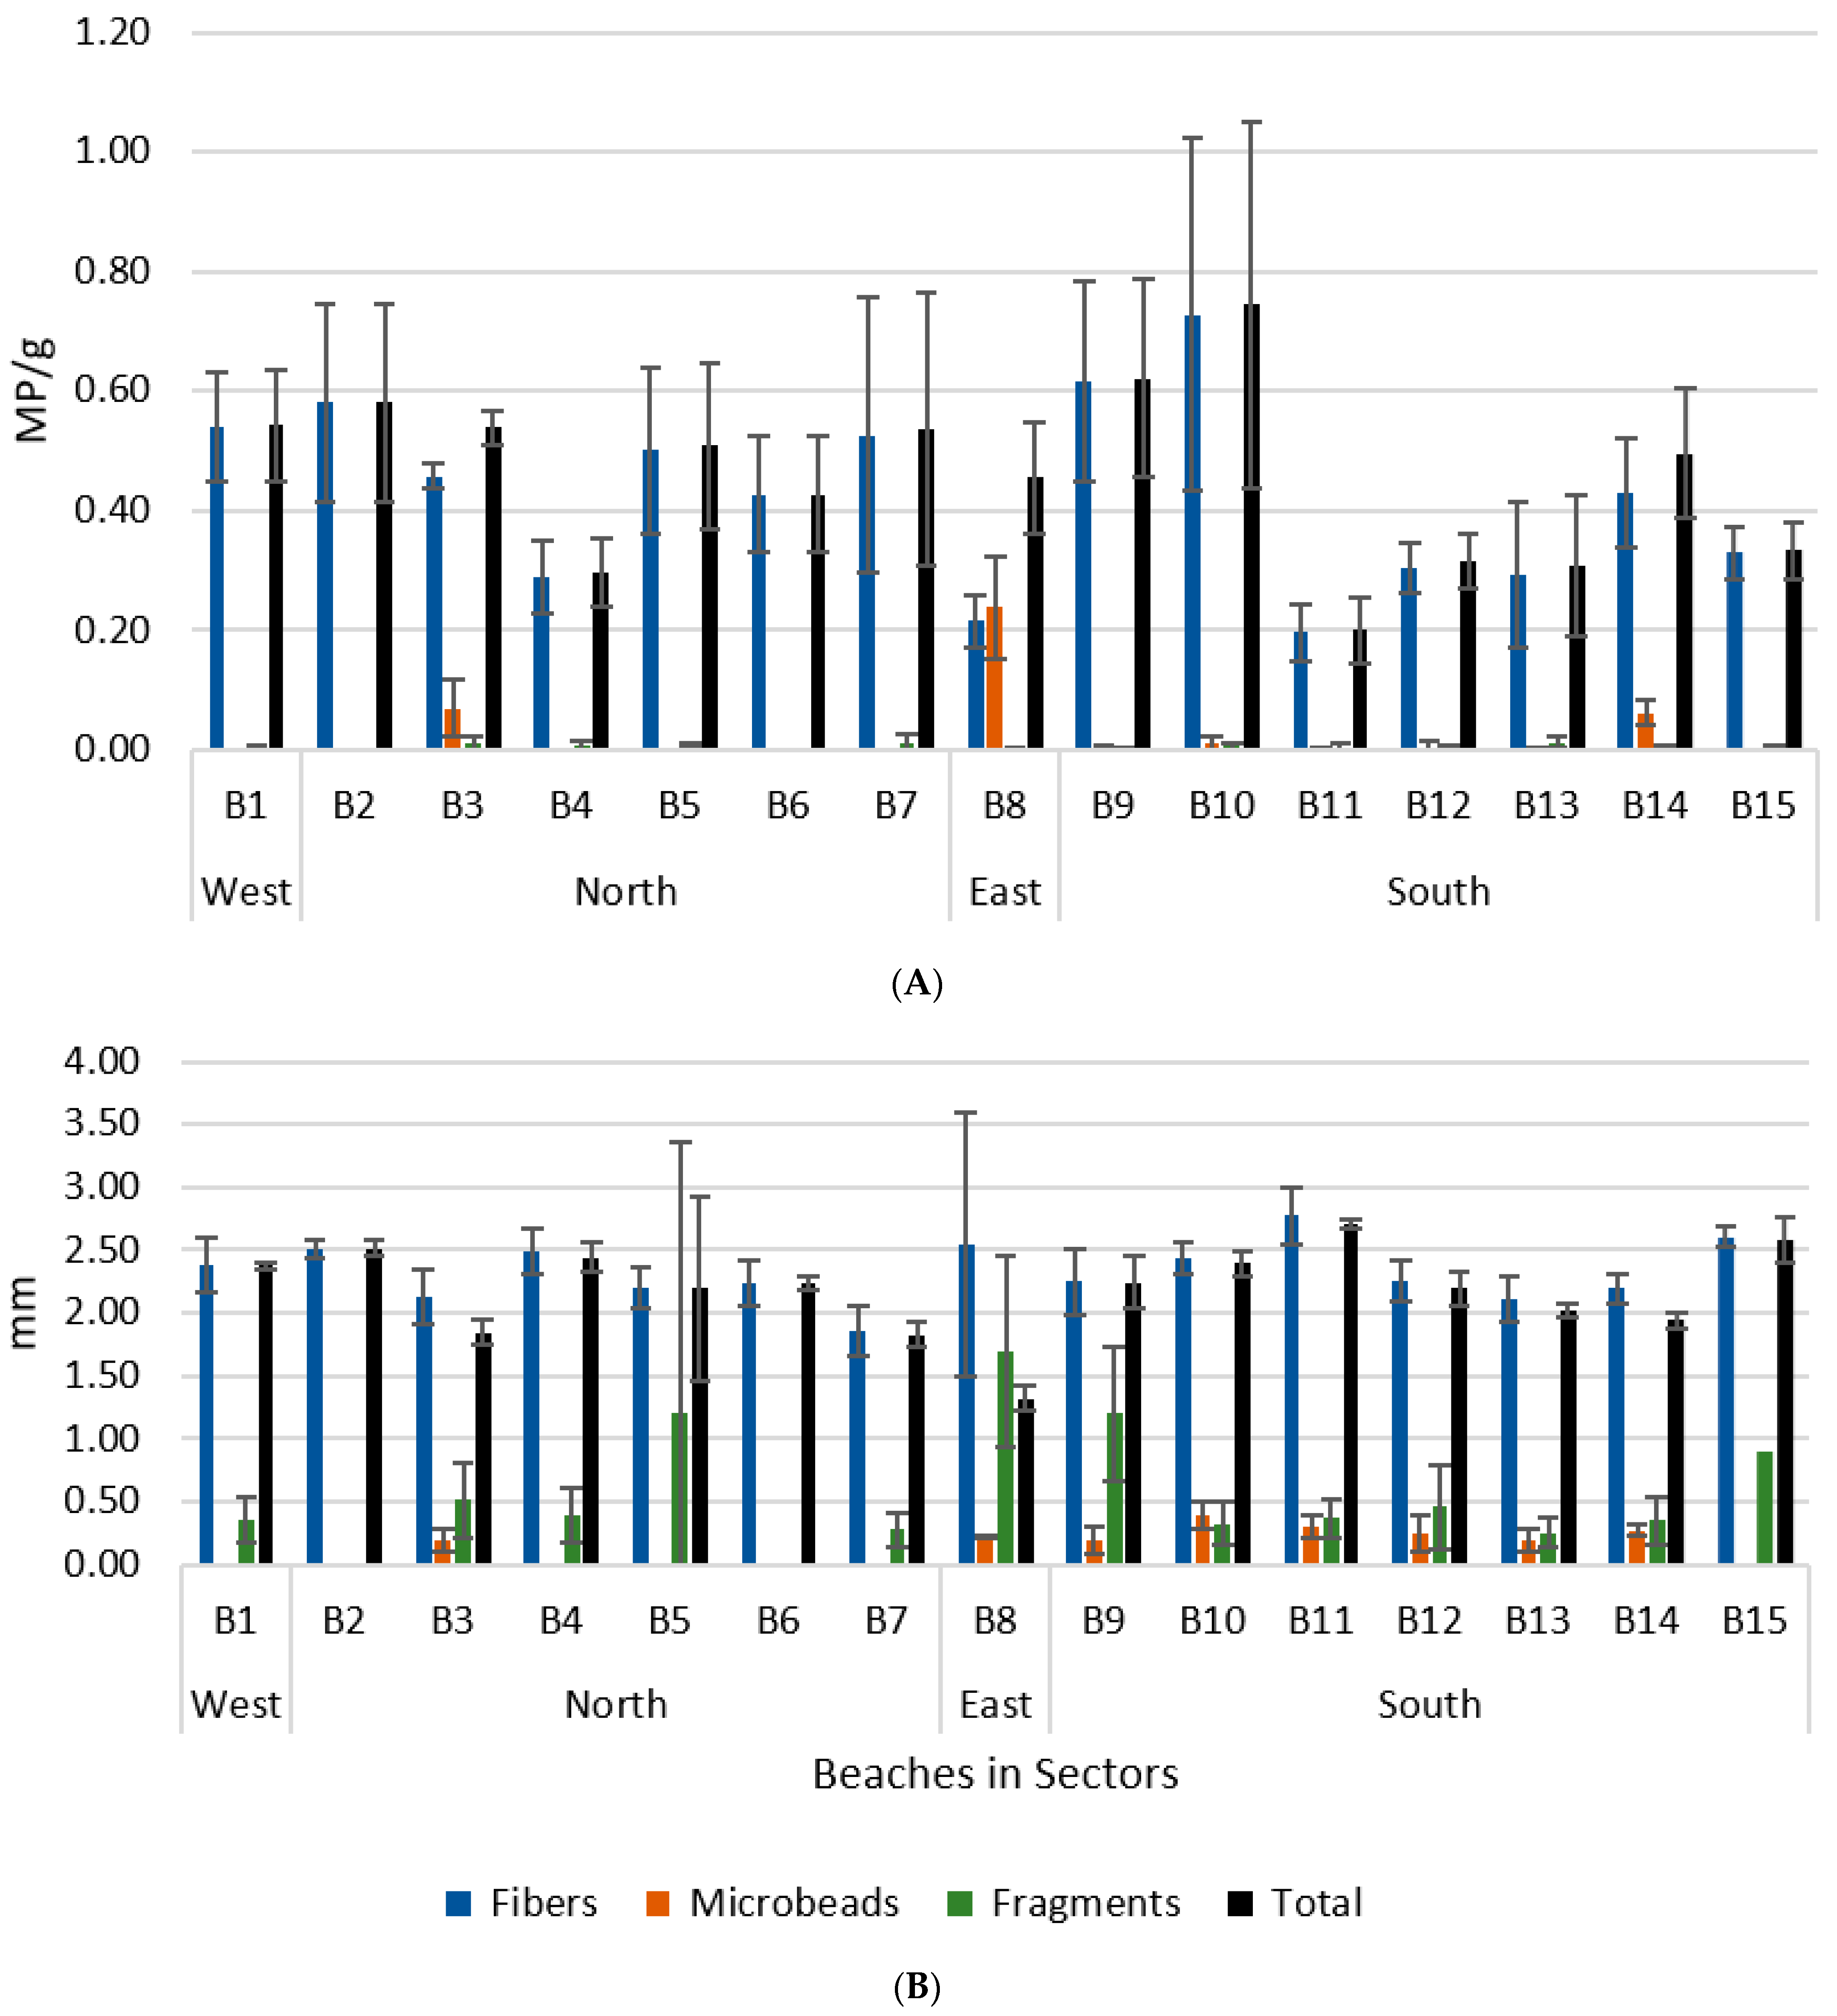
  • The second design covered the sampling of 15 beaches (B1—B15; marked with red crosses in Figure 1) nested in the four sectors (north, south, east, and west) during the same period. Again, on each beach, five replicates 10 m apart were collected. This alternative approach was performed to allow for more comprehensive coverage of the entire island coastline, considering the easier local access to these sites, and to produce comparable results with other studies, since most works focus on beaches.
Both sampling designs were conducted during the autumn/winter of 2021, due to the increase in marine litter abundance during these seasons as observed by the authors of [1]. When retrieving the samples, the surface layer of the sediment was removed, about 1–2 cm, with a metal spatula to take out organic matter and mesoplastics. Sediment samples were then placed in a metal container with a capacity of approximately 150 g to avoid contamination, labelled, and sealed with parafilm until arrival at the laboratory. Samples from the beaches were collected slightly above the high-tide line [35,36,37].

2.3. Laboratory Processing and Analysis

Each sample was weighed and then oven-dried at 60 °C for 48 h [10,38,39,40]. After that period, the samples were removed and weighed again to estimate their dry weight. After the sampling process, the material was washed and rinsed with filtered water.
A salt solution was prepared in a beaker with a capacity of 3 L, previously washed, by adding 1 L of demineralised water to 400 g of, uninspected MP, salt in four 100 g fractions. Only when the previous 100 g were solved, another 100 g were added [41]. The mixing process was aided by a hot plate and a magnetic mixer. This solution was chosen for extraction due to its ability to reach high densities; being cheap to obtain, widely available, and environmentally friendly [20]; and having a large movement in heavier polymers like high-density polyethylene (HDPE) [42].
Each sample was placed in a beaker with the aid of a funnel, and about 400 mL of the salt solution [43,44] were mixed for 2 min with a glass rod [41]. The sample was left to rest for 5 h. The vacuum pump was prepared with 47 mm Millipore 0.45 µm paper filters [10,45,46,47,48] previously divided into 4 quadrants and identified on the edge. The supernatant was filtered with the aid of a 100 µm sieve to avoid large objects making it difficult to see under the microscope [47]. This whole process of decantation and filtration was repeated 3 times with different filter papers to optimise the capture of all the microplastics present in each sample [49].
After all the supernatant was filtered, the filter was carefully removed with forceps and placed in a Petri dish. With the stereoscopic magnifying glass in 4.0× [10,47], the microplastics were categorised as fibres, microbeads, or fragments (since pellets, foams, and films were nonexistent), counted, and their lengths and colours were recorded.

2.4. Quality Control

Contamination can occur during each stage of sampling, processing, and characterising samples. To avoid cross-contamination, during the sampling and treatment procedures, the samples were never in contact with plastic. All the equipment used during the process was always made of glass or metal and properly washed with soap and rinsed with filtered water between tasks.

2.5. Data Analysis

Microplastic abundance and dimension categories were computed for each sampling site according to each category. To examine the potential differences, four (I–IV) PERMANOVA nested designs (one for each combination of sampling design and analysed variables) were used.
  • Three factors, treated as random, with two nested terms design, for abundance (I) and dimension (II) variables: island sector (north, south, east, and west), areas (A1–A8) within sectors and sites (U, D, B, and UW) within areas and sectors;
  • Two factors, treated as random, with one nested term design, for abundance (III) and dimension (IV) variables: island sector (north, south, east, and west) and beaches (B1–B15) within sectors.
These analyses were performed using the PERMANOVA add-on in Primer software [50]. The tests were run one at a time on square-root transformed Bray–Curtis similarity matrices of the abundance data and Euclidian distances for dimension data, and each term in the analyses was tested using 9999 random permutations.
To determine the factors influencing variation in microplastic abundance and dimension, generalised linear mixed models (GLMM, normal error distribution and identity-link functions) with different combinations of random predictor and variables sets were applied, including island sector, area, site, granulometry, and proximity to pollution potential sources/centres. For each model, the variables were retained based on the Akaike information criterion (AIC) to estimate the prediction error and, therefore, the relative quality of the statistical models for a given dataset [51]. For the island sector (location) factor, samples were divided between north, south, east and west. Granulometry was classified according to [52,53] among classes: 1—clay (<1/256 mm); 2—silt (1/16–1/256 mm); 3—sand (2–1/16 mm); and 4—pebble (64—2 mm). The two additional classes (boulder (>256 mm) and cobble (256—64 mm) were discarded due to the lack of samples that could be grouped into them in the study area. Proximity to a potential pollution source/centre was scored according to the distance of each site from an urban centre measured in a straight line on a map: 1—more than a mile; 2—less than a mile; and 3—inside towns. These analyses were undertaken using IBM SPSS software v.28 [54].
A significance level of p < 0.05 was considered in this work for statistical significance for all cases.

3. Results

In this survey, a total of 10,829 microplastic (MP) items were collected throughout the eight areas and 15 beaches (160 samples). Fibres constituted the dominant category (92.3%), followed by microbeads (6.6%), and, finally, fragments (1.1%). The most abundant colours were transparent (39.5%), black (36.2%), and blue (17.4%). The average abundance was 0.37 MP/g, with a minimum of 0.20 MP/g and a maximum of 0.74 MP/g. The minimum length was 0.1 mm, and the maximum was 5 mm (the upper limit for a plastic particle being classified as a microplastic), with an average length of 2.15 mm.
Overall, along the land–sea gradient, the MP abundance was significantly higher towards the ocean, decreasing in size (Figure 2 and Table 1). Also, microbeads were more abundant and larger near the coast and almost insignificant inland. Fragments, although much less frequent, were more uniformly distributed.

3.1. Island Sectors and Areas

Considering the sampling design by areas within island sectors, fibres were the most frequent category (91.3%), followed by microbeads (7.6%), and, finally, fragments (1%). The minimum length of the MPs was 0,1 mm, and the maximum was 5 mm, with an average of 2.19 mm. The most abundant colours observed in this sampling design were transparent (40.4%), black (36.7%), and blue (16.2%).
The sector with the highest average abundance was the west (0.43 MP/g), with also the largest average dimension of these particles (2.32 mm), while the lowest abundance was found in the south (0.35 MP/g), and the lowest dimension in the east (2.01 mm) (Figure 3A,B). The west, east, and south presented a higher abundance near the coast (underwater and beach) than inland (downstream and upstream), while in the north, the higher abundance was detected upstream. Regarding the variation of dimension among sites, the smallest particles were found in underwater samples, except in the east, where they were found in beach samples. The largest particles were normally observed inland, downstream and upstream, except in the south, where they occurred on the beach.
The area with the highest average abundance was A3 (0.56 MP/g), and the one with the lowest was A7 (0.26 MP/g) (Figure 4A). Regarding the dimension of the microplastics, it was quite similar, with fibres being the largest MP category. Microbeads were usually found near the coast, and the higher abundance was found in A5. Fragments were the least abundant. But, the dimensions varied, with the largest particles being found in A5. The area with the average largest microplastics was A8 (2.41 mm), while that with the smallest was A4 (1.94 mm) (Figure 4B). Considering the abundances among sites, in A1, A4, and A5, there was a clear division between coast and land, where the coast presented higher values. In A2 and A6, the more abundant site was the beach. In A3, the higher abundance was upstream, with downstream showing the lowest abundance, while A7 and A8 showed the higher abundance in the underwater sediments. Regarding the dimensions within the areas, in A1, A2, A3, A5, A7, and A8, the smallest particles were found in underwater sediments. The smallest particles in A4 and A6 were found in the beach and upstream, respectively. The largest particles among the sites were normally found inland, except in A6 and A8, where they were detected on the beach site.
Despite the variation referred to before, the PERMANOVA results showed significant variability among the areas and sites for abundance but only among sites regarding microplastic dimension (Table 1). Generally, in nested designs, pair-wise comparisons are not performed among levels of each factor; however, a logical step is to estimate the component of variation and ascertain the amount of variability explained by each factor. Thus, the greatest component of variation occurred at the smallest spatial scale (the residual level of individual replicate holdfasts), followed by sites and then areas, especially for the microplastics dimension (Table 1).
The best GLMM model detected significant effects of site, granulometry, and proximity to a potential pollution source/centre (Table 2). More specifically, microplastic abundance seems to significantly increase with nearby potential pollution sources, towards more coastal ground, and among the smallest granulometry dimension. Similarly, the microplastic dimension decreases significantly towards more coastal grounds and is affected by nearby potential pollution sources.

3.2. Beaches

In the 15 beaches analysed, 4643 microplastic particles were found. Again, fibres were the most dominant category (92%), followed by microbeads (6.9%) and fragments (1.1%). Regarding colour, the most abundant were transparent (36.6%), black (34.3%), and blue (20.2%). The average abundance of microplastics in sampled beaches was 0.44 MP/g, with a minimum of 0.20 MP/g and a maximum of 0.72 MP/g. The minimum size was 0.1 mm, and the maximum was 5 mm, with an average of 2.14 mm.
The beach with the higher MP average abundance was B10 (0.72 MP/g), and the one with the lowest abundance was B11 (0.20 MP/g) (Figure 5A). Microplastics were larger in B11 (2.70 mm), with fibres being the largest microplastics category. The smaller was detected in B8 (1.32 mm) (Figure 5B).
The PERMANOVA results also showed significant variability among beaches but not for island sectors for both the abundance and dimension of microplastics (Table 3). In this case, the GLMM model did not detect any significant pattern of granulometry or proximity to a potential pollution source/centre.

4. Discussion

The transport of MPs in coastal environments is one of the most important processes, controlling their environmental fate and risks and regulating their temporal and spatial distribution among various marine and coastal habitats [55]. Microplastics were found to be ubiquitous, although variable along the coastline and water courses of São Miguel Island. Microplastics were found in all samples, revealing that sediments are vulnerable to microplastic pollution and that this can be considered a good representation of the long-term accumulation of microplastics [56].

4.1. Categories and Colours

Fibres were the most abundant category, usually derived from washing-machine water outflow from synthetic fabric sources. Studies also found fibres as the most common debris after fragments in the Northeastern Atlantic [57]. For each standard wash, up to 700,000 fibres can be released into the aquatic environment via wastewater, which is believed to be the origin of many of the fibres distributed throughout the marine ecosystem [58,59]. These can also enter the environment through the fragmentation of ropes and fishing nets [25], which are believed to represent 18% of all debris [60] It is estimated that the disintegration of abandoned, lost, or otherwise discarded fishing gear can generate around 1277 MPs m−1, with fishing rope (44%) and nets (49%) being the main sources [61]. This is particularly important in the Azores, considering the socioeconomic importance of fishing [62]. Nevertheless, it should be mentioned that [63] raised the possibility that density separation with a NaCl solution probably allows more the separation of plastic fibres than other shapes and types of MPs, regardless of their density.
Microbeads are microplastics that are used in personal care products, such as scrubs, hand cleansers, and toothpaste. These types of microplastics are harmful due to their ability to absorb and concentrate toxic hydrophobic substances in water [64]. Microbeads are widely dispersed in the environment and are particularly prevalent in more coastal grounds [65]. In this study, they were found in underwater and beach sediments, just as expected, probably originating from the discharges of plastic waste into the environment. Considering that overall, the most common colour was transparent, and the size ranged between 0.2 mm and 1 mm. It is acceptable to conclude that these microbeads originated from personal care and cosmetics products sold in the region. Numerous studies have highlighted the challenges of effectively removing microplastics during water treatment, often leading to their unintentional release into water courses [66]. However, noteworthy research demonstrated that the key steps for successful microplastic removal in the treatment process are the grit- and grease-removal stages [58,67]. It is important to note that the implementation of these stages in wastewater treatment works varies, as this practice depends on the specific characteristics of the incoming wastewater and the treatment processes employed.
Fragments are usually related to secondary MPs, originating from larger plastic items that have suffered the process of erosion and fragmentation due to the action of current waves and/or exposure to solar radiation, breaking them into small pieces of plastic. Fragments are the dominant type in the open ocean [68], though, in this study, they were the least detected category. In research conducted on coastal sediments from Southern Portuguese shelf waters, of 31 MPs, only six were fragments [39]. In another study in the North Atlantic Ocean, beach sediment also revealed a higher concentration of fibres relative to fragments [69]. However, a recent study covering some Azorean beaches on several islands revealed that 64% of the items detected were MP fragments [28], although without any type of density separation process. In this last study, the authors used quadrats and only analysed the first layer of sand (1 cm), while in our case, the surface layer of the sediment was removed, which may also help to explain our results of deeper sediments where the smallest MPs accumulate over time.
The different abundances of fragments within the beach and underwater marine environment sediments are caused by the underlying hydrophysical processes in coastal zones caused by stormy weather that function like a mill and, consequently, make floating pieces migrate repeatedly between beaches and underwater slopes until they fragment into smaller particles that can be transported and deposited by currents to deeper areas [70]. This is particularly evident on oceanic islands exposed to violent and long storms, especially during the winter season [71].
The microplastics identified in this study were predominantly transparent, black, and blue. Several studies have found that the most common colours are blue and black [10,72,73]. This colour variation, and significant transparent colouration, may be due to the different origins of the plastic material or to the degradation processes in the marine environment [74].

4.2. Abundance

The overall significant MP accumulation near more coastal grounds is associated with greater anthropogenic pressure and mismanaged waste [75]. The differences among areas potentially reflect varying plastic emissions along the streams. The higher MP input into large watersheds may be explained by several river sources, in addition to aeolian transport [75,76]. High discharge periods wash plastic waste into a stream. Therefore, high discharge is often associated with rainfall events that stimulate additional urban and agricultural litter that runs off, increasing MP input and accumulation downstream. It is proven that smaller size ranges of MPs tend to accumulate in locally restricted high-abundance hotspots, in either natural or artificial traps (harbour areas or groyne fields) [75]. Hence, beaches concentrate litter from the nearby waters, making them the perfect storage place for this type of pollution.
Given that the island has a mild maritime climate, with a high precipitation rate, and consequently, high flow velocity, it makes sense that the sedimental microplastics can be found in higher numbers in coastal areas, due to the transportation that they suffer in the river–sea path [77]. Only Ribeira Grande (A3), the second-most populous municipality on the island [33] (Figure 6) presented a higher abundance upstream, probably because this was the only case sampled within a waterfall, where the strength and speed of the water may cause some variation in the settlement of these particles, preventing motion. This site in Ribeira Grande municipality (the second-largest city), was the most polluted site sampled, thus becoming a priority for cleaning and monitoring. By analysing the results of this study, Figure 1 and Figure 6, we can observe that, even though the highest population density is focused near the capital, Ponta Delgada, there is not much of a drainage basin to transport MPs to this zone.
The site with the highest litter density was Ribeira Quente Beach (B10), although Povoação Beach (B9) and Capelas Beach (B2) also showed a high density. According to the Regional Secretariat for the Environment and Climate Change of the Azores [33], the level of pollution in these sites of Ribeira Grande (B10) and Povoação (B9) is justified by the frequent rains and considering the agricultural use of the cliff top that can suffer landslides.
The average litter density exhibited significant variation between both sampling designs, encompassing eight areas and 15 beaches. Comparing our results with [56] in the Beijiang River littoral zone, our lowest abundance still surpassed their findings. And, our highest abundance was even greater. In contrast to [78] in beach sediments in Bangladesh, our abundance of microplastic particles was notably larger. This difference can be attributed to the authors’ use of a zinc chloride solution for density separation and Fourier-transform infrared spectroscopy (FTIR) for MP-particle identification. Lastly, when comparing our mean MP abundance with [10], who analysed 23 European beaches, only three locations (in Italy, Iceland, and Lithuania) exhibited a higher abundance than our results. A study carried out in the Azores archipelago (the islands of Corvo, Santa Maria, Flores, Graciosa, and Faial) showed a larger quantity of collected MPs (about 39,000 microparticles) compared with this study [28]. However, the methods were slightly different, using a mechanical shaker with different sieve sizes throughout several months, while our data was just a one-time sampling campaign. Even so, the overall results of [28] show that only one out of the seven beaches (Porto Pim) demonstrated a chronic exposure to small plastic items, with an average loading rate per tidal event exceeding 500 items m2 in 50% of the sampled months. However, in our case, it seems that all of the São Miguel coastline is quite exposed. Nevertheless, and as already mentioned, comparisons between studies should be conducted carefully, as microplastic concentrations may not only be related to pollution levels but also be affected by differences in the sampling methods used, the processing and analysis techniques applied, and the local oceanographic conditions, such as tides, currents and weather [79].
High densities of litter can also be explained by exceptional adverse weather conditions, like strong storms, before sampling. The elevated number of litter items found likely represents extended periods of accumulation. Furthermore, studies on islands reflect the importance of how currents and winds can influence the direction and accumulation of litter in coastal areas [80]. The growth of commercial and recreational maritime traffic and activities [81] might also reflect an increase in marine pollution, despite the apparent absence of heavy industry along the coast.
Hence, the MPs’ higher abundance detected along the shore is probably from inshore origin, although a portion of the plastic microparticles seems to be derived from the prevailing winds and marine currents of the North Atlantic. The subtropical jet stream may cause an atmospheric circulation that may increase the MP levels on the island [82]. It is important to note that data may be missing, since some types of plastic, such as PVC, do not float and, therefore, were not accounted for in the analysis [83]. It was suggested by [28] that Azorean beaches are acting as important transitory repositories for small plastic fragments floating in the North Atlantic, quickly returning to the ocean and eventually sinking down to the seafloor [84] or being ingested by marine organisms. In fact, high quantities of plastic fragments are already being ingested by juvenile loggerhead turtles in the Azores [85]. Our data clearly show a local MP input, mainly fibres, mixed with some fragments and microbeads when it reaches the coast. However, in our case, very few fragments were detected that can also support the transitory nature of these particles, especially considering that we only sampled one time and not several, as did [28], and that sampling was conducted in the rainy and stormy season.
Although gravel beaches usually present higher litter densities than sandy beaches, in the present, study we witnessed the contrary, with an increase of abundance in sediments with smaller granulometry, which makes more sense considering their higher retention ability [86]. It is also important to notice that MP infiltrates and settles between large gravels during recessional flood periods [87].
Freshwater sediments attract less attention than marine ecosystems. the sediments of a river shore in Germany were analysed by [88], and, similar to our study, all the sediments analysed contained microplastics. Short-distance transport of plastic particles from the tributary to the mainstream was confirmed by the identification of pellets that were separated from the shore sediment samples of the river. Nevertheless, despite the few studies available, a scientific article published just last month in Nature, which analysed 38 lakes from 23 countries around the world, revealed that Lagoa Azul (a well-known Azorean Lake in São Miguel, Azores) was ninth, with more MPs detected [89]. Again, fibres dominated, most probably due to inputs from tributaries, also supporting our results. The variation in microplastic deposition patterns among studies may be due to differences in classification schemes for shore zones and the morphodynamics of beaches [90]. Another study investigating the distribution patterns of microplastics in subtidal sediments along the Portuguese west coast from late summer to winter showed no correlation with rainfall [91]. However, a distinct spatial distribution pattern was observed. MPs accumulated heavily in the estuary (a hotspot), mainly in the form of fragments, while they were less abundant in the other stations, primarily as fibres. The high concentration of MPs in the estuary correlated moderately with its poorly sorted sediments and high organic matter content [91]. Additionally, most MPs in the estuary fell within the size range of the most common sediment grain size fraction (0.25–0.50 mm). The exportation of MPs from the estuary was facilitated by differences in mineral content among the stations, indicating limited sediment transport along the coast. Conversely, the consistent abundance of fibres across all stations was likely due to their higher surface-area-to-volume ratio and the presence of wastewater treatment plant outfalls at each end of the study area [91]. In another study between MP distribution and sediments of lakes, urban activities were identified as the main contributing factor [92]. In Lake Ziway, plastic particles likely enter the lake through wastewater drainage from Batu town, rivers traversing urban areas (such rivers), and surface runoff during heavy rainfall. Sediment samples collected from sites receiving urban waste and river inflows showed high concentrations of plastic particles, indicating the primary entry pathways into the lake [92]. Apart from urban activities, fishing and tourism activities, including boating, restaurants, resorts, and both commercial and subsistence fishing, contribute to plastic litter in aquatic ecosystems. Shoreline sites associated with recreational activities exhibited elevated plastic-particle concentrations. Rivers play a significant role in transporting plastic debris from catchment areas to lakes, estuaries, and marine environments, with sediment samples at river mouths reflecting contributions from upstream urban and agricultural areas [92], similar to our study. Agricultural runoff, particularly from smallholder vegetable farms, introduces plastic particles to surface waters. The plastic ropes widely used in tomato cultivation in the central rift valley region are a notable source of plastic particles in sediment samples from certain sites. Additionally, flower farms in proximity contribute to plastic pollution, although to a lesser extent. Sites less affected by agricultural and urban influences showed lower plastic-particle concentrations in sediment [92].

4.3. Dimension

Analysing the sectors, the largest MPs were found on the west of the island, although with no statistical significance. This may be explained by the intensity of direct waves that may increase the transportation of “raw” MPs, e.g., microparticles of plastic that were not fragmented flowing on the sea surface. Plastic microparticles also break down far faster in a bright, hot, and abrasive place like a salt marsh or beach than they break down in colder, deeper water [93], which explains the significant decrease in size towards the coast.
The large dimension of MPs on the beaches of A2 and A8 could be explained by the low patterns of ripples, since the marine currents prevail from the west, inflicting less damage to the particles from winds and waves due to the reduced mechanical stress and limited turbulence. Microplastics are less expected to collide with each other or with solid surfaces in low-velocity flow circumstances, which can minimise the potential for fragmentation or breakage.
When comparing the dimensions of microplastics on the beaches with findings from previous studies, our results exhibited larger sizes than those reported by [94] along a transect from the European Coast to the North Atlantic Subtropical Gyre [10], across various European beaches, [57] in the Macaronesian region (NE Atlantic), and [95] in the North Atlantic. However, it is essential to note that [96] observed larger particle dimensions in the Northeast Atlantic Ocean. This discrepancy may be attributed to various factors, such as anthropogenic pressures, oceanic and atmospheric conditions, the season of sampling, and differences in methodologies employed across studies.

4.4. Limitations and Future Perspectives

It is crucial to notice that litter abundance and typology on the coastline are guided by a multifaceted combination of various factors like proximity to urban centres and water streams, exposure to oceanic currents and winds, beach slope, orientation, and geomorphology [80], just as noticed by the results of the present work. Furthermore, the results regarding island sectors, although not significant, should be interpreted with caution, considering that the west and the east are only represented by a single area, resulting in a somewhat unbalanced design.
Further investigations are needed regarding the synthetic nature of particle (especially fibres) distribution, occurrence, and the fate of these MP particles on oceanic islands such as the Azores archipelago. Therefore, additional analyses should be conducted, aiming at other sampling depths, analysing the wastewater treatment, different seasons, and a more profound investigation of the types of polymers. Analysing and comparing the data with other islands of the archipelago can be productive, as well as analysing the differences and variations within the three groups (central group, western group, and eastern group), since all of them have their own distinct pressures and geomorphological characteristics that make them unique. More work is also needed to identify and mitigate the sources of MPs in the environment and to establish standardised sampling programs and, therefore, a more comprehensive understanding of the fluxes, sinks and behaviour of MPs in coastal environments.
The presence of microplastics in water bodies near urban areas is often overlooked due to the influence of various anthropogenic factors. Understanding these factors is crucial for comprehending the variability and occurrence of microplastics in different ecosystems. Therefore, effective environmental management practices play a significant role in controlling the transmission and production of microplastics in watercourses. It is essential to design and implement different environmental management measures based on specific hydrological or weather conditions to reduce microplastic inputs and alter their flow patterns in the region [97].
Furthermore, tracking the mechanisms, efficacy, and sustainability of these management measures in future studies is important, as is monitoring changes in microplastic flow patterns. Various urban environmental management systems affect the fate of microplastics. Disinfection methods used in drinking-water treatment plants may induce the degradation of plastic microparticles, while wastewater treatment plants can decompose them, leading to an overall removal rate of 70% to 99% for all microplastic particles [18]. However, regardless of the treatment method used, microplastics are not entirely eliminated and can eventually be released into the environment. It is crucial to pay more attention to the treatment and modification of microplastics during disinfection processes, as limited knowledge exists regarding their ecological behaviours, such as migration, fragmentation, and leaching of additives. Efficient methods for microplastic elimination are currently lacking. Considering the direct ingestion of these particles through drinking water, it is crucial to develop practical methods to address this issue [98].
Cruise tourism in the Azores is also a potential source of microplastic pollution. In this regard, a previous study seems to indicate that the increasing cruise-ship transit at Ponta Delgada has not significantly impacted background levels of air pollutants in the city centre beyond the typical patterns associated with local urban activities [99]. Nitrogen oxide concentrations show a slight increase, but they remain below daily maximum limits, likely due to the intermittent operation of cruise-ship engines at low-performance levels during docking, along with the use of low-sulfur diesel fuel and emission-control systems [99].
The global contribution of MPs from cruise-ship wastewater seems relatively small compared to land-based sources; local impacts can still be significant due to the large volume of wastewater discharged, untreated waste products, the susceptibility of coastal and marine ecosystems, and the concentrated nature of cruise activities [100]. Nevertheless, preliminary estimates suggest that cruise ships could potentially discharge around 100 thousand tons of MPs annually, approximately equivalent to the lower limit of secondary MPs found on the ocean surface. This calculation assumes that the MP discharge from a cruise ship is comparable to that of a wastewater treatment plant, estimated at three tons of MPs per year, with consideration given to semisynthetic fibres (approximately 90% of the load). Grey water from 323 cruise ships globally contributes to 10% of the total volume of grey water discharged from ships. Consequently, grey water stands out as a significant sea-based source of MPs, with the potential for concentrated MPs in grey water to exert significant local impacts on coastal cities and marine protected areas [100].
Previous research into the sources and routes of MPs in cruise-ship wastewater shed light on various sources and pathways while pinpointing key areas for mitigation and uncovering gaps in knowledge [101]. At the level of individual companies or vessels, understanding these sources and pathways enables the identification of measures to mitigate the release of MPs into wastewater, guiding policies on procurement by cruise lines and the necessity of ongoing education of crew and passengers. In general, it is recommended that cruise lines integrate measures to phase out single-use plastics, including personal care and cleaning products containing primary MPs, into their policies. Moreover, replacing synthetic textiles with non-synthetic alternatives and implementing laundry filters could effectively reduce MP levels in wastewater [101]. However, advanced wastewater treatment systems alone are not a complete solution and should be part of a comprehensive wastewater management strategy. Efforts should also focus on minimising discharges from waste products and wastewater streams bypassing advanced wastewater treatment systems, in addition to those addressed in this study.

4.5. Local Actions

Environmental management actions should involve public awareness and education campaigns regarding marine pollution, including MP pollution, and its impact on the environment. It is important to implement waste management practices that focus on reducing plastic use and ensuring proper disposal. Efficient waste management systems should be established, encompassing collection, sorting, recycling, and disposal facilities. Additionally, promoting the separation and recycling of plastic waste and encouraging the adoption of eco-friendly alternatives to single-use plastics is crucial. In this context, standardised and regular beach cleanup events are already organised that involve local communities, tourists, environmental organizations, and school field trips.
Measures should also be implemented to prevent microplastic runoff from reaching the ocean, such as utilising litter traps, sediment ponds, or biofiltration systems to capture and eliminate MPs from stormwater. Promoting responsible fishing practices and ensuring the proper management and disposal of fishing gear and/or agriculture residues are important steps, which is already being carried out, as are encouraging the use of biodegradable or recyclable material and the retrieval of lost or abandoned items in various locations on the archipelago. Sanctions and regulations, even more rigid than the present ones, should be in place to reduce the use of plastic bags, including potential outright bans. Simultaneously, promoting the use of reusable or biodegradable bags is essential, especially since the acquisition of plastic bags is prevalent. Supporting scientific research and monitoring programs to assess the extent of MP pollution and understand its sources and impacts is vital.
Implementing and encouraging sustainable tourism or eco-tourism practices that minimise plastic-waste generation, promote responsible tourism activities, and educate visitors about the importance of protecting the marine environment is crucial and is already being carried out by most tourism companies. Finally, it is important to develop and enforce policies and legislation specifically targeting plastic and MP pollution. This can include regulations on microbeads in personal care products, restrictions on single-use plastics, and guidelines for MP monitoring and mitigation across various economic sectors. It is also crucial to adapt these measures to the specific characteristics and needs of each island and involve local stakeholders for a successful implementation.

5. Conclusions

This study provides a baseline of MP input on beaches and water courses on São Miguel Island, Azores. MP categories like microbeads and fragments, but especially fibres, are ubiquitous within Northeast Atlantic sediments and dispersed in coastal areas and freshwater bodies following the gradient of inshore–offshore, reflecting an important and troublesome local source. Their abundance generally increases while their size decreases towards more coastal grounds, accumulating on beaches and underwater marine sediments. The factors that contribute to this distribution and abundance are the distance to the coast, granulometry of the sediments, and the proximity to high-population-density areas.
The current scientific consensus reveals substantial damage to the global economy, the loss of human livelihoods and lives, and irreversible damage to the environment and the world. The fragmentation of plastic debris should be considered for new monitoring programs and studies, particularly because of the slow degradability of these materials. The impact of MPs on the ocean and the marine carbon cycle is also increasing, and this type of pollution still raises more questions than answers. Therefore, this study and its results are important for the scientific community and particularly for local government, concerning litter management and mitigation and awareness actions.

Author Contributions

Conceptualization, L.M.A. and P.T.; methodology L.M.A., J.L.C., A.C.C. and P.T.; software, P.T.; validation, A.C.C., A.Z.B., J.L.C. and P.T.; formal analysis, L.M.A.; investigation, L.M.A. and P.T.; resources, A.C.C., A.Z.B. and J.L.C.; data curation, L.M.A.; writing—original draft preparation, L.M.A.; writing—review and editing, A.C.C., A.Z.B., J.L.C. and P.T.; supervision, P.T.; project administration, P.T.; funding acquisition, A.C.C., A.Z.B. and J.L.C. All authors have read and agreed to the published version of the manuscript.

Funding

This work is funded by National Funds through the FCT—Foundation for Science and Technology under project UIDB/50027/2020 and POCI-01-0145-FEDER-006821. It was also supported by FEDER (85%) and regional funds (15%) through Programa Operacional Açores 2020, under the SCAPETOUR project (SeaSCAPEs promotion to diversify TOURistic products—Ref. ACORES 01 0145 FEDER 000083).

Institutional Review Board Statement

Not applicable.

Informed Consent Statement

Not applicable.

Data Availability Statement

No new data were created or analyzed in this study. Data sharing is not applicable to this article.

Acknowledgments

The authors also would like to thank the availability and support of all the companies that participated in the project that allowed us access to most remote places to sample.

Conflicts of Interest

The authors declare no conflicts of interest.

References

  1. Pieper, C.; Magalhães Loureiro, C.; Law, K.L.; Amaral-Zettler, L.A.; Quintino, V.; Rodrigues, A.M.; Ventura, M.A.; Martins, A. Marine litter footprint in the Azores Islands: A climatological perspective. Sci. Total Environ. 2021, 761, 143310. [Google Scholar] [CrossRef]
  2. Consoli, P.; Falautano, M.; Sinopoli, M.; Perzia, P.; Canese, S.; Esposito, V.; Battaglia, P.; Romeo, T.; Andaloro, F.; Galgani, F.; et al. Composition and abundance of benthic marine litter in a coastal area of the central Mediterranean Sea. Mar. Pollut. Pollut. Bull. 2018, 136, 243–247. [Google Scholar] [CrossRef]
  3. Hall, K. Impacts of Marine Debris and Oil: Economic and Social Costs to Coastal Communities; Kommunenes Internasjonale Miljoorganisasjon (KIMO): Shetland, UK, 2018. [Google Scholar]
  4. Mouat, J.; Lozano, R.L.; Bateson, H. Economic Impacts of Marine Litter; KIMO International: Shetland, UK, 2010. [Google Scholar]
  5. Rodríguez, Y.; Ressurreição, A.; Pham, C.K. Socio-economic impacts of marine litter for remote oceanic islands: The case of the Azores. Mar. Pollut. Pollut. Bull. 2020, 160, 111631. [Google Scholar] [CrossRef] [PubMed]
  6. Van Emmerik, T.; Schwarz, A. Plastic debris in rivers. WIREs Water 2020, 7, e1398. [Google Scholar] [CrossRef]
  7. Sartain, M.; Wesseal, C.; Sparks, E. Microplastics sampling and processing guidebook. Miss. State Univ. 2021, 3243, 6–21. [Google Scholar]
  8. IUCN Issues Brief. Available online: https://www.iucn.org/resources/iucn-issues-briefs. (accessed on 24 October 2022).
  9. Shen, M.; Huang, W.; Chen, M.; Song, B.; Zeng, G.; Zhang, Y. (Micro)plastic crisis: Un-ignorable contribution to global greenhouse gas emissions and climate change. J. Clean. Prod. 2022, 254, 120138. [Google Scholar] [CrossRef]
  10. Lots, F.; Behrens, P.; Vijver, M.G.; Horton, A.A.; Bosker, T. A large-scale investigation of microplastic contamination: Abundance and characteristics of microplastics in European beach sediment. Mar. Pollut. Bull. 2017, 123, 219–226. [Google Scholar] [CrossRef]
  11. Engelhardt, A. The Fiber Year 2008/09 A World-survery on Textile and Nonwovens Industry; Issue 10; Oerlikon Textile GmbH & Co. KG: Remscheid, Germany, 2009. [Google Scholar]
  12. Gross, M. Oceans of plastic waste. Curr. Biol. 2015, 25, 93–96. [Google Scholar] [CrossRef]
  13. Xanthos, D.; Walker, T.R. International policies to reduce plastic marine pollution from single-use plastics (plastic bags and microbeads): A review. Mar. Pollut. Pollut. Bull. 2017, 118, 17–26. [Google Scholar] [CrossRef] [PubMed]
  14. Li, W.C.; Tse, H.F.; Fok, L. Plastic waste in the marine environment: A review of sources, occurrence and effects. Sci. Total Environ. 2016, 566–567, 333–349. [Google Scholar] [CrossRef]
  15. Jamieson, A.J.; Brooks, L.; Reid, W.; Piertney, S.B.; Narayanaswamy, B.E.; Linley, T.D. Microplastics and synthetic particles ingested by deep-sea amphipods in six of the deepest marine ecosystems on Earth. R. Soc. Open Sci. 2019, 6, 180667. [Google Scholar] [CrossRef] [PubMed]
  16. Abel, S.M. Final Destination Deep Sea: Microplastics’ Impact on Ocean Floor Even Greater Than Assumed (12 July 2022). Available online: https://phys.org/news/2022-07-destination-deepsea-microplastics-impact.html (accessed on 2 August 2022).
  17. Wan, Y.; Wu, C.; Xue, Q.; Hui, X. Effects of plastic contamination on water evaporation and desiccation cracking in soil. Sci. Total Environ. 2019, 654, 576–582. [Google Scholar] [CrossRef] [PubMed]
  18. Shen, M.; Ye, S.; Zeng, G.; Zhang, Y.; Xing, L.; Tang, W.; Wen, X.; Liu, S. Can microplastics pose a threat to ocean carbon sequestration? Mar. Pollut. Bull. 2020, 150, 110712. [Google Scholar] [CrossRef] [PubMed]
  19. Miller, M.E.; Hamann, M.; Kroon, F.J. Bioaccumulation and biomagnification of microplastics in marine organisms: A review and meta-analysis of current data. PLoS ONE 2020, 15, e0240792. [Google Scholar] [CrossRef] [PubMed]
  20. Crawford, C.B.; Quinn, B. Microplastic Pollutants, 1st ed.; Elsevier Limited: Amsterdam, The Netherlands, 2016. [Google Scholar]
  21. Lönnstedt, O.M.; Eklöv, P. Environmentally relevant concentrations of microplastic particles influence larval fish ecology. Science 2016, 352, 1213–1216. [Google Scholar] [CrossRef] [PubMed]
  22. Cverenkárová, K.; Valachovičová, M.; Mackuľak, T.; Žemlička, L.; Bírošová, L. Microplastics in the Food Chain. Life 2021, 11, 1349. [Google Scholar] [CrossRef] [PubMed]
  23. Cannon, S.M.; Lavers, J.L.; Figueiredo, B. Plastic ingestion by fish in the Southern Hemisphere: A baseline study and review of methods. Mar. Pollut. Bull. 2016, 107, 286–291. [Google Scholar] [CrossRef] [PubMed]
  24. Susanti, N.K.Y.; Mardiastuti, A.; Wardiatno, Y. Microplastics and the Impact of Plastic on Wildlife: A Literature Review. IOP Conf. Ser. Earth Environ. Sci. 2013, 528, 012013. [Google Scholar] [CrossRef]
  25. Thompson, R.C.; Olsen, Y.; Mitchell, R.P.; Davis, A.; Rowland, S.J.; John, A.W.; McGonigle, D.; Russell, A.E. Lost at sea: Where is all the plastic? Science 2004, 304, 838. [Google Scholar] [CrossRef]
  26. Martins, A.M.; Amorim, A.S.B.; Figueiredo, M.P.; Souza, R.J.; Mendonça, A.P.; Bashmachnikov, I.L.; Carvalho, D.S. Sea surface temperature (AVHRR, MODIS) and ocean colour (MODIS) seasonal and interannual variability in the Macaronesian islands of Azores, Madeira, and Canaries. Remote Sens. Ocean Sea Ice Large Water Reg. 2007, 6743, 75–89. [Google Scholar] [CrossRef]
  27. Bashmachnikov, I.; Machín, F.; Mendonça, A.; Martins, A. In situ and remote sensing signature of meddies East of the mid-Atlantic ridge. J. Geophys. Res. 2009, 114, C05018. [Google Scholar] [CrossRef]
  28. Pham, C.K.; Pereira, J.M.; Frias, J.; Ríos, N.; Carriço, R.; Juliano, M.; Rodríguez, Y. Beaches of the Azores archipelago as transitory repositories for small plastic fragments floating in the North-East Atlantic. Environ. Pollut. 2020, 263, 114494. [Google Scholar] [CrossRef] [PubMed]
  29. Rodríguez, Y.; Pham, C.K. Marine litter on the seafloor of the Faial-Pico Passage, Azores Archipelago. Mar. Pollut. Bull. 2017, 116, 448–453. [Google Scholar] [CrossRef] [PubMed]
  30. Xiao, S.; Cui, Y.; Brahney, J.; Mahowals, N.M.; Li, Q. Long-distance atmospheric transport of microplastics fibers influenced by their shapes. Nat. Geosci. 2023, 16, 863–870. [Google Scholar] [CrossRef]
  31. Dris, R.; Gaspéri, J.; Mirande, C.; Mandin, C.; Guerrouache, M.; Langlois, V.; Tassin, B. A first overview of textile fibers, including microplastics, in indoor and outdoor environments. Environ. Pollut. 2017, 221, 453–458. [Google Scholar] [CrossRef]
  32. Kanhai, L.; Officer, R.; Lyashevska, O.; Thompson, R.; O’Connor, I. Microplastic abundance, distribution and composition along a latitudinal gradient in the Atlantic Ocean. Mar. Pollut. Bull. 2017, 115, 307–314. [Google Scholar] [CrossRef] [PubMed]
  33. SREA—Serviço Regional de Estatística dos Açores. 2021. Available online: https://srea.azores.gov.pt/ (accessed on 12 November 2021).
  34. Valente, M.A.; Miranda, P.M.A.; Aguiar, A. Climate Change Scenarios in the Azores And Madeira Islands. World Resour. Rev. 2004, 16, 473–491. [Google Scholar]
  35. Hidalgo-Ruz, V.; Gutow, L.; Thompson, R.C.; Thiel, M. Microplastics in the marine environment: A review of the methods used for identification and quantification. Environ. Sci. Technol. 2012, 46, 3060–3075. [Google Scholar] [CrossRef] [PubMed]
  36. Karthik, R.; Robin, R.S.; Purvaja, R.; Ganguly, D.; Anandavelu, I.; Raghuraman, R.; Hariharan, G.; Ramakrishna, A.; Ramesh, R. Microplastics along the beaches of Southeast coast of India. Sci. Total Environ. 2018, 645, 1388–1399. [Google Scholar] [CrossRef]
  37. Lefebvre, C.; Rojas, I.J.; Lasserre, J.; Villette, S.; Lecomte, S.; Cachot, J.; Morin, B. Stranded in the high tide line: Spatial and temporal variability of beached microplastics in a semi-enclosed embayment (Arcachon, France). Sci. Total Environ. 2021, 797, 149144. [Google Scholar] [CrossRef]
  38. Cozzolino, L. Service or Disservice? The Role of Marine Coastal Bioengineers in Plastic Debris Trapping. Tese de Mestrado, Universidade do Algarve. 2019. Available online: http://hdl.handle.net/10400.1/15029 (accessed on 11 May 2023).
  39. Frias, J.P.; Gago, J.; Otero, V.; Sobral, P. Microplastics in coastal sediments from Southern Portuguese shelf waters. Mar. Environ. Res. 2016, 114, 24–30. [Google Scholar] [CrossRef]
  40. Piñon-Colin, T.J.; Rodriguez-Jimenez, R.; Pastrana-Corral, M.A.; Rogel-Hernandez, E.; Wakida, F.T. Microplastics on sandy beaches of the Baja California Peninsula, Mexico. Mar. Pollut. Bull. 2018, 131, 63–71. [Google Scholar] [CrossRef] [PubMed]
  41. Laglbauer, B.J.L.; Franco-Santos, R.M.; Andreu-Cazenave, M.; Brunelli, L.; Papadatou, M.; Palatinus, A.; Grego, M.; Deprez, T. Macrodebris and microplastics from beaches in Slovenia. Mar. Pollut. Bull. 2014, 89, 356–366. [Google Scholar] [CrossRef] [PubMed]
  42. Mai, L.; Bao, L.J.; Shi, L.; Wong, C.S.; Zeng, E.Y. A review of methods for measuring microplastics in aquatic environments. Environ. Sci. Pollut. Res. Int. 2018, 25, 11319–11332. [Google Scholar] [CrossRef]
  43. Quinn, B.; Murphy, F.; Ewins, C. Validation of density separation for the rapid recovery of microplastics from sediment. Anal. Methods 2017, 9, 1491–1498. [Google Scholar] [CrossRef]
  44. Nel, H.A.; Froneman, P.H. Presence of microplastics in the tube structure of the reef-building polychaete Gunnarea gaimardi (Quatrefages 1848). Afr. J. Mar. Sci. 2018, 40, 87–89. [Google Scholar] [CrossRef]
  45. Desforges, J.P.; Galbraith, M.; Dangerfield, N.; Ross, P.S. Widespread distribution of microplastics in subsurface seawater in the NE Pacific Ocean. Mar. Pollut. Bull. 2014, 79, 94–99. [Google Scholar] [CrossRef]
  46. Minor, E.C.; Lin, R.; Burrows, A.; Cooney, E.M.; Grosshuesch, S.; Lafrancois, B. An analysis of microlitter and microplastics from Lake Superior beach sand and surface-water. Sci. Total Environ. 2020, 744, 140824. [Google Scholar] [CrossRef] [PubMed]
  47. Besley, A.; Vijver, M.G.; Behrens, P.; Bosker, T. A standardized method for sampling and extraction methods for quantifying microplastics in beach sand. Mar. Pollut. Bull. 2017, 114, 77–83. [Google Scholar] [CrossRef] [PubMed]
  48. Batrinescu, G.; Ionescu, I.; Scutariu, R.E.; Chiricuta, B.; Surupaceanu, I. Characterisation of Microplastics from the Effluent of a Municipal Wastewater Treatment Plant and from its Natural Receptor. Mater. Plast. 2020, 58, 47–54. [Google Scholar] [CrossRef]
  49. Liebezeit, G.; Dubaish, F. Microplastics in Beaches of the East Frisian Islands Spiekeroog and Kachelotplate. Bull. Environ. Contam. Toxicol. 2020, 89, 213–217. [Google Scholar] [CrossRef] [PubMed]
  50. Anderson, M. Permanova+ for Primer: Guide to Software and Statistical Methods; PRIMER-E: Auckland, New Zealand, 2008. [Google Scholar]
  51. Stoica, P.; Selén, Y. Model-order selection: A review of information criterion rules. IEEE Signal Process. Mag. 2014, 21, 36–47. [Google Scholar] [CrossRef]
  52. Valentine, P.C. Sediment Classification and the Characterization, Identification, and Mapping of Geologic Substrates for the Glaciated Gulf of Maine Seabed and Other Terrains, Providing a Physical Framework for Ecological Research and Seabed Management. Sci. Investig. Rep. 2019, 5073. [Google Scholar]
  53. Folk, R.L. Petrology of Sedimentary Rocks: Austin, Tex.; Hemphill Publishing: Cedar Hill, TX, USA, 1980; 184p, Available online: http://legacy.lib.utexas.edu/geo/folkready/folkprefrev.html (accessed on 11 May 2023).
  54. Blott, S.J.; Pye, K. Particle dimension scales and classification of sediment types based on particle dimension distributions: Review and recommended procedures. Sedimentology 2012, 59, 2071–2096. [Google Scholar] [CrossRef]
  55. IBM Corp. IBM SPSS Statistics for Windows, Version 28.0; IBM Corp.: Armonk, NY, USA, 2021. [Google Scholar]
  56. Zhang, H. Transport of microplastics in coastal seas. Estuar. Coast. Shelf Sci. 2017, 199, 74–86. [Google Scholar] [CrossRef]
  57. Wang, J.; Peng, J.; Tan, Z.; Gao, Y.; Zhan, Z.; Chen, Q.; Cai, L. Microplastics in the surface sediments from the Beijiang River littoral zone: Composition, abundance, surface textures and interaction with heavy metals. Chemosphere 2017, 171, 248–258. [Google Scholar] [CrossRef]
  58. Herrera, A.; Raymond, E.; Martínez, I.; Álvarez, S.; Canning-Clode, J.; Gestoso, I.; Pham, C.K.; Ríos, N.; Rodríguez, Y.; Gómez, M. First evaluation of neustonic microplastics in the Macaronesian region, NE Atlantic. Mar. Pollut. Bull. 2020, 153, 110999. [Google Scholar] [CrossRef] [PubMed]
  59. Murphy, F.; Ewins, C.; Carbonnier, F.; Quinn, B. Wastewater Treatment Works (WwTW) as a Source of Microplastics in the Aquatic Environment. Environ. Sci. Technol. 2016, 50, 5800–5808. [Google Scholar] [CrossRef]
  60. Napper, I.E.; Thompson, R.C. Release of synthetic microplastic plastic fibers from domestic washing machines: Effects of fabric type and washing conditions. Mar. Pollut. Bull. 2016, 112, 39–45. [Google Scholar] [CrossRef]
  61. Andrady, A.L. Microplastics in the marine environment. Mar. Pollut. Bull. 2011, 62, 1596–1605. [Google Scholar] [CrossRef]
  62. Wright, L.S.; Napper, I.E.; Thompson, R.C. Potential microplastic release from beached fishing gear in Great Britain’s region of highest fishing litter density. Mar. Pollut. Bull. 2021, 173, 113115. [Google Scholar] [CrossRef] [PubMed]
  63. Newman, S.; Watkins, E.; Farmer, A.; Brink, P.T.; Schweitzer, J.P. The economics of marine litter. Mar. Anthropog. Litter 2015, 2015, 367–394. [Google Scholar]
  64. Graca, B.; Szewc, K.; Zakrzewska, D.; Dołęga, A.; Szczerbowska-Boruchowska, M. Sources and fate of microplastics in marine and beach sediments of the Southern Baltic Sea-a preliminary study. Environ. Sci. Pollut. Res. Int. 2017, 24, 7650–7661. [Google Scholar] [CrossRef]
  65. Wardrop, P.; Shimeta, J.; Nugegoda, D.; Morrison, P.; Miranda, A.; Tang, M.; Clarke, B. Chemical Pollutants Sorbed to Ingested Microbeads from Personal Care Products Accumulate in Fish. Environ. Sci. Technol. 2016, 50, 4037–4044. [Google Scholar] [CrossRef] [PubMed]
  66. Mishra, S.; Rath, C.C.; Das, A.P. Marine microfiber pollution: A review on present status and future challenges. Mar. Pollut. Bull. 2019, 140, 188–197. [Google Scholar] [CrossRef] [PubMed]
  67. Wu, W.; Yang, J.; Criddle, C.S. Microplastics pollution and reduction strategies. Front. Environ. Sci. Eng. 2016, 11, 1–4. [Google Scholar] [CrossRef]
  68. So, W.K.; Chan, K.; Not, C. Abundance of plastic microbeads in Hong Kong coastal water. Mar. Pollut. Bull. 2018, 133, 500–505. [Google Scholar] [CrossRef] [PubMed]
  69. Cózar, A.; Echevarría, F.; González-Gordillo, J.I.; Irigoien, X.; Úbeda, B.; Hernández-León, S.; Palma, Á.T.; Navarro, S.; García-de-Lomas, J.; Ruiz, A.; et al. Plastic debris in the open ocean. Proc. Natl. Acad. Sci. USA 2014, 111, 10239–10244. [Google Scholar] [CrossRef]
  70. Dodson, G.Z.; Shotorban, A.K.; Hatcher, P.G.; Waggoner, D.C.; Ghosal, S.; Noffke, N. Microplastic fragment and fiber contamination of beach sediments from selected sites in Virginia and North Carolina, USA. Mar. Pollut. Bull. 2020, 151, 110869. [Google Scholar] [CrossRef]
  71. Chubarenko, I.; Stepanova, N. Microplastics in sea coastal zone: Lessons learned from the Baltic amber. Environ. Pollut. 2017, 224, 243–254. [Google Scholar] [CrossRef]
  72. Lincoln, S.; Andrews, B.; Birchenough, S.N.R.; Chowdhury, P.; Engelhard, G.H.; Harrod, O.; Pinnegar, J.K.; Townhill, B.L. Marine litter and climate change: Inextricably connected threats to the world’s oceans. Sci. Total Environ. 2022, 837, 155709. [Google Scholar] [CrossRef] [PubMed]
  73. Firdaus, M.; Trihadiningrum, Y.; Lestari, P. Microplastic pollution in the sediment of Jagir Estuary, Surabaya City, Indonesia. Mar. Pollut. Bull. 2020, 150, 110790. [Google Scholar] [CrossRef] [PubMed]
  74. Cincinelli, A.; Scopetani, C.; Chelazzi, D.; Martellini, T.; Pogojeva, M.; Slobodnik, J. Microplastics in the Black Sea sediments. Sci. Total Environ. 2021, 760, 143898. [Google Scholar] [CrossRef] [PubMed]
  75. Filgueiras, A.V.; Gago, J.; Campillo, J.A.; León, V.M. Microplastic distribution in surface sediments along the Spanish Mediterranean continental shelf. Environ. Sci. Pollut. Res. 2019, 26, 21264–21273. [Google Scholar] [CrossRef] [PubMed]
  76. Liu, R.; Tan, Z.; Wu, X.; Liu, Y.; Chen, Y.; Fu, J.; Ou, H. Modifications of microplastics in urban environmental management systems: A review. Water Res. 2022, 222, 118843. [Google Scholar] [CrossRef]
  77. Mani, T.; Burkhardt-Holm, P. Seasonal microplastics variation in nival and pluvial stretches of the Rhine River—From the Swiss catchment towards the North Sea. Sci. Total Environ. 2019, 707, 135579. [Google Scholar] [CrossRef] [PubMed]
  78. He, B.; Smith, M.; Egodawatta, P.; Ayoko, G.A.; Rintoul, L.; Goonetilleke, A. Dispersal and transport of microplastics in river sediments. Environ. Pollut. 2021, 279, 116884. [Google Scholar] [CrossRef]
  79. Rahman, S.M.A.; Robin, G.S.; Momotaj, M.; Uddin, J.; Siddique, M.A.M. Occurrence and spatial distribution of microplastics in beach sediments of Cox’s Bazar, Bangladesh. Mar. Pollut. Bull. 2020, 160, 111587. [Google Scholar] [CrossRef] [PubMed]
  80. Wang, S.; Chen, H.; Zhou, X.; Tian, Y.; Lin, C.; Wang, W.; Zhou, K.; Zhang, Y.; Lin, H. Microplastic abundance, distribution and composition in the mid-West Pacific Ocean. Environ. Pollut. 2020, 264, 114125. [Google Scholar] [CrossRef]
  81. Ríos, N.; Frias, J.; Rodríguez, Y.; Carriço, R.; Garcia, S.M.; Juliano, M.; Pham, C.K. Spatio-temporal variability of beached macro-litter on remote islands of the North Atlantic. Mar. Pollut. Bull. 2018, 133, 304–311. [Google Scholar] [CrossRef]
  82. Calado, L.; Rodrigues, A.; Silveira, P.; Dentinho, T. Rural tourism associated with agriculture as an economic alternative for the farmers. Instituto Politécnico de Leira. Eur. J. Tour. Hosp. Recreat. 2011, 2, 155–174. [Google Scholar]
  83. Brahney, J.; Hallerud, M.; Heim, E.; Hahnenberger, M.; Sukumaran, S. Plastic rain in protected areas of the United States. Science 2020, 368, 1257–1260. [Google Scholar] [CrossRef] [PubMed]
  84. Shent, H.; Pugh, R.J.; Forssberg, E. A review of plastic waste recycling and the flotation of plastics. Resour. Conserv. Recycl. 1999, 25, 85–109. [Google Scholar] [CrossRef]
  85. Woodall, L.C.; Sanchez-Vidal, A.; Canals, M.; Paterson, G.L.J.; Coppock, R.; Sleight, V.; Calafat, A.; Rogers, A.D.; Narayanaswamy, B.E.; Thompson, R.C. The deep sea is a major sink for microplastic debris. R. Soc. Open. Sci. 2014, 1, 140317. [Google Scholar] [CrossRef]
  86. Pham, C.K.; Rodríguez, Y.; Dauphin, A.; Carriço, R.; Frias, J.P.G.L.; Vandeperre, F.; Otero, V.; Santos, M.R.; Martins, H.R.; Bolten, A.B.; et al. Plastic ingestion in oceanic-stage loggerhead sea turtles (Caretta caretta) off the North Atlantic subtropical gyre. Mar. Pollut. Bull. 2017, 121, 222–229. [Google Scholar] [CrossRef] [PubMed]
  87. Xia, F.; Yao, Q.; Zhang, J.; Wang, D. Effects of seasonal variation and resuspension on microplastics in river sediments. Environ. Pollut. 2021, 286, 117403. [Google Scholar] [CrossRef] [PubMed]
  88. Ghinassi, M.; Michielotto, A.; Uguagliati, F.; Zattin, M. Mechanisms of microplastics trapping in river sediments: Insights from the Arno river (Tuscany, Italy). Sci. Total Environ. 2023, 866, 161273. [Google Scholar] [CrossRef]
  89. Klein, S.; Worch, E.; Knepper, T.P. Occurrence and Spatial Distribution of Microplastics in River Shore Sediments of the Rhine-Main Area in Germany. Environ. Sci. Technol. 2015, 49, 6070–6076. [Google Scholar] [CrossRef]
  90. Costa, M.; Barletta, M. Microplastics in coastal and marine environments of the western tropical and sub-tropical Atlantic Ocean. Environ. Sci. Process. Impacts 2015, 17, 1868–1879. [Google Scholar] [CrossRef]
  91. Bernardo, F.; Garcia, P.; Rodrigues, A. Air Quality at Ponta Delgada City (Azores) Is Unaffected so Far by Growing Cruise Ship Transit in Recent Years. Atmosphere 2023, 14, 188. [Google Scholar] [CrossRef]
  92. Folbert, M.E.F.; Corbin, C.; Löhr, A.J. Sources and Leakages of Microplastics in Cruise Ship Wastewater. Front. Mar. Sci. 2022, 9, 900047. [Google Scholar] [CrossRef]
  93. Nava, V.; Chandra, S.; Aherne, J.; Alfonso, M.B.; Antão-Geraldes, A.M.; Attermeyer, K.; Bao, R.; Bartrons, M.; Berger, S.A.; Biernaczyk, M.; et al. Plastic debris in lakes and reservoirs. Nature 2023, 619, 317–322. [Google Scholar] [CrossRef] [PubMed]
  94. Tibbetts, J.H. The Global Plastic Breakdown How Microplastics Are Shredding Ocean Health. Coast. Sci. Serv. South Carol. South Carol. Sea Grant Consort. 2014, 23, 28. [Google Scholar]
  95. Enders, K.; Lenz, R.; Stedmon, C.A.; Nielsen, T.G. Abundance, size and polymer composition of marine microplastics ≥10 μm in the Atlantic Ocean and their modelled vertical distribution. Mar. Pollut. Bull. 2015, 100, 70–81. [Google Scholar] [CrossRef] [PubMed]
  96. Reineccius, J.; Waniek, J.J. First long-term evidence of microplastic pollution in the deep subtropical Northeast Atlantic. Environ. Pollut. 2022, 305, 119302. [Google Scholar] [CrossRef] [PubMed]
  97. Lusher, A.L.; Burke, A.; O’Connor, I.; Officer, R. Microplastic pollution in the Northeast Atlantic Ocean: Validated and opportunistic sampling. Mar. Pollut. Bull. 2014, 88, 325–333. [Google Scholar] [CrossRef]
  98. Chen, H.; Jia, Q.; Zhao, X.; Li, L.; Nie, Y.; Liu, H.; Ye, J. The occurrence of microplastics in water bodies in urban agglomerations: Impacts of drainage system overflow in wet weather, catchment land-uses, and environmental management practices. Water Res. 2020, 183, 116073. [Google Scholar] [CrossRef]
  99. Vermeiren, P.; Lercari, D.; Muñoz, C.C.; Ikejima, K.; Celentano, E.; Jorge-Romero, G.; Defeo, O. Sediment grain size determines microplastic exposure landscapes for sandy beach macroinfauna. Environ. Pollut. 2021, 286, 117308. [Google Scholar] [CrossRef]
  100. Merga, L.B.; Redondo-Hasselerharm, P.E.; Van den Brink, P.J.; Koelmans, A.A. Distribution of microplastic and small macroplastic particles across four fish species and sediment in an African lake. Sci. Total Environ. 2020, 741, 140527. [Google Scholar] [CrossRef]
  101. Rodrigues, D.; Antunes, J.; Pais, J.; Pequeno, J.; Caetano, P.S.; Rocha, F.; Sobral, P.; Costa, M.H. Distribution patterns of microplastics in subtidal sediments from the Sado river estuary and the Arrábida marine park, Portugal. Front. Environ. Sci. 2022, 10, 998513. [Google Scholar] [CrossRef]
Figure 1. São Miguel Island with sampled locations and respective island sectors (W—west, N—north, E—east, and S—south). Areas (A1–A8) are represented by black circles divided by 4 sites: upstream (U), downstream (D), beach (B), and underwater marine environment (UW). Beaches (B1–B15) are represented by red crosses.
Sustainability 16 04103 g001
Figure 2. Mean abundance ± SD (A) and dimension ± SD (B) of each category of microplastics sampled, and all categories, in each site, independent of sectors: upstream (U), downstream (D), beach (B), and underwater marine environment (UW).
Sustainability 16 04103 g002aSustainability 16 04103 g002b
Figure 3. Mean abundance ± SD (A) and dimension ± SD (B), of microplastics sampled in island sectors in each site: upstream (U), downstream (D), beach (B), and underwater marine environment (UW). Black bars represent the total samples for each sector.
Sustainability 16 04103 g003
Figure 4. Mean abundance ± SD (A) and dimension ± SD (B) of each category of microplastics sampled in island areas (A1–A8) in each sector. Black bars represent the total samples for each area.
Sustainability 16 04103 g004
Figure 5. Mean abundance ± SD (A) and dimension ± SD (B) of each category of microplastics sampled in island beaches (B1–B15) in each sector. Black bars represent the total samples for each beach.
Sustainability 16 04103 g005
Figure 6. Population density per parish of São Miguel, Azores, with respective caption. Source: Geografia/FCT_UAç.
Sustainability 16 04103 g006
Table 1. Results of permutational multivariate analyses of variance (PERMANOVA) testing the effect of sites (UW, B, D, and U) nested in areas, and areas (B1–B15) nested in island sectors on the abundance and dimension of microplastics.
VariableSource of
Variation
dfSSMSPseudo-FpComponents of Variation
AbundanceSector32638.3879.440.501510.791-
Areas (Sector)59230.51846.12.65920.01171.535
Sites (Areas (Sector))2419,158798.235.40460.001130.97
Residual12718,757147.69--147.69
Total15950,154----
DimensionSector30.711780.237260.535720.806-
Areas (Sector)52.2980.45961.66310.1050.011381
Sites (Areas (Sector))247.22660.301112.05960.0010.031187
Residual12718.5670.1462--0.1462
Total15929.252---
Table 2. Results from the final GLMM models explaining microplastic variability in the study area, including significant factors, statistical estimates, and p-value.
ParameterFactorsTest (Wald)p-Value
AbundanceSites
Granulometry
Proximity to a potential pollution centre
7.929
22.586
8.985
0.047
<0.01
0.011
DimensionSites
Proximity to a potential pollution centre
94.888
24.437
<0.01
<0.01
Table 3. Results of permutational multivariate analyses of variance (PERMANOVA) testing the effect of beaches (B1–B15) nested in island sectors on the abundance and dimension of microplastics.
VariableSource of
Variation
dfSSMSPseudo-Fp (perm.)Components of Variation
AbundanceSector37453.72484.62.91390.114-
Beaches (Sector)119379.3852.667.96010.001149.11
Residual606427107.12--107.12
Total7423260----
DimensionSector31.10420.368080.892990.555-
Beaches (Sector)114.53410.412191.98480.010.040903
Residual6012.460.20767--0.20767
Total7418.099 ---
Disclaimer/Publisher’s Note: The statements, opinions and data contained in all publications are solely those of the individual author(s) and contributor(s) and not of MDPI and/or the editor(s). MDPI and/or the editor(s) disclaim responsibility for any injury to people or property resulting from any ideas, methods, instructions or products referred to in the content.

