Article

Study on Carbon Stock and Sequestration Potential of Typical Grasslands in Northern China: A Case Study of Wuchuan County

1
School of Soil and Water Conservation, Beijing Forestry University, Beijing 100091, China
2
Inner Mongolia Urban Renewal Research and Development Co., Ltd., Hohhot 010000, China
3
Beijing Green Source Environment Planning & Design Institute Co., Ltd., Beijing 100081, China
*
Author to whom correspondence should be addressed.
Sustainability 2024, 16(10), 4053; https://doi.org/10.3390/su16104053
Submission received: 28 March 2024 / Revised: 30 April 2024 / Accepted: 9 May 2024 / Published: 13 May 2024

Abstract

:
Grasslands in China cover an extensive area and rank second globally. They constitute the second-largest carbon reservoir in China after forests, holding about 8% of the total carbon stock of the world’s grassland ecosystems. This study focuses on the grasslands of Wuchuan County, Inner Mongolia Autonomous Region of Northern China. This study compares the carbon stock and density characteristics across different communities based on plot survey and GIS vector data. It also anticipates the region’s carbon sequestration potential using biomass-to-carbon conversion and extrapolation methods. The findings indicate that (1) the total carbon stock in the study area is 1805.65 × 104 tons with an average carbon density of 77.50 t/ha. The distribution of carbon density and stock follows a pattern: soil layer > herbaceous layer > litter layer; (2) the Stipa krylovii + Leymus chinensis community exhibits the highest carbon stock and density; (3) there is a positive correlation between herbaceous carbon density and NPP (Net Primary Productivity) values in the study area; and (4) the overall carbon stock in the region is projected to increase, with growth rates accelerating annually. These results contribute to our understanding of the formation, turnover, stability maintenance, and regulation mechanisms of grassland soil organic carbon. Furthermore, they hold significant implications for enhancing the carbon sequestration capacity of ecosystems.

1. Introduction

Grassland ecosystems are among the most widely distributed terrestrial ecosystems globally, contributing to 10% to 30% of global soil organic carbon (SOC) reserves and playing a critical role in the soil carbon cycle [1,2]. Approximately half of the world’s grasslands are experiencing varying degrees of degradation due to climate change and human activities, leading to an accelerated loss of grassland SOC, adversely affecting livestock production, and thereby posing a threat to global climate stability and food security [3]. Therefore, the restoration of grassland SOC levels is not only vital for mitigating global climate change but also a necessary prerequisite and guarantee for the sustainable development of grasslands [4].
Existing research has explored carbon sequestration capabilities, carbon sink/source properties, and their responses to climate change in major carbon reservoirs at various scales (worldwide, Northern Hemisphere, China, river basins, and provinces). Studies on the carbon flux of grassland ecosystems in China are mainly concentrated on typical grasslands, alpine grasslands, etc. [5]. Ma Wenhong et al. [6] conducted field measurement studies showing that the total vegetation carbon stock of the temperate grasslands in the Inner Mongolia Autonomous Region is approximately 226 ± 13.27 TgC, with the typical grasslands holding the largest carbon stock. Zhao Wei et al. [7] found that the grassland soil carbon stock in Inner Mongolia’s agro-pastoral ecotone is 1.8 and 1.5 times higher than forests and croplands, respectively. Yu Zhao et al. [8] observed that the desertification process of desert grasslands emits a substantial amount of carbon into the atmosphere, significantly altering the ecosystem’s carbon stock and composition. Bai Yongfei [9] evaluated grassland restoration processes’ carbon sequestration potential through comparative studies of degraded grasslands in China. They also estimated the carbon sequestration potential of the main grassland types in China. Tao Feng et al. [10] systematically assessed the relative contributions of various soil carbon cycling processes to global soil organic carbon stock and found that microbial processes play a key role in soil carbon stock. Woodall [11] conducted surveys using monitoring networks in the Eastern United States, confirming that land use change is a key factor affecting carbon sinks. Related studies have used clustering methods to survey carbon sinks and sources in various provinces and cities in China. Regression analyses have also been used to explore the factors affecting these sinks and sources, which vary significantly by region, with agricultural land having greater carbon sequestration potential than grasslands [12].
On the other hand, as the largest terrestrial ecosystem, grassland ecosystems are rich in carbon stock and contribute about 20% of global vegetation plant Net Primary Productivity (NPP) [13]. NPP directly reflects plants’ carbon fixation efficiency since it represents the portion of CO2 fixed into organic matter through photosynthesis per unit time and area, minus respiration [14]. NPP, as a major influencing factor of carbon source/sink changes in ecosystems, can affect microbial residue carbon and, consequently, grassland carbon stock [15]. Its growth intensity is considered one of the key factors affecting carbon sequestration potential [16]. In this study, the carbon storage and carbon density were calculated based on the measured data of 116 sample points. The carbon sequestration potential of grassland in the study area was predicted using GIS data. The aim was to provide a theoretical basis for grassland soil improvement, follow-up grassland ecological engineering construction, and assess scientific management in Inner Mongolia.
In recent years, most scholars have studied the spatiotemporal distribution of carbon stock and the assessment of carbon stock in the grasslands of certain parts of Inner Mongolia [17,18,19]. However, research on the actual measurement and calculation of carbon stock and carbon sequestration potential in typical Inner Mongolia grasslands is still insufficient. Inner Mongolia’s Wuchuan County grasslands are located in the middle of Yinshan Mountain’s northern slope. The regional zonal vegetation types are desert and typical steppes, which represent common ecological types of mid-latitude semi-arid temperate grasslands in Inner Mongolia. Due to its relatively vast and representative type of grassland [20], Wuchuan County was chosen as the research object of this study. The carbon density and carbon stock performance of the soil layer and aboveground biomass were verified by sampling the aboveground biomass, root systems, and soil layers in typical sample plots. The grassland carbon stock was then calculated within the sample plots and extrapolated at the county scale.

2. Overview of the Study Area and Methods

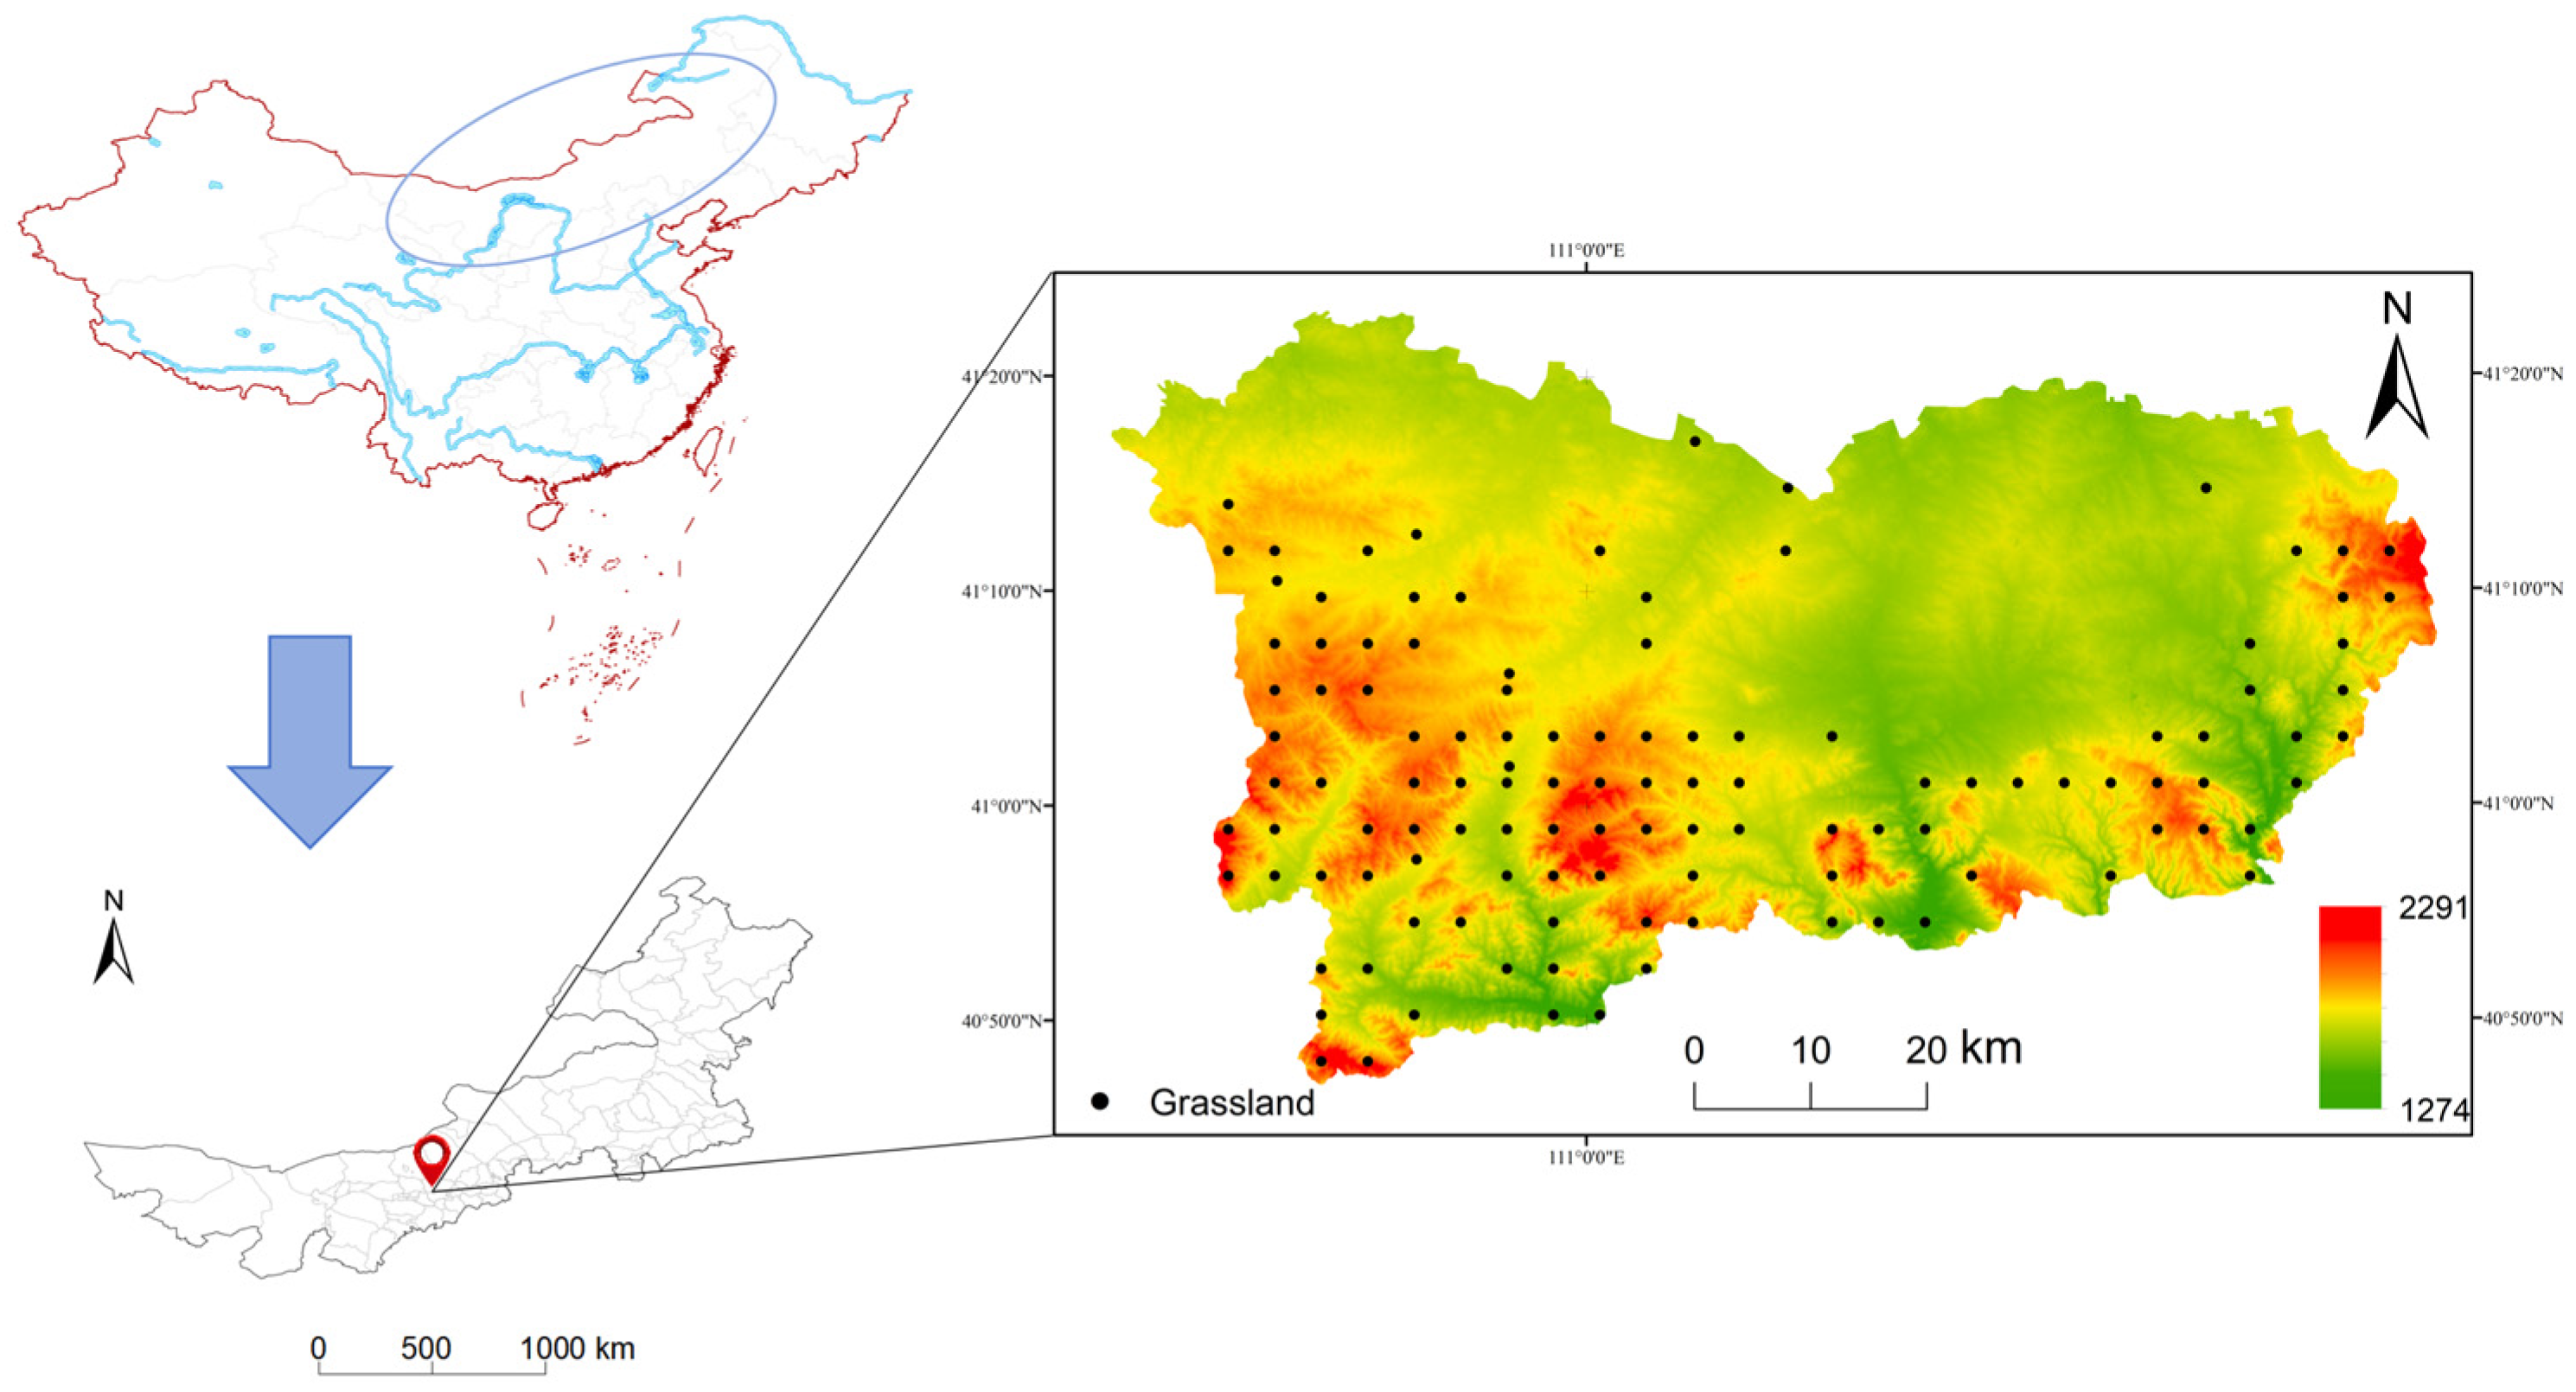
2.1. Overview of the Study Area

In the Inner Mongolia Autonomous Region, Wuchuan County in Hohhot City is situated at the northern foot of the Yinshan Mountains, covering an area of 4885 km2, with grasslands spanning 2349.39 km2. The region experiences a temperate continental monsoon climate. The recorded maximum temperature reaches 36.2 °C, and the minimum plummets to −37.0 °C, with an annual average temperature of 3.0 °C. The average frost-free period is around 124 days, with an average annual precipitation of 354.1 mm concentrated between June and September. The soils are predominantly loamy and sandy with a significant sandy component. The primary vegetation includes typical steppe and desert steppe types.

2.2. Methods

Employing data from the “Third National Land Survey” overlaid with Inner Mongolia grassland census information, grassland boundaries were delineated using remote sensing imagery. Kilometric grids (4 × 4 km) were designated as sampling units, and alternative sample points were selected at the central point of the sampling units and at the intersections of patches. A total of 116 survey sample points were further chosen based on field investigations and uniform sampling criteria. At each sample point, three standard quadrats of 20 × 20 m (hereafter referred to as large quadrats) were established, with a minimum separation of 5 m between them. Essential information such as latitude and longitude, altitude, vegetation type, herbaceous coverage, dominant grass species, litter condition, and grassland disaster status was recorded. On the diagonal of the large quadrat, three smaller quadrats of 1 × 1 m were used to examine the herbaceous and litter layers. Based on the survey, sample points were categorized into seven community types, including 43 points for Stipa krylovii + Leymus chinensis communities, 32 points for Artimisia frigida + Stipa krylovii, 20 points for Stipa krylovii + Cleistogenes squarrosa, 11 points for Salsola collina + Artimisia frigida, 4 points for Artimisia frigida + Cleistogenes squarrosa, 4 points for Thymus mongolicus + Artimisia frigida, and 2 points for Thymus mongolicus + Stellera chamaejasme.
Herbaceous biomass and litter were harvested and sealed in plastic bags, and then transported to the laboratory to measure their dry weight and obtain biomass data. Soil profiles 1 m deep were excavated at the corresponding points of the small quadrats. Soil samples were collected from 0~20 cm, 20~50 cm, and 50~100 cm soil layers. After removing impurities, soil organic matter was determined using the potassium dichromate volumetric method. Sampling was conducted from July to October 2022. Figure 1 shows the topographic map of the research area and the distribution of sample points.

2.3. Data Processing and Analysis

2.3.1. Calculation of Grassland Carbon Density and Carbon Stock

Combining data from the “Third National Land Survey” and field survey results, the plot layers are classified according to vegetation type. The biomass was estimated through conversion and expansion methods, and then the carbon density and carbon stock of each grassland type were calculated based on vegetation coverage, carbon content rate, root-to-shoot ratio, biomass conversion, and expansion coefficients.
C 1 = B × c F × S
S O C D = 0.58 × C × D × E × ( 1 G ) 100
where
C1—Carbon stock of the aboveground part of the herbaceous layer, unit: tons of carbon (TC);
B—Average aboveground biomass per unit area of the herbaceous layer, unit: tons of dry matter/hectare (t.d.m/hm2);
cF—Average carbon content rate of herbaceous plants, unit: ton of carbon/ton of dry matter(tC/t.d.m);
S—Area, unit: hectare (hm2);
SOCD—Soil organic carbon density, unit: kg/m2;
C—Soil organic matter content, unit: g/kg;
D—Soil bulk density, unit: g/cm3;
E—Soil layer thickness, unit: cm;
G—Volume percentage of gravel with a diameter ≥2 mm.

2.3.2. Analysis of the Relationship between Grassland Herbaceous Carbon Density and NPP

The Net Primary Productivity (NPP) data for vegetation were obtained from the official website of Geospatial Data Cloud (https://www.gscloud.cn/search, accessed on 7 November 2022), with a spatial resolution of 500 m. The calculation principle involves simulating the efficiency of light energy utilization, estimating vegetation maintenance respiration and growth respiration through vegetation biomass, temperature, maintenance respiration coefficients for different vegetation communities, and the temperature relationship to obtain the Net Primary Productivity (NPP) of vegetation. Using ArcGIS 10.8.1 software, raw data were converted into TIF format and reprojected. Subsequently, NPP data for grassland vegetation within the study area for the year 2022 were extracted using a mask. Invalid values were removed, and a scaling factor was applied. Linear correlation analysis of herbaceous carbon density and grassland NPP data within the study area for 2022 was conducted with SPSS and Origin.

2.3.3. Prediction of Grassland Carbon Sequestration Potential

The quality of 20 years of NPP data for grassland vegetation in Wuchuan County from 2000 to 2022 was generally good with medium- to high-quality levels (0–60%) and an average credibility of 95.8%, indicating high reliability. The Hurst exponent (H), which indicates the autocorrelation of a time series and long-term trends inherent in the series, was calculated using Matlab to predict short-term trends of NPP in the study area grasslands. The time series had long-term persistence if 0.5 < H < 1. The closer H approaches 1, the stronger the persistence is. The time series is random if H = 0.5. Long-term anti-persistence was indicated if 0 < H < 0.5, suggesting that the overall future trend would contradict the past trend. Based on future NPP trends, predictions were made for carbon sequestration potential in the study area.

3. Results

3.1. Analysis of Carbon Stock and Carbon Density of Grasslands

The study area’s grasslands had a total carbon stock of 1805.65 × 104 tons, exhibiting an average carbon density of 77.50 t/ha. The grasslands’ total aboveground carbon stock amounted to 106.04 × 10⁴ tons, featuring a biomass carbon density of 4.55 t/ha, a herbaceous biomass carbon density of 4.46 t/ha, and a litter biomass carbon density of 0.1 t/ha. The soil carbon stock totaled 1699.61 × 104 tons. Table 1 shows the carbon stock and density for each soil layer in more detail. The soil layer spanning 20–50 cm exhibited the highest carbon stock and density (Table 1).
The carbon density of different communities proceeds in the following order from highest to lowest: Stipa krylovii + Leymus chinensis > Stipa krylovii + Cleistogenes squarrosa > Artemisia frigida + Stipa krylovii > Thymus mongolicus + Artemisia frigida > Artemisia frigida + Cleistogenes squarrosa > Thymus mongolicus + Stellera chamaejasme > Salsola collina + Artemisia frigida. The carbon density of the Stipa krylovii + Leymus chinensis community was 88.32 t/ha, while the Salsola collina + Artemisia frigida community had the smallest carbon density at 60.78 t/ha. The Salsola collina + Artemisia frigida, Artemisia frigida + Cleistogenes squarrosa, Thymus mongolicus + Artemisia frigida, and Thymus mongolicus + Stellera chamaejasme communities had below-average carbon densities. The highest values were 1.14 and 1.45 times the average and lowest values, respectively. The carbon stock order in different communities from highest to lowest was Stipa krylovii + Leymus chinensis > Artemisia frigida + Stipa krylovii > Stipa krylovii + Cleistogenes squarrosa > Salsola collina + Artemisia frigida > Artemisia frigida + Cleistogenes squarrosa > Thymus mongolicus + Artemisia frigida > Thymus mongolicus + Stellera chamaejasme. The carbon stock of the Stipa krylovii + Leymus chinensis community was 711.90 × 10⁴ tons, accounting for 39.4% of the total carbon stock (Table 2).

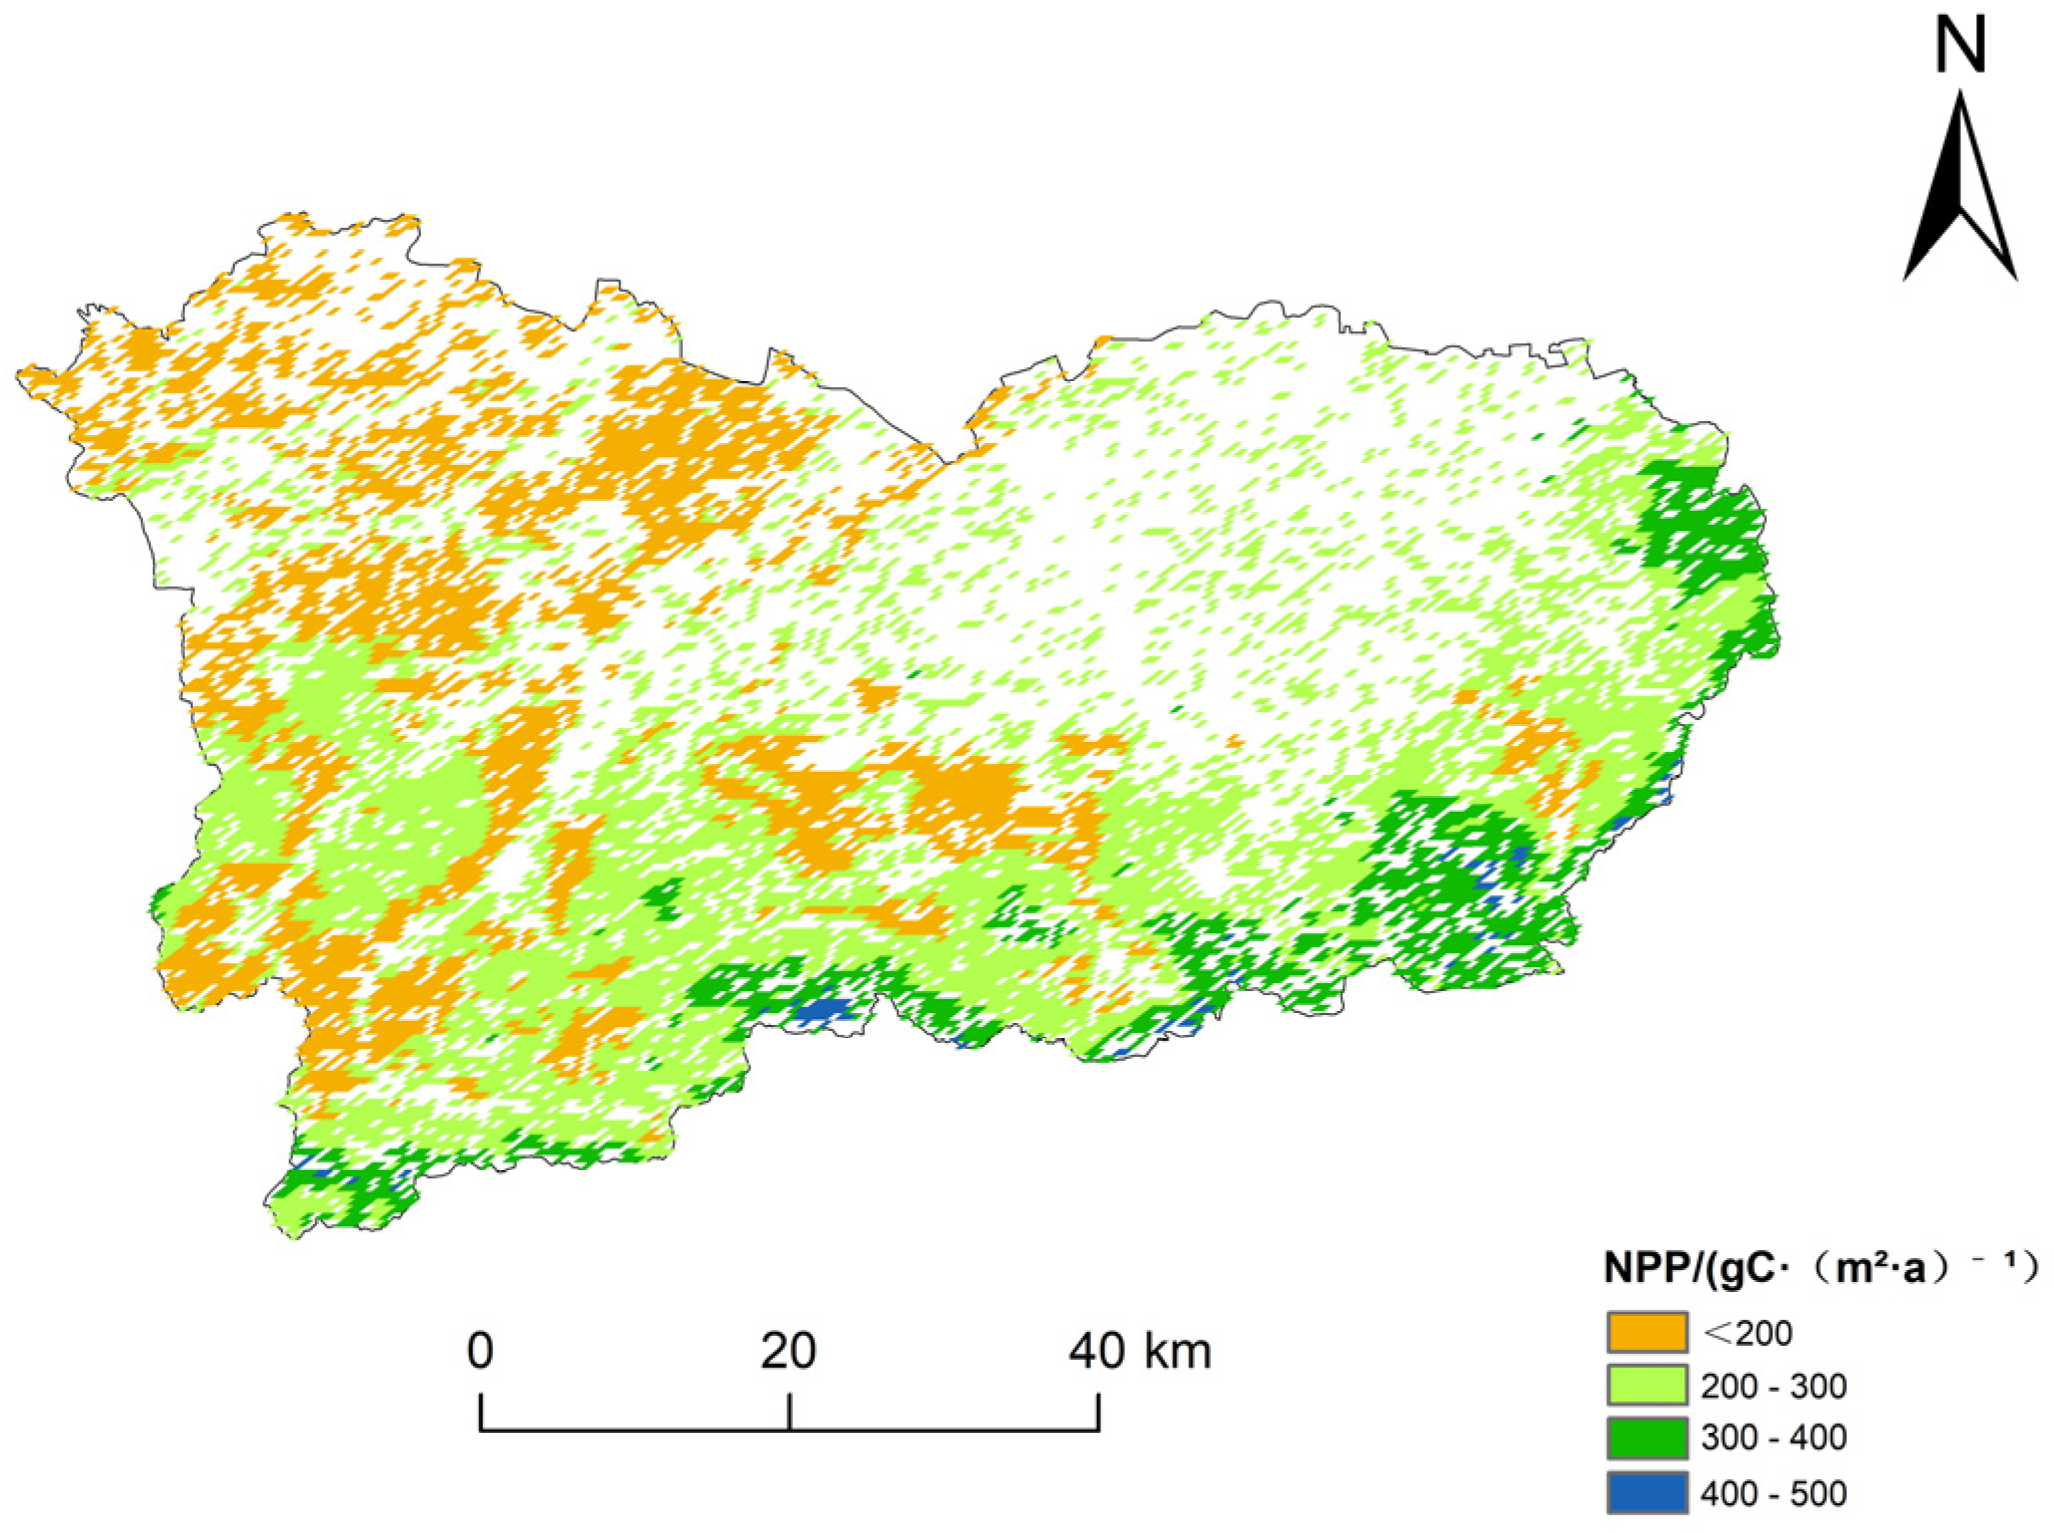
3.2. Spatiotemporal Variation of Grassland NPP

There was a clear difference in NPP spatial distribution within the study area. As shown in Figure 2, after removing the other land uses represented by the white areas on the map, the annual average NPP of grasslands was reclassified. NPP areas between 300 and 400 g C·(m2·a)−1 and between 400 and 500 g C·(m2·a)−1 accounted for 11.8% and 0.1%, respectively, sparsely distributed around the southeastern edge of the study area. Regions with NPP between 200 and 300 g C·(m2·a)−1 were widely distributed, accounting for 54.1% of the study area, and mostly used as natural grasslands with well-preserved vegetation. Areas with NPP values between 0 and 200 g C·(m2·a)−1 constituted 34.0%. The study area was primarily in the western region, characterized by high land use and development intensity, significant vegetation damage, and extensive agricultural and animal husbandry activities impacting most grassland. The annual average vegetation NPP of the study area showed fluctuations during the study period, reaching its maximum and minimum in 2013 and 2001, respectively. The overall trend of total NPP followed the same pattern as the annual average NPP. Regions with vegetation NPP greater than 300 g C·(m2·a)−1 were mainly hilly and mountainous areas with altitudes over a thousand meters, where the grassland coverage was high with abundant precipitation and located at the periphery of the county, with minimal human disturbance. Areas with less than 200 g C·(m2·a)−1 were mostly agro-pasture ecotones, where grazing was allowed before October. Cattle grazing and trampling impact vegetation productivity, resulting in lower NPP values. Overall, since 2013, the annual average NPP has shown a declining trend, consistent with Zhao Xiaoxu’s research findings [21].

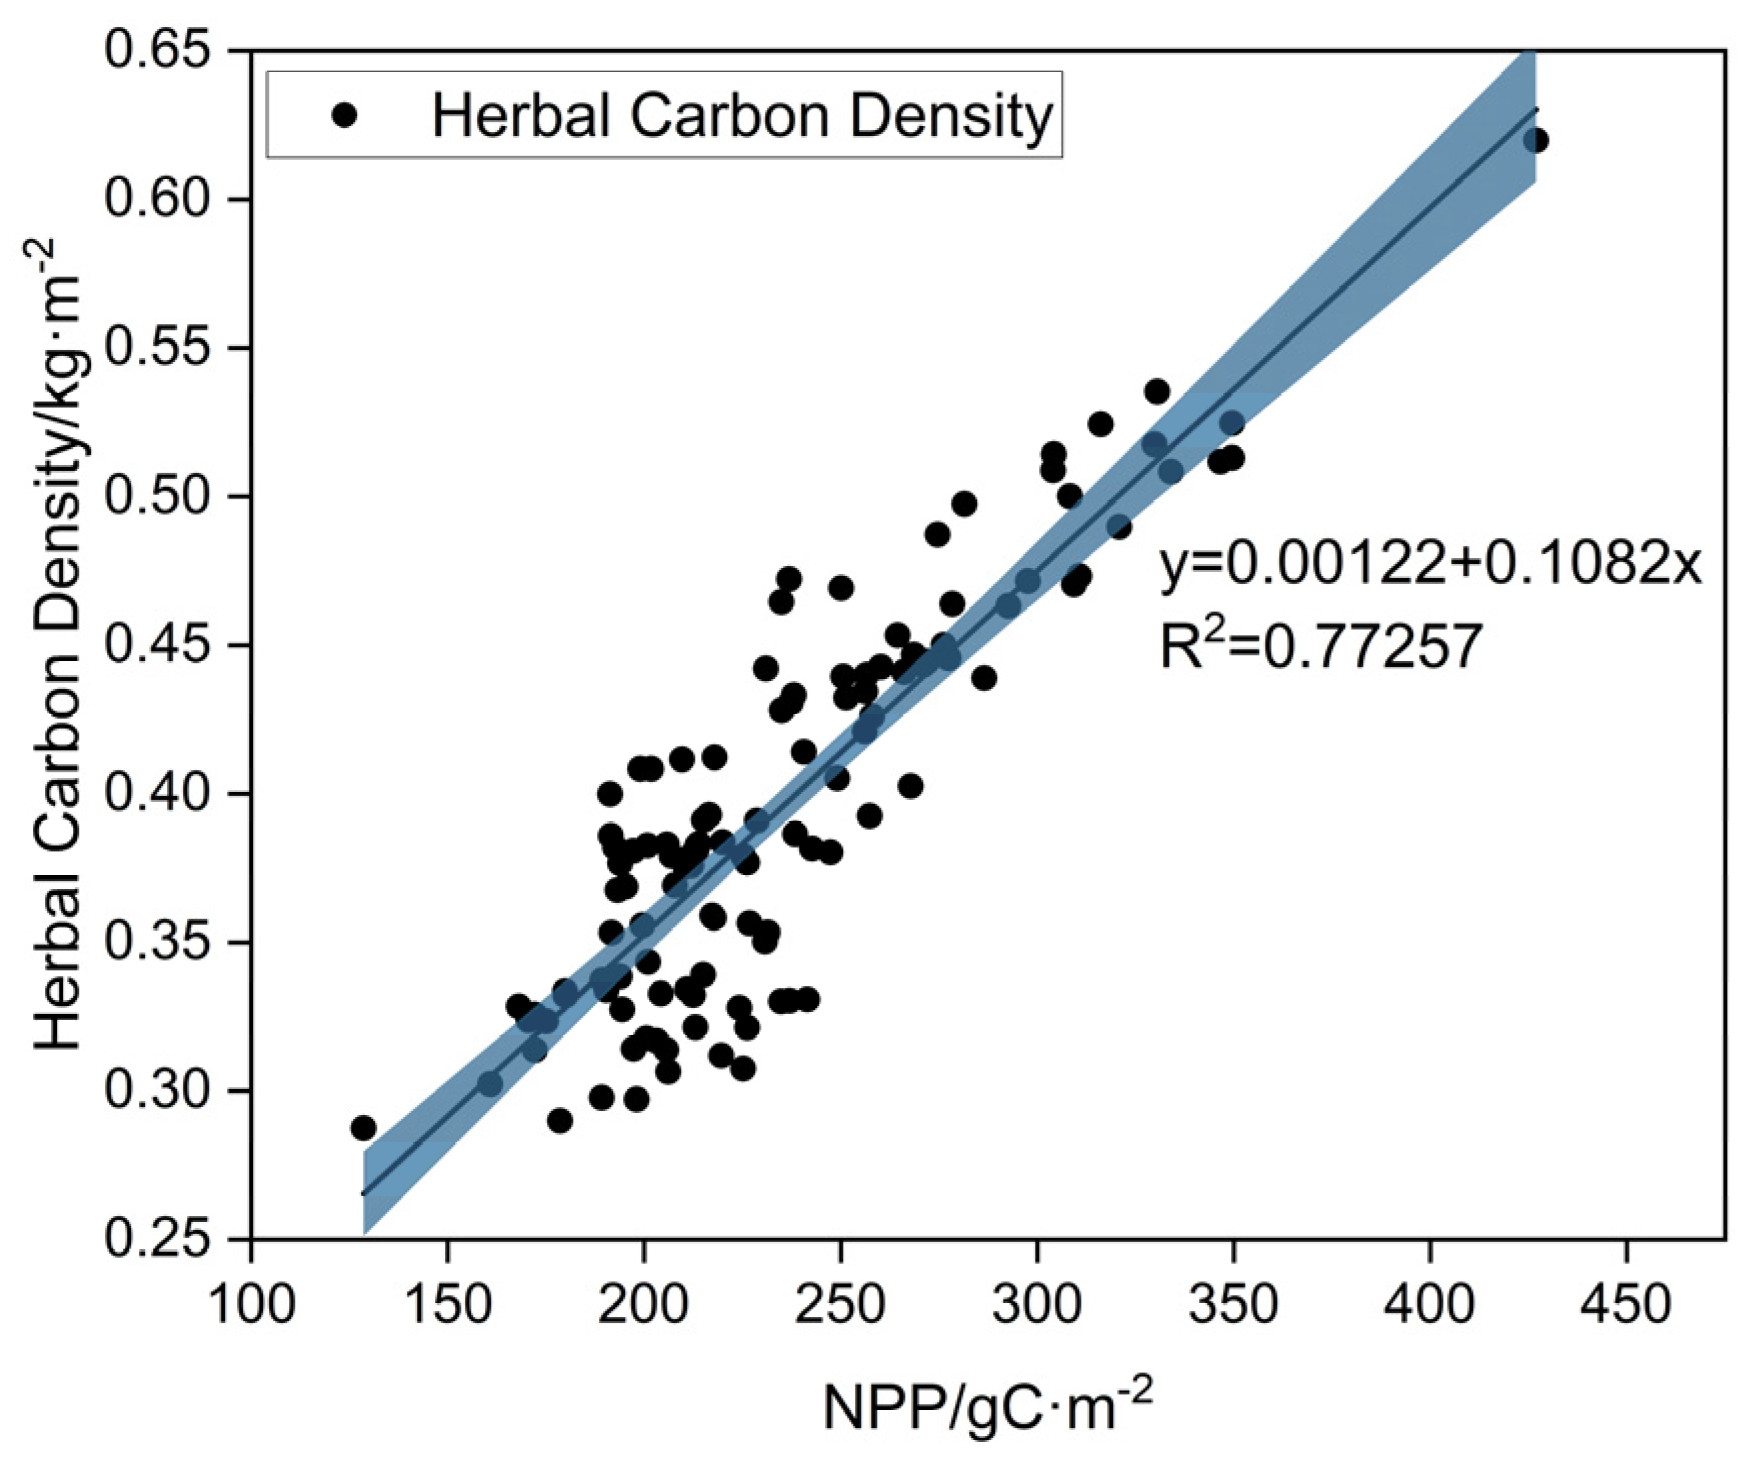
3.3. Correlation Analysis between Herbaceous Carbon Density and NPP

An ecosystem’s NPP represents the amount of organic matter fixed by green plants per unit area over time. Herbaceous carbon density reflects the carbon content of herbaceous plants per unit area, directly indicating carbon content and biomass. After extracting NPP values within the study area for each sampling plot in the year 2022, a correlation analysis was performed with herbaceous carbon density to explore the relationship between the two. As shown in Figure 3, the linear fitting expression between herbaceous carbon density and NPP is y = 0.00122 + 0.1082x, with an R2 = 0.77257 and a 95% confidence interval. When NPP increases by 1 g C/m2, plant carbon density increases by 0.1082 kg/m2 on average. The Y-intercept indicates that when NPP is 0, the starting value of carbon density is 0.00122, which is not a practical scenario since NPP cannot be 0. The R2 value implies that about 77.257% of the variation in carbon density can be explained by changes in NPP, indicating a relatively strong positive correlation between the two.

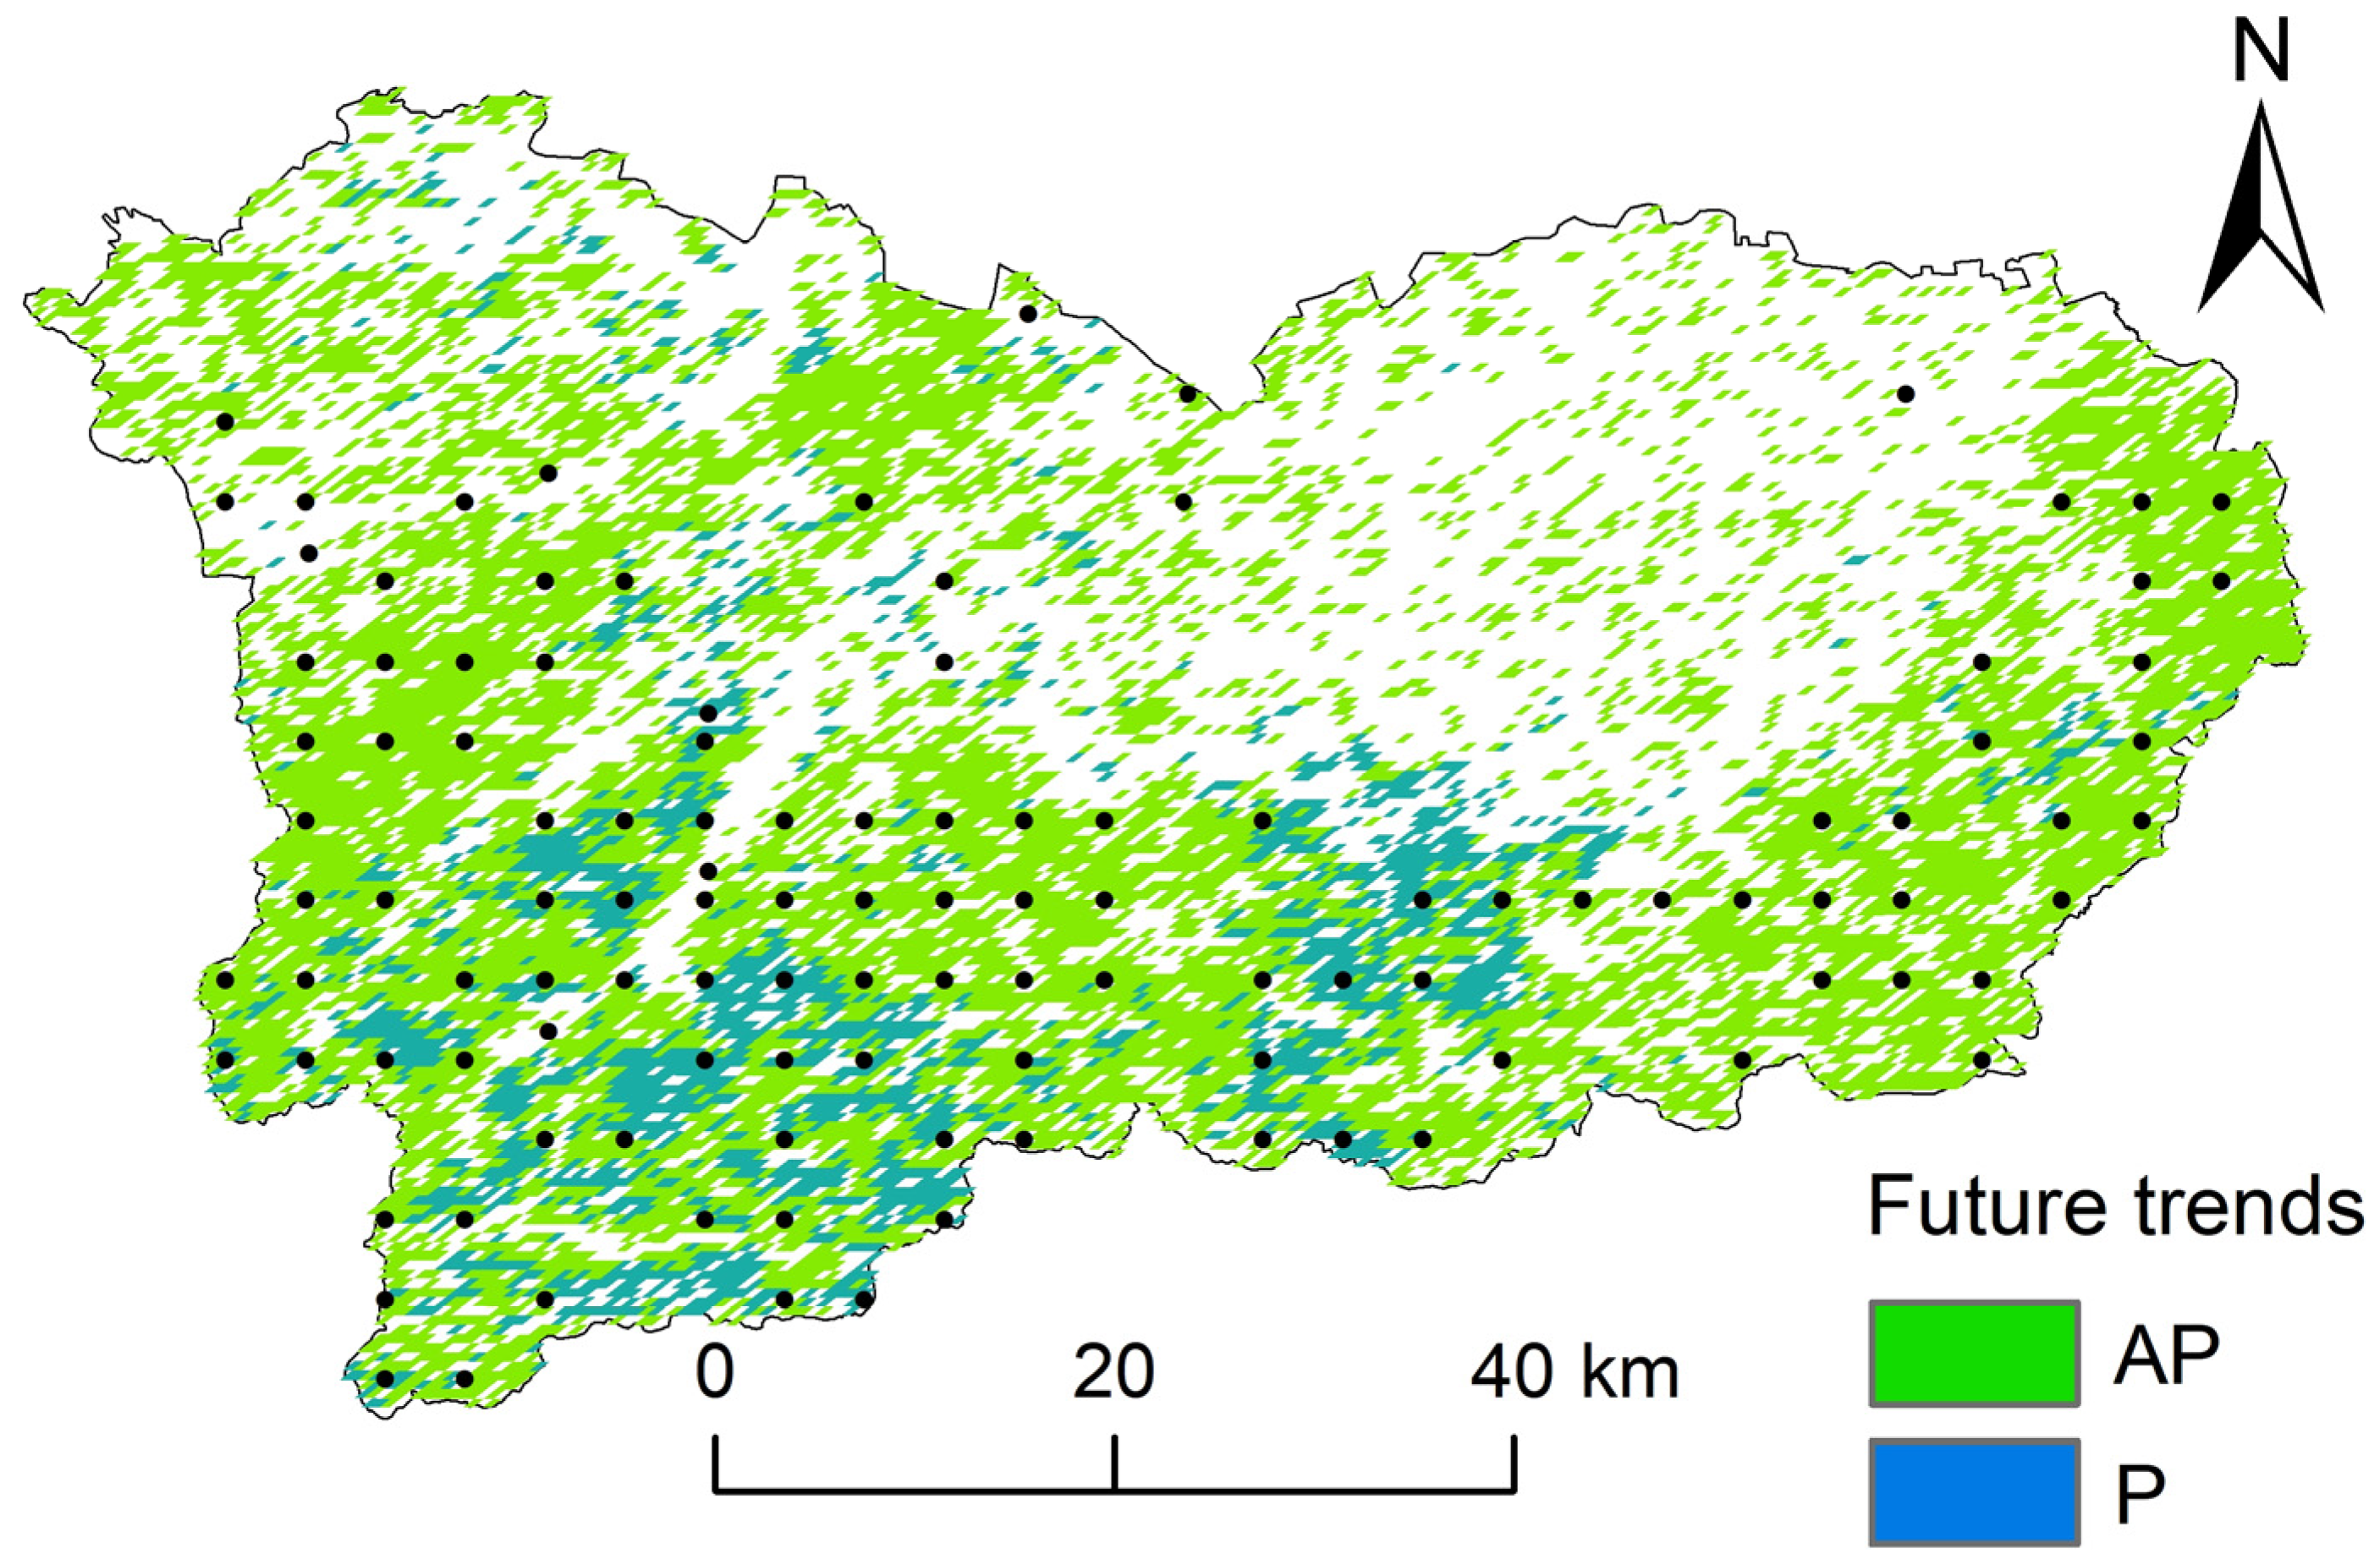
3.4. Vegetation NPP Hurst Exponent and Prediction of Carbon Sequestration Potential

The NPP Hurst exponent for grasslands in the study area over 23 years ranged from 0.29 to 0.68. The results can be divided into two levels: anti-persistence and persistence, using 0.5 as the node (Figure 4). Anti-persistence and persistence proportions were 82.3% and 17.7%, respectively. These findings suggest that the overall state of NPP in the study area’s grasslands is generally anti-persistent; therefore, future trends will contradict those of the past. If past trends (2000–2022) indicated an annual decrease in NPP, then trends for the next 20 years in the study area will likely show an increase in NPP. Spatially, persistence is roughly distributed on the south side of the grasslands, as this area’s grasslands are in the recovery stage, with vegetation cover and biomass increasing annually. Areas that are predominantly anti-persistent may see a future decrease in vegetation NPP. The eastern urban periphery also exhibited anti-persistence, which may be due to the impacts of recent irrational land use around the city.
Overall, future trends for grassland vegetation NPP in the study area are increasing annually. Carbon storage within the study area is also expected to trend upward, with rates increasing over time. As the NPP rate increases, the carbon sequestration potential in the study area will also grow. Therefore, strengthening soil and water conservation efforts within the study area, making rational use of land to enhance the rate of carbon storage increase and carbon turnover time, and further improving the carbon sequestration threshold of the grasslands in the study area is essential.

4. Discussion

4.1. Carbon Stock and Density in the Grassland Ecosystem of the Study Area

Covering a vast expanse, the grasslands in the study area hold a total carbon reserve of 1805.65 × 104 tons, with an average carbon density of 77.50 t/ha. These findings slightly surpass the average carbon density of northern grasslands reported in previous studies [22], yet fall short of the carbon density in the alpine grasslands of the Yellow River Source region, according to Yang Mingxin [23]. The soil organic carbon sequestration potential in the study area was comparatively weak, contributing minimally to regional soil organic carbon stores. This observation aligns with findings by Huang Xinqi [24] and can be partly attributed to the prevalence of semi-arid grasslands in Western Inner Mongolia, which have a lower organic carbon density. Moreover, minimal annual precipitation and relatively high average temperatures in the region are not conducive to organic carbon accumulation. Additionally, many overlapping zones of agriculture and pasturage within the sample sites, affected by grazing, destroy aboveground biomass during the growing season, thereby causing carbon loss [25]. The disturbed soil surface is, consequently, more vulnerable to wind erosion, which can lead to further organic carbon loss.
Grassland carbon stock comprises both aboveground and belowground components, with most carbon stored in the soil. The aboveground biomass carbon density in the study area was 4.55 t/ha, with an aboveground carbon stock of 106.04 ×10⁴ tons, which is approximately 1/16th of the belowground carbon stock. This undervaluation is attributed to local agricultural and pastoral activities. Since soil organic carbon is primarily influenced by vegetation in the vertical direction, vegetation serves as the direct source of soil organic carbon. Soil organic carbon primarily originates from the decomposition and humification of aboveground and belowground biomass by microbes, underscoring the undeniable importance of aboveground carbon stocks. Future efforts should further standardize land use and enhance grasslands’ biodiversity to strengthen their carbon sequestration potential. The soil carbon stock was 1699.61 × 104 tons, with significant variations across different soil layers. The carbon stock in the 50–100 cm soil layer accounted for 36.7% of the total soil carbon stock, demonstrating that deep soil carbon cannot be overlooked [8]. Additionally, the 0–20 cm soil layer exhibited a significant carbon sequestration capacity, highlighting the importance of shallow soils in carbon stock and cycling [26]. The organic carbon density in the 0–20 cm soil layer was 18.69 t/ha, lower than the average carbon density of the same soil layer in Inner Mongolia studied by previous researchers. This reduction is primarily due to the significant impact of grazing in the study area, which decreases surface soil carbon density [27]. Shallow soil, being a site of frequent plant root activity and a hotspot for microbial activity, plays a key role in the decomposition of organic matter and carbon stock [28]. Soil carbon stock beneath grassland vegetation constitutes a significant component of grassland carbon sinks and serves as a crucial reservoir of organic carbon. Grasslands account for approximately 34% of terrestrial carbon stock, with about 90% stored underground in the form of root biomass and soil organic carbon (SOC). Moreover, the stock process is complex and prolonged. Hence, proper land use planning, minimization of human disturbances, maximizing soil carbon sink capacity, and in-depth research into deeper soil carbon stock estimations are crucial.

4.2. Carbon Stock and Density among Different Grassland Community Types

Carbon stock and density in different grassland communities within the region vary significantly. The Stipa krylovii + Leymus chinensis community has higher carbon storage and density due to fertile soil, high species richness, better moisture conditions, and less grazing disturbance in its region. This community’s high carbon density is consistent with previous studies [18]. The Filifolium sibiricum + Artemisia frigida community showed the lowest carbon density, aligning with previous findings [29]. This finding may be due to poor habitat conditions, a lack of water, and the fact that Filifolium sibiricum is a preferred forage for livestock in the north, often leading to overgrazing, sparse growth, and a lower carbon density for this community type.
Many scholars have estimated the grassland carbon density in Inner Mongolia; however, research on the carbon density of grassland vegetation in typical agriculture–pasturage transition zones is scarce. In this study, typical agriculture–pasturage transition zones in Inner Mongolia showed an average grassland vegetative carbon density of 455 g C/m2, contradicting estimates derived from remote sensing imagery by Piao Shilong et al. [30], which indicate an average grassland vegetative carbon density of 315.24 g C/m2 for China. Ma Wenhong et al. [6] found that the grassland vegetative carbon density in Inner Mongolia was 344.00 g C/m2 through field measurements. Consequently, the average total carbon density for grassland community types in Wuchuan County exceeds the levels reported in the aforementioned studies. These findings suggest the study area’s carbon sequestration potential, underscoring the continued need for well-managed land use to exploit its carbon sink properties. Excessive exploitation and undue impact from agricultural and pastoral activities could thwart the carbon balance.

4.3. Correlation between Herbaceous Organic Carbon Density and NPP

The results exhibit a relatively strong positive correlation between NPP and herbaceous carbon density, substantiating the positive relationship between the two within the study region. With an increase in NPP, the carbon stock in the study area augments. Most sample sites within the study region had NPP values ranging between 185 and 250 gC·m−2, with corresponding herbaceous carbon densities between 0.32 and 0.48 kg·m−2. An NPP increase would result in increased biomass, leading to a rise in herbaceous carbon density. In other words, herbaceous plants would exhibit enhanced carbon fixation capabilities. However, the intricate mechanisms underpinning the relationship between herbaceous carbon density and NPP remain elusive and require more in-depth research for clarification.

4.4. Predictions of Carbon Sequestration Potential

Based on the predictive results, the Net Primary Productivity (NPP) of grasslands within the study area is expected to exhibit an overall trend of anti-persistence in the future, with carbon sequestration potential expected to increase over the next 20 years. NPP serves as an important indicator for predicting carbon sequestration potential [31] with reasonable projections. However, it must be noted that the relationship between carbon sequestration potential and NPP is not always linear. Various factors impact carbon fixation, such as soil [32] and plant respiration rates [33]. Moreover, the diversity of plant communities, environmental conditions, and management practices could influence the complexity of the relationship between NPP and carbon sequestration. The prediction method based on the Hurst index does not predict unforeseen events or significant changes in global circumstances, such as severe climate variations or natural disasters, which can substantially affect NPP. To enhance prediction accuracy, models should be periodically updated with new observational data and a diverse array of environmental factors that may influence carbon sequestration potential, including climate, soil quality, and changes in land use.

5. Conclusions

(1)
A survey was conducted on the total carbon stock of grasslands within the study area, revealing a total carbon stock of 18.06 Mt and an average carbon density of 77.50 t/ha. Carbon density and stock were highest in the soil layer, followed by the herbaceous layer, and lowest in the litter layer. Among the communities, the Stipa krylovii + Leymus chinensis community exhibited the highest carbon density, whereas the Potentilla anserina + Artemisia frigida community had the lowest.
(2)
There was a positive correlation between herbaceous carbon density and NPP within the study area.
(3)
The Hurst exponent for NPP suggests that over the next two decades, the Net Primary Productivity of most grasslands in the study area is expected to show a gradual increase, enhancing the grasslands’ overall potential for carbon sequestration. Nevertheless, accounting for human activities and the challenges posed by climate change is essential.

Author Contributions

Formal analysis, Z.T.; Investigation, Z.Y.; Writing—original draft, F.G.; Supervision, G.D.; Project administration, Y.W. All authors have read and agreed to the published version of the manuscript.

Funding

The authors acknowledge the funding supported by the Forest Ecosystem Carbon Storage Monitoring and Evaluation Project of Hohhot (NO. 150101-WWTCG-CS-20220003). Funder: Hohhot Forestry and Grassland Bureau.

Institutional Review Board Statement

Not applicable.

Informed Consent Statement

Not applicable.

Data Availability Statement

Data are contained within the article.

Conflicts of Interest

Author Yanzhe Wang is employed by the company Inner Mongolia Urban Renewal Research and Development Co., Ltd. Author Zhiheng Yang is employed by the company Beijing Green Source Environment Planning & Design Institute Co., Ltd. The remaining authors declare that the research was conducted in the absence of any commercial or financial relationships that could be construed as a potential conflict of interest.

References

  1. Fang, J.Y.; Yang, Y.H.; Ma, W.H.; Mohammat, A.; Shen, H. Ecosystem carbon stocks and their changes in China’s grasslands. Sci. China Life Sci. 2010, 53, 757–765. [Google Scholar] [CrossRef] [PubMed]
  2. Follett, R.F.; Reed, D.A. Soil Carbon Sequestration in Grazing Lands: Societal Benefits and Policy Implications. Rangel. Ecol. Manag. 2010, 63, 4–15. [Google Scholar] [CrossRef]
  3. Bardgett, R.D.; Bullock, J.M.; Lavorel, S.; Manning, P.; Schaffner, U.; Ostle, N.; Chomel, M.; Durigan, G.; Fry, E.L.; Johnson, D.; et al. Combatting global grassland degradation. Nat. Rev. Earth Environ. 2021, 2, 720–735. [Google Scholar] [CrossRef]
  4. Dai, E.; Zhai, R.; Ge, Q.; Wu, X. Detecting the storage and change on topsoil organic carbon in grasslands of Inner Mongolia from 1980s to 2010s. J. Geogr. Sci. 2014, 24, 1035–1046. [Google Scholar] [CrossRef]
  5. Sharkhuu, A.; Plante, A.F.; Enkhmandal, O.; Gonneau, C.; Casper, B.B.; Boldgiv, B.; Petraitis, P.S. Soil and ecosystem respiration responses to grazing, watering and experimental warming chamber treatments across topographical gradients in northern Mongolia. Geoderma 2016, 269, 91–98. [Google Scholar] [CrossRef] [PubMed]
  6. Ma, W.H.; Han, M.; Lin, X.; Ren, Y.; Wang, Z.; Fang, J. Carbon Storage in Vegetation of Grasslands in Inner Mongolia. J. Arid Land Resour. Environ. 2006, 20, 192–195. [Google Scholar] [CrossRef]
  7. Zhao, W.; Hu, Z.; Li, S.; Guo, Q.; Yang, H.; Zhang, T. Impact of land use conversion on soil organic carbon stocks in an agro-pastoral ecotone of Inner Mongolia. J. Geogr. Sci. 2017, 8, 999–1010. [Google Scholar] [CrossRef]
  8. Zhao, Y.; Li, Q.Z.; Wang, P.Y.; Jiang, Q. Changes of organic carbon density in desert steppe ecosystem driven by degradation and restoration. J. Desert Res. 2022, 42, 215–222. [Google Scholar]
  9. Bai, Y.F.; Chen, S.P. Carbon sequestration of Chinese grassland ecosystems: Stock, rate and potential. Chin. J. Plant Ecol. 2018, 42, 261–264. [Google Scholar] [CrossRef]
  10. Tao, F.; Huang, Y.; Hungate, B.A.; Manzoni, S.; Frey, S.D.; Schmidt, M.W.I.; Reichstein, M.; Carvalhais, N.; Ciais, P.; Jiang, L.; et al. Microbial carbon use efficiency promotes global soil carbon storage. Nature 2023, 618, 981–985. [Google Scholar] [CrossRef]
  11. Woodall, C.W.; Walters, B.F.; Coulston, J.W.; D’amato, A.W.; Domke, G.M.; Russell, M.B.; Sowers, P.A. Monitoring Network Confirms Land Use Change is a Substantial Component of the Forest Carbon Sink in the eastern United States. Sci. Rep. 2015, 5, 17028. [Google Scholar] [CrossRef] [PubMed]
  12. Yu, W.Y.; Qi, Y.B.; Ming, H. Provincial Difference and Influence Factors of Carbon Source and Sink of Agricultural System in China. J. West China For. Sci. 2016, 45, 1–7. [Google Scholar]
  13. Scurlock, J.M.O.; Hall, D.O. The global carbon sink: A grassland perspective. Glob. Change Biol. 1998, 4, 229–233. [Google Scholar] [CrossRef]
  14. Yuan, Y.Q.; Xue, L.M.; Li, X.Z. Net primary productivity and carbon sequestration potential of salt marsh vegetation in Chongming Dongtan of the Yangtze Estuary based on CASA model. Chin. J. Ecol. 2022, 41, 334–342. [Google Scholar] [CrossRef]
  15. Luo, Y.; White, L.W.; Canadell, J.G.; DeLucia, E.H.; Ellsworth, D.S.; Finzi, A.; Lichter, J.; Schlesinger, W.H. Sustainability of terrestrial carbon sequestration: A case study in Duke Forest with inversion approach. Glob. Biogeochem. Cycles 2003, 17, 1923. [Google Scholar] [CrossRef]
  16. Zhang, X.; Jia, J.; Chen, L.; Chu, H.; He, J.-S.; Zhang, Y.; Feng, X. Aridity and NPP constrain contribution of microbial necromass to soil organic carbon in the Qinghai-Tibet alpine grasslands. Soil Biol. Biochem. 2021, 156, 108213. [Google Scholar] [CrossRef]
  17. Bai, Y.; Zhao, Y.; Wang, Y.; Zhou, K. Assessment of Ecosystem Services and Ecological Regionalization of Grasslands Support Establishment of Ecological Security Barriers in Northern China. Bull. Chin. Acad. Sci. 2020, 35, 675–689. [Google Scholar]
  18. Wei, Y.J.; Liu, M.Y.; Ji, W.; Dang, X.H.; Han, Y.L. The effects of vegetation communities on soil organic carbon stock in an enclosed desert-steppe region of northern China. Soil Sci. Plant Nutr. 2022, 68, 284–294. [Google Scholar]
  19. Sha, Z.; Bai, Y.; Lan, H.; Liu, X.; Li, R.; Xie, Y. Can more carbon be captured by grasslands? A case study of Inner Mongolia, China. Sci. Total. Environ. 2020, 723, 138085. [Google Scholar] [CrossRef]
  20. Zhang, J.; Zhang, C.H.; Zhang, A.D.; Fang, M.; Wu, M.; Lin, Z.; Zhang, Y.; Song, X. Relative effects of hydrothermal fluctuation and land cover changes on vegetation net primary productivity in Northeast China. Acta. Ecol. Sin. 2020, 40, 7733–7744. [Google Scholar] [CrossRef]
  21. Zhao, X.X. The Spatio-temporal Dynamics and Driving Factors of Grassland Net Primary Productivity in the Farming-pastoral Ecotone of Inner Mongolia. Master’s Thesis, Inner Mongolia University, Hohhot, China, 2022. [Google Scholar] [CrossRef]
  22. Xin, X.P.; Ding, L.; Cheng, W.; Zhu, X.Y.; Chen, B.H.; Liu, Z.L.; He, G.L.; Qing, G.L.; Yang, G.X.; Tang, H.J. Biomass Carbon Storage and Its Effect Factors in Steppe and Agro-Pastoral Ecotones in Northern China. Sci. Agric. Sin. 2020, 53, 2757–2768. [Google Scholar]
  23. Yang, M.X.; Yang, X.C.; Zhao, Y.; Huangqing, D.; Li, C.; Cao, W.; Chen, A.; Gu, Q.; Li, Z.; Wang, S. Estimated carbon storage and influencing factors of alpine grassland in the source region of the Yellow River. Acta Ecol. Sin. 2023, 43, 3546–3557. [Google Scholar] [CrossRef]
  24. Huang, X.Q.; Li, E.G.; Zhang, J.; Qi, Y.; Chen, H.; Zhou, Y.; Yang, C.; Huang, Y. Soil organic carbon stock and its influencing factors under different vegetation types in western Inner Mongolia. J. Arid Land Resour. Environ. 2016, 30, 165–171. [Google Scholar] [CrossRef]
  25. Qiu, X. The Effect of Grazing and Climate Change on Characteristics of Vegetation and Cycle of Soil Carbon and Nitrogen in Grassland Ecosystem. Master’s Thesis, Inner Mongolia University, Hohhot, China, 2023. [Google Scholar] [CrossRef]
  26. Zhang, H.-L.; Song, K.; Shi, J.; Wu, Y.; Zheng, X.-Q.; He, Q.-Y.; Li, S.-X.; Zhang, J.-Q.; Shen, G.-R.; Lv, W.-G. Spatial Distribution and Storage Feature of Deep Soil Organic Carbon in Chongming Island. Chin. J. Agrometeorol. 2017, 38, 567–573. [Google Scholar]
  27. Cui, X.; Wang, Y.; Niu, H.; Wu, J.; Wang, S.; Schnug, E.; Rogasik, J.; Fleckenstein, J.; Tang, Y. Effect of long-term grazing on soil organic carbon content in semiarid steppes in Inner Mongolia. Ecol. Res. 2005, 20, 519–527. [Google Scholar] [CrossRef]
  28. Zhang, Z.; Wang, Y.; Wang, Y.; Deng, X.; Hao, G.; Wang, F.; Qin, Z. Distribution patterns and influencing factors of soil carbon storage in mangrove wetland at the Pear River Estuary. Acta Sci. Circumstantiae 2023, 43, 297–306. [Google Scholar] [CrossRef]
  29. Zhang, L.; Zhou, G.; Ji, Y.; Bai, Y. Spatiotemporal dynamic simulation of grassland carbon storage in China. Sci. China Earth Sci. 2016, 59, 1946–1958. [Google Scholar] [CrossRef]
  30. Piao, S.L.; Fang, J.Y.; He, J.S.; Xiao, Y. Spatial Distribution of Grassland Biomass in China. Chin. J. Plant Ecol. 2004, 28, 491–498. [Google Scholar] [CrossRef]
  31. Potter, C.; Gross, P.; Genovese, V.; Smith, M.-L. Net primary productivity of forest stands in New Hampshire estimated from Landsat and MODIS satellite data. Carbon Balance Manag. 2007, 2, 9. [Google Scholar] [CrossRef]
  32. Schlesinger, W.H.; Andrews, J.A. Soil respiration and the global carbon cycle. Biogeochemistry 2000, 48, 7–20. [Google Scholar] [CrossRef]
  33. Sullivan, P.F.; Arens, S.J.T.; Sveinbjörnsson, B.; Welker, J.M. Modeling the seasonality of belowground respiration along an elevation gradient in the western Chugach Mountains, Alaska. Biogeochemistry 2010, 101, 61–75. [Google Scholar] [CrossRef]
Figure 1. Geographical location and distribution of sampling points.
Sustainability 16 04053 g001
Figure 2. Average NPP distribution map from 2000 to 2022.
Sustainability 16 04053 g002
Figure 3. Correlation analysis between herbaceous carbon density and NPP.
Sustainability 16 04053 g003
Figure 4. Grassland NPP future trend distribution map. The black dots represent the sample points selected by the Institute.
Sustainability 16 04053 g004
Table 1. Different soil layers’ soil carbon densities and carbon stocks.
Different Soil LayersCarbon Stock (×104 tons)Carbon Density (t/ha)
0–20 cm435.3918.69
20–50 cm640.3327.48
50–100 cm623.8926.78
Total1699.6172.95
Table 2. Carbon stock and carbon density of each community.
Community NameNumber of SamplesBiomass
(×104 tons)
Carbon Density (t/ha)Carbon Stock
(×104 tons)
Stipa krylovii + Leymus chinensis4319.8088.32711.90
Artimisia frigida + Stipa krylovii3212.7478.75663.38
Stipa krylovii + Cleistogenes squarrosa206.7480.00324.47
Salsola collina + Artimisia frigida114.0560.7859.58
Artimisia frigida + Cleistogenes squarrosa41.3971.9624.15
Thymus mongolicus + Artimisia frigida40.8774.2315.85
Thymus mongolicus + Stellera chamaejasme20.5171.296.32
Total/Average11646.0977.501805.65
Disclaimer/Publisher’s Note: The statements, opinions and data contained in all publications are solely those of the individual author(s) and contributor(s) and not of MDPI and/or the editor(s). MDPI and/or the editor(s) disclaim responsibility for any injury to people or property resulting from any ideas, methods, instructions or products referred to in the content.

