
Residue Management and Nutrient Stoichiometry Control Greenhouse Gas and Global Warming Potential Responses in Alfisols

 , , , , ,
Abstract
1. Introduction
2. Materials and Methods
2.1. Study Site
2.2. Incubation Experiment Details
2.3. GHG Sampling and Measurements
2.4. Statistical Analysis
3. Results
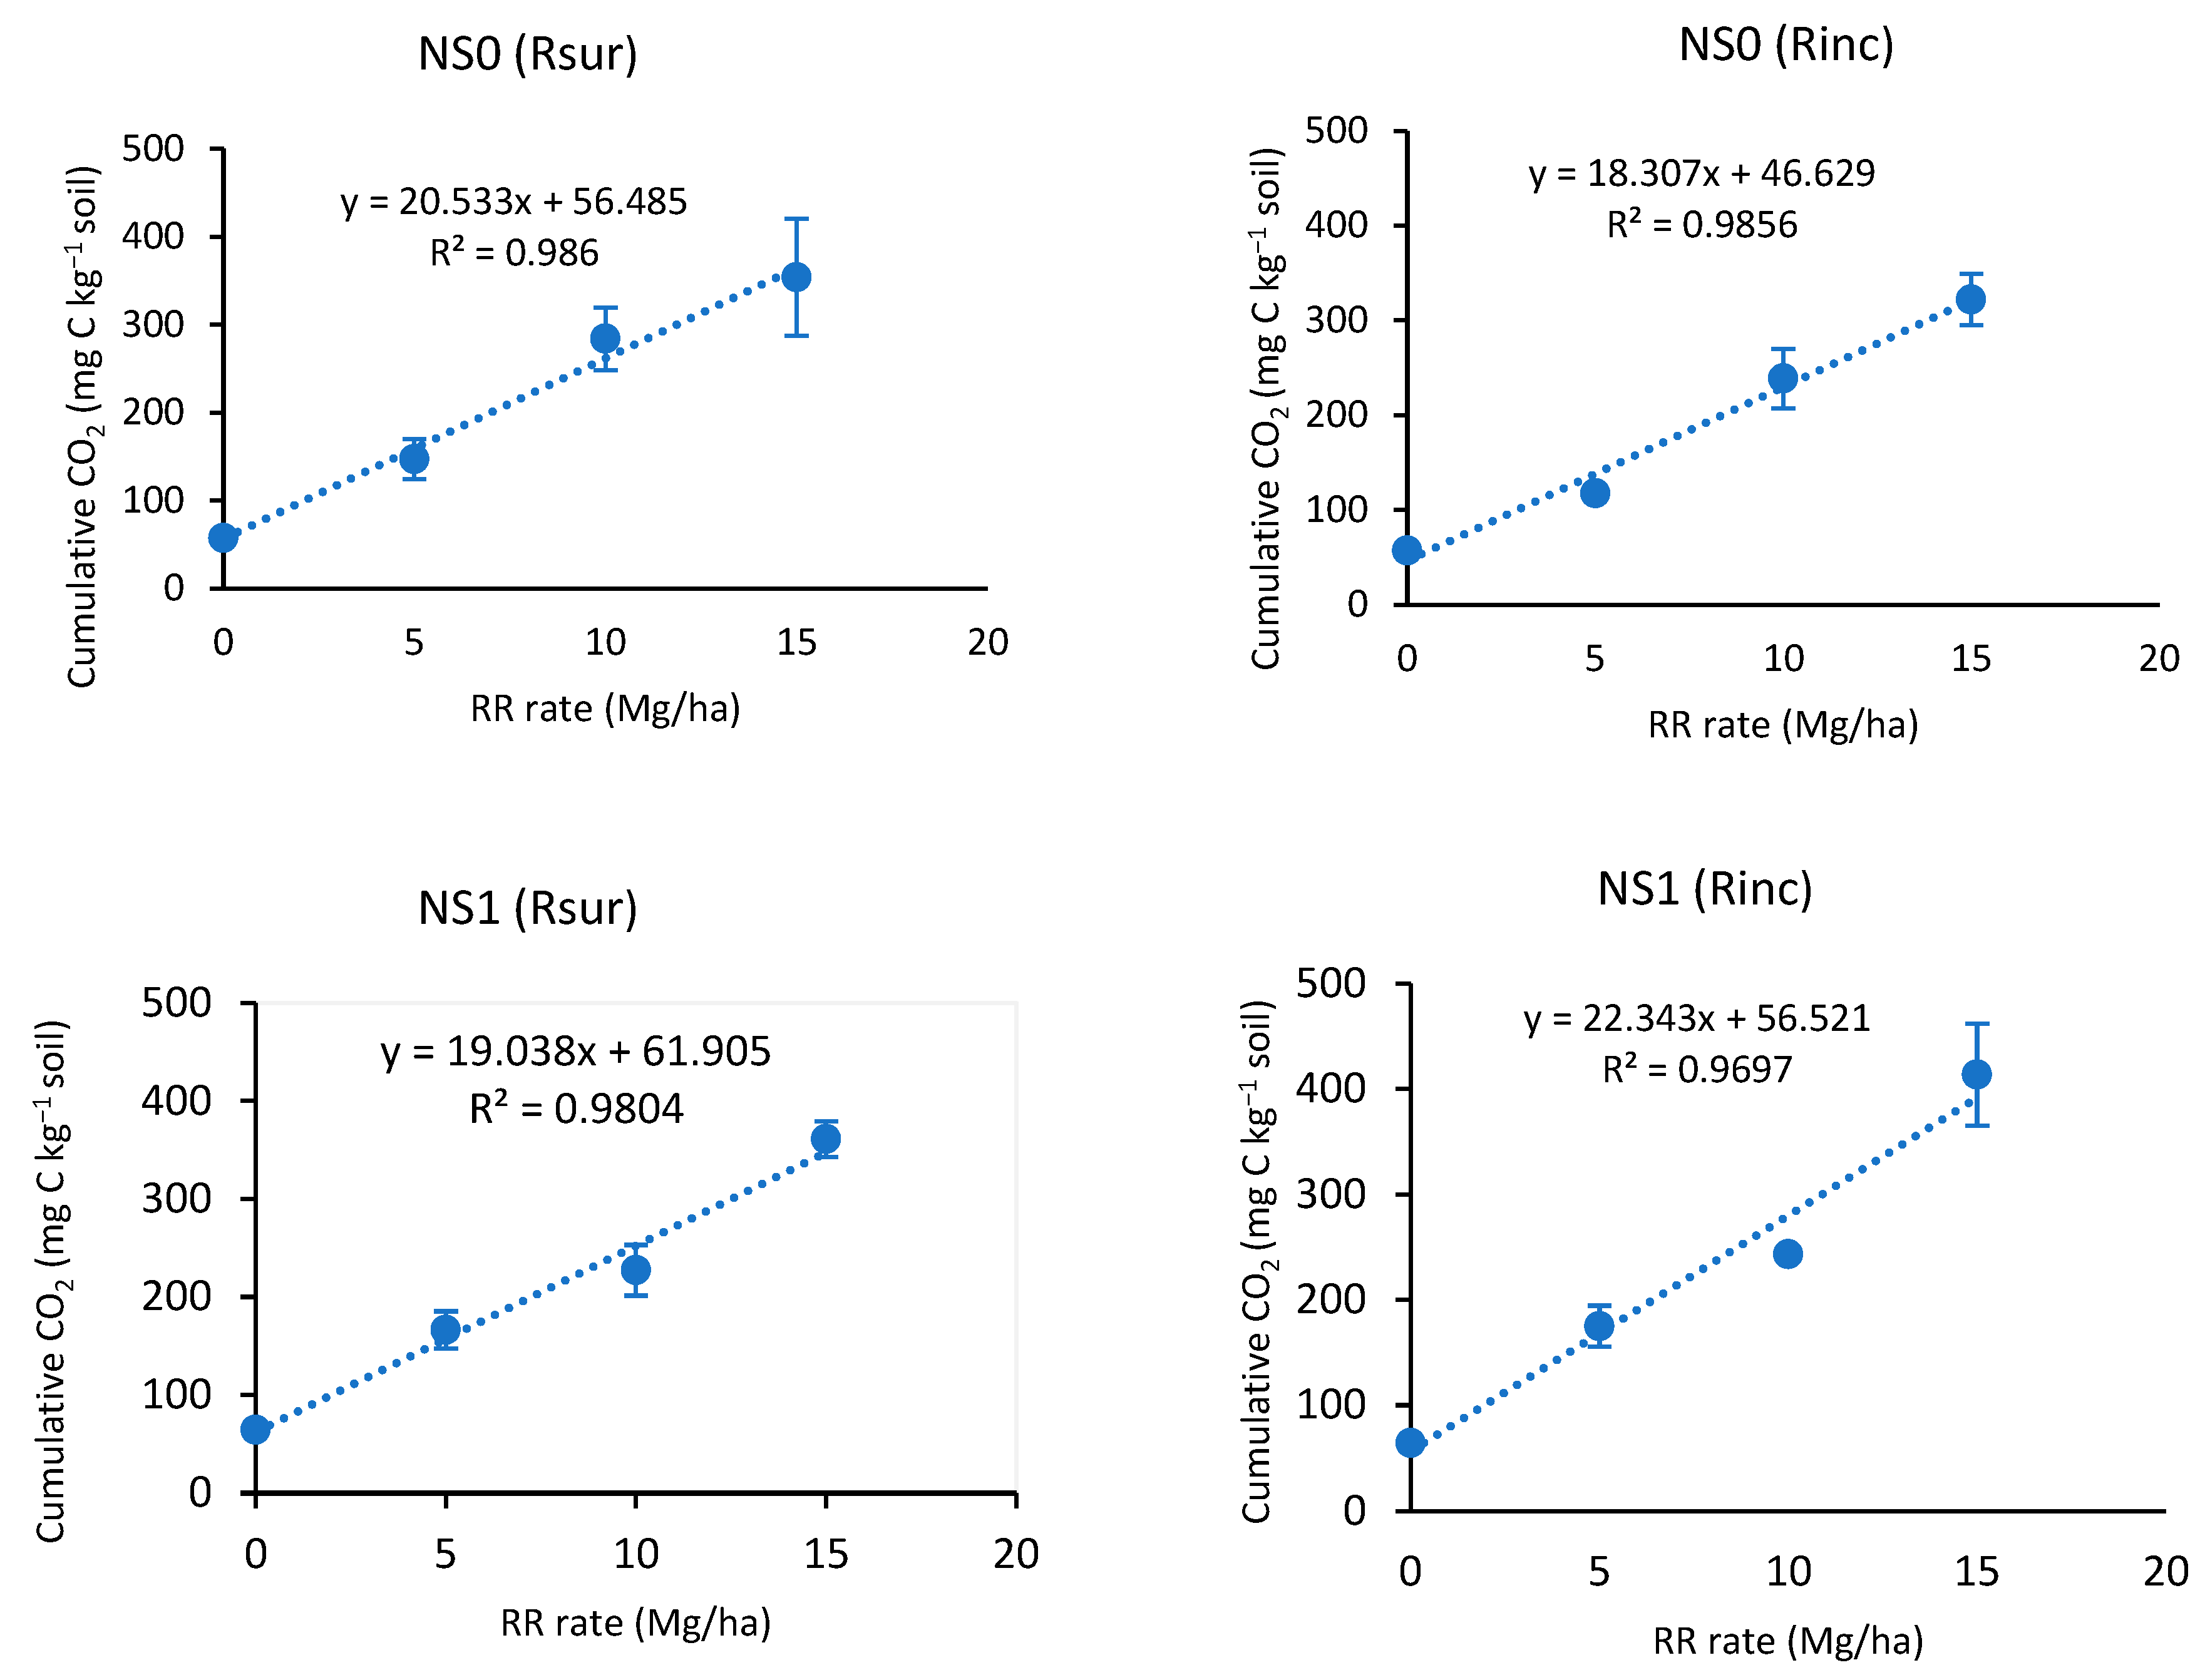
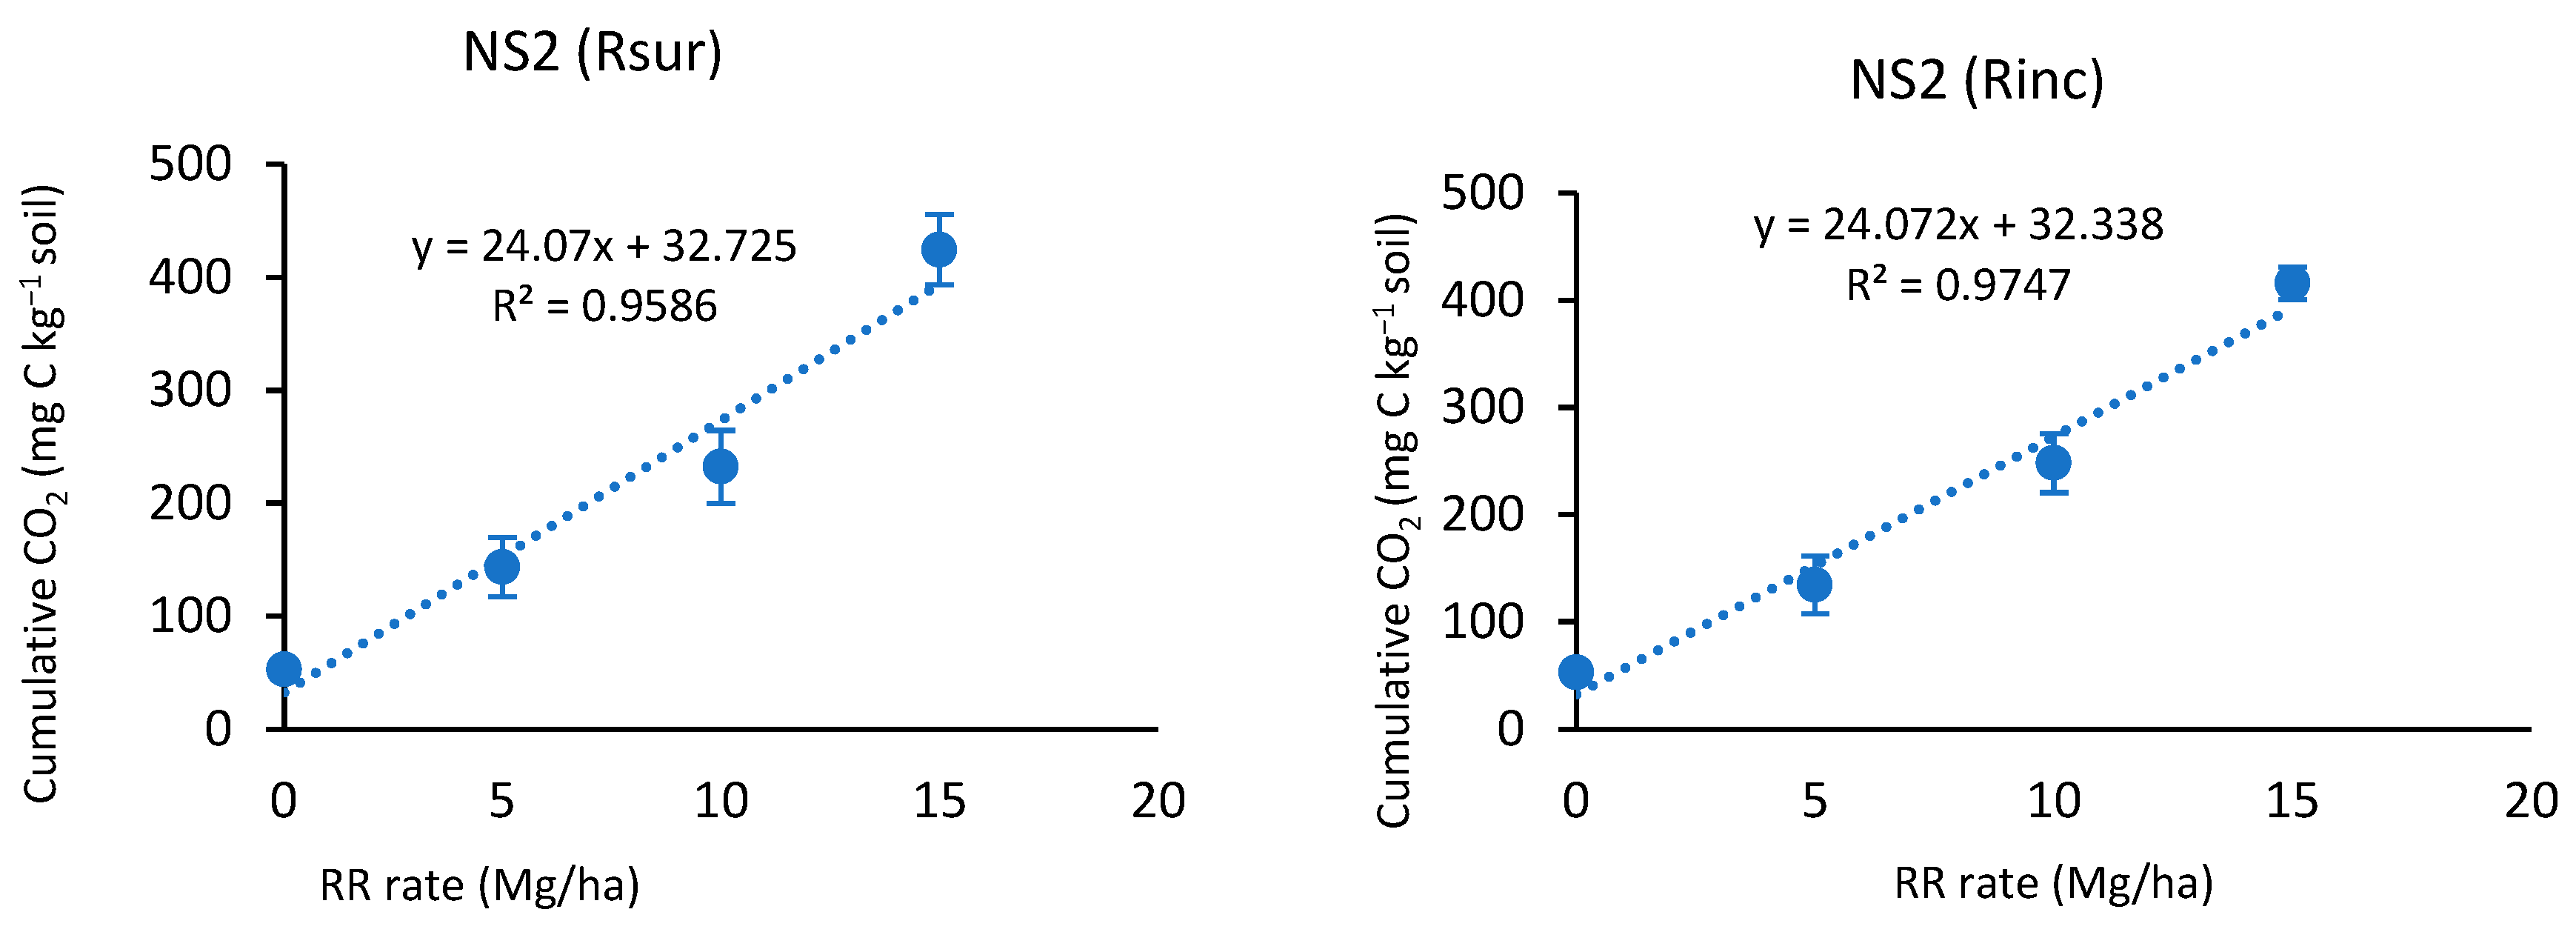
3.1. CO2 Fluxes
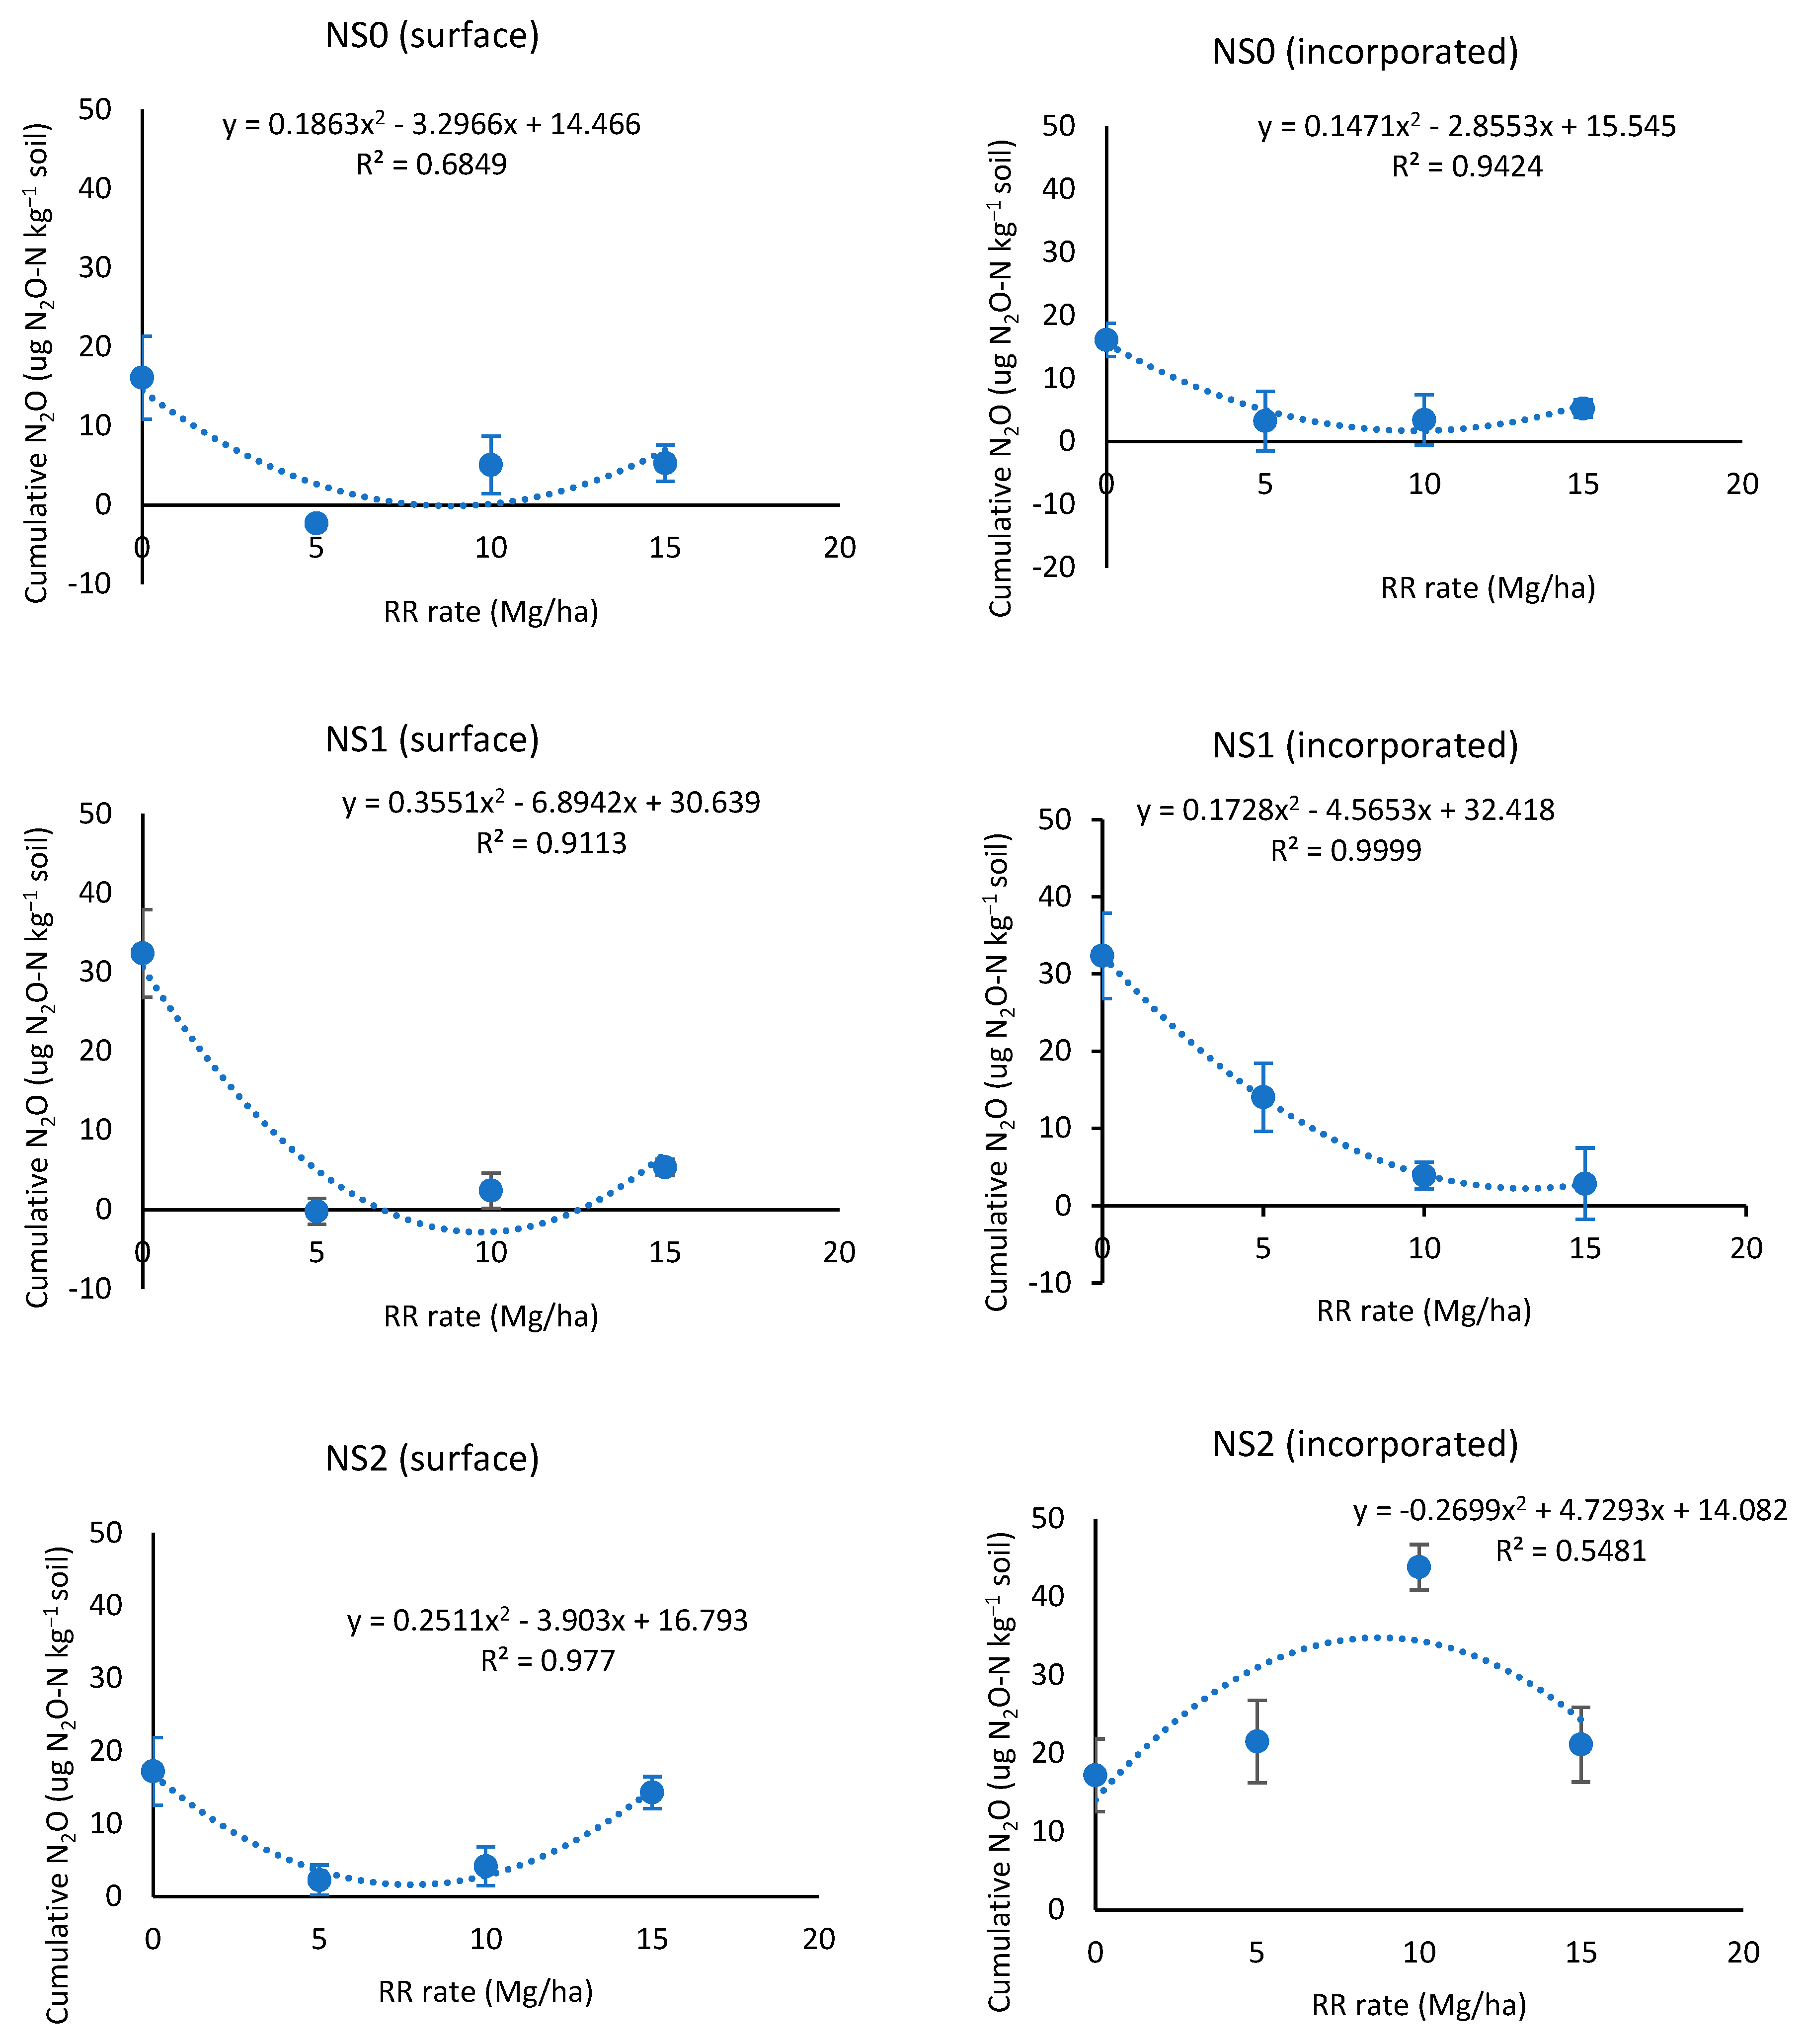
3.2. N2O Fluxes
3.3. CH4 Fluxes
3.4. Global Warming Potential (GWP)
4. Discussion
4.1. CO2 Emissions
4.2. N2O Emission
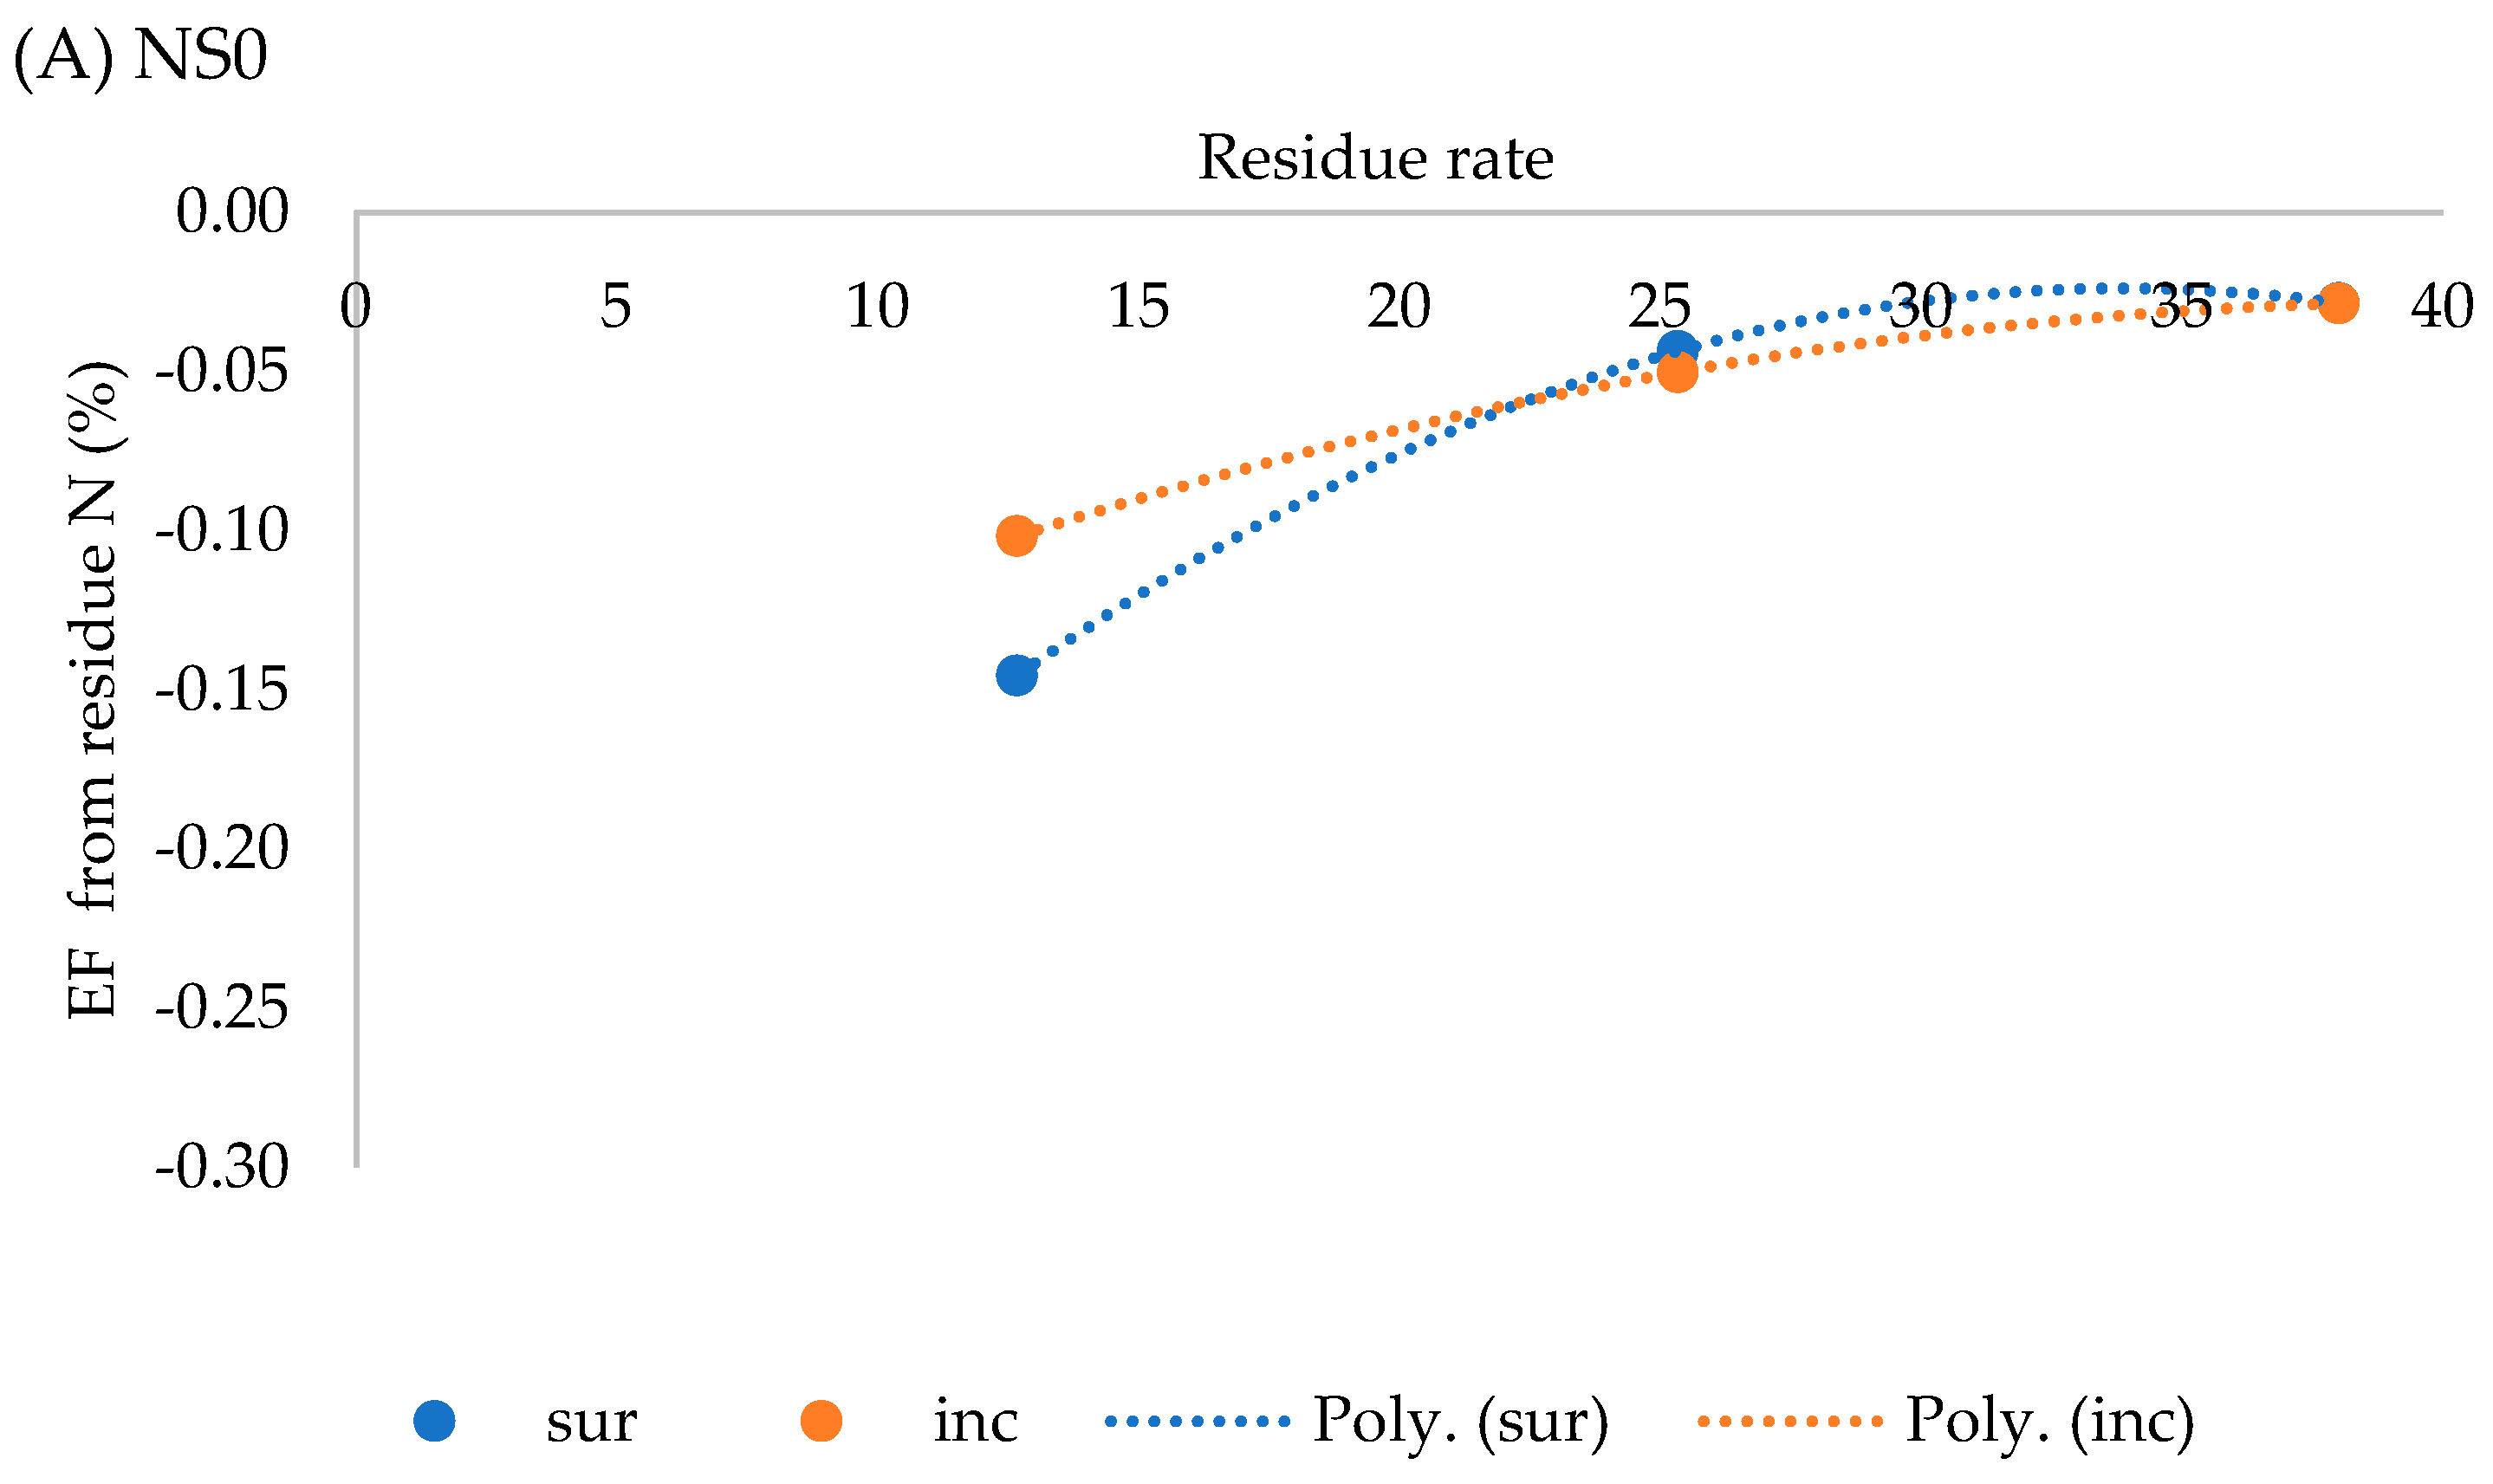
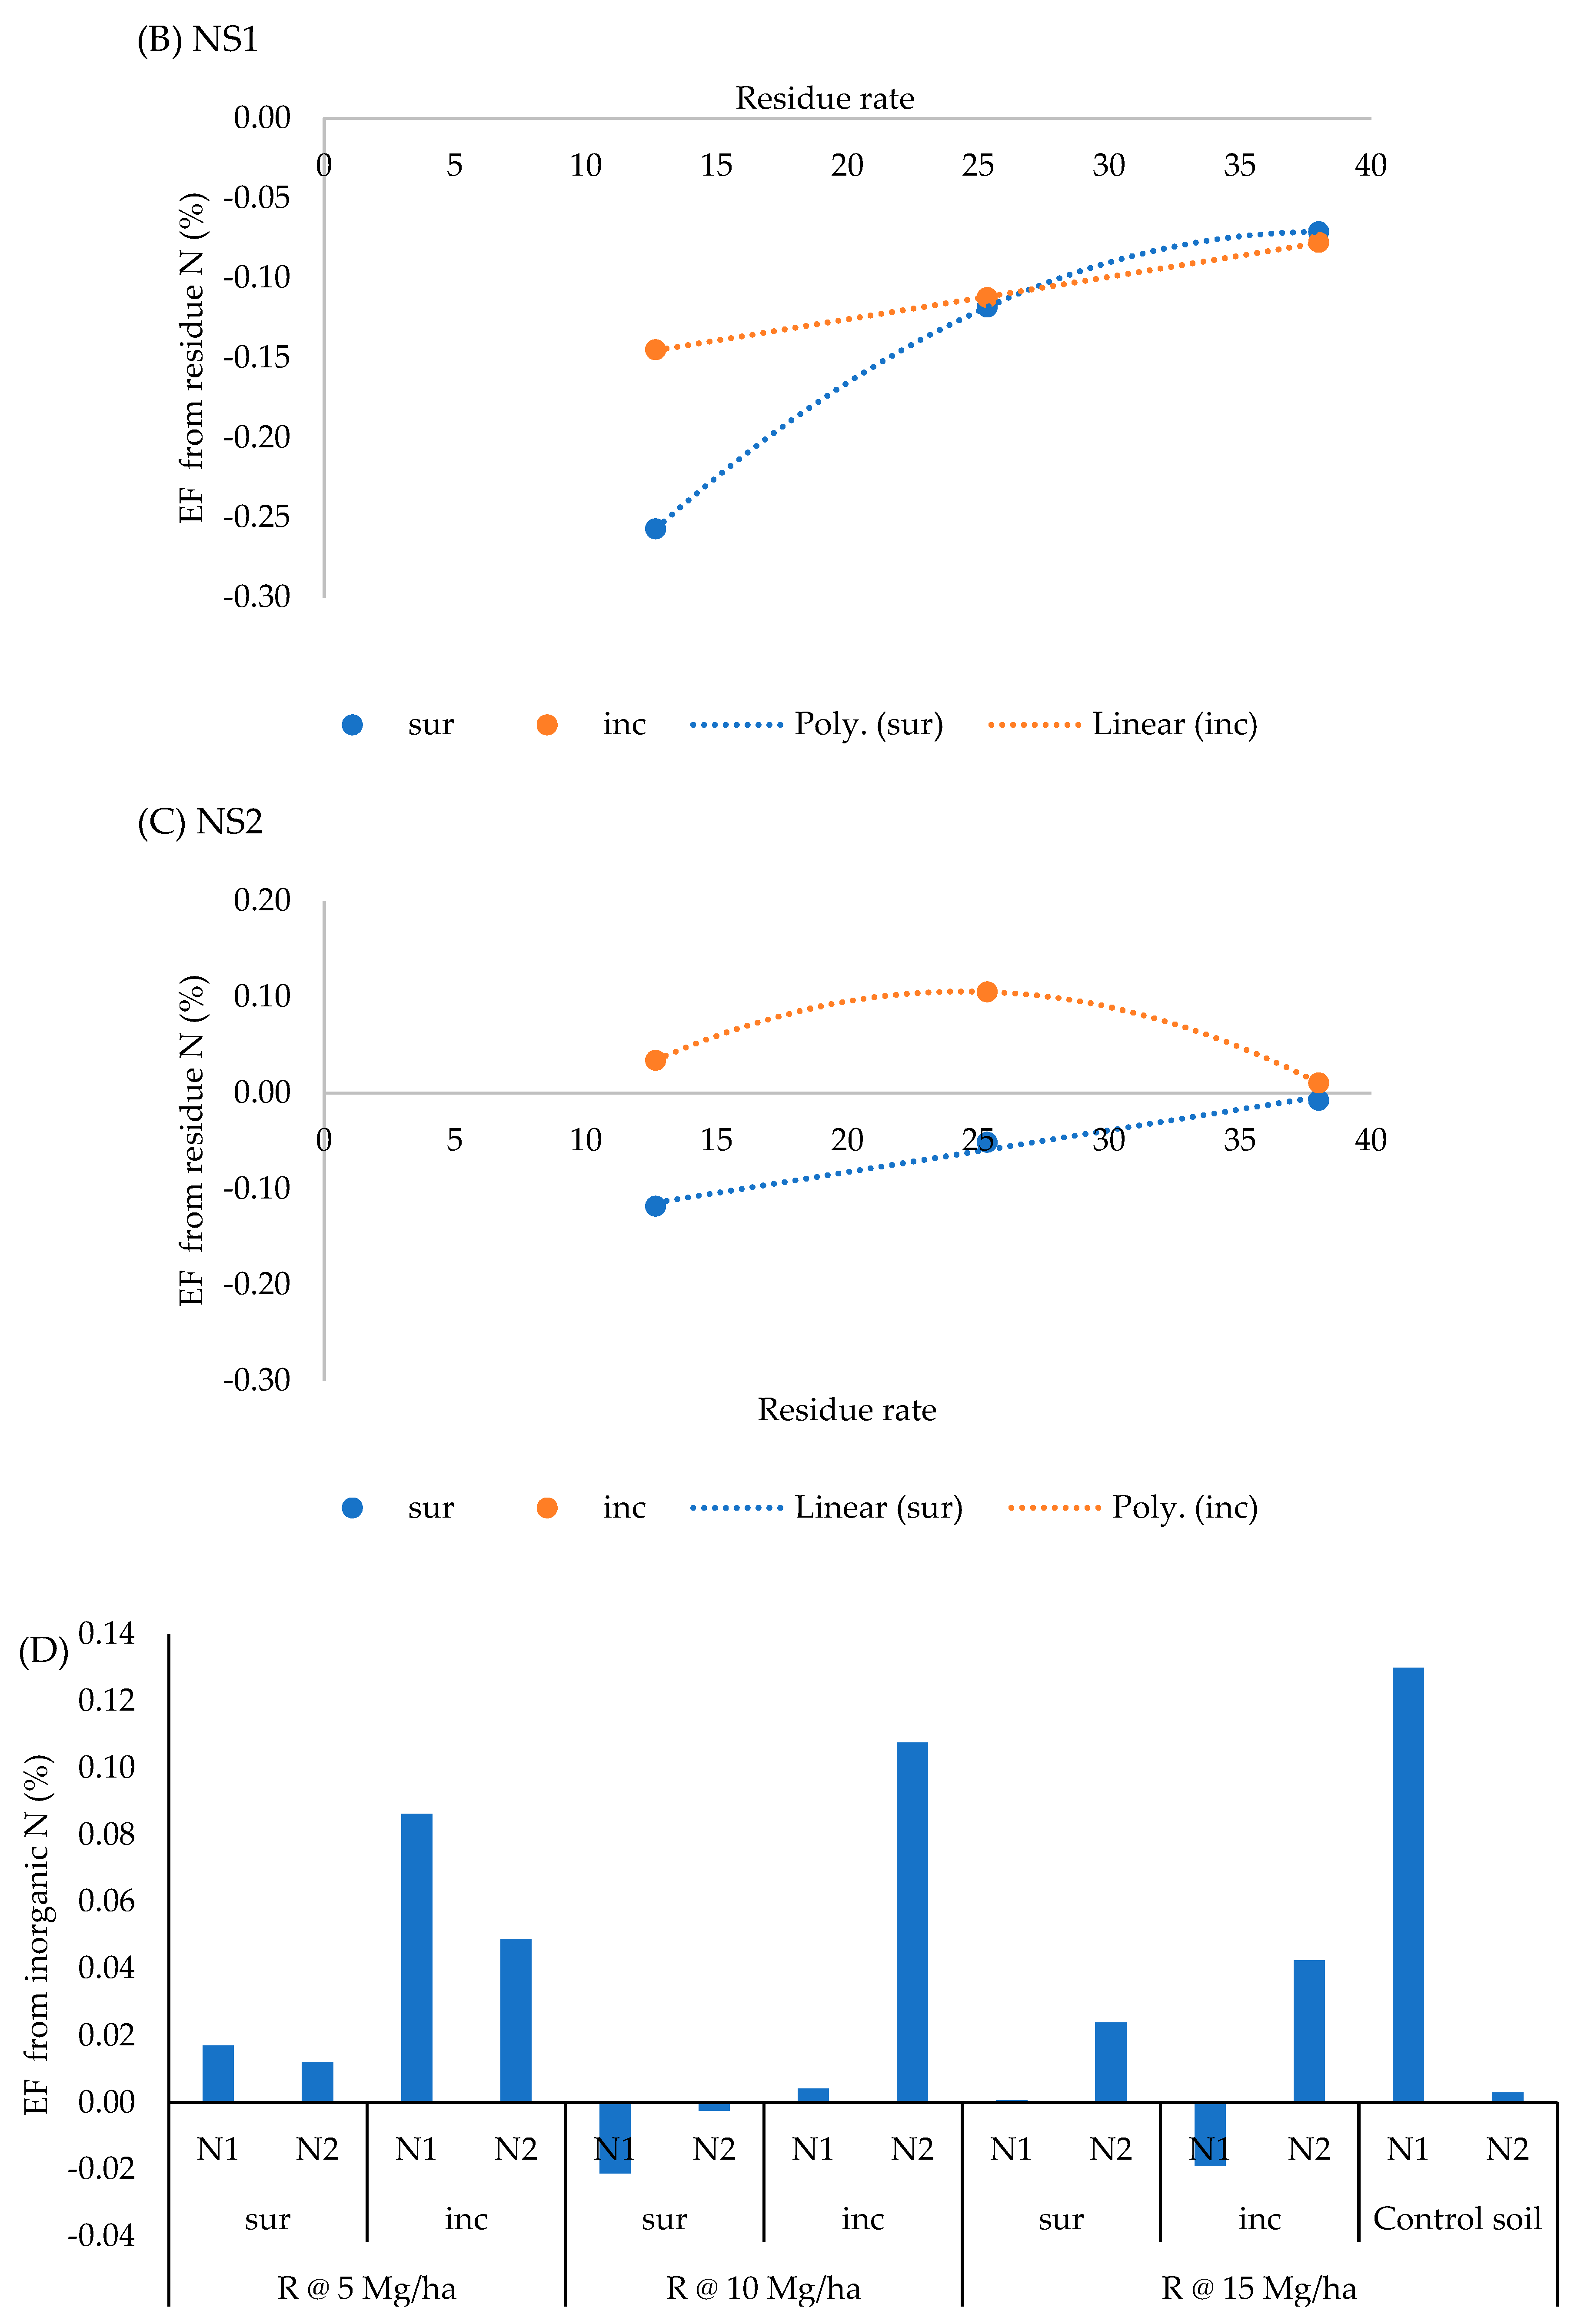
N2O Emission Factor (EF)
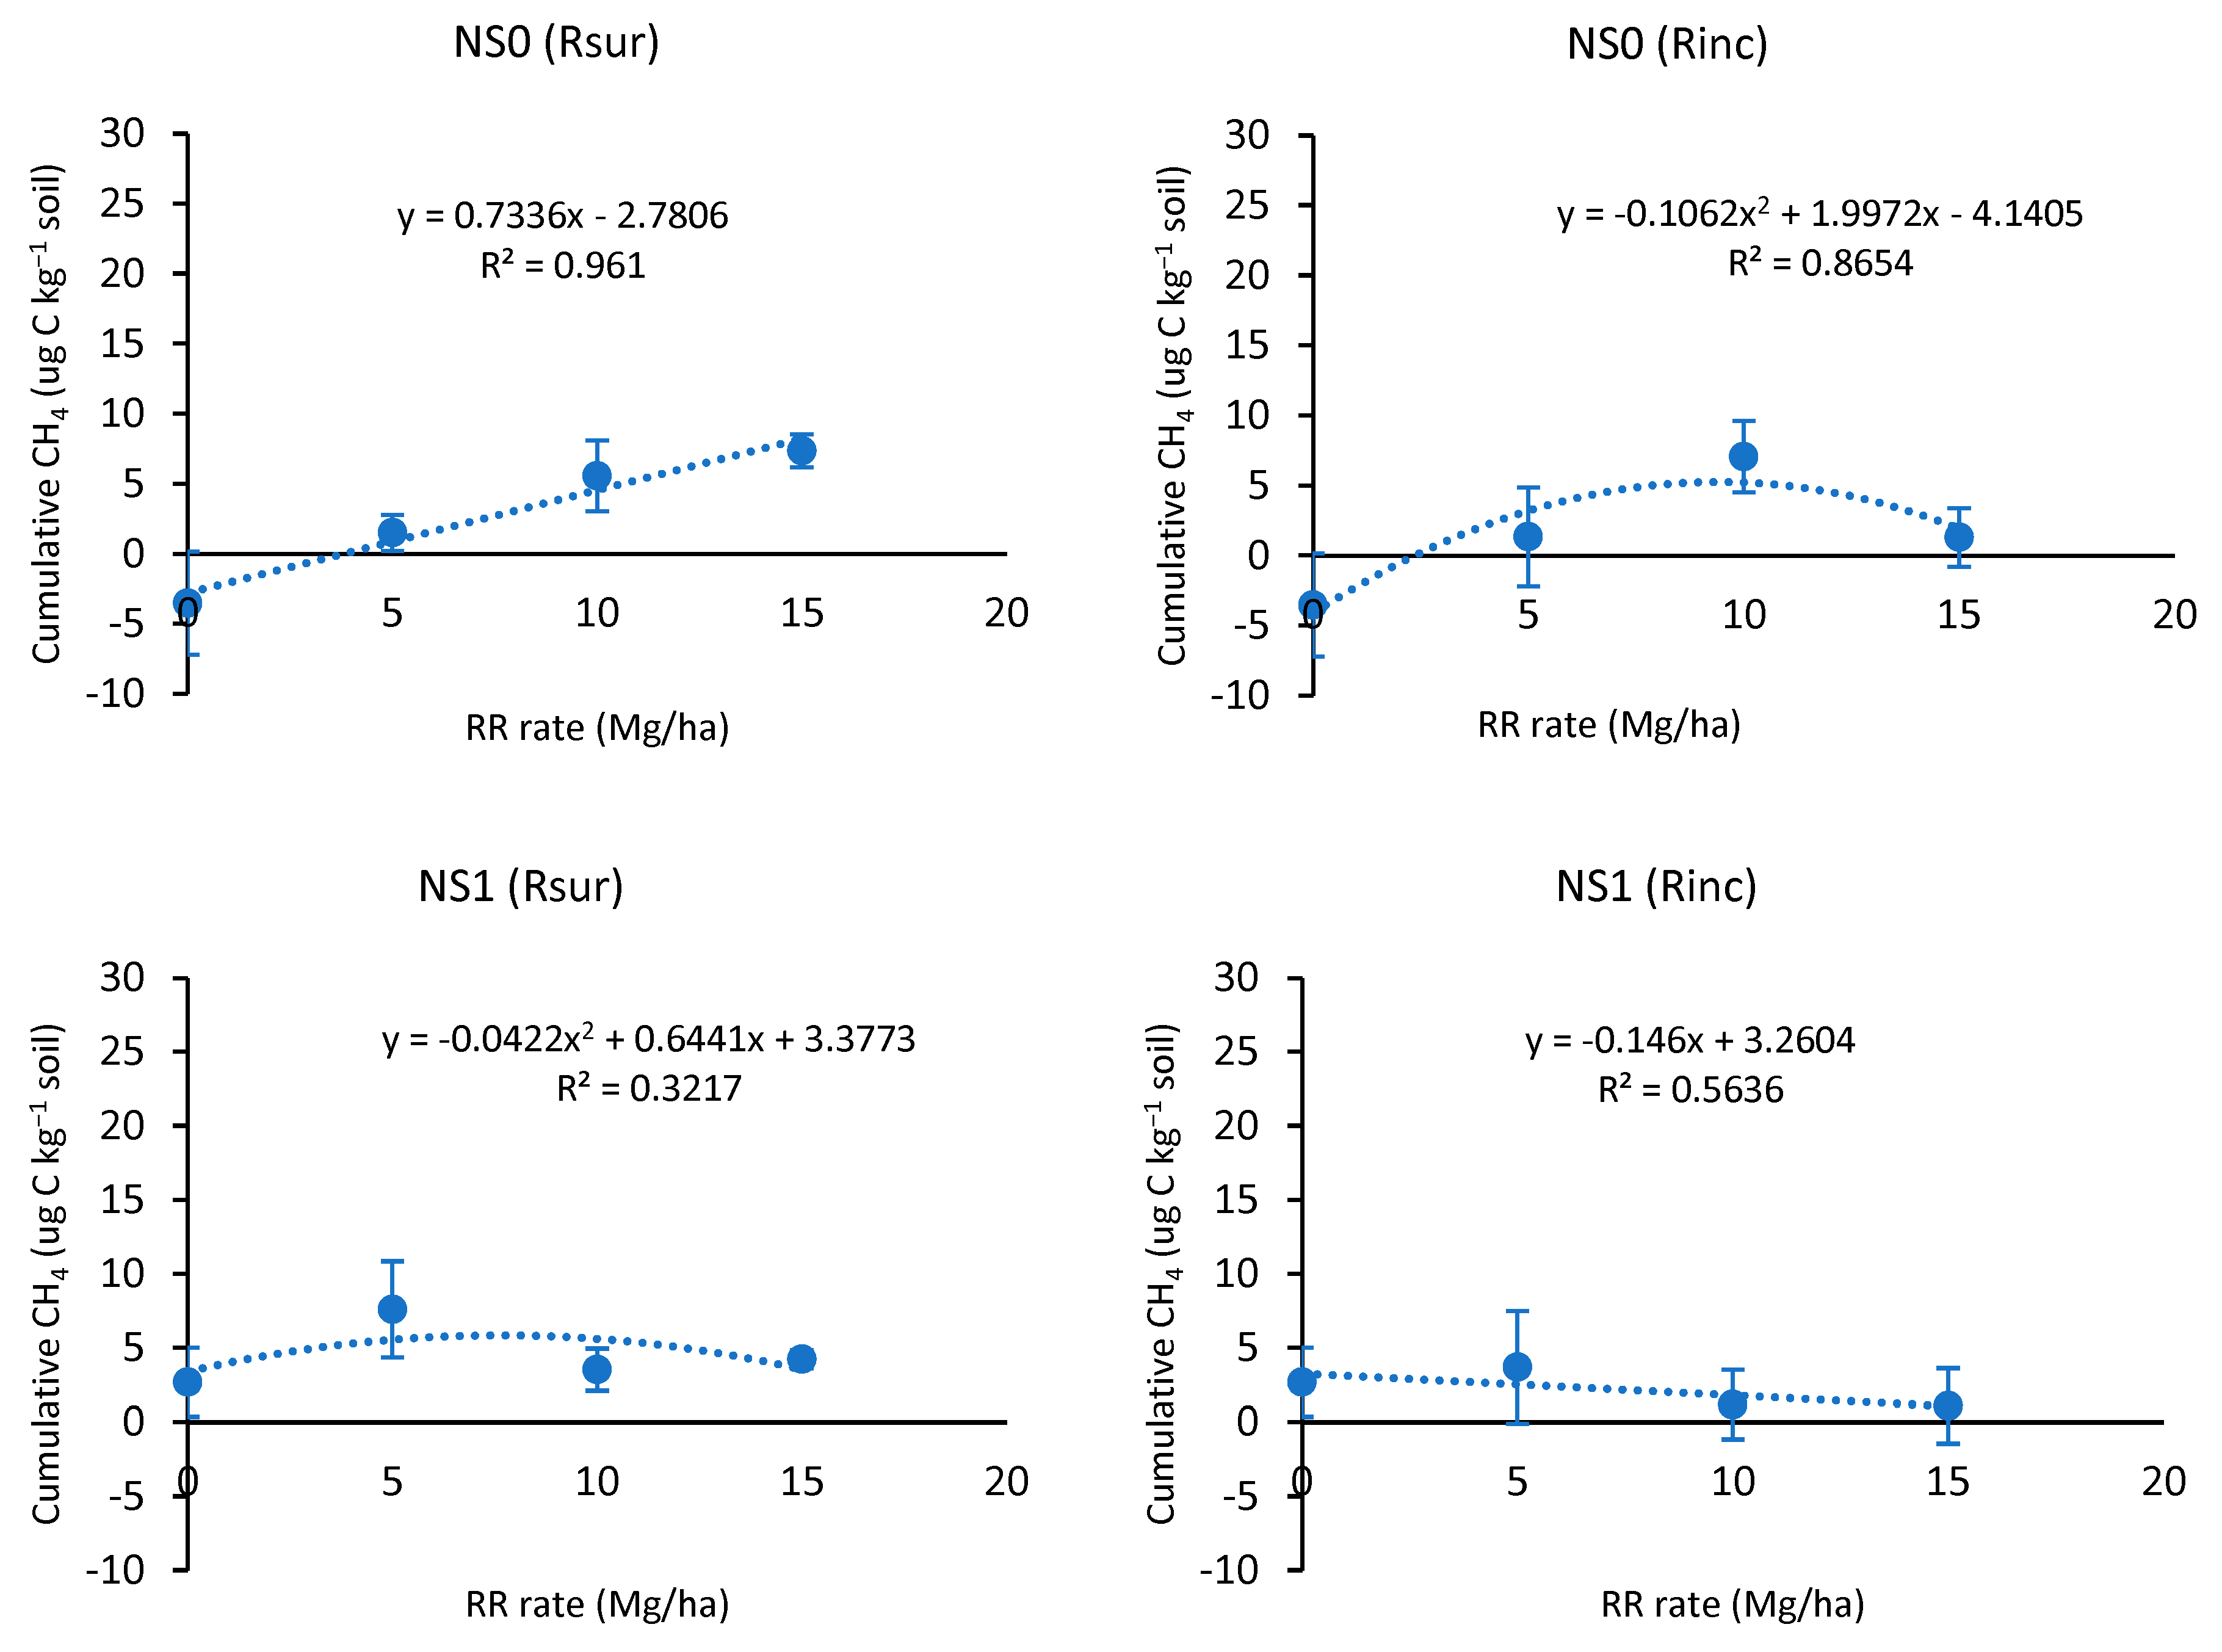
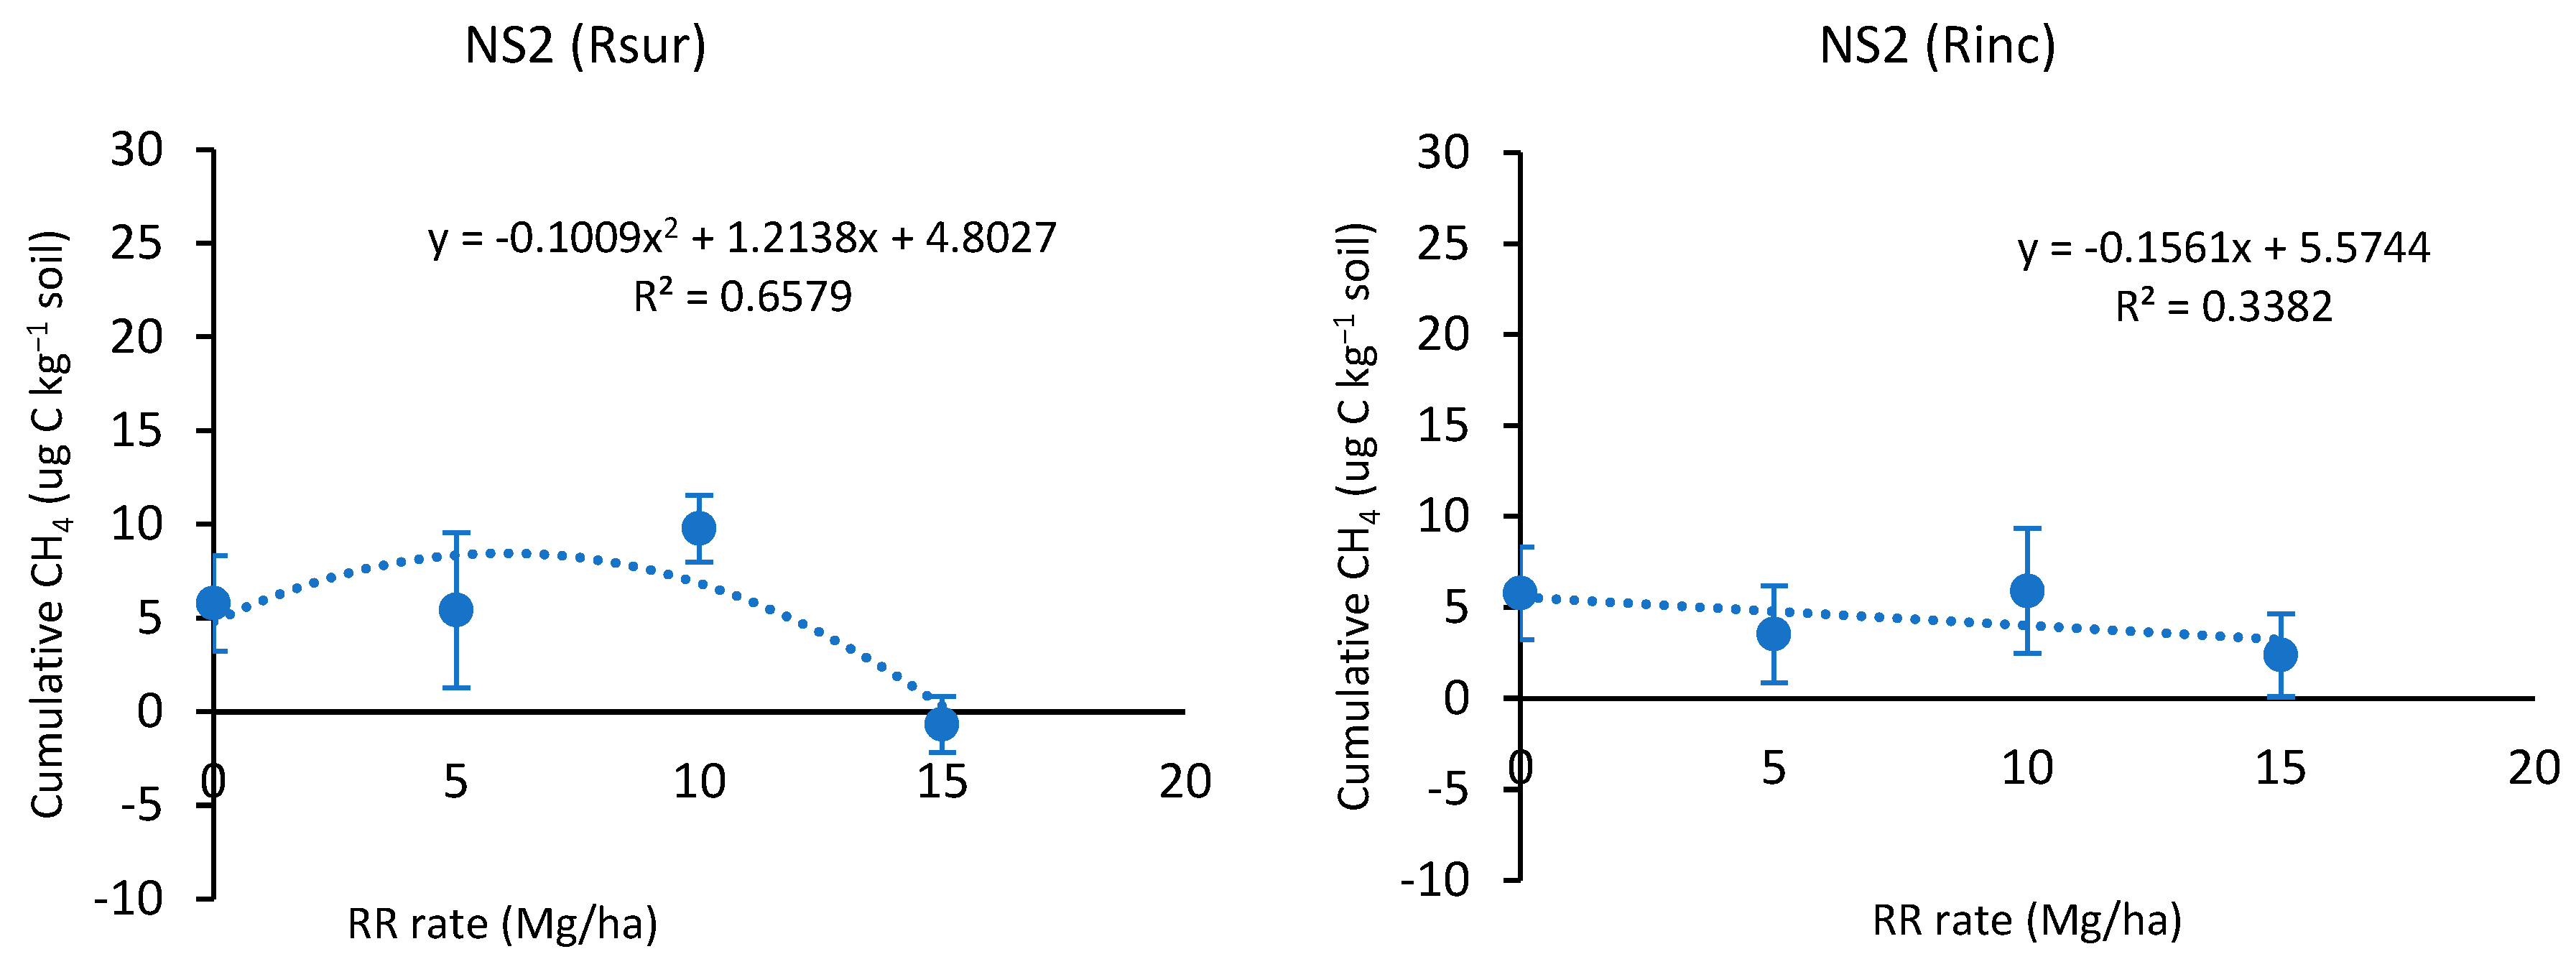
4.3. CH4 Emissions
4.4. Global Warming Potential (GWP)
5. Conclusions
Author Contributions
Funding
Institutional Review Board Statement
Informed Consent Statement
Data Availability Statement
Acknowledgments
Conflicts of Interest
References
- Lal, R. The potential of soils of the tropics to sequester carbon and mitigate the greenhouse effect. Adv. Agron. 2002, 76, 1–30. [Google Scholar] [CrossRef]
- Yang, J.; Liu, G.; Tian, H.; Liu, X.; Hao, X.; Zong, Y.; Zhang, D.; Shi, X.; Wang, A.; Li, P.; et al. Trade-offs between wheat soil N2O emissions and C sequestration under straw return, elevated CO2 concentration, and elevated temperature. Sci. Total Environ. 2023, 892, 164508. [Google Scholar] [CrossRef] [PubMed]
- Qian, R.; Guo, R.; Naseer, M.A.; Zhang, P.; Chen, X.; Ren, X. Long-term straw incorporation regulates greenhouse gas emissions from biodegradable film farmland, improves ecosystem carbon budget and sustainable maize productivity. Field Crops Res. 2023, 295, 108890. [Google Scholar] [CrossRef]
- Liu, Y.; Zhou, X.; Du, C.; Liu, Y.; Xu, X.; Ejaz, I.; Hu, N.; Zhao, X.; Zhang, Y.; Wang, Z.; et al. Trade-off between soil carbon emission and sequestration for winter wheat under reduced irrigation: The role of soil amendments. Agric. Ecosyst. Environ. 2023, 352, 108535. [Google Scholar] [CrossRef]
- Zhang, M.Y.; Wang, F.J.; Chen, F.; Malemela, M.P.; Zhang, H.L. Comparison of three tillage systems in the wheat-maize system on carbon sequestration in the North China Plain. J. Clean. Prod. 2013, 54, 101–107. [Google Scholar] [CrossRef]
- Bhattacharyya, S.S.; Leite, F.F.G.D.; France, C.L.; Adekoya, A.O.; Ros, G.H.; de Vries, W.; Melchor-Martínez, E.M.; Iqbal, H.M.N.; Parra-Saldívar, R. Soil carbon sequestration, greenhouse gas emissions, and water pollution under different tillage practices. Sci. Total Environ. 2022, 826, 154161. [Google Scholar] [CrossRef] [PubMed]
- Abalos, D.; Rittl, T.F.; Recous, S.; Thiébeau, P.; Topp, C.F.E.; van Groenigen, K.J.; Butterbach-Bahl, K.; Thorman, R.E.; Smith, K.E.; Ahuja, I.; et al. Predicting field N2O emissions from crop residues based on their biochemical composition: A meta-analytical approach. Sci. Total Environ. 2022, 812, 152532. [Google Scholar] [CrossRef]
- Liu, X.; Peñuelas, J.; Sardans, J.; Fang, Y.; Wiesmeier, M.; Wu, L.; Chen, X.; Chen, Y.; Jin, Q.; Wang, W. Response of soil nutrient concentrations and stoichiometry, and greenhouse gas carbon emissions linked to change in land-use of paddy fields in China. Catena 2021, 203, 105326. [Google Scholar] [CrossRef]
- Lenka, S.; Choudhary, R.; Lenka, N.K.; Saha, J.K.; Amat, D.; Patra, A.K.; Gami, V.; Singh, D. Nutrient Management Drives the Direction and Magnitude of Nitrous Oxide Flux in Crop Residue-Returned Soil Under Different Soil Moisture. Front. Environ. Sci. 2022, 10, 857233. [Google Scholar] [CrossRef]
- Xia, L.; Wang, S.; Yan, X. Effects of long-term straw incorporation on the net global warming potential and the net economic benefit in a rice-wheat cropping system in China. Agric. Ecosyst. Environ. 2014, 197, 118–127. [Google Scholar] [CrossRef]
- Yang, L.; Muhammad, I.; Chi, Y.X.; Liu, Y.X.; Wang, G.Y.; Wang, Y.; Zhou, X.B. Straw return and nitrogen fertilization regulate soil greenhouse gas emissions and global warming potential in dual maize cropping system. Sci. Total Environ. 2022, 853, 158370. [Google Scholar] [CrossRef] [PubMed]
- Wang, J.; Sainju, U.M.; Barsotti, J.L. Residue Placement and Rate, Crop Species, and Nitrogen Fertilization Effects on Soil Greenhouse Gas Emissions. J. Environ. Prot. 2012, 3, 1238–1250. [Google Scholar] [CrossRef]
- Mirzaei, M.; Gorji Anari, M.; Taghizadeh-Toosi, A.; Zaman, M.; Saronjic, N.; Mohammed, S.; Szabo, S.; Caballero-Calvo, A. Soil Nitrous Oxide Emissions Following Crop Residues Management in Corn-Wheat Rotation Under Conventional and No-Tillage Systems. Air Soil Water Res. 2022, 15, 11786221221128789. [Google Scholar] [CrossRef]
- Wang, X.D.; He, C.; Cheng, H.Y.; Liu, B.Y.; Li, S.S.; Wang, Q.; Liu, Y.; Zhao, X.; Zhang, H.L. Responses of greenhouse gas emissions to residue returning in China’s croplands and influential factors: A meta-analysis. J. Environ. Manag. 2021, 289, 112486. [Google Scholar] [CrossRef] [PubMed]
- Singh, D.; Lenka, S.; Lenka, N.K.; Trivedi, S.K.; Bhattacharjya, S.; Sahoo, S.; Saha, J.K.; Patra, A.K. Effect of Reversal of Conservation Tillage on Soil Nutrient Availability and Crop Nutrient Uptake in Soybean in the Vertisols of Central India. Sustainability 2020, 12, 6608. [Google Scholar] [CrossRef]
- Lenka, S.; Lenka, N.K.; Rao, A.S.; Raghuwanshi, J.; Singh, B.; Saha, J.K.; Patra, A.K. Tillage and nutrient management influence net global warming potential and greenhouse gas intensity in soybean-wheat cropping system. Indian J. Exp. Biol. 2022, 60, 207–214. [Google Scholar]
- Sainju, U.M.; Ghimire, R.; Dangi, S. Soil carbon dioxide and methane emissions and carbon balance with crop rotation and nitrogen fertilization. Sci. Total Environ. 2021, 775, 145902. [Google Scholar] [CrossRef]
- Wang, Y.; Hu, C.; Zhu, B.; Xiang, H.; He, X. Effects of wheat straw application on methane and nitrous oxide emissions from purplish paddy fields. Plant Soil Environ. 2010, 56, 16–22. [Google Scholar] [CrossRef]
- Battaglia, M.L. Crop Residue Management Effects on Crop Production, Greenhouse Gases Emissions, and Soil Quality in the MidAtlantic USA. Ph.D. Thesis, Virginia Tech, Blacksburg, VA, USA, 2018. [Google Scholar]
- Thapa, R.; Tully, K.L.; Hamovit, N.; Yarwood, S.A.; Schomberg, H.H.; Cabrera, M.L.; Reberg-Horton, C.; Mirsky, S.B. Microbial processes and community structure as influenced by cover crop residue type and placement during repeated dry-wet cycles. Appl. Soil Ecol. 2022, 172, 104349. [Google Scholar] [CrossRef]
- Pareja-Sánchez, E.; Cantero-Martínez, C.; Álvaro-Fuentes, J.; Plaza-Bonilla, D. Tillage and nitrogen fertilization in irrigated maize: Key practices to reduce soil CO2 and CH4 emissions. Soil Tillage Res. 2019, 191, 29–36. [Google Scholar] [CrossRef]
- Roozbeh, M.; Rajaie, M. Effects of residue management and nitrogen fertilizer rates on accumulation of soil residual nitrate and wheat yield under no-tillage system in south-west of Iran. Int. Soil Water Conserv. Res. 2020, 9, 116–126. [Google Scholar] [CrossRef]
- Wang, R.; Pan, Z.; Liu, Y.; Yao, Z.; Wang, J.; Zheng, X.; Zhang, C.; Ju, X.; Wei, H.; Butterbach-Bahl, K. Full straw incorporation into a calcareous soil increased N2O emission despite more N2O being reduced to N2 in the winter crop season. Agric. Ecosyst. Environ. 2022, 335, 108007. [Google Scholar] [CrossRef]
- Virk, A.L.; Liu, W.-S.; Chen, Z.; N’Dri Bohoussou, Y.; Cheema, M.A.; Khan, K.S.; Zhao, X.; Zhang, H.-L. Effects of different tillage systems and cropping sequences on soil physicochemical properties and greenhouse gas emissions. Agric. Ecosyst. Environ. 2022, 335, 108010. [Google Scholar] [CrossRef]
- Jiang, M.; Yang, N.; Zhao, J.; Shaaban, M.; Hu, R. Crop straw incorporation mediates the impacts of soil aggregate size on greenhouse gas emissions. Geoderma 2021, 401, 115342. [Google Scholar] [CrossRef]
- Luo, X.; Zeng, L.; Wang, L.; Qian, H.; Hou, C.; Wen, S.; Wang, B.; Huang, Q.; Chen, W. Abundance for subgroups of denitrifiers in soil aggregates asscociates with denitrifying enzyme activities under different fertilization regimes. Appl. Soil Ecol. 2021, 166, 103983. [Google Scholar] [CrossRef]
- Li, P.; Zhang, A.; Huang, S.; Han, J.; Jin, X.; Shen, X.; Hussain, Q.; Wang, X.; Zhou, J.; Chen, Z. Optimizing Management Practices under Straw Regimes for Global Sustainable Agricultural Production. Agronomy 2023, 13, 710. [Google Scholar] [CrossRef]
- Li, Z.; Reichel, R.; Brüggemann, N. Effect of C:N:P stoichiometry on soil nitrous oxide emission and nitrogen retention. J. Plant Nutr. Soil Sci. 2021, 184, 520–529. [Google Scholar] [CrossRef]
- Kirkby, C.A.; Richardson, A.E.; Wade, L.J.; Batten, G.D.; Blanchard, C.; Kirkegaard, J.A. Carbon-nutrient stoichiometry to increase soil carbon sequestration. Soil Biol. Biochem. 2013, 60, 77–86. [Google Scholar] [CrossRef]
- Mehnaz, K.R.; Corneo, P.E.; Keitel, C.; Dijkstra, F.A. Carbon and phosphorus addition effects on microbial carbon use efficiency, soil organic matter priming, gross nitrogen mineralization and nitrous oxide emission from soil. Soil Biol. Biochem. 2019, 134, 175–186. [Google Scholar] [CrossRef]
- Datta, A.; Santra, S.C.; Adhya, T.K. Effect of inorganic fertilizers (N, P, K) on methane emission from tropical rice field of India. Atmos. Environ. 2013, 66, 123–130. [Google Scholar] [CrossRef]
- Xia, L.; Lam, S.K.; Wang, S.; Zhou, W.; Chen, D.; Yan, X. Optimizing nitrogen fertilization rate to enhance soil carbon storage and decrease nitrogen pollution in paddy ecosystems with simultaneous straw incorporation. Agric. Ecosyst. Environ. 2020, 298, 106968. [Google Scholar] [CrossRef]
- Song, X.; Liu, M.; Ju, X.; Gao, B.; Su, F.; Chen, X.; Rees, R.M. Nitrous Oxide Emissions Increase Exponentially When Optimum Nitrogen Fertilizer Rates Are Exceeded in the North China Plain. Environ. Sci. Technol. 2018, 52, 12504–12513. [Google Scholar] [CrossRef]
- Sainju, U.M.; Ghimire, R.; Mishra, U.; Jagadamma, S. Reducing nitrous oxide emissions and optimizing nitrogen-use efficiency in dryland crop rotations with different nitrogen rates. Nutr. Cycl. Agroecosystems 2020, 116, 381–395. [Google Scholar] [CrossRef]
- Jiang, Q.; Madramootoo, C.A.; Qi, Z. Soil carbon and nitrous oxide dynamics in corn (Zea mays L.) production under different nitrogen, tillage and residue management practices. Field Crops Res. 2022, 277, 108421. [Google Scholar] [CrossRef]
- Xu, C.; Han, X.; Ru, S.; Cardenas, L.; Rees, R.M.; Wu, D.; Wu, W.; Meng, F. Crop straw incorporation interacts with N fertilizer on N2O emissions in an intensively cropped farmland. Geoderma 2019, 341, 129–137. [Google Scholar] [CrossRef]
- Kim, G.W.; Gwon, H.S.; Jeong, S.T.; Hwang, H.Y.; Kim, P.J. Different responses of nitrogen fertilization on methane emission in rice plant included and excluded soils during cropping season. Agric. Ecosyst. Environ. 2016, 230, 162–168. [Google Scholar] [CrossRef]
- Kim, G.W.; Lim, J.Y.; Islam Bhuiyan, M.S.; Das, S.; Khan, M.I.; Kim, P.J. Investigating the arable land that is the main contributor to global warming between paddy and upland vegetable crops under excessive nitrogen fertilization. J. Clean. Prod. 2022, 346, 131197. [Google Scholar] [CrossRef]
- Ma, L.; Kong, F.; Lv, X.; Wang, Z.; Zhou, Z.; Meng, Y. Responses of greenhouse gas emissions to different straw management methods with the same amount of carbon input in cotton field. Soil Tillage Res. 2021, 213, 105126. [Google Scholar] [CrossRef]
- Lenka, S.; Lenka, N.K.; Singh, A.B.; Singh, B.; Raghuwanshi, J. Global warming potential and greenhouse gas emission under different soil nutrient management practices in soybean–wheat system of central India. Environ. Sci. Pollut. Res. 2017, 24, 4603–4612. [Google Scholar] [CrossRef]
- Battaglia, M.L.; Thomason, W.E.; Fike, J.H.; Evanylo, G.K.; Stewart, R.D.; Gross, C.D.; Seleiman, M.; Babur, E.; Sadeghpour, A.; Harrison, M.T. Corn and Wheat Residue Management Effects on Greenhouse Emissions in the Mid-Atlantic USA. Land 2022, 11, 846. [Google Scholar] [CrossRef]
- Mirzaei, M.; Gorji Anari, M.; Razavy-Toosi, E.; Zaman, M.; Saronjic, N.; Zamir, S.M.; Mohammed, S.; Caballero-Calvo, A. Crop residues in corn-wheat rotation in a semi-arid region increase CO2 efflux under conventional tillage but not in a no-tillage system. Pedobiologia 2022, 93–94, 150819. [Google Scholar] [CrossRef]
- Lenka, S.; Trivedi, P.; Singh, B.; Singh, B.P.; Pendall, E.; Bass, A.; Lenka, N.K. Effect of crop residue addition on soil organic carbon priming as influenced by temperature and soil properties. Geoderma 2019, 347, 70–79. [Google Scholar] [CrossRef]
- Fang, Y.; Singh, B.P.; Cowie, A.; Wang, W.; Arachchi, M.H.; Wang, H.; Tavakkoli, E. Balancing nutrient stoichiometry facilitates the fate of wheat residue-carbon in physically defined soil organic matter fractions. Geoderma 2019, 354, 113883. [Google Scholar] [CrossRef]
- Ferchaud, F.; Recous, S. The combination of residue quality, residue placement and soil mineral N content drives C and N dynamics by modifying N availability to microbial decomposers. Soil Biol. Biochem. 2021, 163, 108434. [Google Scholar] [CrossRef]
- Fang, Y.; Singh, B.P.; Collins, D.; Li, B.; Zhu, J.; Tavakkoli, E. Nutrient supply enhanced wheat residue-carbon mineralization, microbial growth, and microbial carbon-use efficiency when residues were supplied at high rate in contrasting soils. Soil Biol. Biochem. 2018, 126, 168–178. [Google Scholar] [CrossRef]
- Hu, X.K.; Su, F.; Ju, X.T.; Gao, B.; Oenema, O.; Christie, P.; Huang, B.X.; Jiang, R.F.; Zhang, F.S. Greenhouse gas emissions from a wheat-maize double cropping system with different nitrogen fertilization regimes. Environ. Pollut. 2013, 176, 198–207. [Google Scholar] [CrossRef] [PubMed]
- Lo, L.S.H.; Xu, Z.; Lee, S.S.; Lau, W.K.; Qiu, J.W.; Liu, H.; Qian, P.Y.; Cheng, J. How elevated nitrogen load affects bacterial community structure and nitrogen cycling services in coastal water. Front. Microbiol. 2022, 13, 1062029. [Google Scholar] [CrossRef]
- Jones, C.M.; Putz, M.; Tiemann, M.; Hallin, S. Reactive nitrogen restructures and weakens microbial controls of soil N2O emissions. Commun. Biol. 2022, 5, 273. [Google Scholar] [CrossRef]
- Shakoor, A.; Shahbaz, M.; Farooq, T.H.; Sahar, N.E.; Shahzad, S.M.; Altaf, M.M.; Ashraf, M. A global meta-analysis of greenhouse gases emission and crop yield under no-tillage as compared to conventional tillage. Sci. Total Environ. 2021, 750, 142299. [Google Scholar] [CrossRef]
- Hu, X.; Gu, H.; Liu, J.; Wei, D.; Zhu, P.; Cui, X.; Zhou, B.; Chen, X.; Jin, J.; Liu, X.; et al. Metagenomics reveals divergent functional profiles of soil carbon and nitrogen cycling under long-term addition of chemical and organic fertilizers in the black soil region. Geoderma 2022, 418, 115846. [Google Scholar] [CrossRef]
- Jiang, C.M.; Yu, W.T.; Ma, Q.; Xu, Y.G.; Zou, H. Alleviating global warming potential by soil carbon sequestration: A multi-level straw incorporation experiment from a maize cropping system in Northeast China. Soil Tillage Res. 2017, 170, 77–84. [Google Scholar] [CrossRef]
- Basalirwa, D.; Sudo, S.; Wacal, C.; Akae, F.; Oo, A.Z.; Koyama, S.; Sasagawa, D.; Yamamoto, S.; Masunaga, T.; Nishihara, E. Assessment of crop residue and palm shell biochar incorporation on greenhouse gas emissions during the fallow and crop growing seasons of broccoli (Brassica oleracea var. italica). Soil Tillage Res. 2020, 196, 104435. [Google Scholar] [CrossRef]
- Zhang, Y.; Huang, M.; Yu, K.; Xie, Y.; Wang, Y.; Wu, J.; Zheng, F. Decreased CH 4 emissions associated with methanogenic and methanotrophic communities and their interactions following Fe (III) fertiliser application in rice paddies. Geoderma 2023, 431, 116375. [Google Scholar] [CrossRef]
- Oertel, C.; Matschullat, J.; Zurba, K.; Zimmermann, F.; Erasmi, S. Greenhouse gas emissions from soils—A review. Geochemistry 2016, 76, 327–352. [Google Scholar] [CrossRef]


| Source of Variation | Degrees of Freedom | CO2 (46 DAI) | CO2 (116 DAI) | N2O (46 DAI) | N2O (116 DAI) | CH4 (46 DAI) | CH4 (116 DAI) | GWP |
|---|---|---|---|---|---|---|---|---|
| RR rate | 3 | <0.001 | <0.001 | 0.001 | <0.001 | 0.044 | 0.019 | <0.001 |
| Residue placement | 1 | 0.008 | 0.802 | <0.001 | <0.001 | 0.051 | 0.045 | 0.778 |
| NSL | 2 | 0.035 | 0.288 | <0.001 | <0.001 | 0.653 | 0.573 | 0.152 |
| RR rate × Residue placement | 2 | 0.130 | 0.910 | 0.028 | 0.028 | 0.717 | 0.602 | 0.841 |
| RR rate × NSL | 6 | 0.387 | 0.163 | 0.035 | 0.017 | 0.629 | 0.414 | 0.195 |
| Residue placement × NSL | 2 | 0.649 | 0.179 | <0.001 | <0.001 | 0.580 | 0.427 | 0.247 |
| RR rate × Residue placement × NSL | 4 | 0.880 | 0.929 | 0.107 | 0.030 | 0.983 | 0.588 | 0.976 |
| Source of Variation | CO2 | N2O | CH4 |
|---|---|---|---|
| Time | <0.001 | <0.001 | <0.001 |
| Time × RR rate | <0.001 | <0.001 | 0.069 |
| Time × residue placement | <0.001 | <0.001 | 0.091 |
| Time × NSL | 0.020 | <0.001 | 0.474 |
| Time × RR rate × residue placement | 0.967 | 0.045 | 0.387 |
| Time × RR rate × NSL | 0.334 | 0.008 | 0.397 |
| Time × residue placement × NSL | 0.306 | 0.001 | 0.819 |
| Time × RR rate × residue placement × NSL | 0.944 | 0.055 | 0.210 |
Disclaimer/Publisher’s Note: The statements, opinions and data contained in all publications are solely those of the individual author(s) and contributor(s) and not of MDPI and/or the editor(s). MDPI and/or the editor(s) disclaim responsibility for any injury to people or property resulting from any ideas, methods, instructions or products referred to in the content. |
© 2024 by the authors. Licensee MDPI, Basel, Switzerland. This article is an open access article distributed under the terms and conditions of the Creative Commons Attribution (CC BY) license (https://creativecommons.org/licenses/by/4.0/).
Share and Cite
Singh, D.; Lenka, S.; Lenka, N.K.; Yadav, D.K.; Yadav, S.S.; Kanwar, R.S.; Sarkar, A.; Kushwaha, J. Residue Management and Nutrient Stoichiometry Control Greenhouse Gas and Global Warming Potential Responses in Alfisols. Sustainability 2024, 16, 3997. https://doi.org/10.3390/su16103997
Singh D, Lenka S, Lenka NK, Yadav DK, Yadav SS, Kanwar RS, Sarkar A, Kushwaha J. Residue Management and Nutrient Stoichiometry Control Greenhouse Gas and Global Warming Potential Responses in Alfisols. Sustainability. 2024; 16(10):3997. https://doi.org/10.3390/su16103997
Chicago/Turabian StyleSingh, Dharmendra, Sangeeta Lenka, Narendra Kumar Lenka, Dinesh Kumar Yadav, Shashi S. Yadav, Rameshwar S. Kanwar, Abhijit Sarkar, and Jitendra Kushwaha. 2024. "Residue Management and Nutrient Stoichiometry Control Greenhouse Gas and Global Warming Potential Responses in Alfisols" Sustainability 16, no. 10: 3997. https://doi.org/10.3390/su16103997
APA StyleSingh, D., Lenka, S., Lenka, N. K., Yadav, D. K., Yadav, S. S., Kanwar, R. S., Sarkar, A., & Kushwaha, J. (2024). Residue Management and Nutrient Stoichiometry Control Greenhouse Gas and Global Warming Potential Responses in Alfisols. Sustainability, 16(10), 3997. https://doi.org/10.3390/su16103997