


Optimal Planning of Urban Building-Type Integrated Energy Systems Considering Indoor Somatosensory Comfort and PV Consumption


Abstract
1. Introduction
2. Building-Type IES and PMV Index
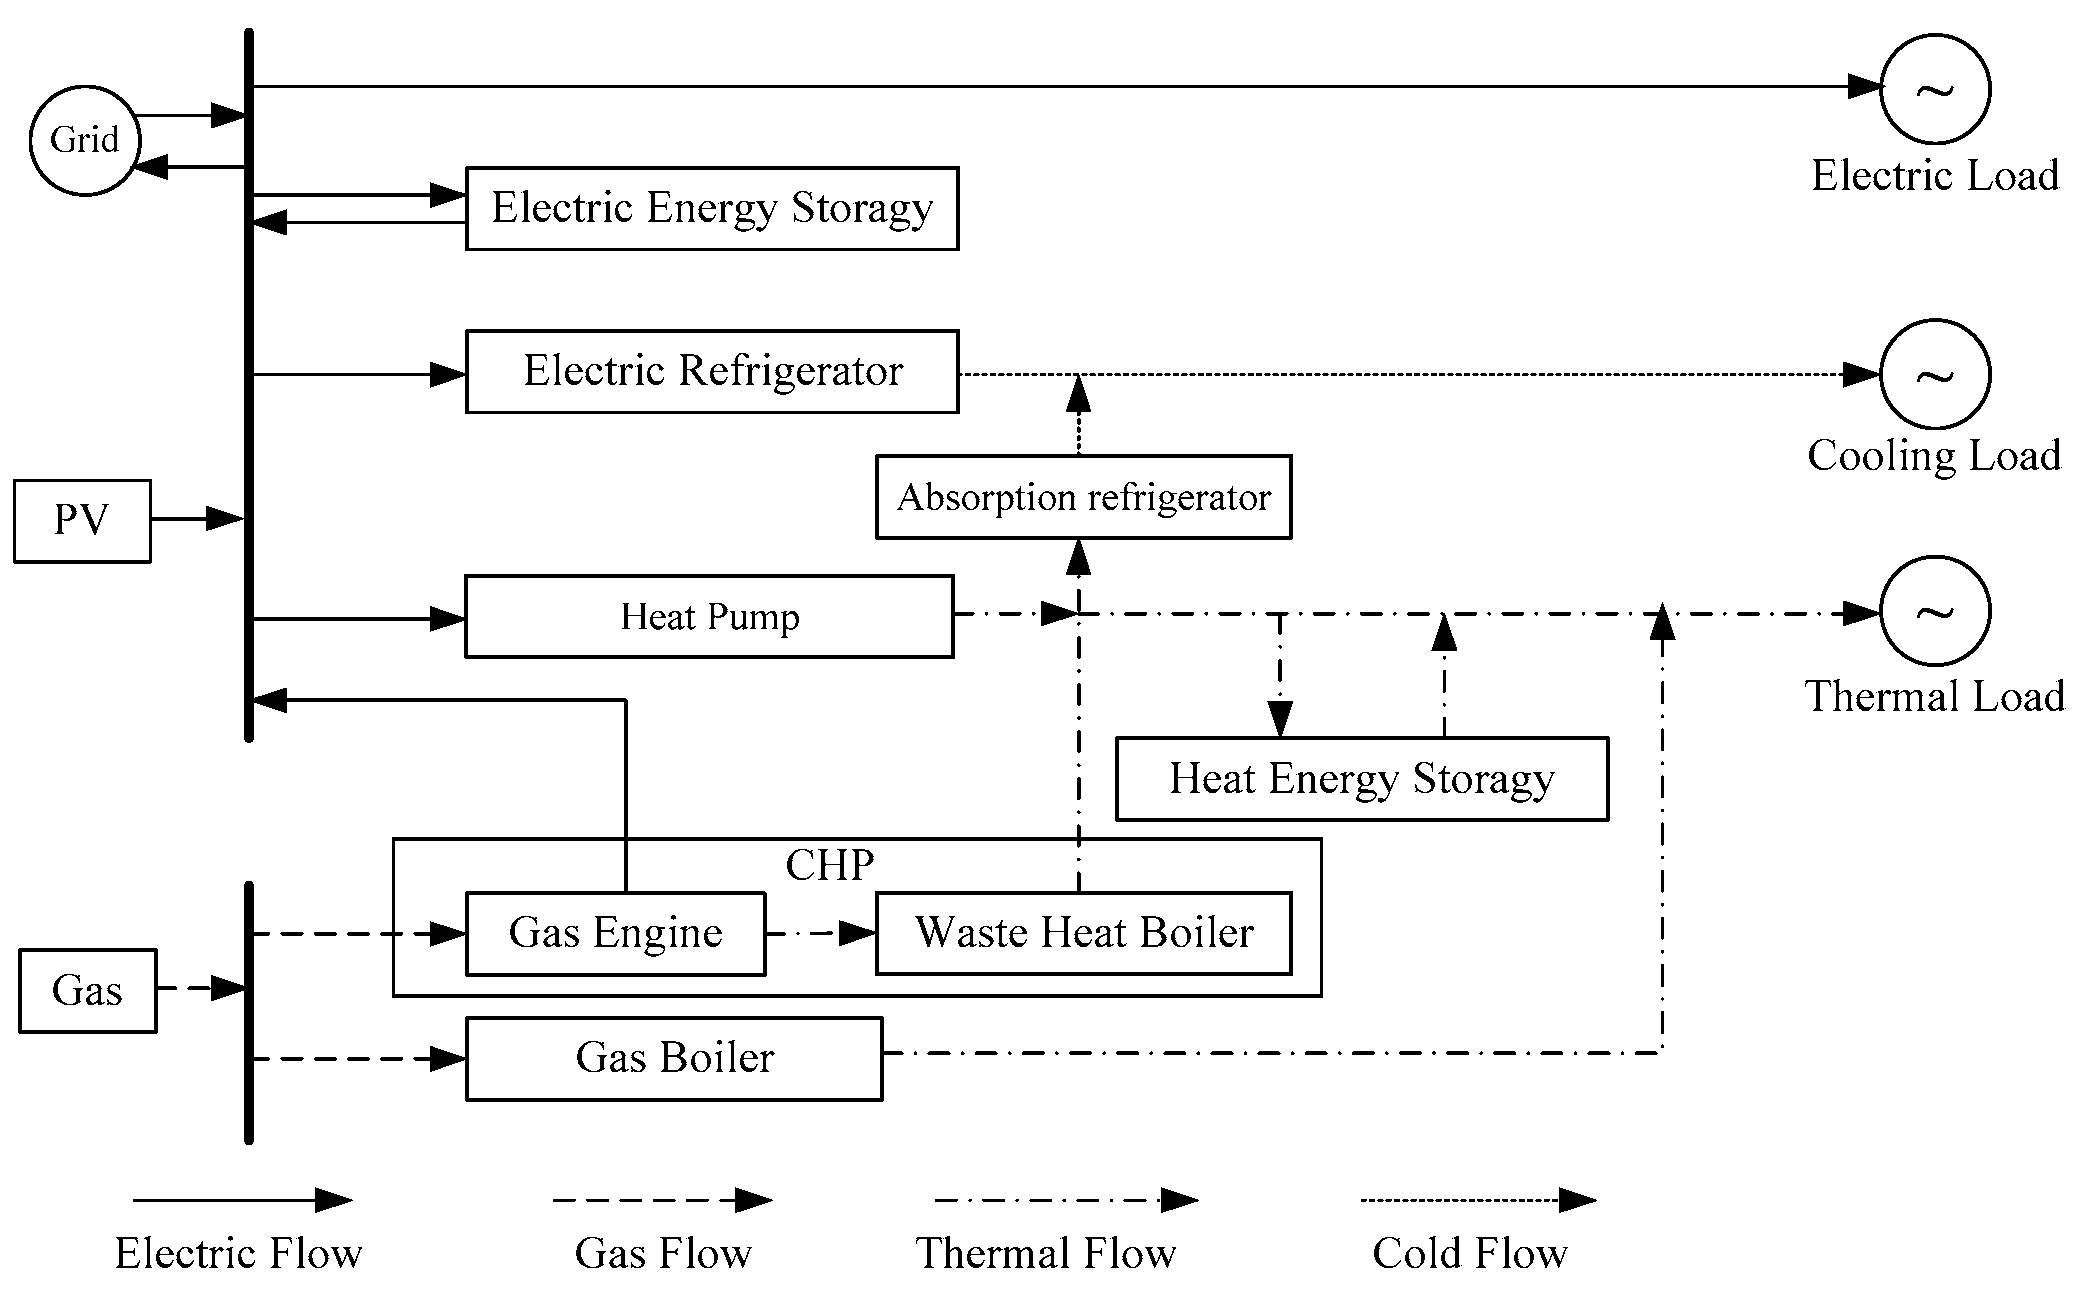
2.1. IES Model
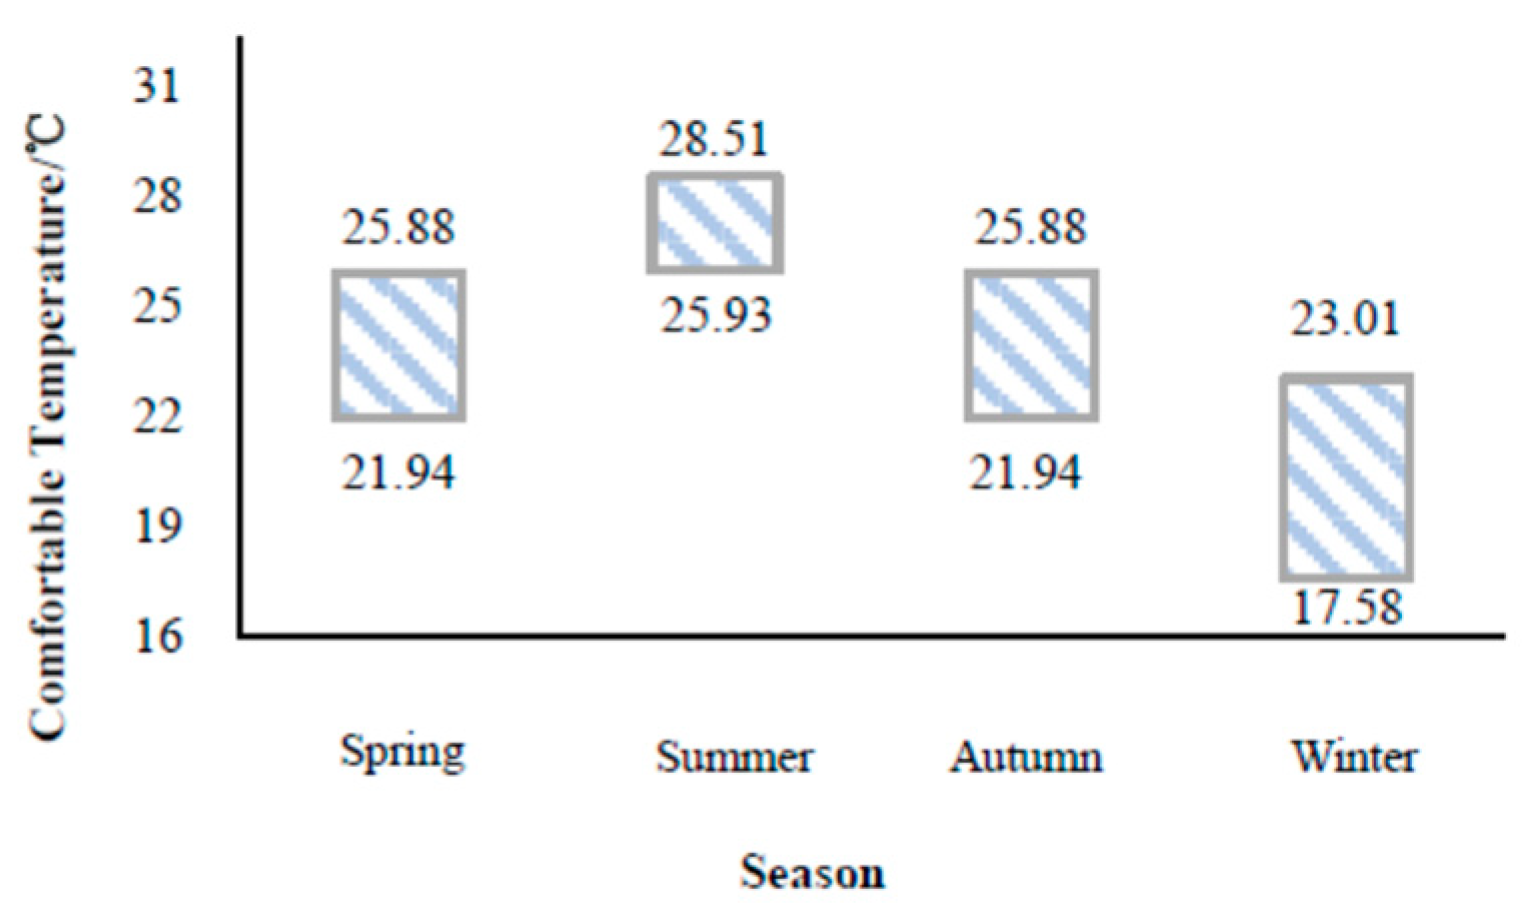
2.2. PMV Index for Building Indoor Somatosensory Comfort
3. Optimization Model for Building-Type IES Planning and Capacity Sizing
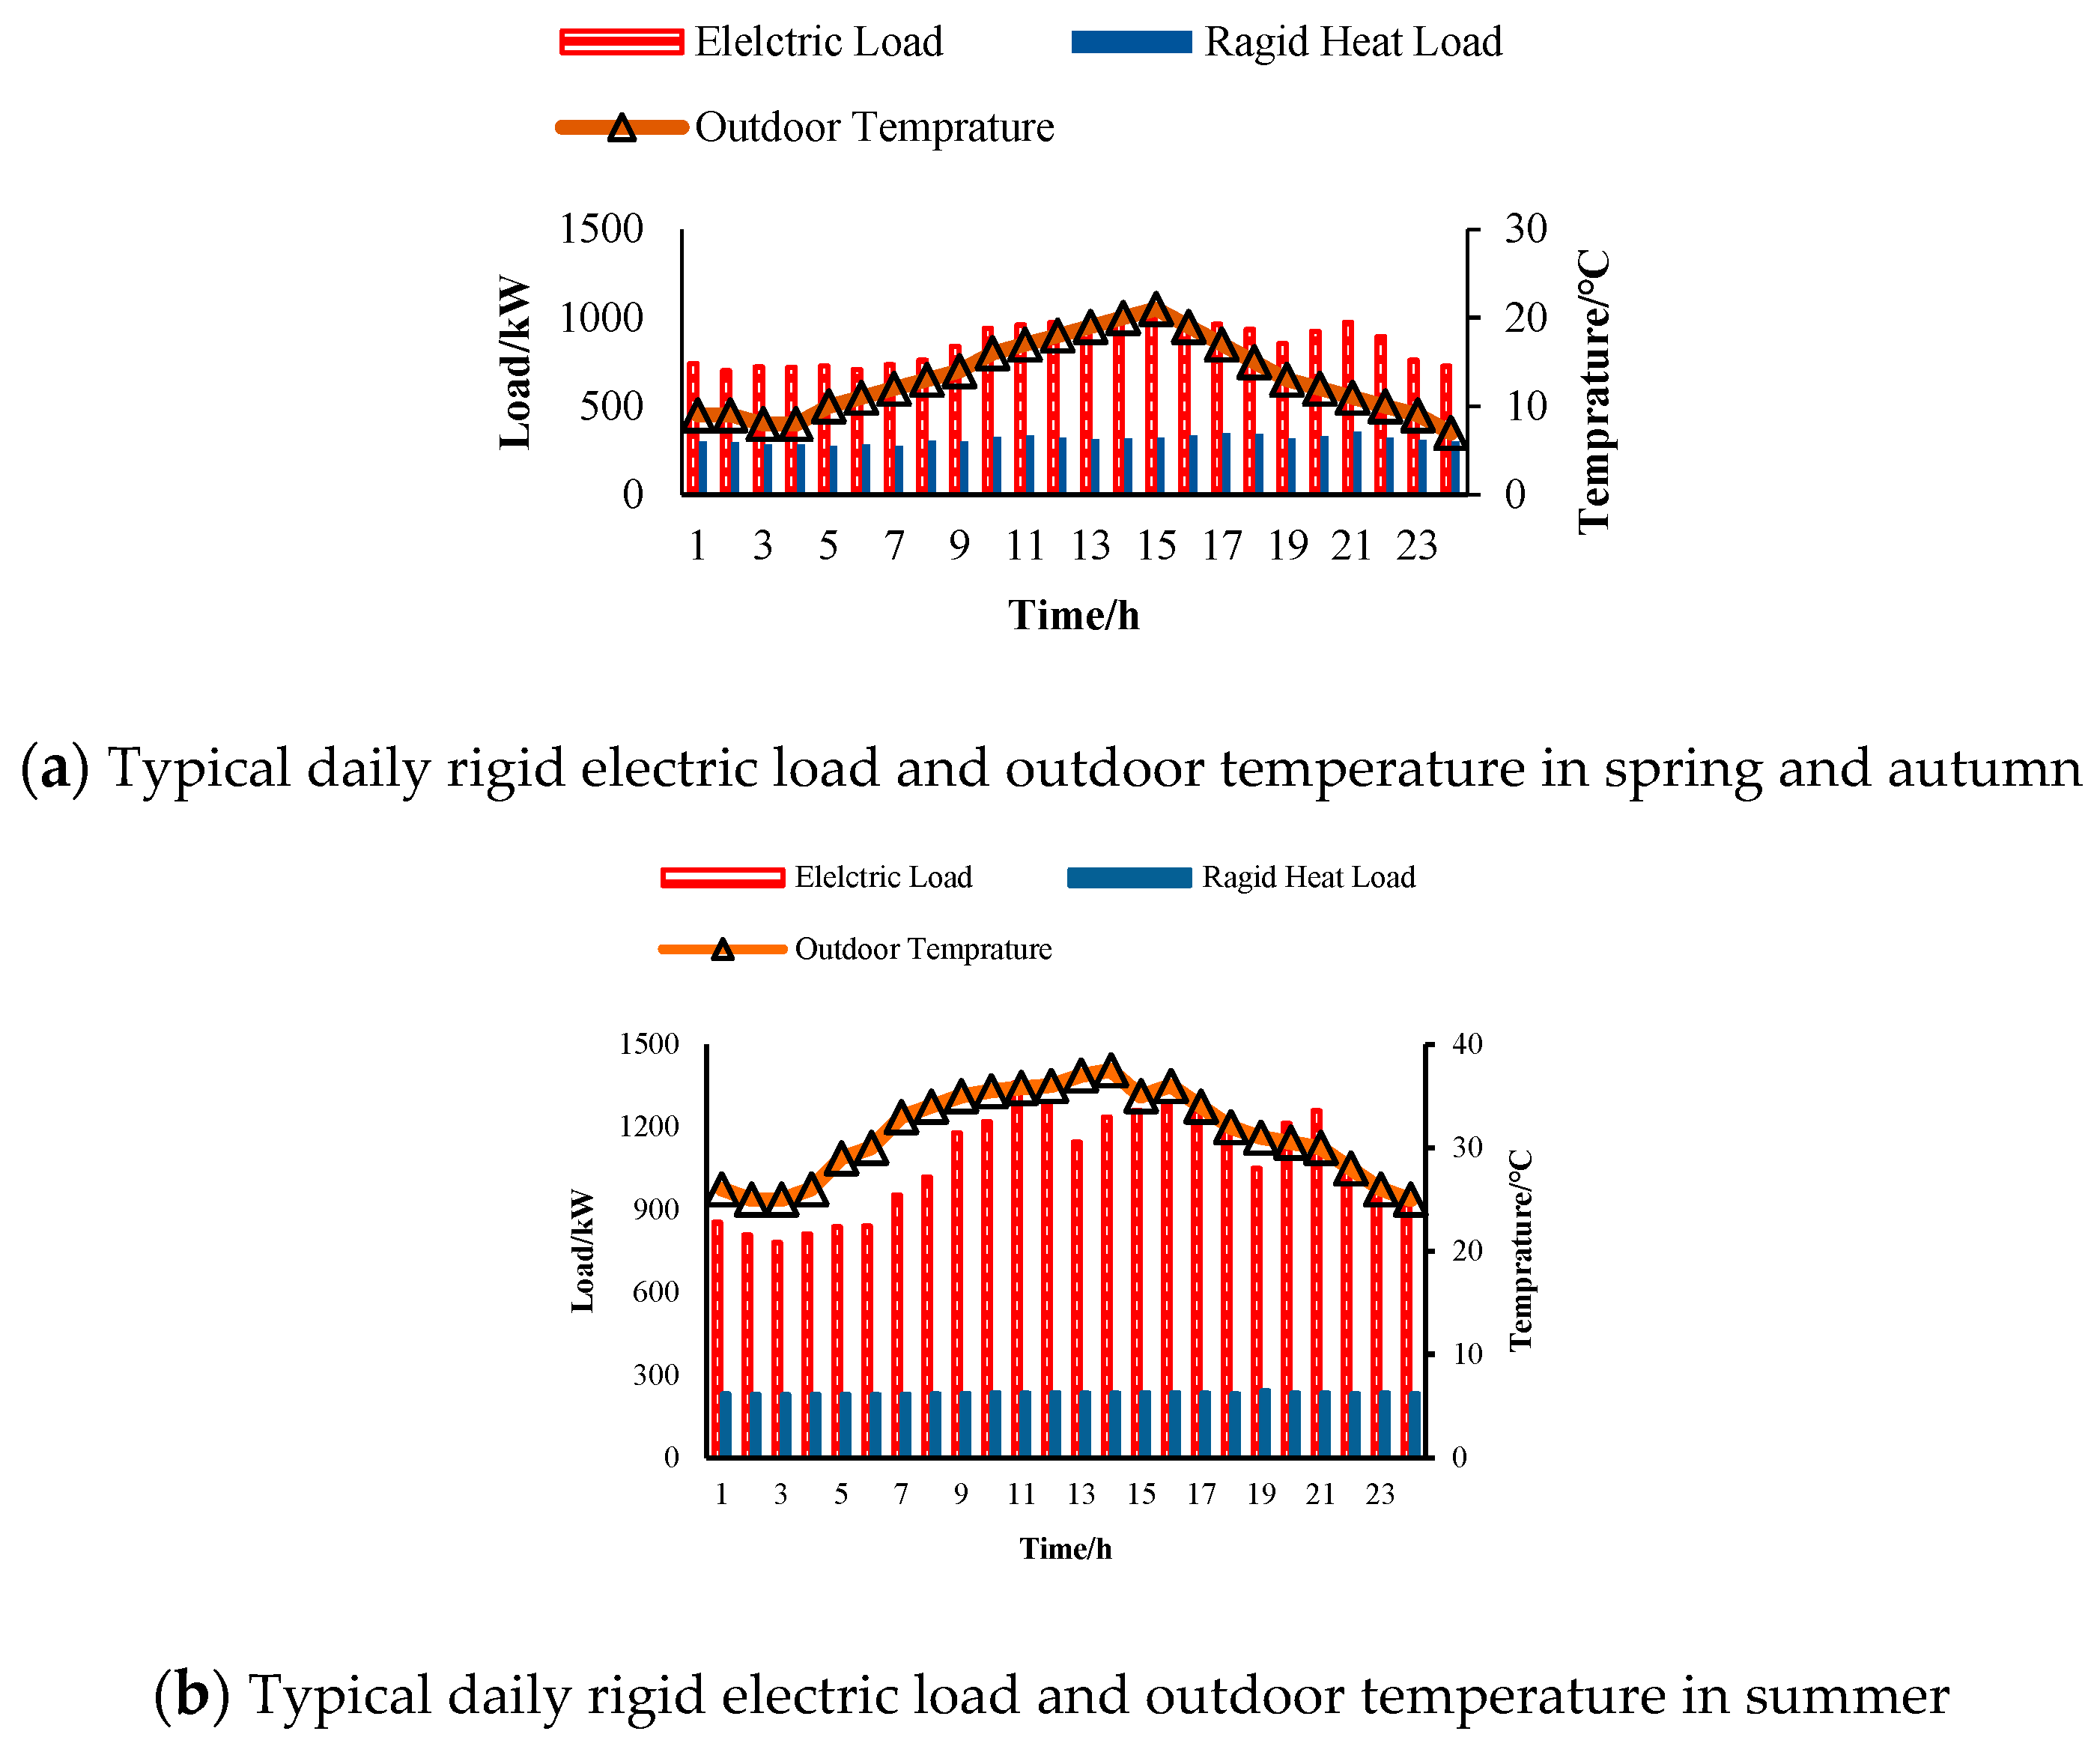
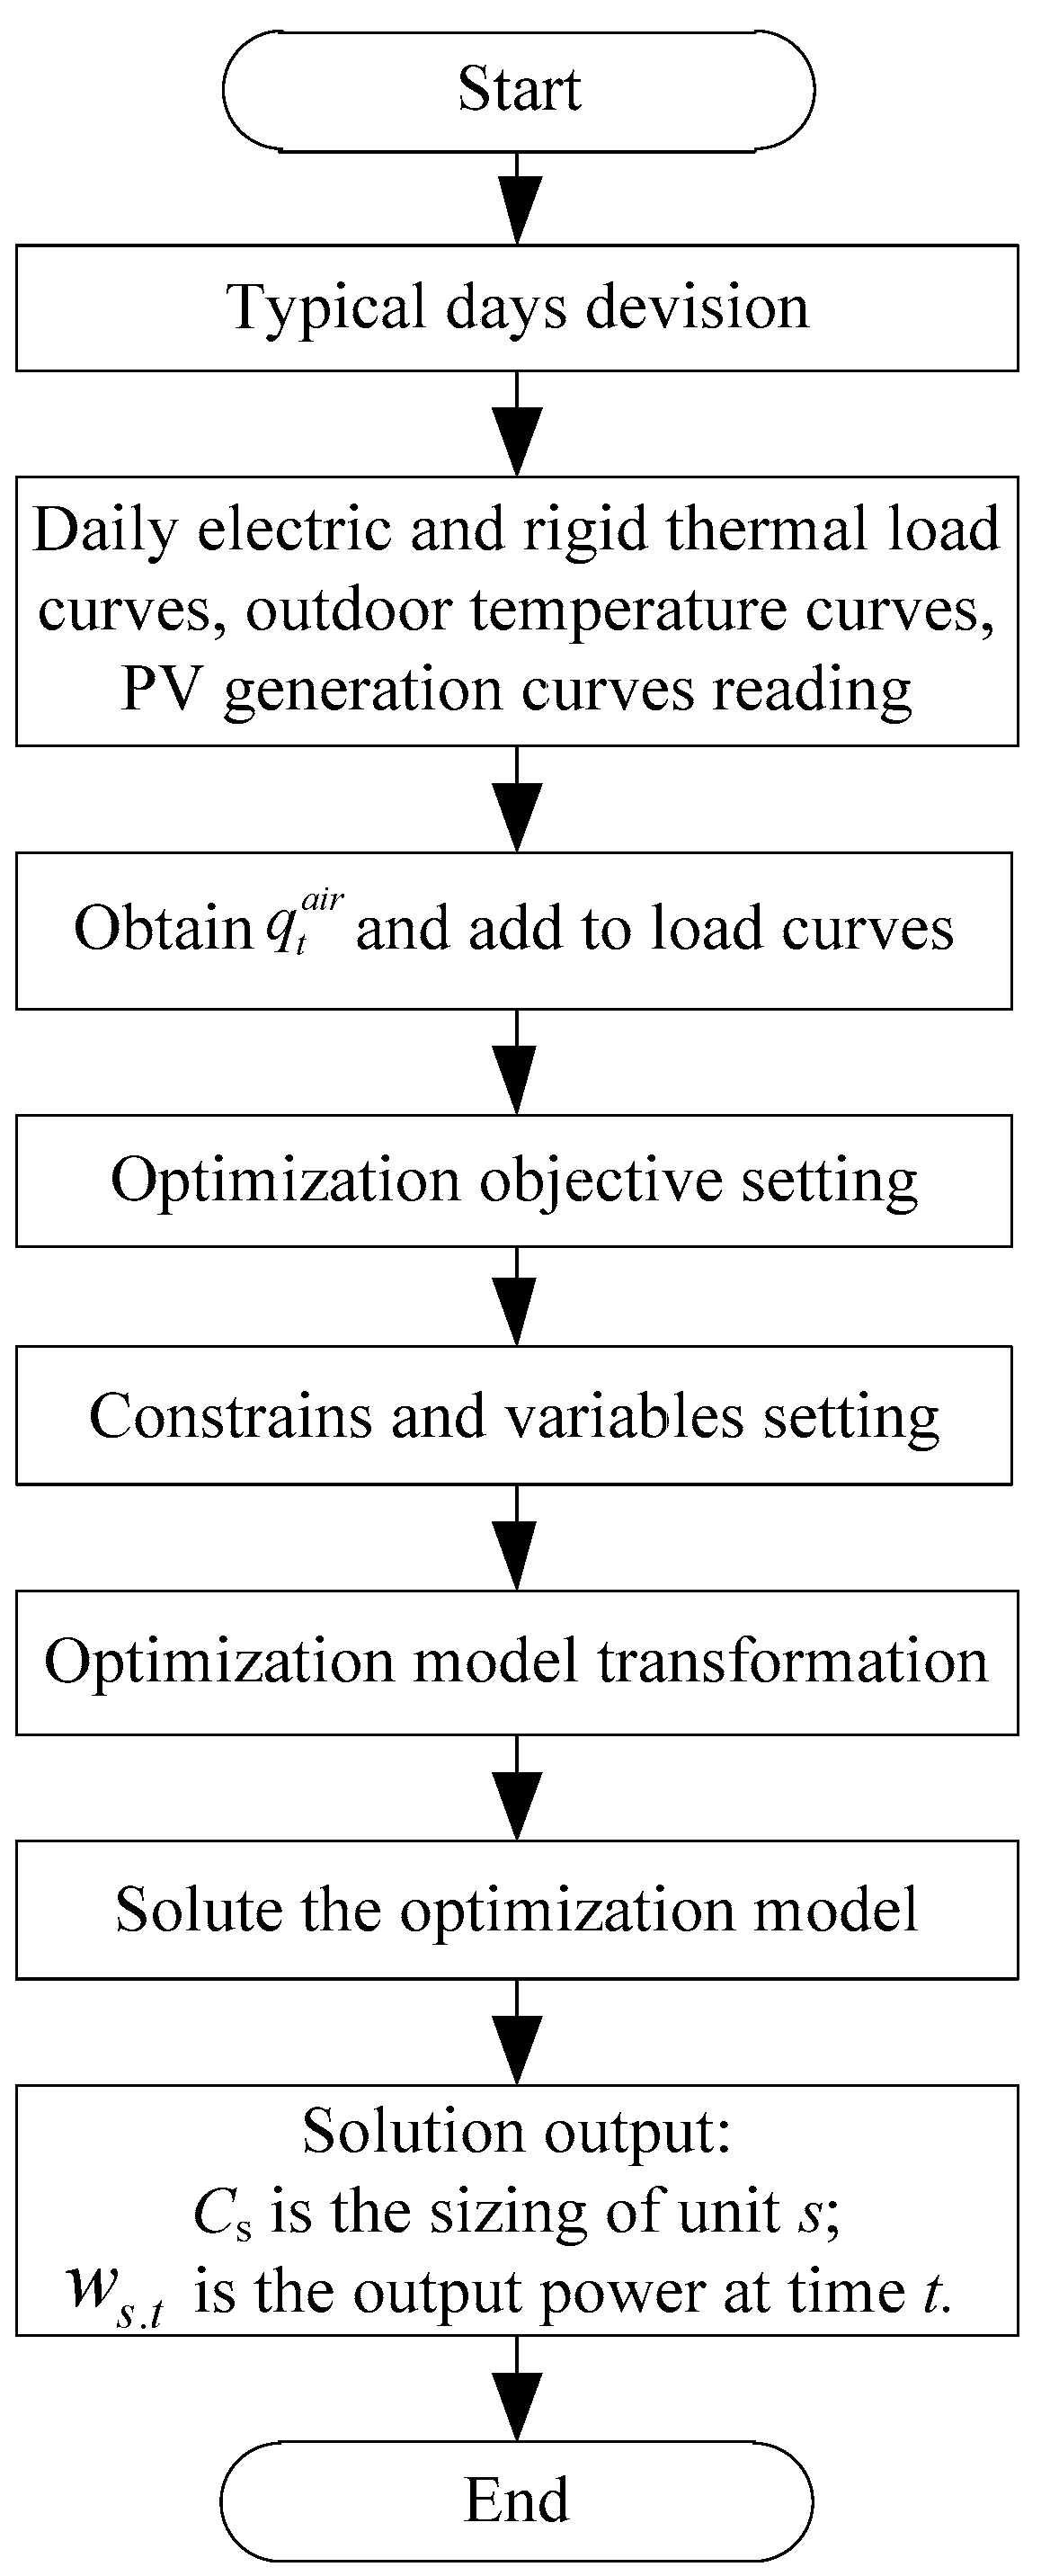
3.1. Preprocessing
3.2. Optimization Objective
3.3. Constrains
3.4. Model Solution
4. Case Studies
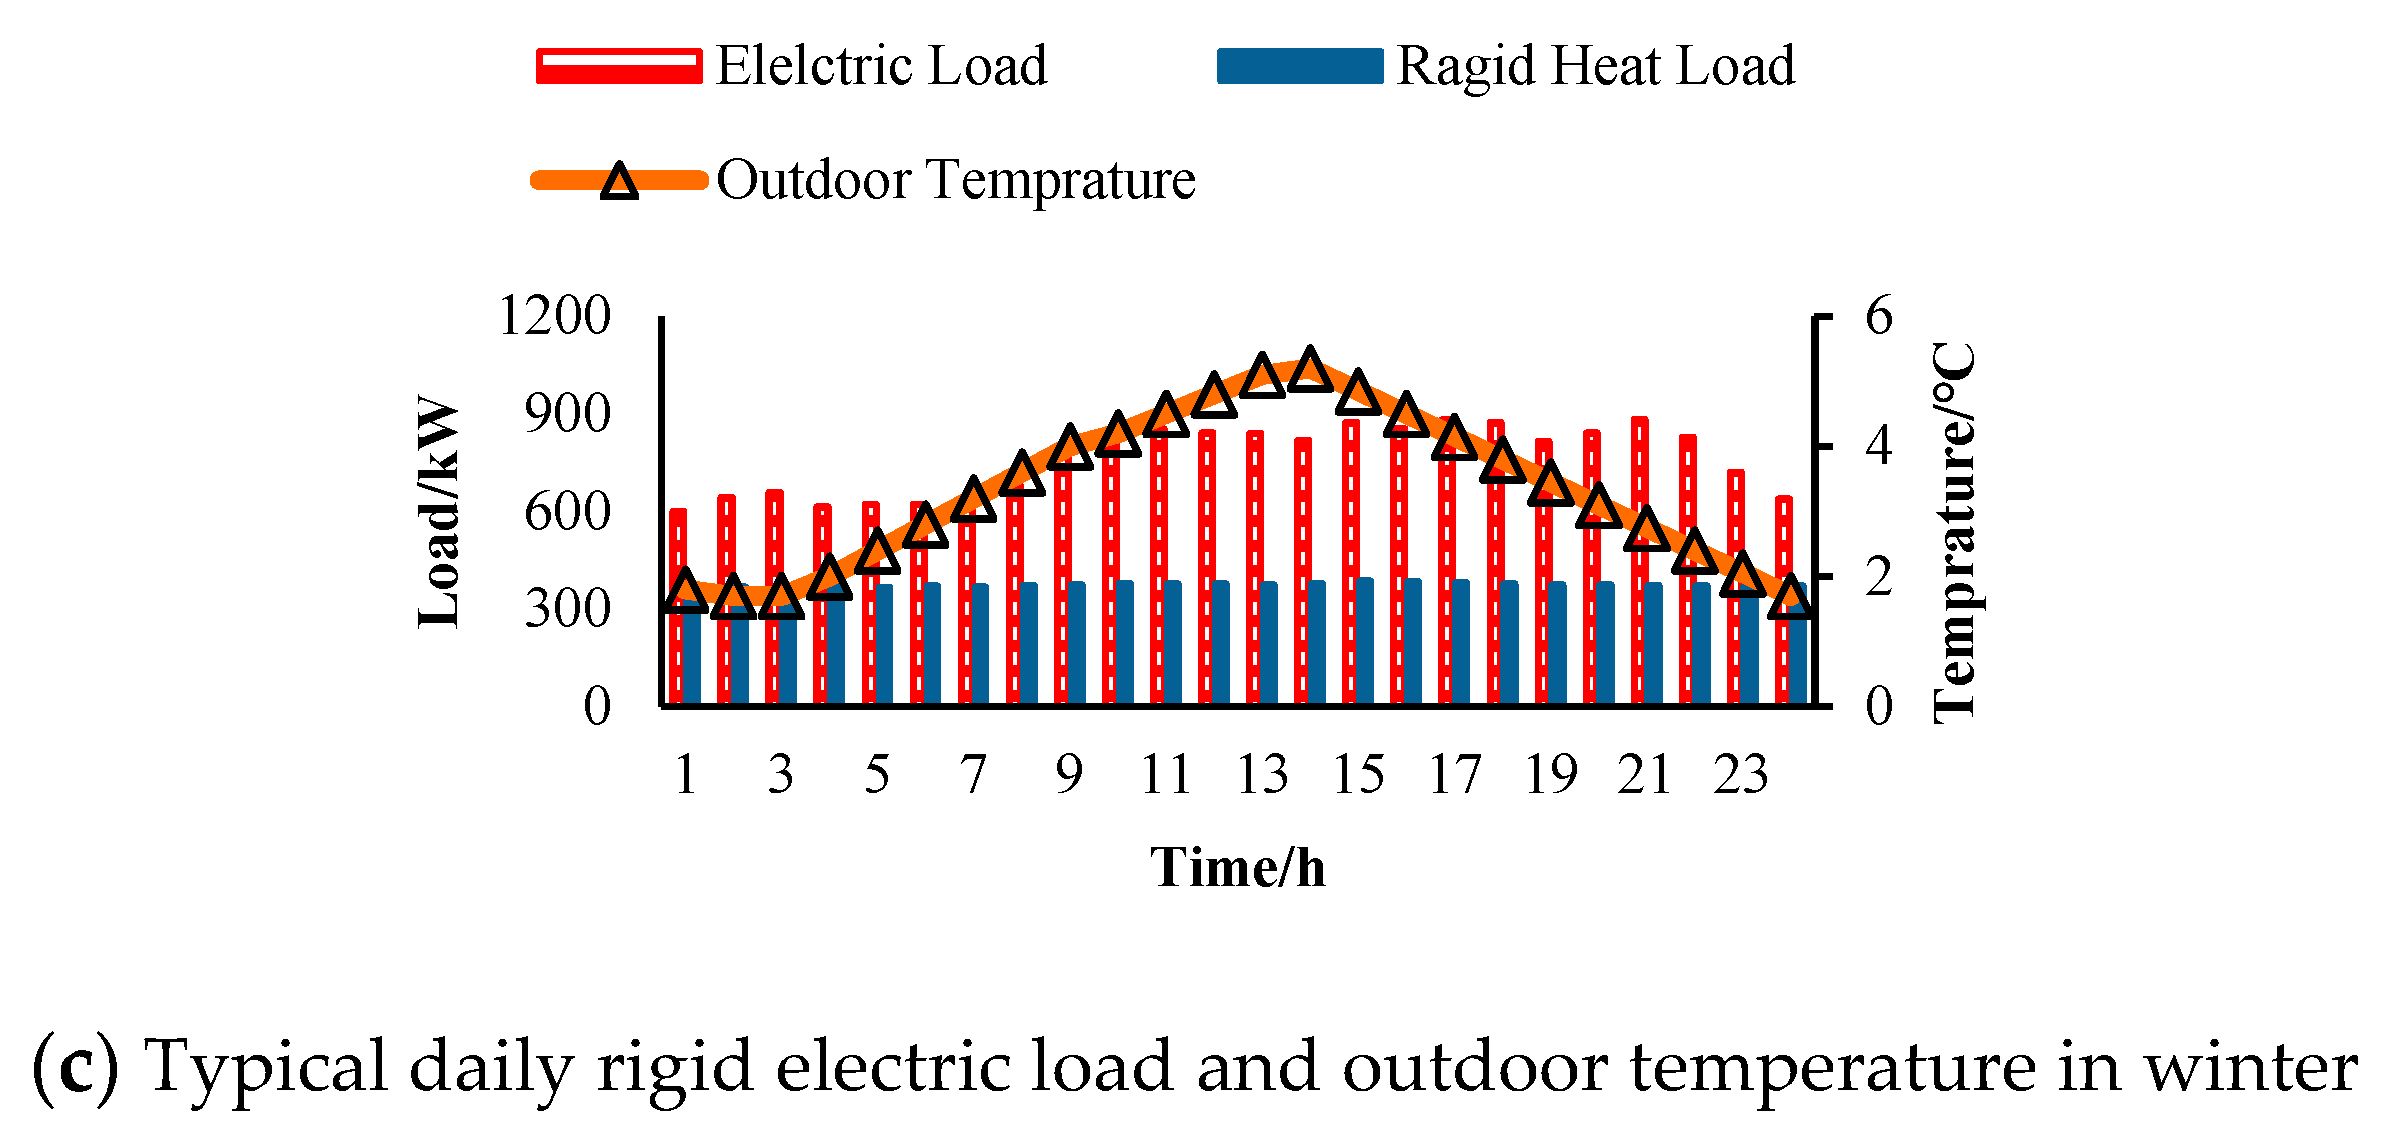
4.1. Basic Settings
4.2. Scenario Analysis without PV Modules
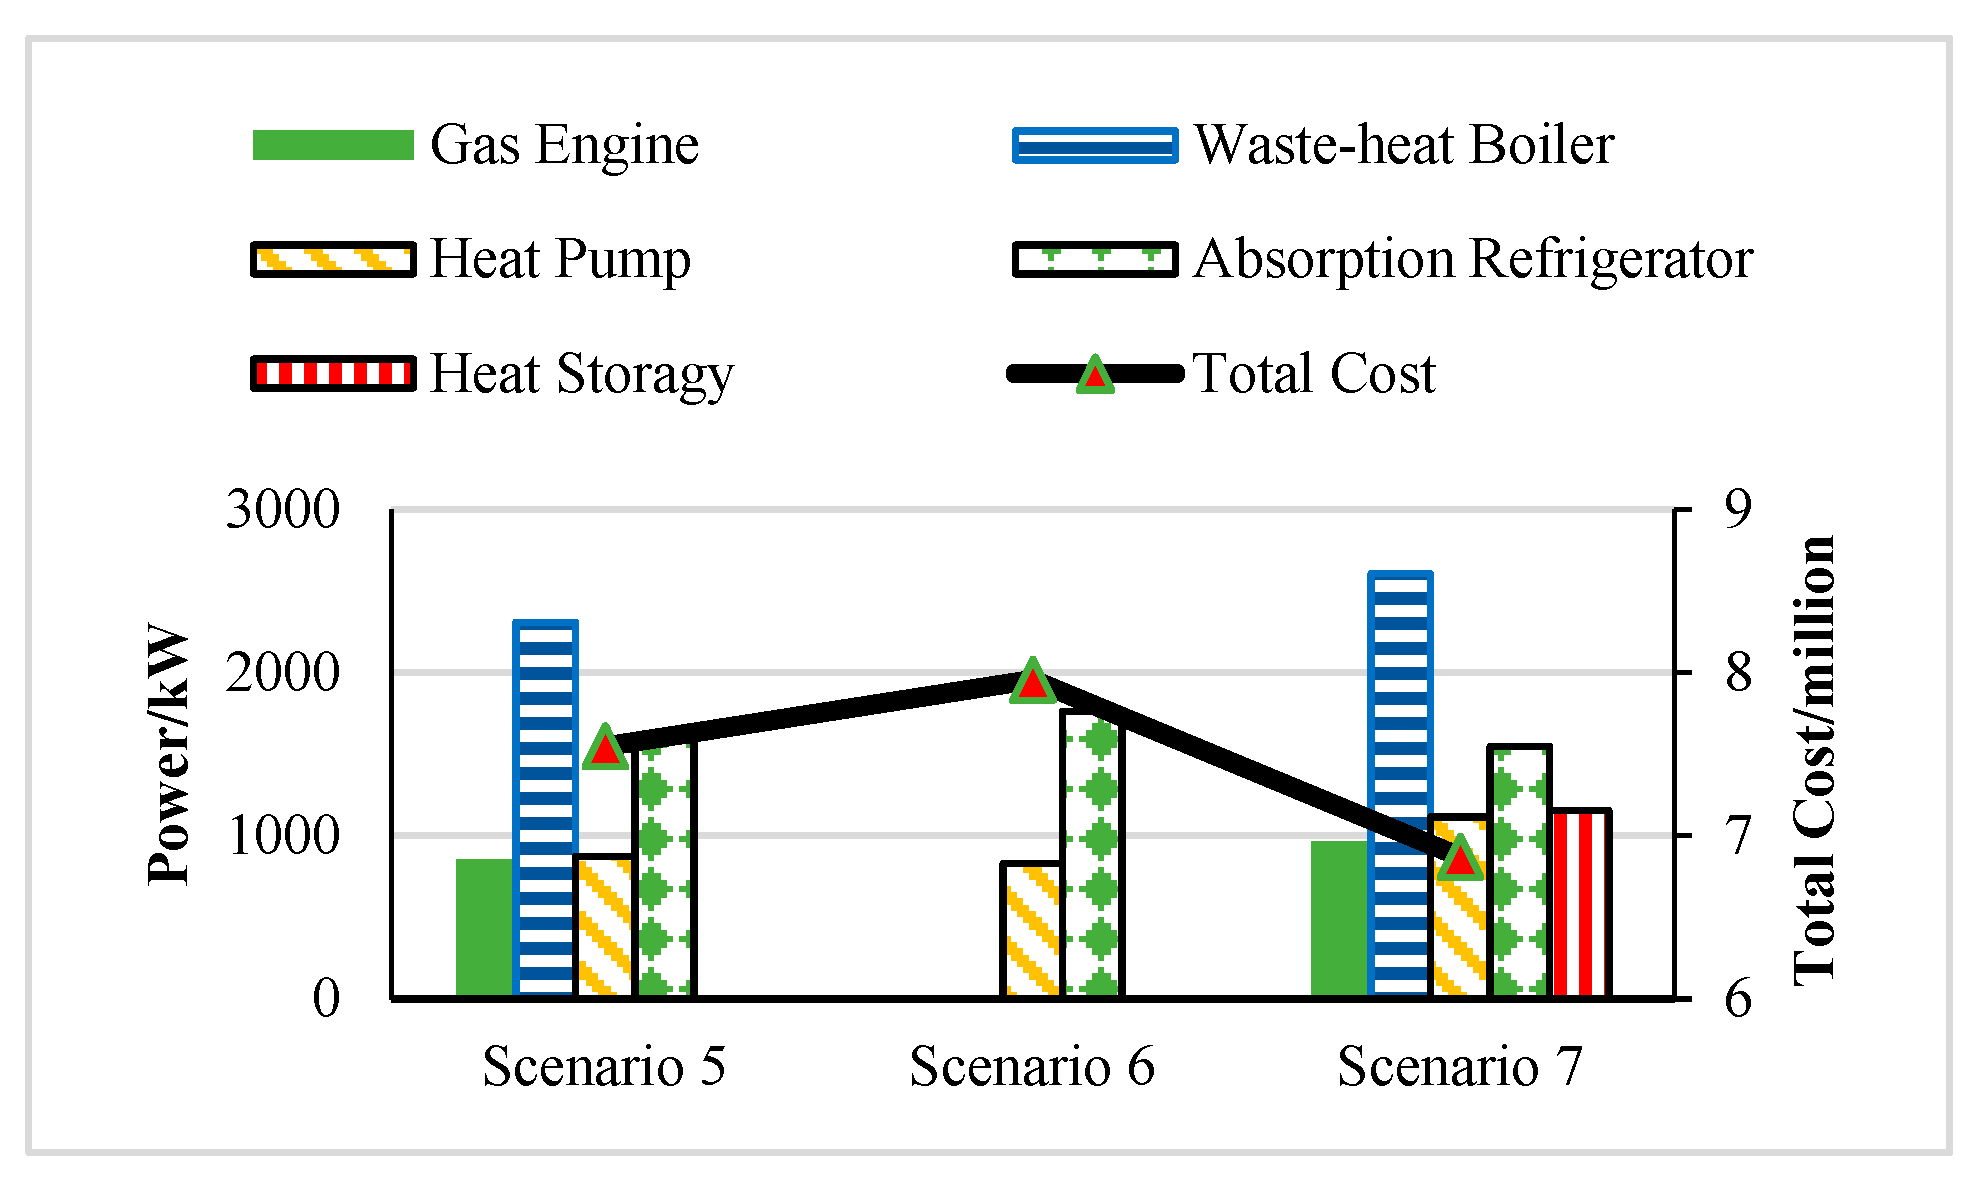
4.3. Scenario Analysis with PV Modules
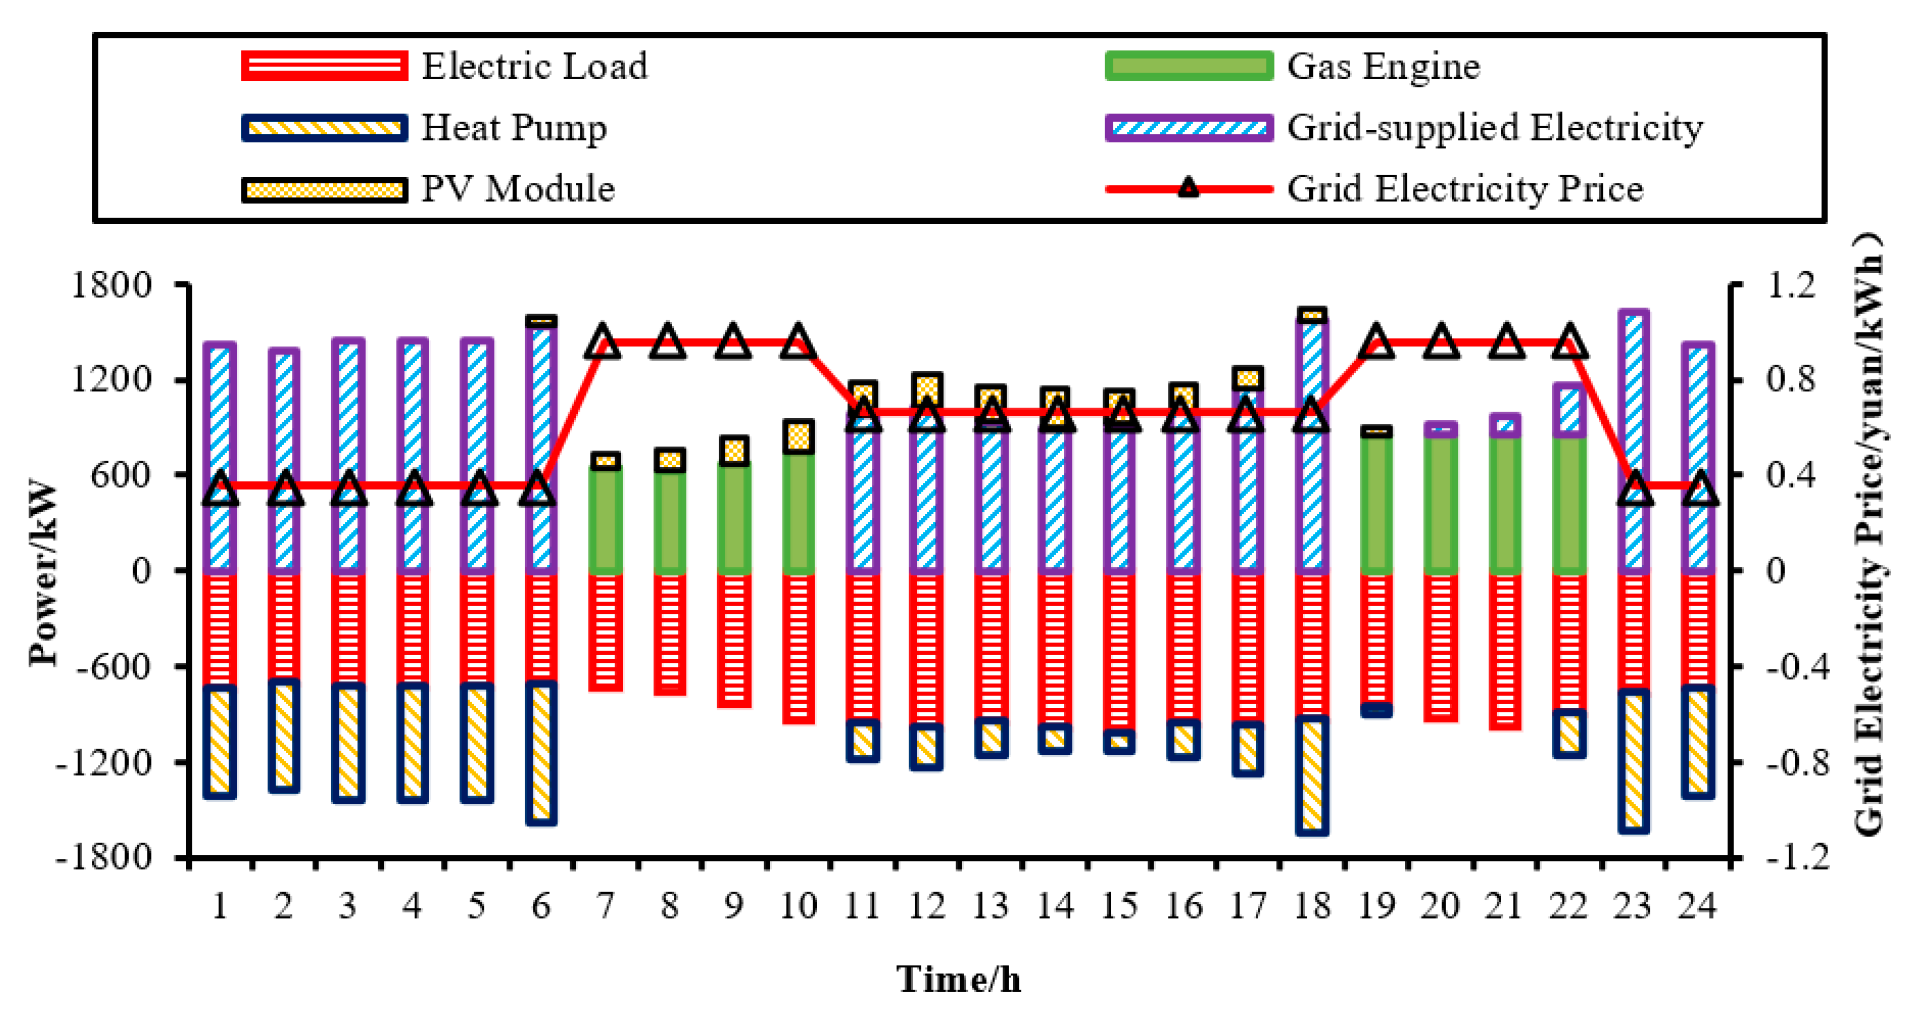
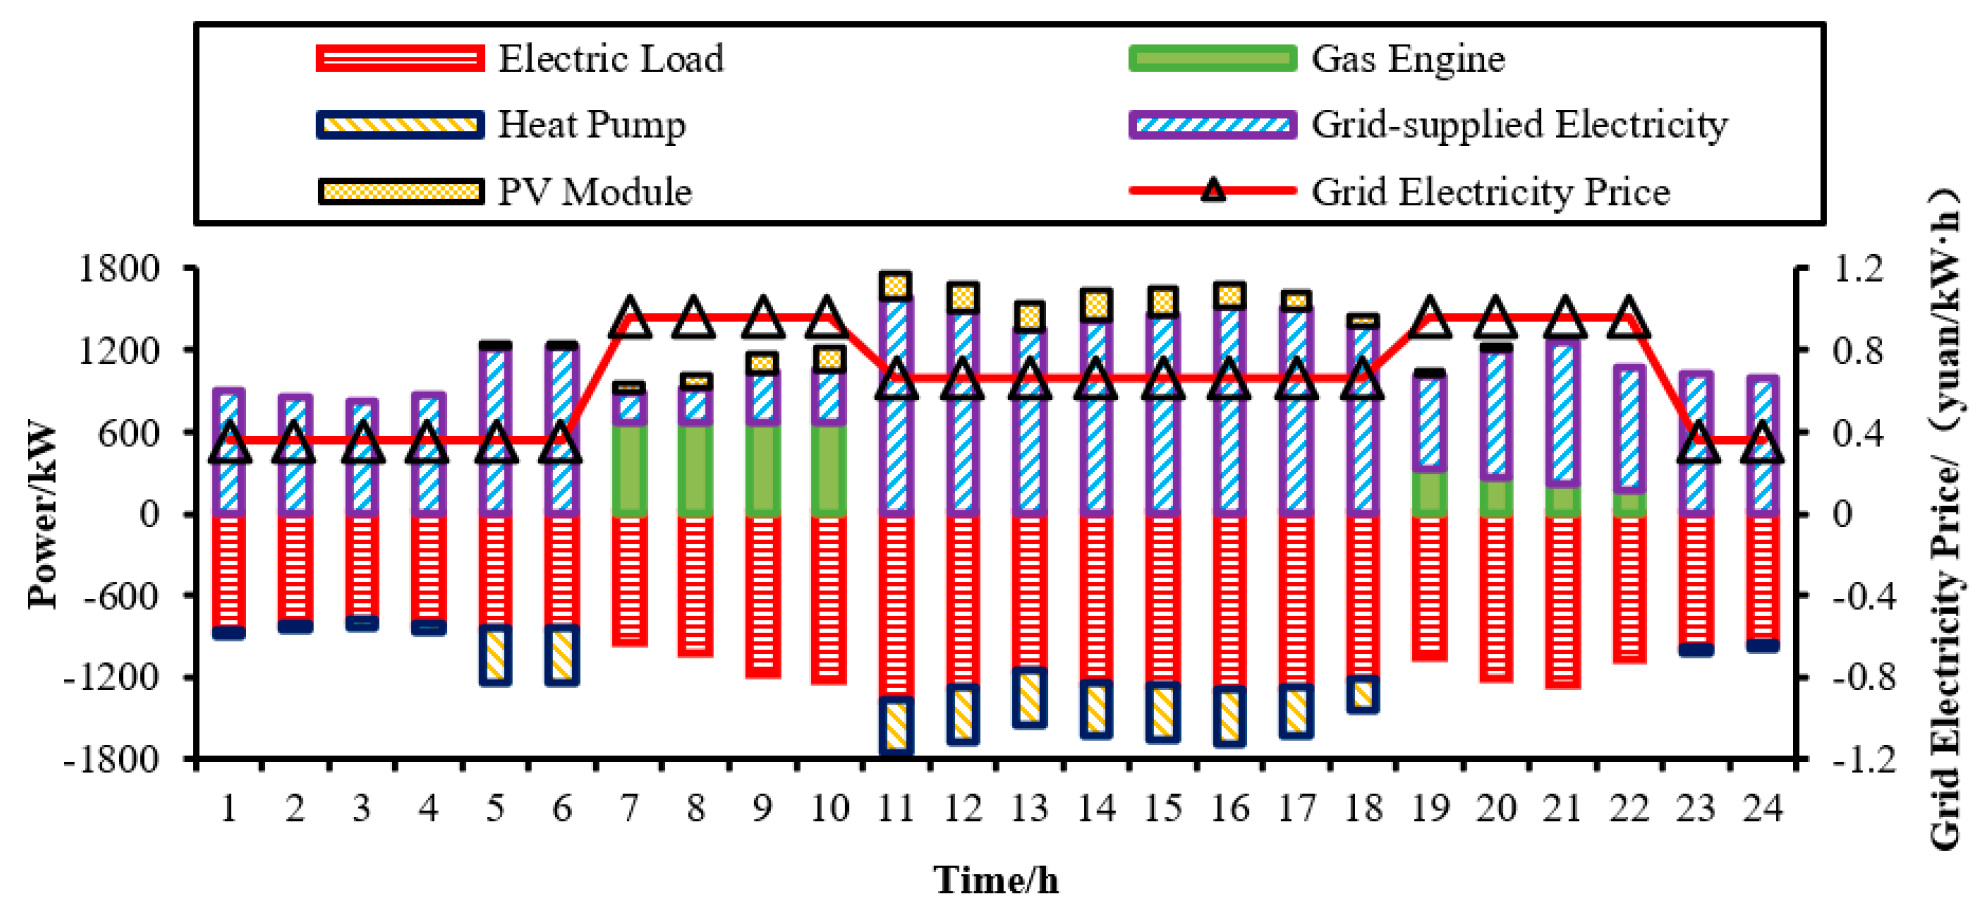
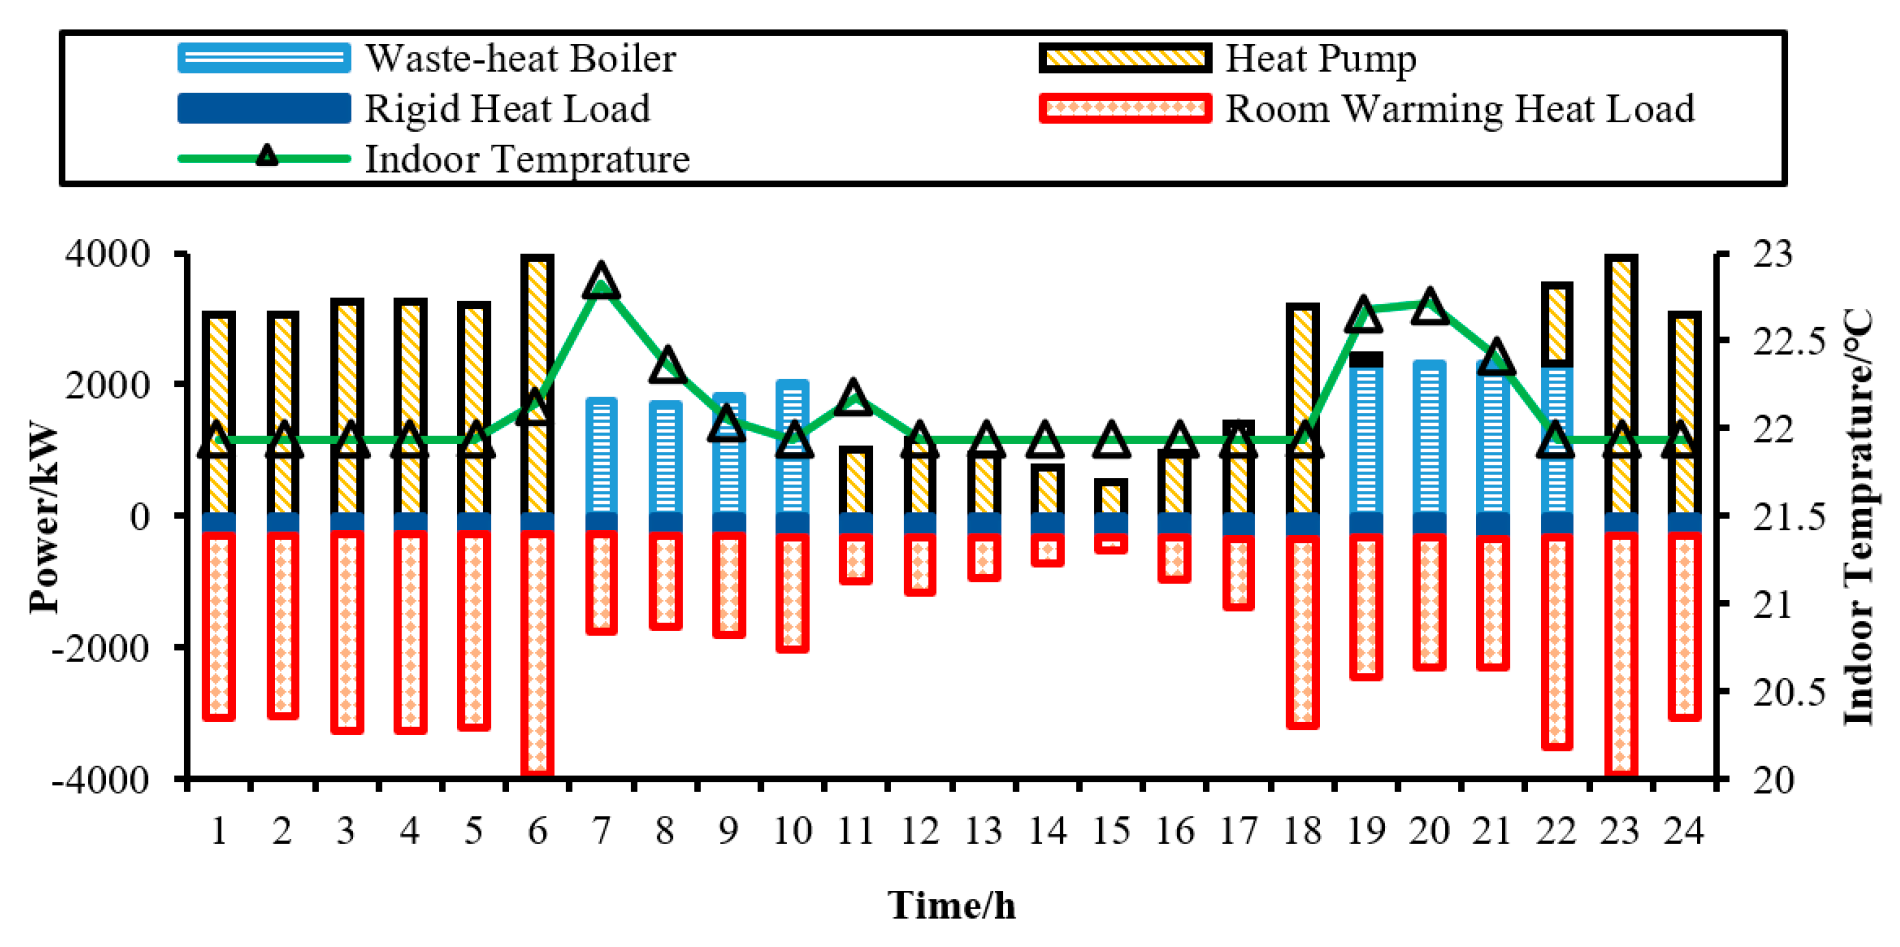
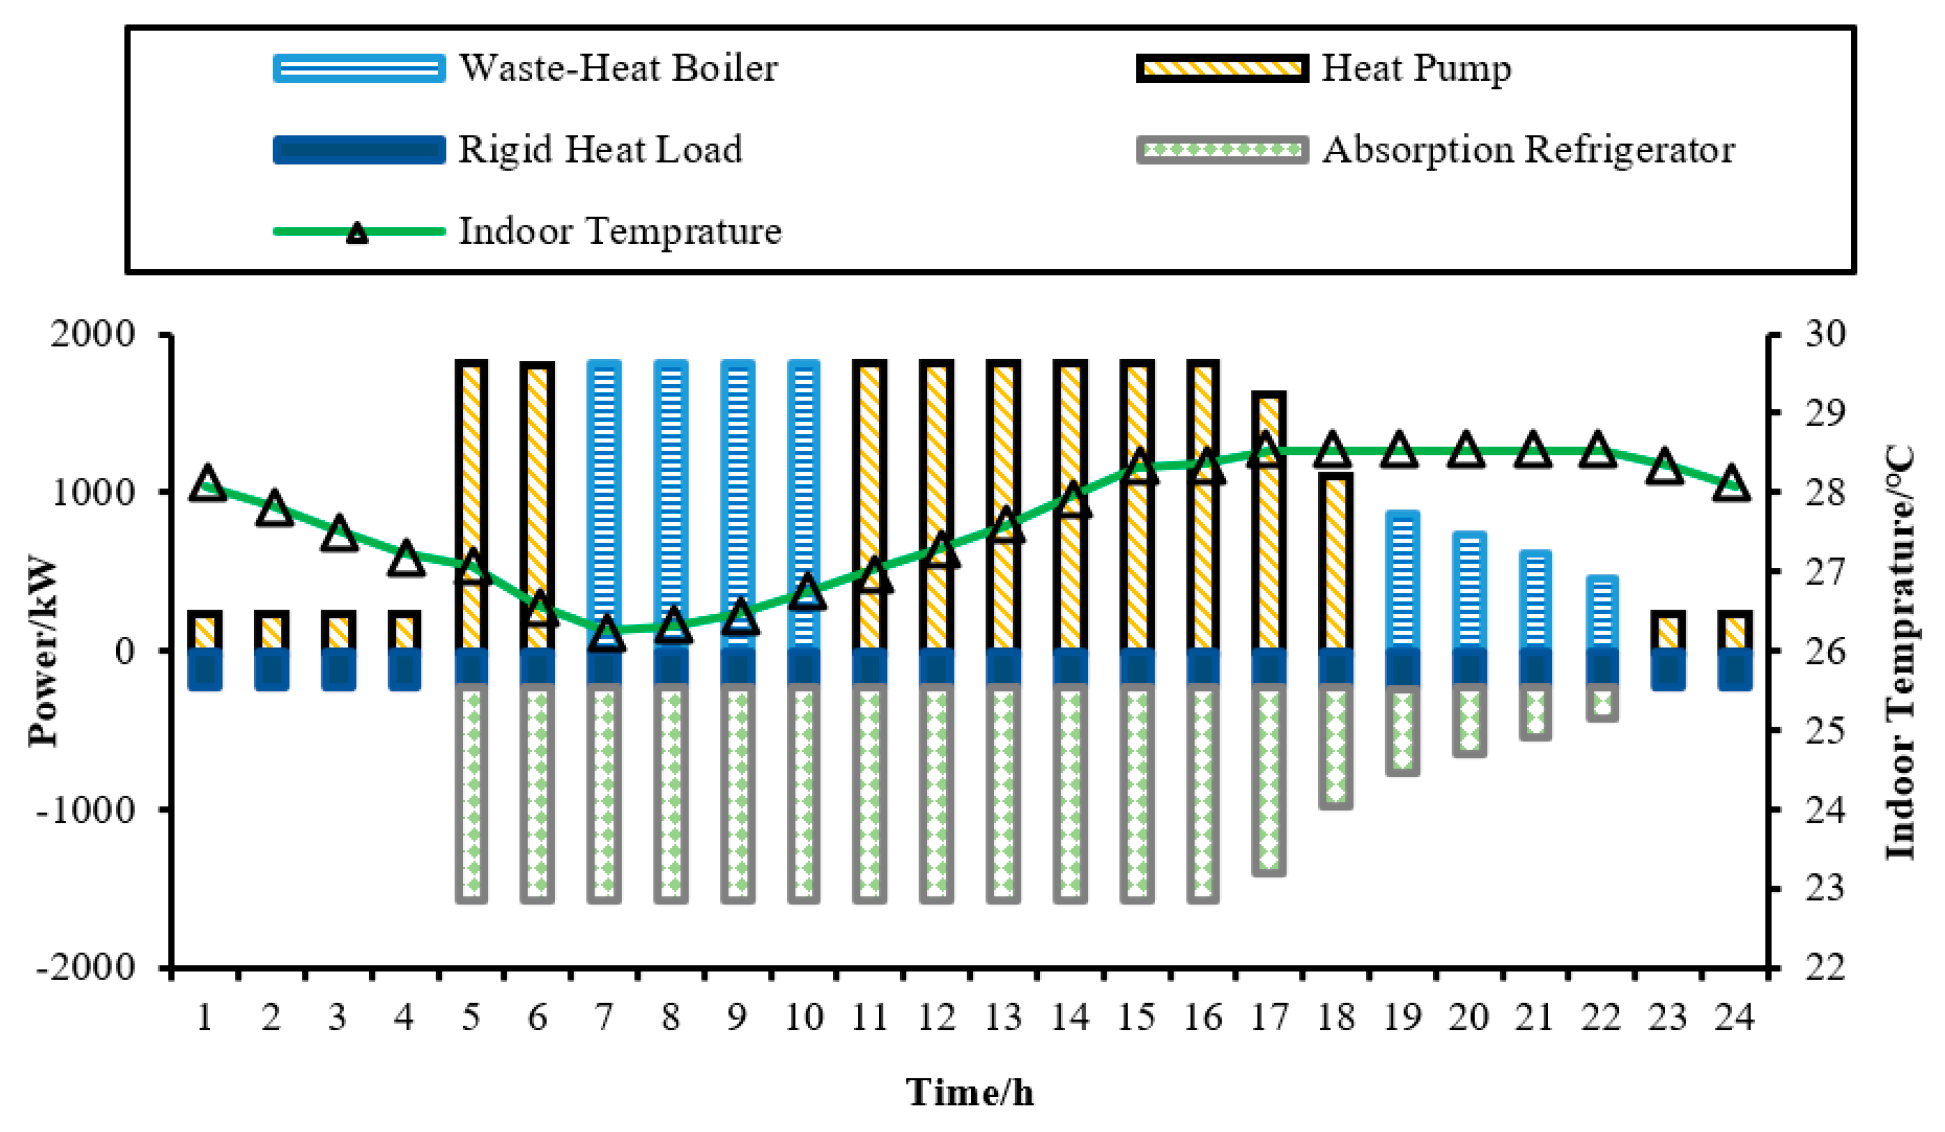
4.4. Power Balance Study
5. Sensitivity Analysis
5.1. Ggas Price
5.2. Peak-Valley Price Gap of Grid Supplied Power
6. Conclusions
Author Contributions
Funding
Data Availability Statement
Acknowledgments
Conflicts of Interest
Appendix A. Parameters

| Devices | Abbreviation | Average Life/Year | Minimum Load Rate | Maximum Load Rate | Unit Installation Capacity Cost/RMB Yuan | Electric Efficiency | Thermal Efficiency | Coefficient of Performance |
|---|---|---|---|---|---|---|---|---|
| Gas engine | MT | 30 | 0.2 | 1 | 6000 | 0.25 | — | — |
| Waste-heat boiler | WH | 20 | 0 | 1 | 125 | — | 0.9 | — |
| Gas-fired boiler | GB | 15 | 0 | 1 | 340 | — | 0.93 | — |
| Heat pump | HP | 10 | 0 | 1 | 971 | — | — | 4.5 |
| Absorption refrigerator | AC | 20 | 0 | 1 | 1100 | — | — | 0.85 |
| Electric refrigerator | EC | 20 | 0 | 1 | 3000 | — | — | 0.95 |
| Electrical energy storage | ES | 10 | 0.2 | 0.8 | 2000 | 0.95 | — | 0.2 |
| Thermal energy storage | HS | 10 | 0.1 | 0.9 | 150 | — | 0.9 | 0.2 |
| Photovoltaic module | PV | 20 | — | — | 7000 | 0.95 | — | — |
| Category | Parameter | Value |
|---|---|---|
| PMV index parameters | Cl1 | 0.155 m2·°C/W |
| Cl2 | 0.067 m2·°C/W | |
| Cl3 | 0.251 m2·°C/W | |
| M | 58.2 W/m2 | |
| Building parameters | R | 1.5 °C/kW |
| C | 5.44 kWh/°C |


References
- Zhou, Z.; Liu, P.; Li, Z.; Ni, W. An engineering approach to the optimal design of distributed energy systems in China. Appl. Therm. Eng. 2013, 3, 87–96. [Google Scholar] [CrossRef]
- Deng, Z.-G.; Yang, J.-H.; Dong, C.-L.; Xiang, M.-Q.; Qin, Y.; Sun, Y.-S. Research on economic dispatch of integrated energy system based on improved krill swarm algorithm. Energy Rep. 2022, 8, 77–86. [Google Scholar] [CrossRef]
- Zhang, X.; Karady, G.; Ariaratnam, S. Optimal allocation of CHP-based distributed generation on urban energy distribution networks. IEEE Trans. Sustain. Energy 2014, 2, 46–53. [Google Scholar] [CrossRef]
- Fu, Y.; Sun, Q.; Wennersten, R. The effect of correlation of uncertainties on collaborative optimization of integrated energy system. Energy Rep. 2021, 7, 586–592. [Google Scholar] [CrossRef]
- Oh, S.; Lee, H.; Jung, J.; Kwak, H. Optimal planning and economic evaluation of cogeneration system. Energy 2007, 7, 60–71. [Google Scholar] [CrossRef]
- Karami, H.; Sanjari, M.; Hosseinian, S.; Gharehpetian, G. An optimal dispatch algorithm for managing residential distributed energy resources. IEEE Trans. Smart Grid. 2014, 5, 2360–2367. [Google Scholar] [CrossRef]
- Zhao, F.; Zhang, C.; Sun, B.; Wei, D. Three-stage collaborative global optimization design method of combined cooling heating and power. Proc. CSEE 2015, 37, 85–93. [Google Scholar]
- Dou, X.; Shao, Y.; Wang, J.; Hu, Q. Heat-electricity joint bidding strategies for intelligent buildings in intelligent building cluster. Int. J. Electr. Power Energy Syst. 2021, 129, 106891. [Google Scholar] [CrossRef]
- Sheikhi, A.; Rayati, M.; Ranjbar, A. Energy Hub optimal sizing in the smart grid: Machine learning approach. In Proceedings of the 2015 IEEE Power & Energy Society Innovative Smart Grid Technologies Conference (ISGT), Washington, DC, USA, 18–20 February 2015; pp. 1–5. [Google Scholar]
- Arcuri, P.; Florio, G.; Fragiacomo, P. A mixed integer programming model for optimal design of trigeneration in a hospital complex. Energy 2010, 14, 30–47. [Google Scholar] [CrossRef]
- Lara, E.; Garcia, F. Review on viability and implementation of residential PV-battery systems: Considering the case of dominican republic. Energy Rep. 2021, 7, 8868–8899. [Google Scholar] [CrossRef]
- Sheikhi, A.; Rayati, M.; Bahrami, S.; Ranjbar, A. Integrated demand side management game in smart energy hubs. IEEE Trans. Smart Grid. 2015, 6, 75–83. [Google Scholar] [CrossRef]
- Mei, X.; Song, M. An autonomous hierarchical control for improving indoor comfort and energy efficiency of a direct expansion air conditioning system. Appl. Energy 2018, 4, 50–63. [Google Scholar] [CrossRef]
- Westner, G.; Madlener, R. Investment in new power generation under uncertainty: Benefits of CHP vs. condensing plants in a copula based analysis. Energy Econ. 2012, 34, 31–44. [Google Scholar] [CrossRef]
- Ceseña, E.; Capuder, T.; Mancarella, P. Flexible distributed multi-energy generation system expansion planning under uncertainty. IEEE Trans. Smart Grid. 2016, 3, 48–57. [Google Scholar]
- Fanger, P. Thermal Comfort; Danish Techical Press: Copenhagen, Denmark, 1970. [Google Scholar]
- Zeng, G.; Tian, Y.; Zhao, H.; Wang, P. Analysis on the environment and synthesis factors affecting the PMV index. Build. Energy Effic. 2007, 35, 11–16. [Google Scholar]
- Zhang, W.; Lian, J.; Chang, C.; Kalsi, K. Aggregated modeling and control of air conditioning loads for demand response. IEEE Trans. Power Syst. 2013, 46, 55–64. [Google Scholar] [CrossRef]
- Li, W.; Zhang, H.; Wang, Q.; Yang, Q. Characteristics of wind power in Jilin province and the study of wind curtailment reduction policy recommendations. Renew. Energy Resour. 2013, 2, 123–126. [Google Scholar]


| Scenario | Optimally Sized Capacity/kW | Thermal Storage Power/Capacity kW/kWh | |||
|---|---|---|---|---|---|
| Gas Engine | Waste- Heat Boiler | Heat Pump | Absorption Refrigerator | ||
| Scenario 1 | 936.7 | 2529.1 | 871.7 | 1579.3 | 0 |
| Scenario 2 | 1299.5 | 3508.7 | 0 | 1579.8 | 1822.6/3645.2 |
| Scenario 3 | 1354.4 | 3656.8 | 0 | 1580.1 | 0 |
| Scenario | Cost/(10,000 RMB Yuan/Year) | Total Cost (10,000 RMB Yuan/Year) | ||
|---|---|---|---|---|
| Installation | Maintenance | Energy Fuel Consumption | ||
| Scenario 1 | 66.8 | 3.3 | 711.4 | 781.5 |
| Scenario 2 | 78.1 | 3.9 | 870.3 | 952.3 |
| Scenario 3 | 73.3 | 3.7 | 890.4 | 967.4 |
| Scenario | Optimally Sized Capacity/kW | ||||
|---|---|---|---|---|---|
| Gas Engine | Waste-Heat Boiler | Heat Pump | Absorption Refrigerator | PV Module | |
| Scenario 1 | 936.7 | 2529.1 | 871.7 | 1579.3 | 0 |
| Scenario 4 | 895.7 | 2418.5 | 871.7 | 1579.7 | 150 |
| Scenario 5 | 854.7 | 2307.8 | 871.7 | 1580.1 | 300 |
| Scenario | Cost/(10,000 RMB Yuan/Year) | Total Cost (10,000 RMB Yuan/Year) | ||
|---|---|---|---|---|
| Installation | Maintenance | Energy Fuel Consumption | ||
| Scenario 1 | 66.8 | 3.3 | 711.4 | 781.5 |
| Scenario 4 | 73.5 | 3.7 | 688.7 | 765.9 |
| Scenario 5 | 80.2 | 4.0 | 666.0 | 750.2 |
Disclaimer/Publisher’s Note: The statements, opinions and data contained in all publications are solely those of the individual author(s) and contributor(s) and not of MDPI and/or the editor(s). MDPI and/or the editor(s) disclaim responsibility for any injury to people or property resulting from any ideas, methods, instructions or products referred to in the content. |
© 2024 by the authors. Licensee MDPI, Basel, Switzerland. This article is an open access article distributed under the terms and conditions of the Creative Commons Attribution (CC BY) license (https://creativecommons.org/licenses/by/4.0/).
Share and Cite
You, G.; Sun, P.; Lei, Y.; Zhang, D.; Li, H. Optimal Planning of Urban Building-Type Integrated Energy Systems Considering Indoor Somatosensory Comfort and PV Consumption. Sustainability 2024, 16, 411. https://doi.org/10.3390/su16010411
You G, Sun P, Lei Y, Zhang D, Li H. Optimal Planning of Urban Building-Type Integrated Energy Systems Considering Indoor Somatosensory Comfort and PV Consumption. Sustainability. 2024; 16(1):411. https://doi.org/10.3390/su16010411
Chicago/Turabian StyleYou, Guangzeng, Peng Sun, Yi Lei, Donghui Zhang, and Haibo Li. 2024. "Optimal Planning of Urban Building-Type Integrated Energy Systems Considering Indoor Somatosensory Comfort and PV Consumption" Sustainability 16, no. 1: 411. https://doi.org/10.3390/su16010411
APA StyleYou, G., Sun, P., Lei, Y., Zhang, D., & Li, H. (2024). Optimal Planning of Urban Building-Type Integrated Energy Systems Considering Indoor Somatosensory Comfort and PV Consumption. Sustainability, 16(1), 411. https://doi.org/10.3390/su16010411