Article

Characterization and Application of Rice Straw-Based Polyurethane Foam Blocks for Soil Erosion Control

by
Felrose P. Maravillas
1,2,
Christine Joy M. Omisol
3,
Gerson Y. Abilay
4,
Nicholas L. Lasquite
4,
Blessy Joy M. Aguinid
3,
Dave Joseph E. Estrada
3,
Rosal Jane Ruda-Bayor
5,
Evalyn Joy C. Cea
1,
Applegen I. Cavero
1,6,
Mary Ann N. Ahalajal
1,
Glen A. Lorenzo
7,
Roberto M. Malaluan
3,8,
Gerard G. Dumancas
9 and
Arnold A. Lubguban
3,8,*
1
Department of Civil Engineering and Technology, Graduate School of Engineering, Mindanao State University-Iligan Institute of Technology, Iligan 9200, Philippines
2
Department of Civil Engineering, Capitol University, Cagayan de Oro 9000, Philippines
3
Center for Sustainable Polymers, Mindanao State University-Iligan Institute of Technology, Iligan 9200, Philippines
4
Materials Science and Engineering Program, Graduate School of Engineering, Mindanao State University-Iligan Institute of Technology, Iligan 9200, Philippines
5
Department of Materials and Resources Engineering and Technology, Mindanao State University-Iligan Institute of Technology, Iligan 9200, Philippines
6
AC Joyo Design and Technical Services, Davao 8000, Philippines
7
Department of Civil Engineering, Mindanao State University-Marawi, Marawi 9700, Philippines
8
Department of Chemical Engineering and Technology, Mindanao State University-Iligan Institute of Technology, Iligan 9200, Philippines
9
Department of Chemistry, The University of Scranton, Scranton, PA 18510, USA
*
Author to whom correspondence should be addressed.
Sustainability 2024, 16(1), 261; https://doi.org/10.3390/su16010261
Submission received: 22 November 2023 / Revised: 22 December 2023 / Accepted: 24 December 2023 / Published: 27 December 2023
(This article belongs to the Section Sustainable Chemical Engineering and Technology)

Abstract

:
Soil erosion, a global problem, degrades land quality and increases pollution and sedimentation in bodies of water. This study propounds a new material to mitigate soil erosion using rice straw-based polyurethane foam (RSPF) blocks as a potential replacement for commercially available expanded polystyrene (EPS) foam in slope stabilization. RSPF was synthesized via a conventional one-shot foaming method with 15% rice straw-based polyol content. The RSPF blocks have an average density of 43.29 kg/m3, average compressive strength of 184.55 kPa, closed cell content of 88.4%, and water absorption capacity of 262% that can effectively reduce water runoff. These properties are comparable to EPS foams according to ASTM D6817, except for the high absorption capacity of RSPF. This added feature allows the foam to act as topsoil protection by reducing runoff. In slope stabilization and topsoil protection applications, the effectiveness of the RSPF blocks in reducing soil loss was tested in both simulated and natural rainfall events with different land slope degrees, rain intensities, and soil covers. Results show that the use of RSPF in the simulated setup with a heavy rain intensity of 80 mm/h reduced the soil loss by 61.5%, 22.7%, and 4.3% in 5°, 10°, and 20° of land slope, respectively. There was also a higher degree of soil loss reduction when the RSPF block was coupled with a natural vegetation soil cover by 79.6%, 70%, and 19.3% in 5°, 10°, and 20° land slopes, respectively. Moreover, in the natural rainfall events in an open field with a land slope of 20°, the recorded soil loss reduction reached 93.6–98.8% at an average rainfall intensity of 16.26 mm/h. Additionally, the relationship between soil loss and land slope was investigated to produce a best fit model that predicts the soil loss up to a 20° land slope. An interesting observation was made wherein the erosion rate increased using linear regression modeling in the simulated setup for bare soil (BS), soil with vegetation (SV), soil with RSPF (SF), and soil with RSPF and vegetation (FV), with high coefficient of determination (R2) values between 0.92 and 0.99. These findings suggest that the RSPF block is a promising alternative and sustainable material for EPS foams in mitigating soil erosion, especially under heavy rainfall conditions.

1. Introduction

Soil erosion is an alarming global issue that adversely affects land and water quality due to the removal of the upper layer of soil and deposition mainly to bodies of water. More than these effects are their implications for food security and ecosystem viability [1]. Soil erosion is also commonly observed as one of the factors in slope failure, which eventually becomes a threat to roads, highways, and most engineering structures. These reasons made soil erosion one of the focuses of geotechnical and related studies and an interesting topic in research [2].
Existing studies on soil erosion control were mostly focused on various techniques including the use of vegetative covers [3], sawdust [4], compost mulch [5], wood chips [6], air bricks [7], wheat residue [8], nonwoven geotextiles from nettle and poly(lactic acid) fibers [9], geotextiles [10,11], coffee husk mulch [12], polymer additive poly(acrylamide-co-acrylic acid) [13], charcoal ash and stone covers [14], wood strands and agricultural straw [15], and geopolymers [16]. Moreover, newer materials such as geotextiles, wire mesh, cable nets, and membrane structures have thoroughly been studied [17,18].
One material that has not been explored yet as a potential soil erosion control material is rigid polyurethane (PU) foam. PU foams have gained attraction in recent years due to their diverse usage and commercial potential. Moreover, the development of biobased PU foams has gained great traction in the field. This is because the modification of PU foams with biobased polyols allows for versatility in the desired properties of the foam as well as promotes sustainability and alleviates the environmental impacts of petroleum-based materials [19]. Biobased materials, such as rice straw, have been popular sources of biopolyols. The use of this type of raw material is not only economical but also sustainable, since it is a profusely common waste material globally [20].
The idea of applying PU foam as an erosion control block has emanated from commercialized geofoam, a lightweight foam block consisting of expanded polystyrene (EPS) or extruded polystyrene (XPS). However, the EPS foam blocks are primarily used for slope remediation to replace the heavier in situ soil due to its low water absorption capacity [21]. They act as internal soil reinforcements to decrease the acceleration of soil mass movement from uphill. Despite this, the material does not contribute to topsoil stabilization when subjected to runoff during rainfall, which is most vulnerable to soil erosion [22].
Natural soil covers, such as vegetation, are known to lessen water runoff, thus reducing soil loss. However, this may not be enough since the prevalence of soil erosion is continuously growing [23]. The addition of structural components in the soil, especially in slope regions, has been identified as an effective slope protection measure, with the best results obtained when these geostructural materials are used in combination with natural vegetation [24,25].
So far, no existing studies have investigated the use of PU foams as soil erosion control blocks in combination with other soil cover types, such as vegetation, to decrease water runoff that leads to soil loss. No other studies have also examined the effects of combining uphill soil mass movement hampering and water absorption to reduce water runoff and soil loss. The integration of these two mechanisms not only provides slope stabilization but also topsoil protection. This blended mechanism of soil loss prevention does not fit the property profile of EPS foams due to their inability to absorb water.
In this study, a petroleum-based PU foam was modified with rice straw-based polyol to alter the foam properties resembling those of EPS foams but with a high water absorption capacity. The resulting rice straw-based PU foam (RSPF) blocks were used as an alternative material to EPS foams, but their intended application was a combination of slope stabilization and topsoil protection. The physical and mechanical properties of the RSPF blocks were determined. Their water absorption capacity was also evaluated for an extended period. Further characterization of RSPF was completed to assess the thermal stability as well as verify molecular structures. Then, a microplot was devised to investigate the effectiveness of RSPF blocks as a type of soil cover in four different plot types: bare soil (BS) as a control, soil with vegetation (SV), soil with embedded RSPF blocks (SF), and soil with embedded RSPF blocks and vegetation (FV). The microplot was subjected to simulated rain using a rain simulator apparatus at different land slopes. Field microplots were also constructed to verify the results under natural rainfall events. The runoff coefficient and soil loss data in all microplot setups were used to assess the performance of the RSPF blocks. The relationship between soil loss and land slope was also established in all soil cover plot types, and models were generated through curve fitting.

2. Materials and Methods

2.1. Materials

The rice straw-based polyol used to synthesize the rice straw-based PU foam (RSPF) was obtained from the Center for Sustainable Polymers laboratory (Philippines), with an OH number of 699.6 mg KOH/g and an acid number of 0.5660 mg KOH/g. VORANOL™ 490; a petroleum-based polyether polyol with an OH number of 490 mg KOH/g and polymeric diphenylmethane diisocyanate (MDI) PAPI™ 135C, with average NCO functionality of 2.7, molecular weight of 349 g/mol, and NCO content of 31.4%, by the Dow chemical company (Midland, MI, USA), were obtained from Chemrez Technologies, Inc. (Quezon City, Philippines). POLYCAT® 8, an amine-based catalyst for rigid PU foams and DABCO® DC5357, a surfactant, by Evonik Industries (Essen, Germany), were procured from Sigma-Aldrich (Burlington, MA, USA). Distilled water was used as the blowing agent.

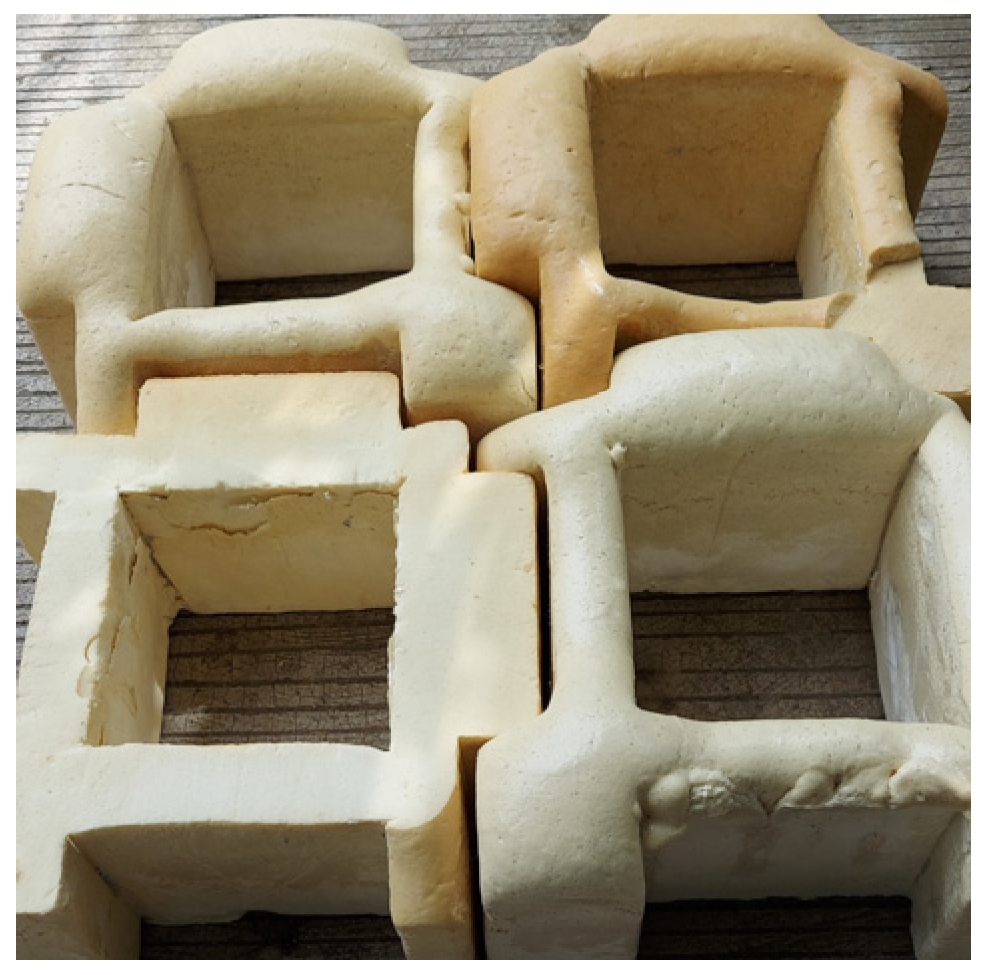
2.2. RSPF Block Preparation

The foaming method employed to produce RSPF blocks was the conventional one-shot foaming process with curing at room temperature. The RSPF formulation is listed in Table 1. B-side components were first mixed using an overhead mixer for 1 min before the addition of the A-side component. The mixture was stirred vigorously for another 30 s and poured into an open-top wooden foam block mold. The foams were allowed to fully cure for 7 days before being used for characterization and testing. The final RSPF block is shown in Figure 1.

2.3. RSPF Characterization

2.3.1. Physical Properties

The density of RSPF was determined according to ASTM D1622 [26]. Specimens for testing were extracted from block samples, each having a cross-sectional area of 25 cm2. The thermal conductivity of the foam was tested based on ASTM C518 [27] using a FOX 200 heat flow meter (HFM) (Laser-Comp, Wakefield, MA, USA) with specimen sizes of 200 × 200 × 35 mm.

2.3.2. Mechanical Property

The compressive strength of RSPF was evaluated at 10% compression using an AGS-X series universal testing machine (UTM) (Shimadzu Corp., Kyoto, Japan). The test was performed according to ASTM D1621 [28], perpendicular to the foam rise direction. Samples were prepared with square cross-sections of 50 × 50 × 25.4 mm.

2.3.3. Morphology of RSPF

To gain a thorough understanding of the physical and mechanical properties of RSPF, it is crucial to analyze the inherent morphology of the PU foam. This involves examining factors such as the size and distribution of cells within the foam structure. Scanning electron microscopy (SEM) (JSM IT200 from JEOL, Tokyo, Japan) was used for this purpose. Moreover, the nature of the cells in the foam matrix was determined using the Quantachrome Ultrapyc 1200e automatic gas pycnometer (Anton Paar QuantaTec Inc., Boynton Beach, FL, USA) in accordance with ASTM 6226 [29].

2.3.4. Fourier Transform Infrared Spectroscopy (FTIR)

For a comprehensive investigation of the molecular bonds present in the foam matrix, a structural analysis was conducted using the Shimadzu IRTracer-100 FTIR spectrometer with a QATR-10 attenuated total reflectance (ATR) accessory (Shimadzu Corp., Kyoto, Japan). The analysis was performed at a wavenumber range of 4000–500 cm−1, at a resolution of 4 cm−1.

2.3.5. Thermogravimetric Analysis (TGA)

The thermal degradation of RSPF was measured at the temperature range of 50–850 °C using the Shimadzu DTG-60H (Shimadzu Corp., Kyoto, Japan) with a heating rate of 10 °C/min and a nitrogen flow rate of 20 mL/min.

2.3.6. Water Absorption

The absorption test was based on the ASTM C272 [30], with a specimen size of 3 × 3 × 0.5 in. The test specimens were submerged in distilled water with a constant 2 in head for different immersion times: 24 h, 48 h, and until less than a 2% increase in mass was recorded for subsequent weighings at every 48 h interval. The specimens were held under a mesh, ensuring full submersion and preventing the samples from floating. The samples were weighed to the nearest 0.1 mg using an analytical balance, and the percent water absorption was calculated as the mass of water absorbed per mass of dry foam.

2.4. Application of RSPF Blocks in Soil Loss Reduction

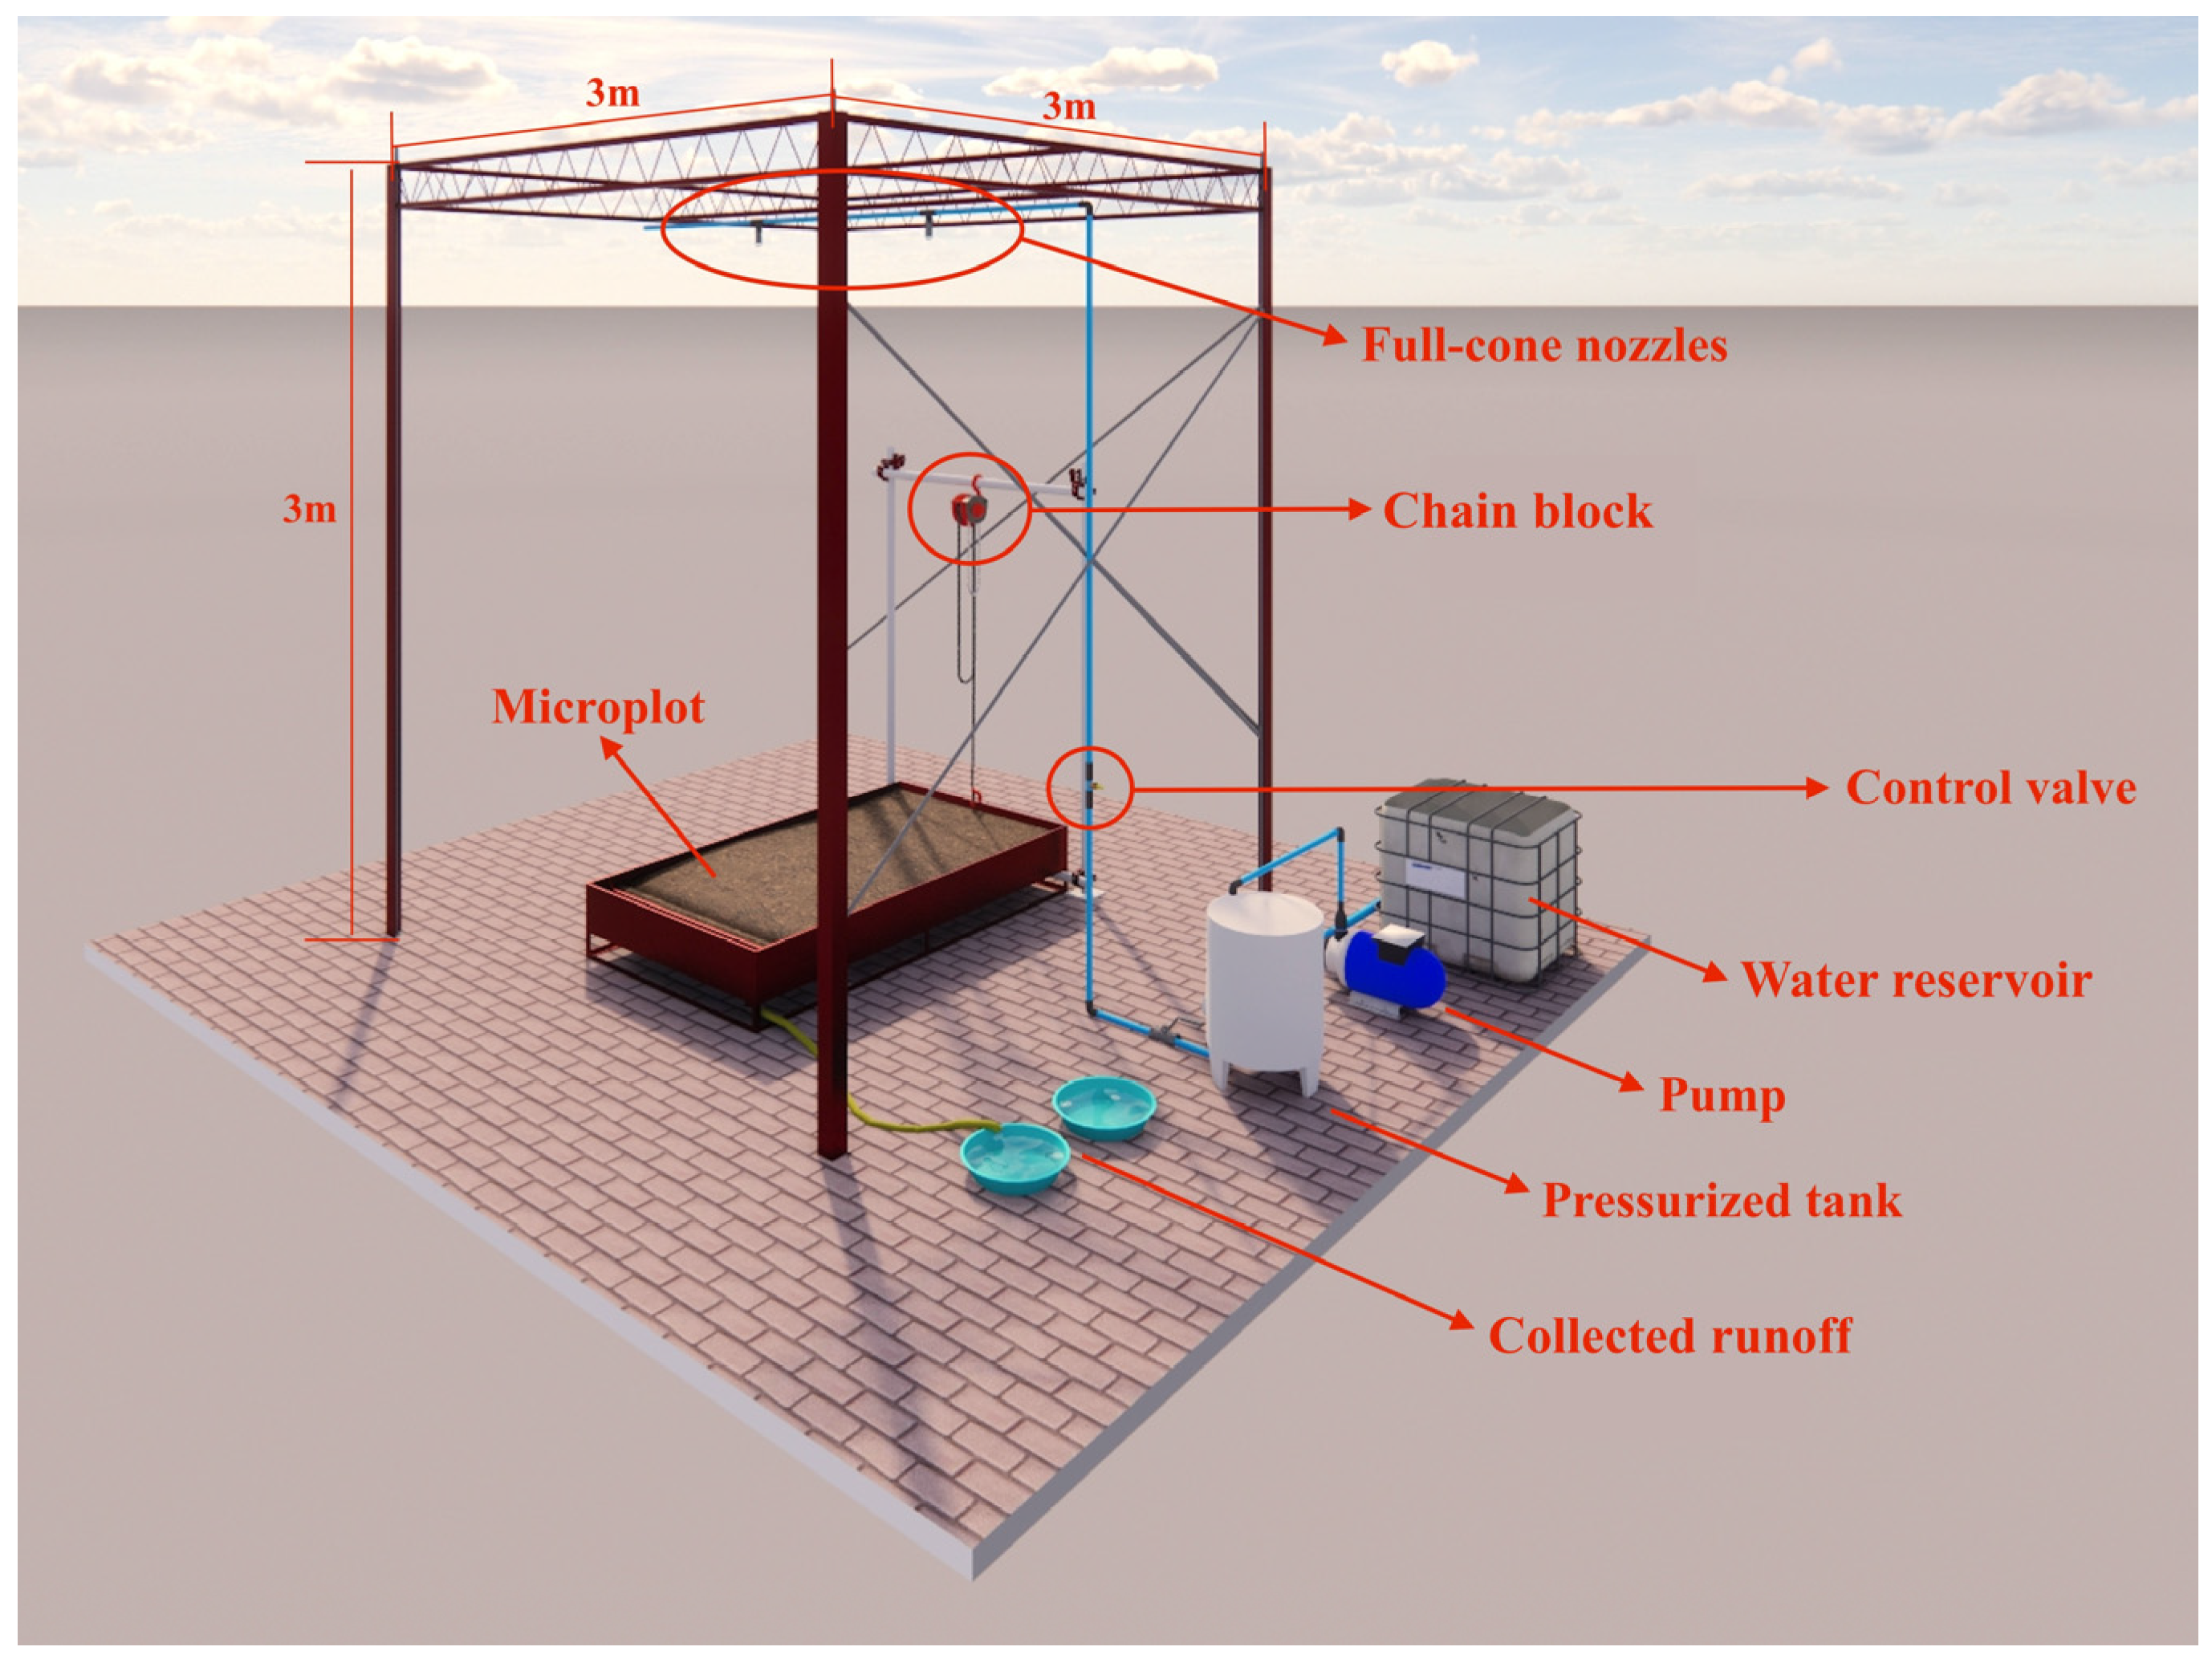
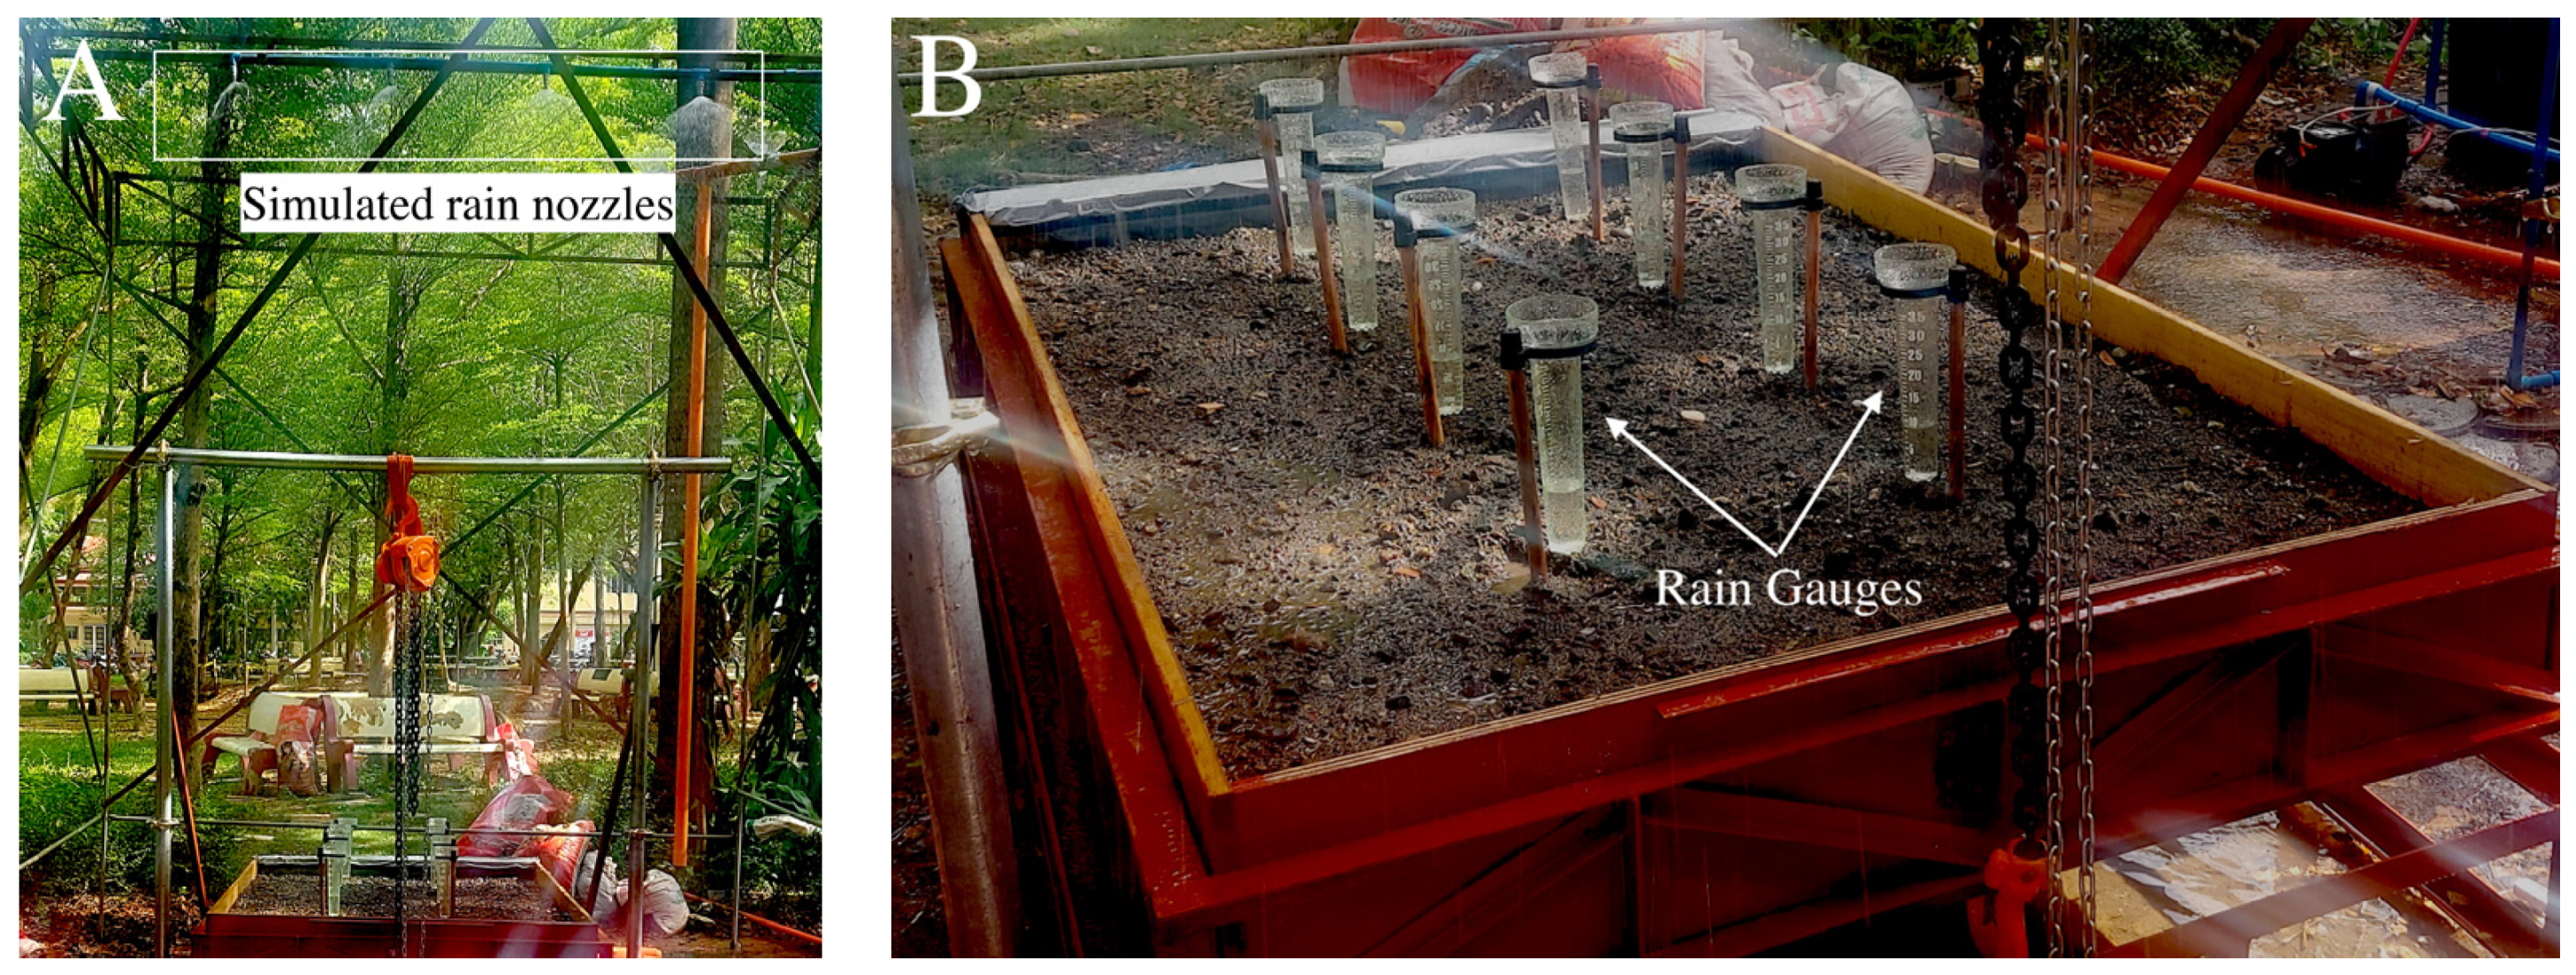
2.4.1. Rainfall Simulator Construction and Calibration

A rainfall simulator device was constructed using a 3 × 3 m steel frame with 3 mm thickness, supported by four galvanized iron pipes, each with a diameter of 0.5 in [31]. The simulation system employed four full cone round spray nozzles having an orifice diameter of 4 mm affixed to the central upper section of the frame, positioned at intervals of 0.6 m at a height of 3.0 m. A control valve for water pressure adjustment was also installed in the system. The simulator has a total coverage area of about 9 m2 and a height of 3.0 m. A 3D drawing of the rainfall simulator setup is depicted in Figure 2, showcasing its parts and components. An actual photo of the simulator is shown in Figure 3A. To protect the simulation device from the effects of wind and natural precipitation, the top and three sides of the simulator were covered with transparent plastic.
The performance of the rainfall simulator was verified by assessing and quantifying its rainfall distribution uniformity. This is done by calculating the coefficient of uniformity of rainfall ( C u ) in Equation (1), which gives the deviation of individual observations from the mean observational value over the mean value and the number of observations [32].
C u = 100   1 i = 1 n x i x ¯ n x ¯
Here, x i represents the rainfall volume collected, x ¯ stands for the spatial average, and n denotes the total number of observations.
In this study, 8 rainfall gauges were mounted on the microplot spaced at 0.30 m apart to collect the rainfall volume, illustrated in Figure 3B. Each rainfall event lasted for 15 min and was taken in three replicates. The control valve was used to adjust the pressure in the sprinkler system to achieve the desired rainfall intensity.

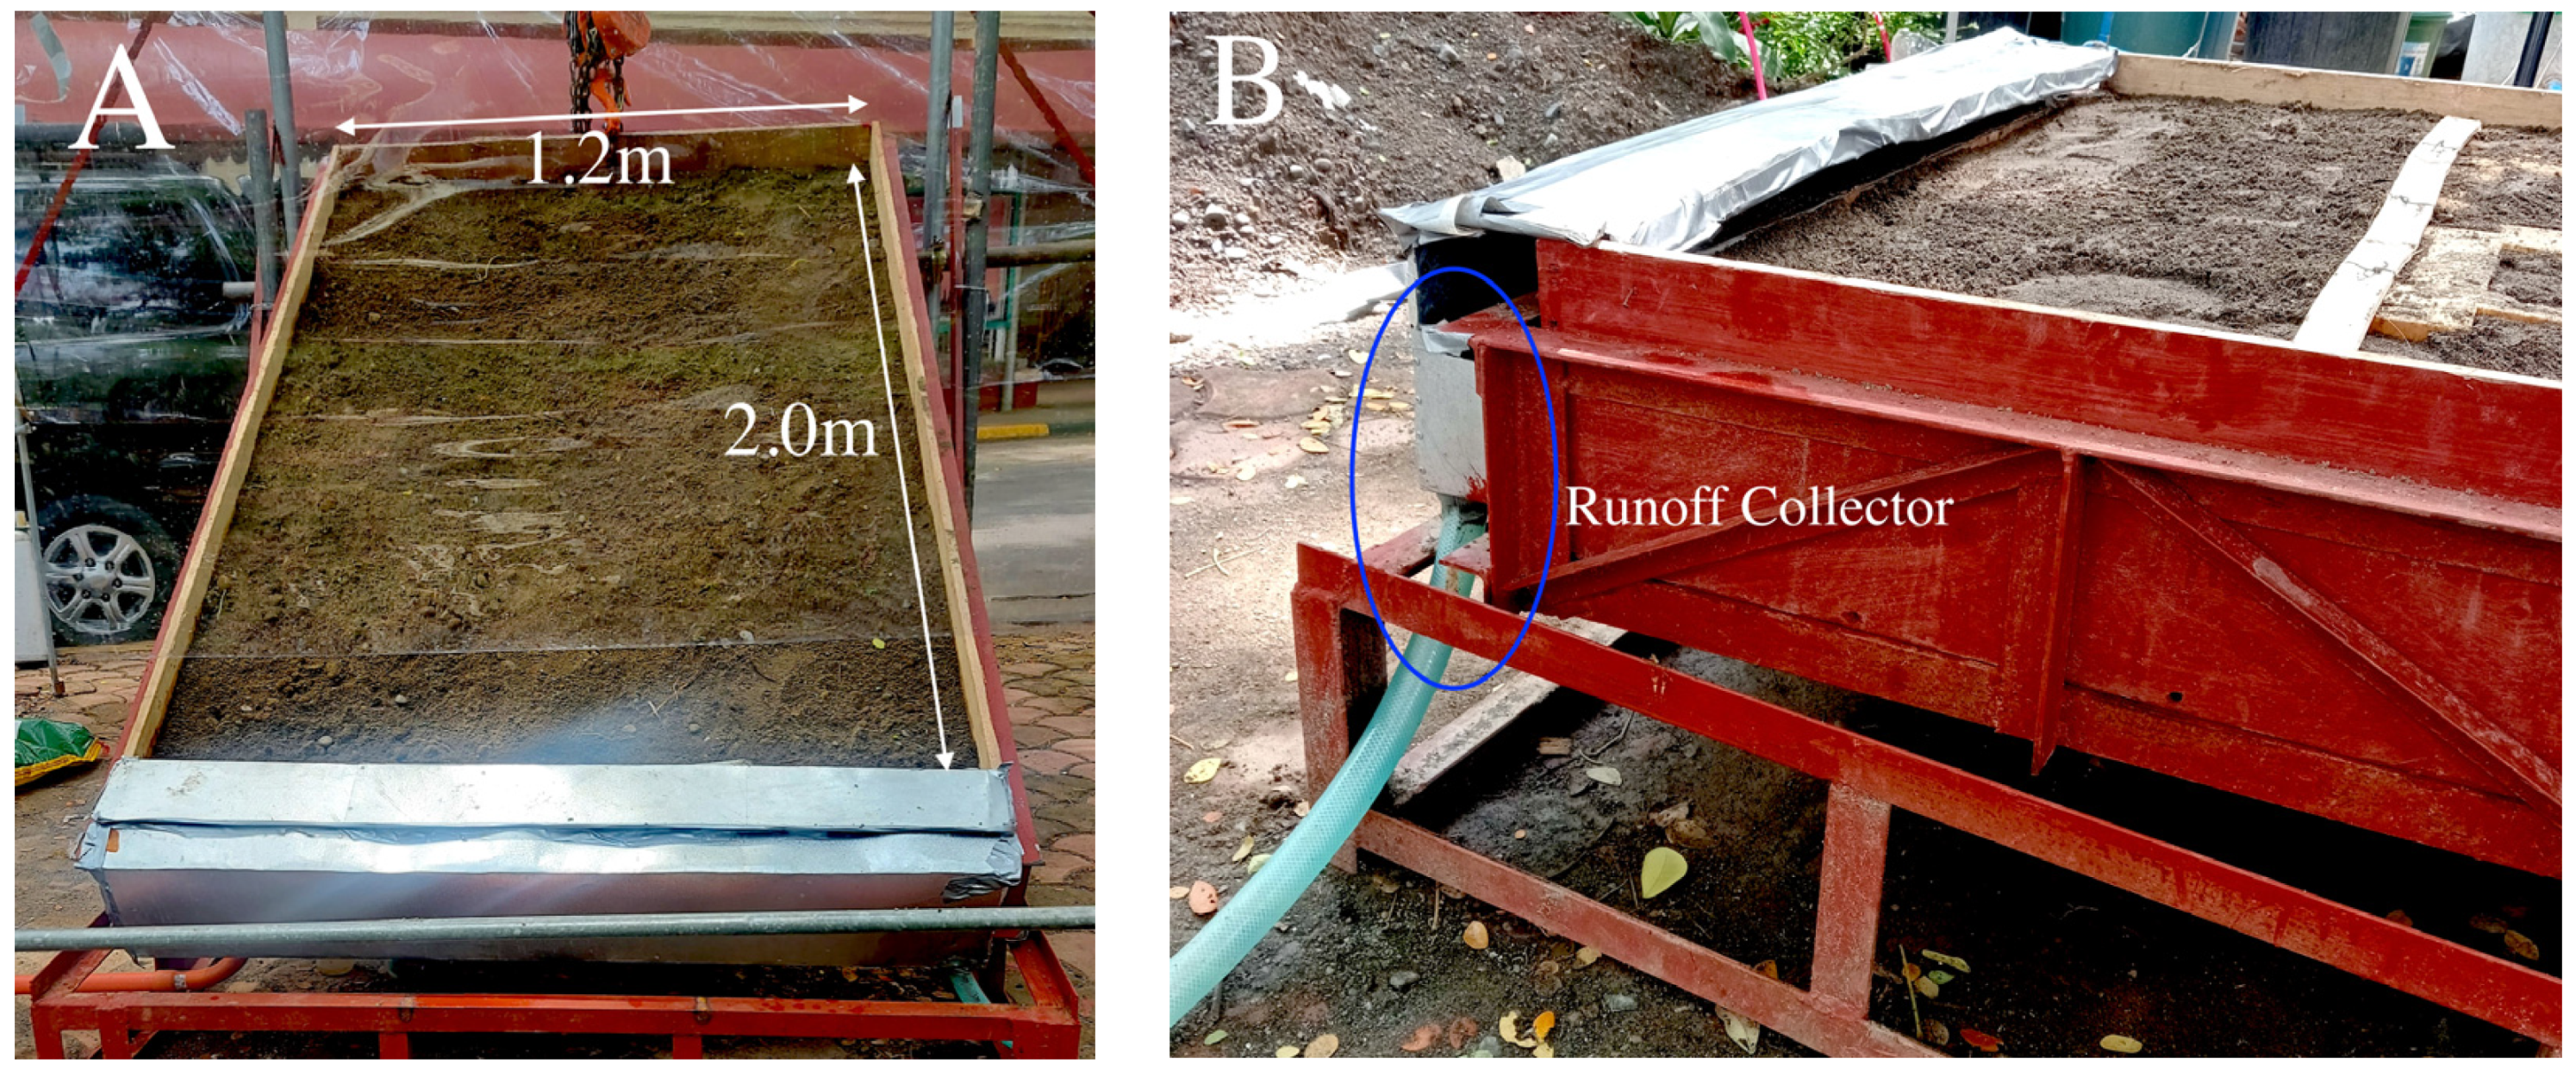
2.4.2. Experimental Microplot Preparation

The experimental microplots were prepared under simulated and natural rainfall events. The microplot under simulated rainfall, shown in Figure 4A, had a dimension of 2.0 × 1.2 m with a depth of 0.25 m, based on the study of Quan et al. (2020) [33]. One side of the microplot bed frame was fastened with a chain block, allowing for adjustments to vary the inclination of the microplot to obtain the desired slope of the plots at 5°, 10°, and 20°. The soil placement in the plot had a total depth of 20 cm, and a 5 cm frame clearance on the surface was provided for the splash effect. A gutter was affixed to the end of the microplot to gather the runoff (Figure 4B). Similarly, the microplots under natural rainfall events had a dimension of 2.8 × 1.0 m, with a slope of 20° (Figure 5A). A runoff collector was also installed at the lowest end of the plots. The soil type used in all the microplots was a combination of coarse sand and silt since they have a beneficial impact on soil splash observation [34,35]. A total compaction effort of 23.5 kJ/m3 was applied to all microplots for a total depth of 20 cm [36].
Four different types of plots were studied: bare soil as a control denoted by BS, soil with vegetation (SV), soil with embedded RSPF blocks (SF), and soil with embedded RSPF blocks and vegetation (FV). Photos of these plots for the natural rainfall events are depicted in Figure 5A,B. The RSPF blocks in the SF and FV plots were submerged in water for 24 h prior to their installation into the microplot to partially saturate the foams and accelerate the onset of runoff. All the parameters that varied in the experimental microplots are summarized in Table 2.

2.4.3. Runoff and Sediment Collection

Rainfall simulation experiments were carried out for both simulated and natural rainfall events. Water with sediment runoff from the microplots was collected through the runoff collector. Collection was performed every 3 min for a total duration of 15 min [37]. The water volume was quantified using a graduated cylinder, and data were documented as the runoff volume for analysis. Then, the sediments in the runoff were allowed to settle before the bulk of the runoff water was decanted and discarded. The sediments were dried in an oven until no change in weight was recorded.
The runoff coefficient calculation was based on the study of Keya and Karim (2020) [31], quoted from the rational method, as shown in Equation (2).
C = V r u n o f f V r a i n f a l l
where V r u n o f f is the volume of water with sediments measured in liters, and V r u n o f f is the volume of rainfall collected over a 1 h duration, computed as the equivalent to rainfall depth x microplot area. Moreover, soil loss was calculated using Equation (3):
S o i l   L o s s = m s e d i m e n t s A m i c r o p l o t
where m s e d i m e n t s denotes the mass of the oven-dried sediments collected, and A m i c r o p l o t stands for the area of the microplot.

2.4.4. Best Fit Model

The best fit model was generated using the data from sediment/soil loss vs. land slope data. Curve fitting and regression analysis were completed using Microsoft Excel (version 16.73).

3. Results and Discussion

3.1. Rice Straw-Based Polyurethane Foam (RSPF) Properties

3.1.1. Physical and Mechanical Characteristics

Density is an important physical property that influences the mechanical performance of foam blocks, specifically compressive strength. In terms of the geostructural application for soil erosion control, low densities reduce the additional stress applied on the underlying soil, thus improving slope stability against the bearing and failures [38]. The RSPF block was determined to have a density of 43.29 kg/m3, as reflected in Table 3. This is significantly lower compared with the density of the control petroleum-based PU foam (CPPF) at 77.96 kg/m3. The drastic decrease in the foam’s density is expected due to the incorporation of a biobased polyol that may be incompatible with petroleum-based polyol, thus producing weak polymer networks [39]. However, this decrease in density is a favorable result for the intended application of RSPF, since a lightweight material is needed to reduce the stress in the soil at sloped locations. When compared with expanded polystyrene (EPS) geofoams in Table 3, the density of RSPF falls within the various types of EPS.
Another physical property that plays an essential role in geostructural materials is thermal conductivity. A low thermal conductivity warrants insulating properties that are highly beneficial when used in soil stabilization, since it helps minimize the continuous loss of water and ground moisture for vegetation [42]. As listed in Table 3, the RSPF block has a thermal conductivity of 0.033 W/m·K, which falls within the standard values of EPS foams according to ISO 4898 [41]. The main factor contributing to the low thermal conductivity of the RSPF and EPS foams is the trapped air inside the foam cells [43].
The compressive performance of geostructural foams is the most important mechanical property that requires investigation and rigorous testing. This is owed to the intended application of the material that is mostly subjected to compression loading. According to the results in Table 3, RSPF exhibits a compressive strength of 184.55 kPa at a 10% strain, much lower than the compressive strength of CPPF at 768.09 kPa. This behavior is due to the direct correlation between the compressive strength and density [44,45]. Despite this decrease, the compressive strength of the RSPF is still higher than the compressive strength of most EPS samples enumerated in Table 3. It can be noticed, however, that the correlation between compressive strength and density on EPS foams differs from RSPF. The EPS foams have greater compressive strength at a given density. The discrepancy can be attributed to the difference in the nature of the materials, such that EPS foams are composed entirely of styrene monomers, while the RSPF block is a combination of RS-based and petroleum-based polyols reacted with MDI. The nonuniformity of the structure and incompatibility between the two polyols have adverse effects on the mechanical properties of the resulting foam. Moreover, the addition of a biobased polyol to the PU foam formulation tends to lower the density of the foam and produce more open cells, leading to a lower compressive strength [39,44].

3.1.2. Morphology and Cell Nature

The morphologies of CPPF and RSPF at different magnifications are displayed in Figure 6. It can be noticed that the cells of RSPF have a greater size and structure regularity than the CPPF. Moreover, the cells of RSPF exhibited a more hexagonal form. However, these hexagonal cellular formations in the RSPF were accompanied by more cellular breaks and thin film-like structures in the cell boundaries than in the CPPF. These films may be attributed to the crosslinked NCO moieties and the dangling chains and branches typical in lignocellulosic-based polyols. The latter explains why these film-like structures are more prevalent in the RSPF than in CPPF.
Moreover, it is evident from Figure 6 that most of the cells in the foam matrix were closed. This is verified by testing the open/closed cell content of the foams using a gas pycnometer. It was found that the RSPF had an 11.601% open cell content, slightly greater than the open cell content of the CPPF at 11.5%.

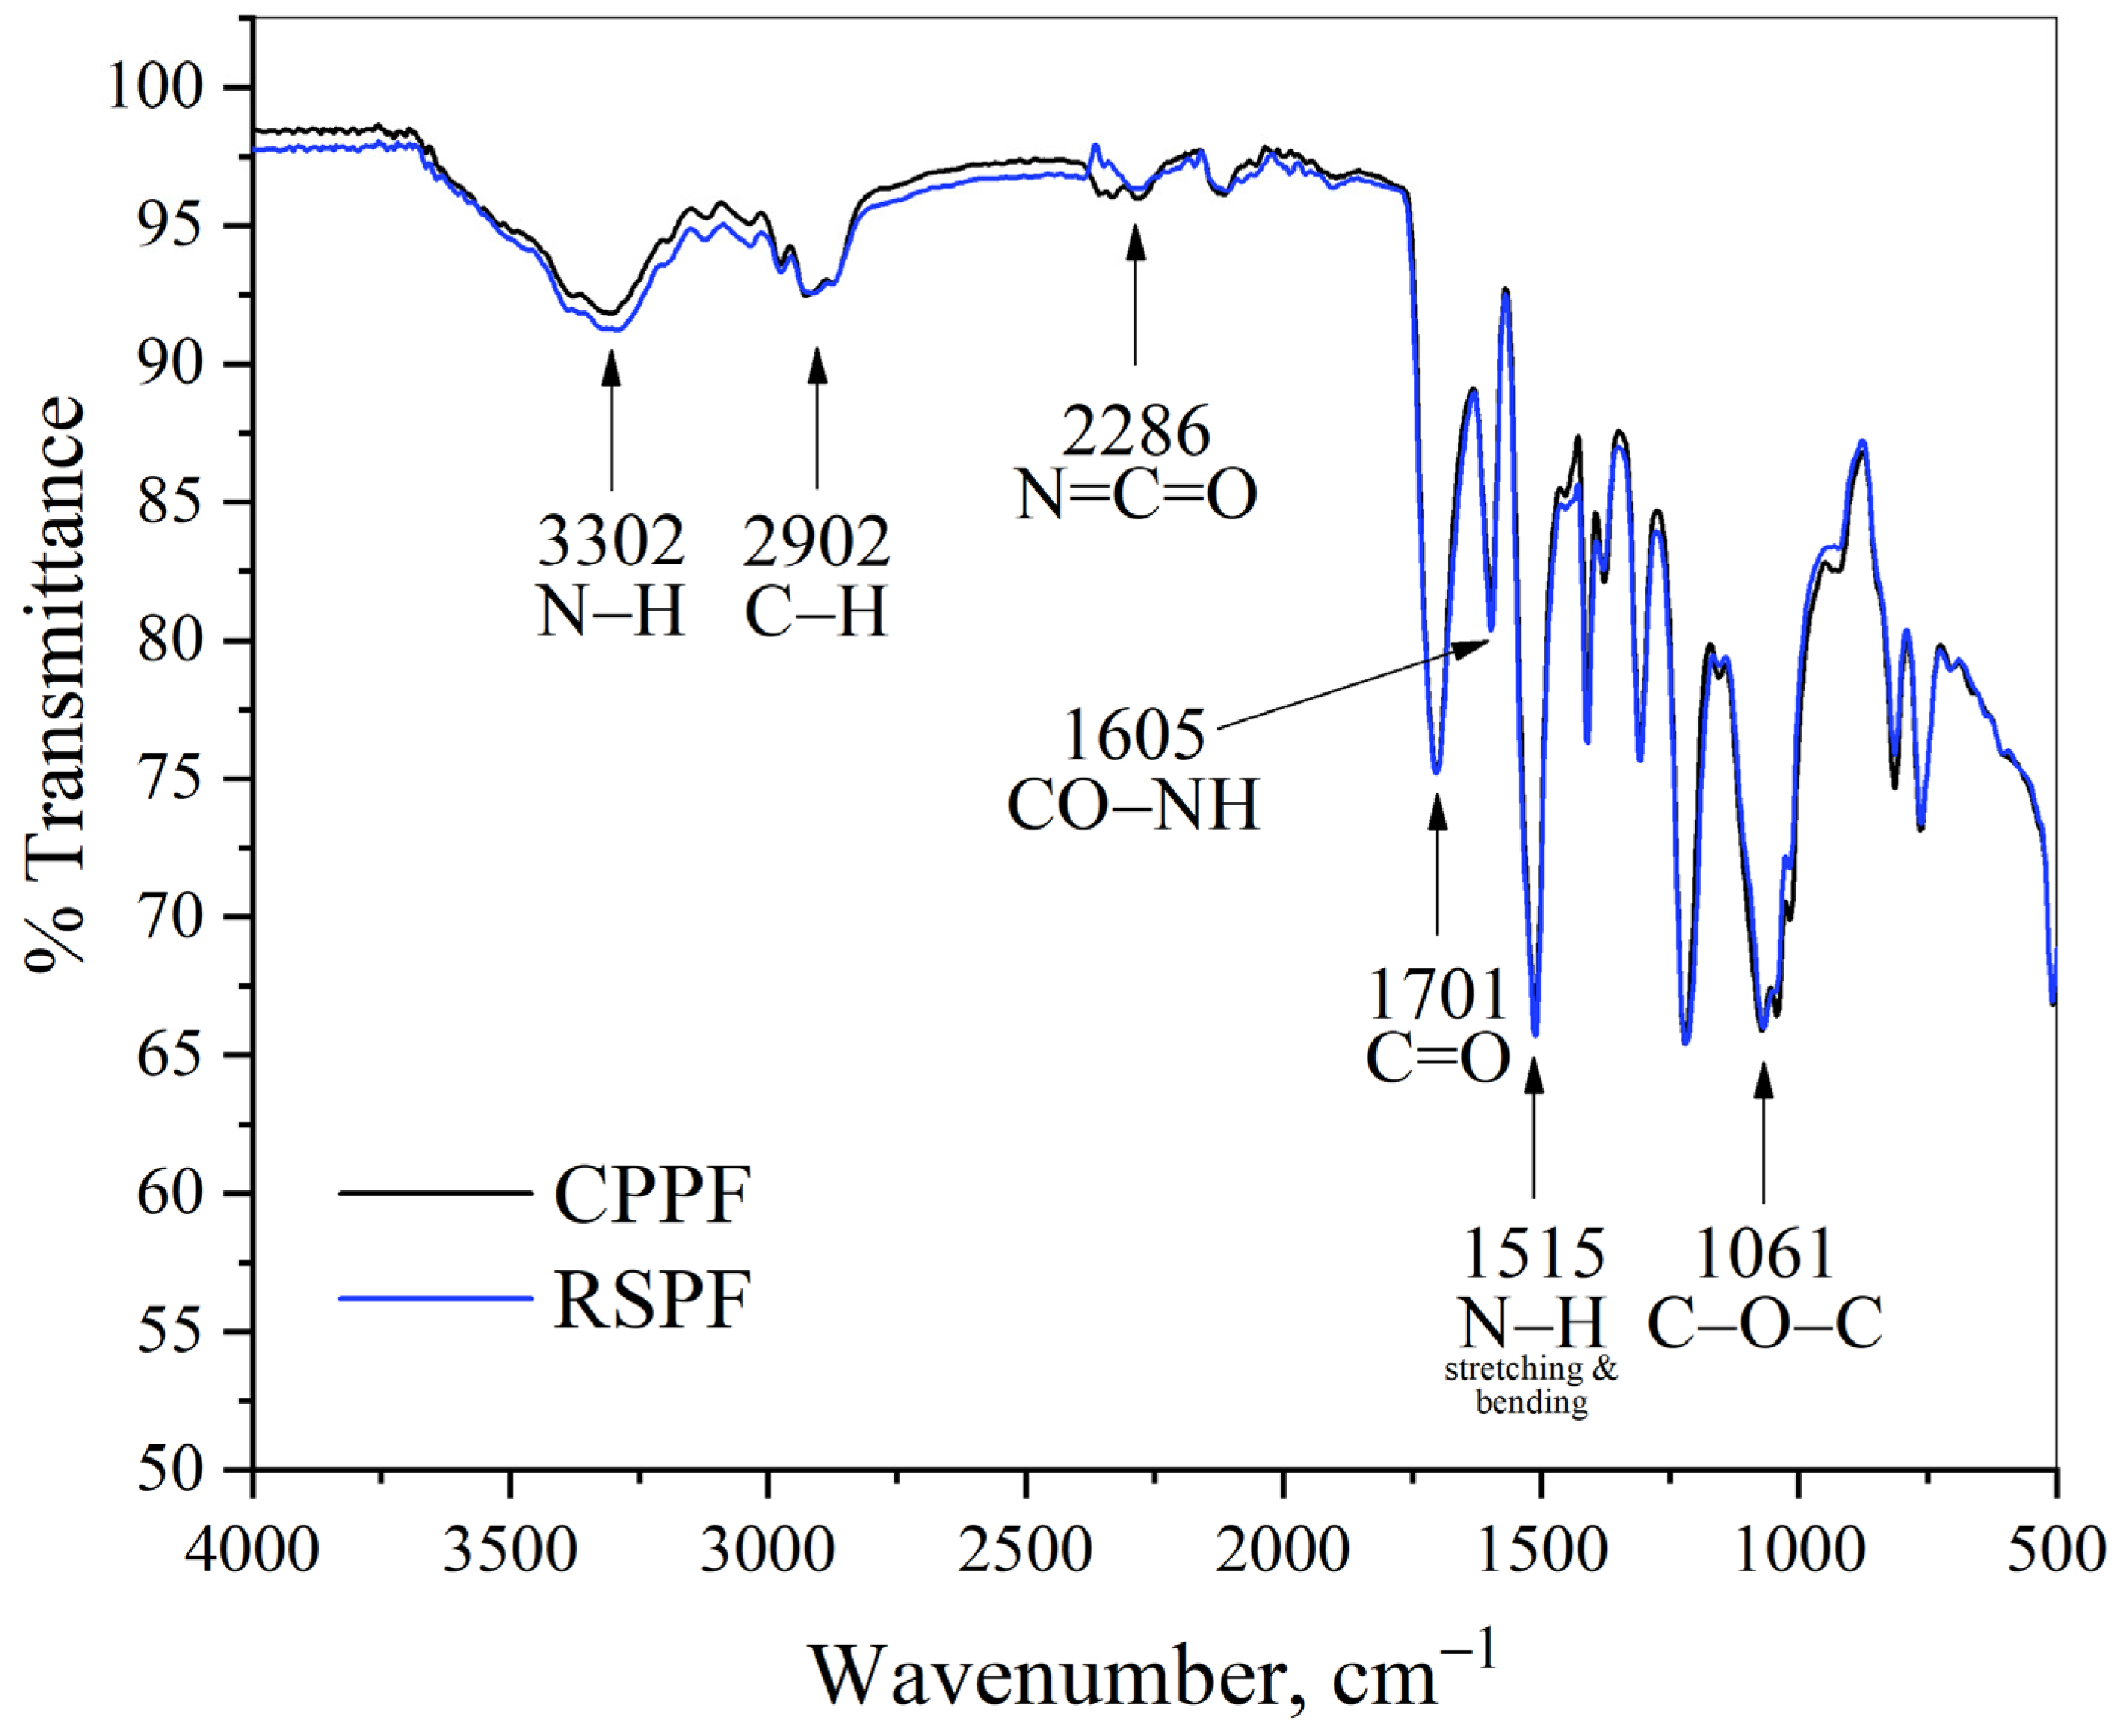
3.1.3. FTIR Spectroscopy

FTIR is a commonly used analytical technique that can provide information about the chemical composition and structure of materials. When applied to PU foam, FTIR can reveal information about the types of chemical bonds present in the material, as well as any functional groups that may be present. The FTIR spectra of the RSPF and CPPF blocks are shown in Figure 7. The peak at 3302 cm−1 represents the N–H stretching of the urethane bonds. Moreover, the low intensity of the N–H band signals the presence of little to no excess OH groups. This is generally a characteristic of rigid PU foam due to a high isocyanate index [46]. This means that almost all the OH groups have reacted, producing a highly crosslinked foam, thus increasing the rigidity of the foam. The slightly greater intensity of the N–H band of the RSPF sample is consistent with the higher OH number of the rice straw-based polyol, thus producing more urethane bonds during foam formation. The bands at 2902 cm−1 are C–H stretching groups. The weak bands at 2286 cm−1 show the stretching vibrations of unreacted N=C=O groups from the isocyanate. Furthermore, the sharp C=O stretching bands at 1701 cm−1 and the stretching peak of CO–NH at 1605 cm−1 (between 1701 cm−1 and 1515 cm−1) verify the formation of urethane linkages in the RSPF network. In the same manner, the sharp peaks at 1515 cm−1 denote the N–H bending and stretching vibrations, while the intense band at 1061 cm−1 shows the C–O–C vibrations in the urethanes.

3.1.4. Thermal Degradation

TGA was employed to investigate the thermal stability and degradation profile of the RSPF block in comparison with the CPPF sample. The TGA thermogram of the samples is displayed in Figure 8, while the details of the thermal decomposition are enumerated in Table 4. The first degradation stage (Td1) occurred at c.a. 350 °C, which corresponds to the decomposition of urethane bonds, forming the polyol and isocyanate [47]. At this stage, a weight loss of 53.48% was recorded for RSPF, slightly lower than the 57.11% weight loss in CPPF. The second degradation step (Td2) at c.a. 690 °C is attributed to the degradation of the soft segment (i.e., polyol) and isocyanate. The degradation temperature of RSPF is slightly lower at 690.30 °C than that of CPPF at 693.06 °C. At this stage, RSPF recorded a weight loss of 46.52%, while CPPF had a weight loss of 42.89%. These results show that the addition of rice straw-based polyol in the RSPF block has a slight effect on its thermal stability. Nevertheless, RSPF exhibited excellent thermal stability at relatively high temperatures.

3.1.5. Water Absorption

The water absorption test results are plotted in Figure 9. The RSPF and CPPF samples were preconditioned in two different ways: one set of foam samples was air-dried, while another set was oven-dried for 24 h before being subjected to water absorption according to ASTM C272/C272M [30]. The data in Figure 9 show that the RSPF samples exhibited a very high absorption capacity. During the first 24 h of soaking in water, the average increase in the mass of RSPF was 69% for air-dried and 96% for oven-dried samples. The difference between these values suggests that RSPF absorbs and retains some moisture from the air. A further immersion resulted in 214% and 262% water absorption at the end of 480 h for the air-dried and oven-dried samples, respectively. At this point, the change in the weight of the foam samples was negligible; thus, it can be deduced that this is the saturation point of RSPF samples. On the other hand, the CPPF samples only amassed a 113% and 89% increase in mass at their saturation point of 240 h of immersion for the oven-dried and air-dried samples, respectively.
These findings show that RSPF performs better than CPPF, not just in absorbing water but also in holding that volume of water in this foam matrix for an extended period of time. The improvement in the absorption capacity of RSPF may be attributed to the presence of the film-like structures in the foam’s morphology as shown in Figure 6C,D. As previously discussed, these formations are brought about by the dangling chains and branched structure of the lignocellulosic rice straw-based polyol. This cellulosic component is highly water absorbent [48].
When compared with the EPS foam in Table 3, the stark difference in absorption capacity is apparent. This higher absorption capacity of the RSPF block allows it to mitigate issues of buoyancy and pressure uplift [38]. In relation to the practical application for soil erosion control of the RSPF block, it has the potential to effectively absorb water, thus increasing infiltration and permeability of the patch of land. This increase in permeability can potentially reduce water runoff, which in turn, lessens the erosive forces of the runoff. Also, the RSPF block with stored water can provide a continuous water supply to vegetation, allowing for the better growth of plant life.

3.2. Application of RSPF Blocks in Mitigating Soil Loss

3.2.1. Simulated Rainfall Coefficient of Uniformity ( C u )

C u is an important indicator that the rainfall simulator has successfully generated a satisfactory rainfall distribution; thus, it is given its own subsection for discussion. A high C u value (>80%) indicates that the rainfall is well distributed, while a low C u value (<80%) indicates that the water is not evenly spread, which can lead to inaccurate results on the experimental data of sediment loss. From Equation (1), the calculated C u had an average value of 88%. This result surpasses the minimum acceptable threshold of 80%, conveying that the spatial distribution of rainfall can be regarded as reasonably consistent across the experimental plot [49,50].

3.2.2. Runoff Coefficient and Soil Loss

The runoff coefficients ( C ) determined in this study, employed within the framework of the rational method, are equally important in the investigation of the effectivity of RSPF blocks in mitigating soil loss, since they provide an approximation of the quantity of rainfall that will run off the surface. This value is useful for understanding how the different types of plots (BS, SV, SF, and FV) behave when subjected to rain and predicting soil erosion [51,52]. This is also particularly helpful in the estimation of channel discharge and flood mitigation.
When calculating C for all plot types under the simulated rainfall with an intensity of 80 mm/h, the FV plot consistently displayed the lowest C values of 0.27, 0.30, and 0.31 for slopes of 5°, 10°, and 20°, respectively. The SF plot showed almost similar results with the FV plot. These findings, shown in Figure 10, indicate that the application of PU foam block on the microplots can potentially mitigate soil loss. In contrast, the BS control plot obtained higher C values of 0.31, 0.32, and 0.33 for slopes of 5°, 10°, and 20°, respectively. However, the SV plot produced the highest C values across all slopes. This observation suggests that the vegetation on the soil did not contribute to the permeability of the soil to water. Instead, it had the opposite effect.
A comparable observation was made for the microplots under natural rainfall. The results in Table 5 reveal that the plots with RSPF blocks (FV and SF) consistently achieved the most favorable C values. These data propound that the use of RSPF blocks in both simulated and natural rainfall setups highly improved the soil erosion and water management in slopes due to their high water absorption capacity. Also, the C values mostly aligned with the rational method range of 0.05–0.95 [53].
Furthermore, the sediment loss for the microplots was also measured and analyzed. A substantial decrease in sediment loss was recorded across all plots and slopes, as shown in Figure 11. This means that incorporating vegetation, RSPF blocks, and the combination of the two helped prevent soil loss at any slope. However, this did not apply to the SV plot at a 10° slope.
Nevertheless, the SF plot produced a 4.3% to 61.5% reduction in soil loss compared with the control BS plot. This demonstrates the effectiveness of the RSPF blocks in soil erosion mitigation. When coupled with the addition of vegetation, the decrease in soil loss became more pronounced at 19.3% to 79.6% in the FV plot. It can also be inferred from the results that the RSPF blocks had the most significant contribution to soil erosion control since the SV plot recorded a lesser soil loss reduction of 3.0% to 29.3%.
The results from the simulated setup were confirmed on a field with natural rainfall events. The results in Figure 12 are composed of the BS, SV, and SF microplots. A 93.6–98.8% reduction of soil loss was achieved in the SF plot compared with the BS control plot. This is much higher than the reduction in the SV plot at 85.6–95.8%. This shows that the use of RSPF blocks in soil was able to minimize soil loss. It is also worth noting that the SV plots yielded significant results in the field microplots than the simulated microplots. This may be due to the differences in the size and root area of the vegetation planted on the SV and FV microplots.
In light of these outcomes, it is evident that RSPF exhibits desirable characteristics as a lightweight material with an exceptional absorption capacity, offering a viable remedy for mitigating soil erosion. The block’s design allows for effective soil confinement, while its remarkable absorption capacity enables it to retain water, reducing runoff and the displacement of soil particles. Moreover, its lightweight nature renders it convenient to handle and transport, presenting a practical solution for erosion control. Applying these blocks to the soil surface is a straightforward process, as it does not necessitate heavy machinery or equipment, thereby minimizing soil disturbance and the risk of erosion. The absorption performance of the RSPF block is highly recommendable to sandy soils, which typically have larger particle sizes and larger void spaces between particles than other soil types, allowing more water to flow through the soil and increase the pore pressure. Moreover, considering today’s high prices and dwindling petroleum supplies, the demand for material innovation in the construction industry, and the community’s desire for environmentally friendly green products, the RSPF foam blocks present significant potential.

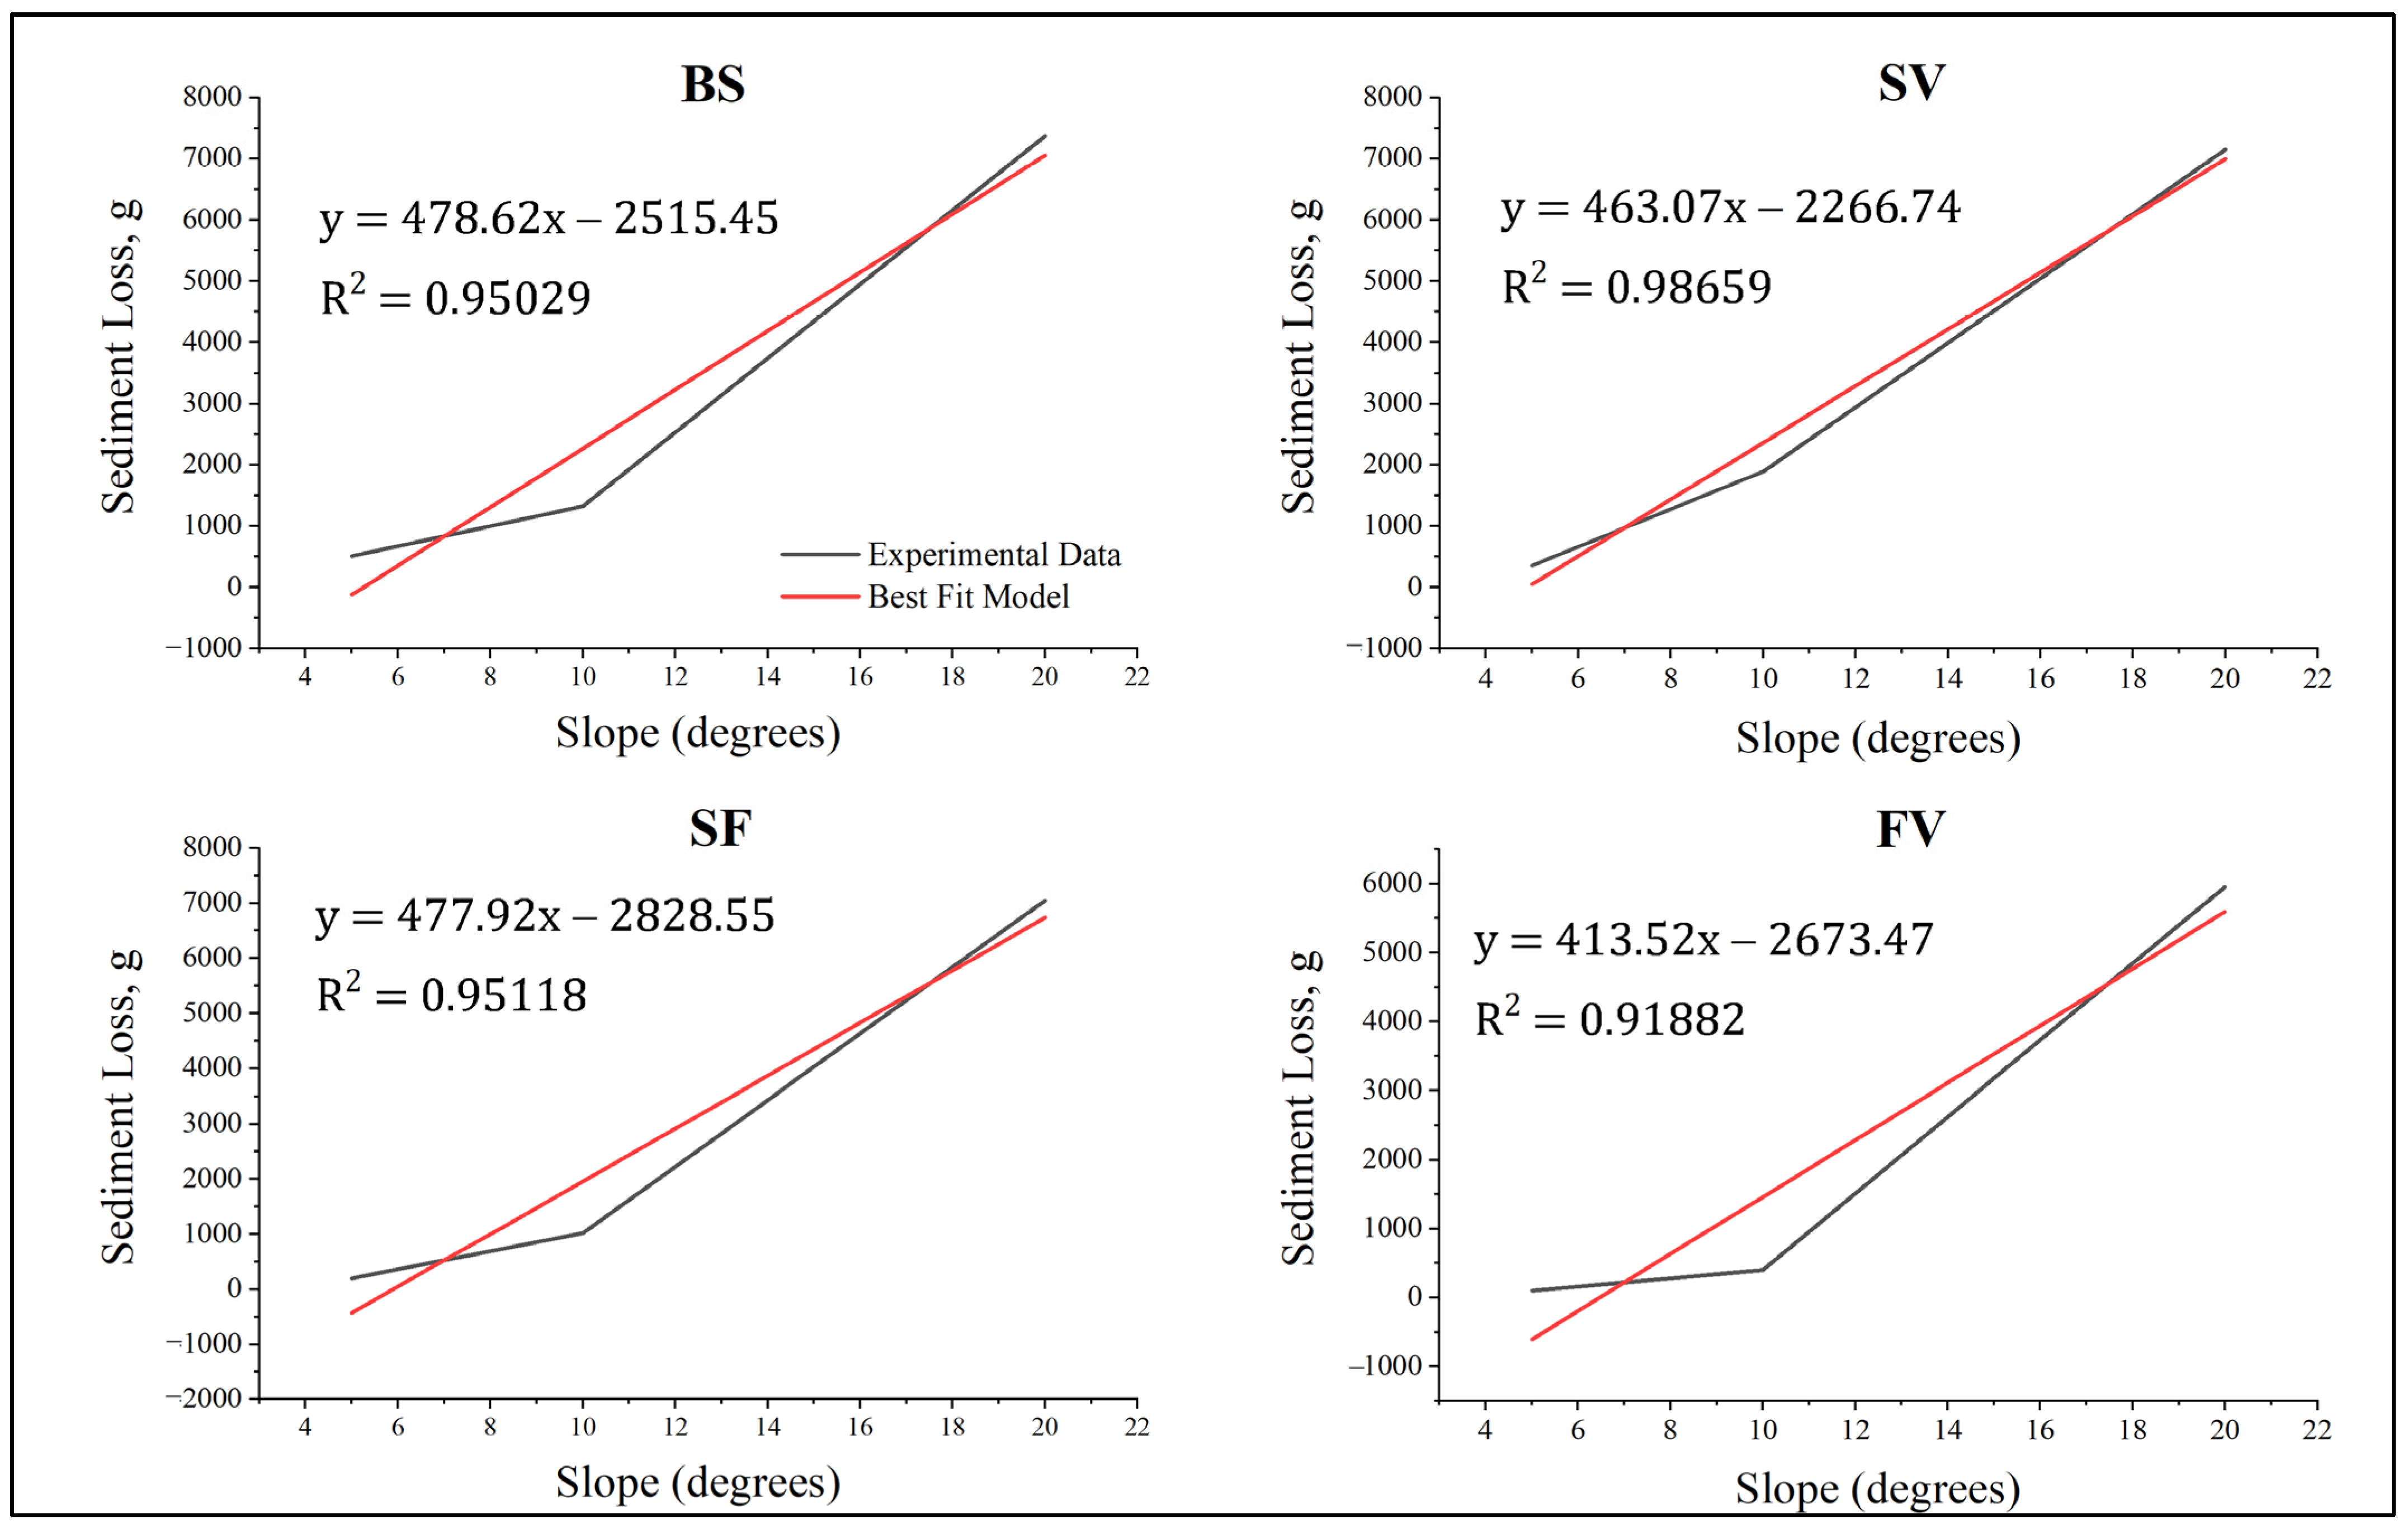
3.2.3. Relationship between Soil Loss and Land Slope

The collected data from the experimental setup were analyzed to develop a model to derive a comprehensive insight into the effect of land slope on soil loss at different plot types. Understanding this relationship is necessary, since it can influence land use plans [54]. Despite several studies already providing some correlations between soil loss and land slope, the novel use of RSPF blocks and their combination with other soil cover types warrants its independent analysis for new correlations.
The results shown in Figure 13 reveal an interesting linear relationship determined through curve fitting between soil loss and land slope across all plot setups: BS, SV, SF, and FV. This is supported by a relatively high coefficient of determination (R2) ranging between 0.92 and 0.99. These relationships reiterate that soil erosion depends on the land slope and plot type/soil cover.

4. Conclusions

This study demonstrated the performance of novel RSPF as soil erosion control blocks in slope stabilization and topsoil protection by reducing runoff. Specific findings are as follows:
  • RSPF blocks have a density of 43.29 kg/m3, compressive strength of 184.55 kPa, and water absorption capacity of up to 262% their mass.
  • RSPF blocks in a simulated rainfall intensity of 80 mm/h reduced the soil loss by 61.5%, 22.7%, and 4.3% in 5°, 10°, and 20° of land slope, respectively, compared with bare soil. The reduction of soil loss was amplified when the RSPF block was used in combination with natural vegetation cover with 79.6%, 70%, and 19.3% reductions in 5°, 10°, and 20° land slopes, respectively.
  • Microplots in actual fields were also studied under natural rainfall events with an average rainfall intensity of 16.26 mm/h and slope of 20°. Soil loss was reduced by 93.6–98.8% in microplots embedded with RSPF compared with bare soil.
  • Curve fitting of the available data generated a linear regression correlation between soil loss and slope across all types of microplot. The coefficients of determination (R2) of the models were calculated to fall between 0.92 and 0.99, suggesting that the equations have a high degree of accuracy in predicting soil loss at different slopes up to 20°.
These remarkable findings concerning soil loss reduction with the use of RSPF blocks could serve as a starting ground for future research in this novel application of PUs in the field of soil erosion control.

Author Contributions

Conceptualization, F.P.M., D.J.E.E., R.J.R.-B. and G.A.L.; Data curation, F.P.M., C.J.M.O., G.Y.A., N.L.L., E.J.C.C., A.I.C. and M.A.N.A.; Formal analysis, F.P.M., C.J.M.O. and D.J.E.E.; Funding acquisition, A.A.L.; Investigation, F.P.M., B.J.M.A., E.J.C.C. and M.A.N.A.; Methodology, F.P.M., R.J.R.-B., M.A.N.A. and G.A.L.; Project administration, R.M.M. and A.A.L.; Resources, R.M.M. and A.A.L.; Supervision, G.A.L., R.M.M., G.G.D. and A.A.L.; Validation, C.J.M.O., B.J.M.A. and A.I.C.; Visualization, G.Y.A. and N.L.L.; Writing—original draft, F.P.M. and C.J.M.O.; Writing—review & editing, G.G.D. All authors have read and agreed to the published version of the manuscript.

Funding

The authors extend their sincere appreciation for the generous financial support received from the United States Agency for International Development (USAID) STRIDE Program (grant No. 0213997-G-2016-017-00), the Department of Science and Technology (DOST) through the DOST-PCIEERD GIA Polyols and Polyurethanes Research program, and the Niche Centers in the Region (NICER)—R&D Center for Sustainable Polymers (grant No. 101-02-0194-2022).

Institutional Review Board Statement

Not applicable.

Informed Consent Statement

Not applicable.

Data Availability Statement

The data presented in this study are available on request.

Acknowledgments

This study was made possible through the Center for Sustainable Polymers, formerly the BioProducts Research Laboratory, MSU-Iligan Institute of Technology, Philippines, for providing state-of-the-art laboratory facilities.

Conflicts of Interest

The authors declare no conflicts of interest.

References

  1. Wuepper, D.; Borrelli, P.; Finger, R. Countries and the global rate of soil erosion. Nat. Sustain. 2019, 3, 51–55. [Google Scholar] [CrossRef]
  2. Liu, J.; Shi, B.; Gu, K.; Jiang, H.; Inyang, H.I. Effect of polyurethane on the stability of sand–clay mixtures. Bull. Eng. Geol. Environ. 2012, 71, 537–544. [Google Scholar] [CrossRef]
  3. Iii, J.M.G. Effectiveness of vegetation in erosion control from forest road sideslopes. Trans. ASAE 2002, 45, 681. [Google Scholar] [CrossRef]
  4. Gholami, L.; Hasanzadeh, N.; Darvishan, A.K. Effect of sawdust on splash erosion in laboratory condition. J. Agric. For. 2018, 64, 51–56. [Google Scholar] [CrossRef]
  5. Bakr, N.; Weindorf, D.C.; Zhu, Y.; Arceneaux, A.E.; Selim, H. Evaluation of compost/mulch as highway embankment erosion control in Louisiana at the plot-scale. J. Hydrol. 2012, 468–469, 257–267. [Google Scholar] [CrossRef]
  6. Buchanan, J.R.; Yoder, D.C.; Denton, H.P.; Smoot, J.L. Wood chips as a soil cover for construction sites with steep slopes. Appl. Eng. Agric. 2002, 18, 679. [Google Scholar] [CrossRef]
  7. Cao, S.; Xu, C.; Ye, H.; Zhan, Y.; Gong, C. The use of air bricks for planting roadside vegetation: A new technique to improve landscaping of steep roadsides in China’s Hubei Province. Ecol. Eng. 2010, 36, 697–702. [Google Scholar] [CrossRef]
  8. Kavian, A.; Gholami, L.; Mohammadi, M.; Spalevic, V.; Soraki, M.F. Impact of Wheat Residue on Soil Erosion Processes. Not. Bot. Horti Agrobot. Cluj-Napoca 2018, 46, 553–562. [Google Scholar] [CrossRef]
  9. Kumar, N.; Das, D. Nonwoven geotextiles from nettle and poly(lactic acid) fibers for slope stabilization using bioengineering approach. Geotext. Geomembr. 2018, 46, 206–213. [Google Scholar] [CrossRef]
  10. Luo, H.; Zhao, T.; Dong, M.; Gao, J.; Peng, X.; Guo, Y.; Wang, Z.; Liang, C. Field studies on the effects of three geotextiles on runoff and erosion of road slope in Beijing, China. CATENA 2013, 109, 150–156. [Google Scholar] [CrossRef]
  11. Javellonar, R.P.; Taylan, V.T.; Agulto, I.C.; Aguinaldo, T.G.; Sicat, E.V.; Gavino, H.F. Rice Straw Geotextile as Ground Cover for Soil Erosion Mitigation. J. Energy Technol. Policy 2013, 3, 195–204. [Google Scholar]
  12. Moreno-Ramón, H.; Quizembe, S.J.; Ibáñez-Asensio, S. Coffee husk mulch on soil erosion and runoff: Experiences under rainfall simulation experiment. Solid Earth 2014, 5, 851–862. [Google Scholar] [CrossRef]
  13. Orts, W.J.; Sojka, R.E.; Glenn, G.; Gross, R.A. Preventing soil erosion with polymer additives. Polym. News 1999, 24, 406–413. [Google Scholar]
  14. Prats, S.A.; Martins, M.A.d.S.; Malvar, M.C.; Ben-Hur, M.; Keizer, J.J. Polyacrylamide application versus forest residue mulching for reducing post-fire runoff and soil erosion. Sci. Total Environ. 2014, 468–469, 464–474. [Google Scholar] [CrossRef] [PubMed]
  15. Foltz, R.B.; Dooley, J.H. Comparison of erosion reduction between wood strands and agricultural straw. Trans. ASAE 2003, 46, 464–474. [Google Scholar] [CrossRef]
  16. Ghadir, P.; Ranjbar, N. Clayey soil stabilization using geopolymer and Portland cement. Constr. Build. Mater. 2018, 188, 361–371. [Google Scholar] [CrossRef]
  17. Rickson, R. Geotextiles in land reclamation. In Land Reclamation—Extending Boundaries; Taylor & Francis: Abingdon, UK, 2003. [Google Scholar] [CrossRef]
  18. Smoltczyk, U.; Malcharek, K. Slope protection by membrane structures. Geotext. Geomembr. 1985, 2, 323–336. [Google Scholar] [CrossRef]
  19. Lee, J.H.; Kim, S.H.; Oh, K.W. Bio-Based Polyurethane Foams with Castor Oil Based Multifunctional Polyols for Improved Compressive Properties. Polymers 2021, 13, 576. [Google Scholar] [CrossRef]
  20. Pinzi, S.; Dorado, M.P. Vegetable-based feedstocks for biofuels production. In Handbook of Biofuels Production; Elsevier: Amsterdam, The Netherlands, 2011; pp. 61–94. [Google Scholar] [CrossRef]
  21. Akay, O.; Özer, A.; Fox, G. Assessment of EPS block geofoam with internal drainage for sandy slopes subjected to seepage flow. Geosynth. Int. 2014, 21, 364–376. [Google Scholar] [CrossRef]
  22. Artidteang, S.; Tanchaisawat, T.; Bergado, D.T.; Chaiyaput, S. Natural Fibers in Reinforcement and Erosion Control Applications with Limited Life Geosynthetics. In Ground Improvement Case Histories; Elsevier: Amsterdam, The Netherlands, 2015; pp. 717–740. [Google Scholar] [CrossRef]
  23. García-Ruiz, J.M.; Beguería, S.; Nadal-Romero, E.; González-Hidalgo, J.C.; Lana-Renault, N.; Sanjuán, Y. A meta-analysis of soil erosion rates across the world. Geomorphology 2015, 239, 160–173. [Google Scholar] [CrossRef]
  24. Xu, X.; Zhang, K.; Kong, Y.; Chen, J.; Yu, B. Effectiveness of erosion control measures along the Qinghai–Tibet highway, Tibetan plateau, China. Transp. Res. Part D Transp. Environ. 2006, 11, 302–309. [Google Scholar] [CrossRef]
  25. Pioquinto, W.P.C.; Caranto, J.A.; Bayrante, L.F.; Zarco, M.H.; Catane, S.G. Mitigating a Deep-Seated Landslide Hazard- the Case of 105 Mahiao Slide Area, Leyte Geothermal Production Field, Philippines. In Proceedings of the World Geothermal Congress, Bali, Indonesia, 25–30 April 2010; pp. 25–29. [Google Scholar]
  26. ASTM Standard D1622; Standard Test Method for Apparent Density of Rigid Cellular Plastics. ASTM International: West Conshohocken, PA, USA, 2020. [CrossRef]
  27. ASTM Standard C518; Standard Test Method for Steady-State Thermal Transmission Properties by Means of the Heat Flow Meter Apparatus. ASTM International: West Conshohocken, PA, USA, 2021. [CrossRef]
  28. ASTM Standard D1621; Standard Test Method for Compressive Properties of Rigid Cellular Plastics. ASTM International: West Conshohocken, PA, USA, 2016. [CrossRef]
  29. ASTM Standard D6226; Standard Test Method for Open Cell Content of Rigid Cellular Plastics. ASTM International: West Conshohocken, PA, USA, 2015. [CrossRef]
  30. ASTM Standard C272/C272M; Standard Test Method for Water Absorption of Core Materials for Sandwich Constructions. ASTM International: West Conshohocken, PA, USA, 2018.
  31. Keya, D.R.; Karim, T.H. Simulation of Rainfall Intensity and Slope Gradient to Determination the Soil Runoff Coefficient at Microplot Scale. Polytech. J. 2020, 10, 12–17. [Google Scholar] [CrossRef]
  32. Bortolini, L.; Martello, M. Effects of Water Distribution Uniformity on Waxy Corn (Zea mays L.) Yield: Preliminary Results. J. Water Resour. Prot. 2014, 6, 1037–1044. [Google Scholar] [CrossRef]
  33. Quan, X.; He, J.; Cai, Q.; Sun, L.; Li, X.; Wang, S. Soil erosion and deposition characteristics of slope surfaces for two loess soils using indoor simulated rainfall experiment. Soil Tillage Res. 2020, 204, 104714. [Google Scholar] [CrossRef]
  34. Legout, C.; Leguédois, S.; Le Bissonnais, Y.; Issa, O.M. Splash distance and size distributions for various soils. Geoderma 2005, 124, 279–292. [Google Scholar] [CrossRef]
  35. Khalilmoghadam, B.; Afyuni, M.; Abbaspour, K.; Jalalian, A.; Dehghani, A.; Schulin, R. Estimation of surface shear strength in Zagros region of Iran—A comparison of artificial neural networks and multiple-linear regression models. Geoderma 2009, 153, 29–36. [Google Scholar] [CrossRef]
  36. Yu, X.; Huang, Y.; Li, E.; Li, X.; Guo, W. Effects of rainfall and vegetation to soil water input and output processes in the Mu Us Sandy Land, northwest China. CATENA 2018, 161, 96–103. [Google Scholar] [CrossRef]
  37. Bahat, Y.; Grodek, T.; Lekach, J.; Morin, E. Rainfall–runoff modeling in a small hyper-arid catchment. J. Hydrol. 2009, 373, 204–217. [Google Scholar] [CrossRef]
  38. Stark, T.; Bartlett, S.; Arellano, D. Expanded Polystyrene (EPS) Geofoam Applications and Technical Data; The EPS Industry Alliance: Crofton, MD, USA, 2012; Volume 1298. [Google Scholar]
  39. Salcedo, M.L.D.; Omisol, C.J.M.; Maputi, A.O.; Estrada, D.J.E.; Aguinid, B.J.M.; Asequia, D.M.A.; Erjeno, D.J.D.; Apostol, G.; Siy, H.; Malaluan, R.M.; et al. Production of Bio-Based Polyol from Coconut Fatty Acid Distillate (CFAD) and Crude Glycerol for Rigid Polyurethane Foam Applications. Materials 2023, 16, 5453. [Google Scholar] [CrossRef]
  40. ASTM Standard D6817/D6817M-17; Standard Specification for Rigid Cellular Polystyrene Geofoam. ASTM International: West Conshohocken, PA, USA, 2021.
  41. ISO 4898; Rigid Cellular Plastics—Thermal Insulation Products for Buildings—Specifications. ISO: Geneva, Switzerland, 2018.
  42. Chadha, A.; Florentine, S.K.; Chauhan, B.S.; Long, B.; Jayasundera, M. Influence of soil moisture regimes on growth, photosynthetic capacity, leaf biochemistry and reproductive capabilities of the invasive agronomic weed; Lactuca serriola. PLoS ONE 2019, 14, e0218191. [Google Scholar] [CrossRef]
  43. Gravit, V.M.; Ogidan, O.; Znamenskaya, E. Methods for determining the number of closed cells in rigid sprayed polyurethane foam. MATEC Web Conf. 2018, 193, 03027. [Google Scholar] [CrossRef]
  44. Kurańska, M.; Malewska, E.; Polaczek, K.; Prociak, A.; Kubacka, J. A Pathway toward a New Era of Open-Cell Polyurethane Foams—Influence of Bio-Polyols Derived from Used Cooking Oil on Foams Properties. Materials 2020, 13, 5161. [Google Scholar] [CrossRef] [PubMed]
  45. Prociak, A.; Kurańska, M.; Cabulis, U.; Ryszkowska, J.; Leszczyńska, M.; Uram, K.; Kirpluks, M. Effect of bio-polyols with different chemical structures on foaming of polyurethane systems and foam properties. Ind. Crop. Prod. 2018, 120, 262–270. [Google Scholar] [CrossRef]
  46. Trovati, G.; Sanches, E.A.; Neto, S.C.; Mascarenhas, Y.P.; Chierice, G.O. Characterization of polyurethane resins by FTIR, TGA, and XRD. J. Appl. Polym. Sci. 2010, 115, 263–268. [Google Scholar] [CrossRef]
  47. Gu, R.; Sain, M.M. Effects of Wood Fiber and Microclay on the Performance of Soy Based Polyurethane Foams. J. Polym. Environ. 2012, 21, 30–38. [Google Scholar] [CrossRef]
  48. Luo, M.-T.; Li, H.-L.; Huang, C.; Zhang, H.-R.; Xiong, L.; Chen, X.-F.; Chen, X.-D. Cellulose-Based Absorbent Production from Bacterial Cellulose and Acrylic Acid: Synthesis and Performance. Polymers 2018, 10, 702. [Google Scholar] [CrossRef] [PubMed]
  49. Kim, H.; Ko, T.; Jeong, H.; Ye, S. The Development of a Methodology for Calibrating a Large-Scale Laboratory Rainfall Simulator. Atmosphere 2018, 9, 427. [Google Scholar] [CrossRef]
  50. Ngasoh, F.G.; Mbajiorgu, C.C.; Kamai, M.B.; Okoro, G.O. A Revisit of Rainfall Simulator as a Potential Tool for Hydrological Research. In Agrometeorology; IntechOpen: Rijeka, Croatian, 2021. [Google Scholar] [CrossRef]
  51. Machado, R.E.; Cardoso, T.O.; Mortene, M.H. Determination of runoff coefficient (C) in catchments based on analysis of precipitation and flow events. Int. Soil Water Conserv. Res. 2021, 10, 208–216. [Google Scholar] [CrossRef]
  52. Zheng, H.; Miao, C.; Zhang, G.; Li, X.; Wang, S.; Wu, J.; Gou, J. Is the runoff coefficient increasing or decreasing after ecological restoration on China’s Loess Plateau? Int. Soil Water Conserv. Res. 2021, 9, 333–343. [Google Scholar] [CrossRef]
  53. Khadka, D.B. Experimental Study of Runoff Coefficients for Different Hill Slope Soil Profiles. Open J. Civ. Eng. 2019, 9, 157–171. [Google Scholar]
  54. Zhang, Z.; Sheng, L.; Yang, J.; Chen, X.-A.; Kong, L.; Wagan, B. Effects of Land Use and Slope Gradient on Soil Erosion in a Red Soil Hilly Watershed of Southern China. Sustainability 2015, 7, 14309–14325. [Google Scholar] [CrossRef]
Figure 1. Rice straw-based polyurethane foam (RSPF) blocks.
Sustainability 16 00261 g001
Figure 2. Rainfall simulator design showing the full cone nozzles above the microplot bed that are mounted at the 3 m tall metal frame connected to a pressurized tank with a pump that suctions water from a reservoir.
Sustainability 16 00261 g002
Figure 3. Simulated experimental setup. (A) Nozzles for the simulated rain; (B) rain gauges used on the experimental plot to measure uniformity of simulated rainfall.
Sustainability 16 00261 g003
Figure 4. (A) Microplot experimental setup with adjustable land slope under simulated rainfall; (B) runoff collector located at the lower side corner of the microplot that directs water runoff into a collection container.
Sustainability 16 00261 g004
Figure 5. Microplots on a field with a 20° slope under natural rainfall event: (A) field setup showing soil with RSPF blocks (SF) plot; (B) field setups showing RSPF blocks with vegetation (FV), soil with vegetation (SV), and bare soil (BS) plots.
Sustainability 16 00261 g005
Figure 6. Scanning electron microscopy (SEM) images of polyurethane foams using a secondary electron absorber (SED) at 10.0 kV high vacuum with a probe current of 40.0 μA: (A,B) control petroleum-based PU foam (CPPF) at ×50 and ×100 magnification, respectively; (C,D) rice straw-based PU foam (RSPF) at ×50 and ×100 magnification, respectively.
Sustainability 16 00261 g006
Figure 7. Fourier transform infrared (FTIR) spectra of control petroleum-based PU foam (CPPF) and rice straw-based polyurethane foam (RSPF).
Sustainability 16 00261 g007
Figure 8. Thermogravimetric analysis and derivative thermogravimetry (TGA/DTG) thermogram of control petroleum-based PU foam (CPPF) and rice straw-based polyurethane foam (RSPF) block. The solid line refers to TGA, while the dashed lines refers to DTG.
Sustainability 16 00261 g008
Figure 9. Water absorption performance of control petroleum-based PU foam (CPPF) and rice straw-based PU foam (RSPF) at different preconditioning.
Sustainability 16 00261 g009
Figure 10. Runoff coefficient under simulated rainfall for bare soil (BS), soil with vegetation (SV), soil with embedded RSPF blocks (SF), and soil with RSPF blocks and vegetation (FV) microplots at varying plot slopes, showing a general decrease in runoff coefficients for SF and FV.
Sustainability 16 00261 g010
Figure 11. Soil loss under simulated rainfall for bare soil (BS), soil with vegetation (SV), soil with embedded RSPF blocks (SF), and soil with RSPF blocks and vegetation (FV) microplots at varying plot slopes, showing a significant reduction in soil loss for plots with RSPF foam.
Sustainability 16 00261 g011
Figure 12. Soil loss under natural rainfall events for microplots with bare soil (BS), soil with vegetation (SV), and soil with embedded RSPF blocks (SF), showing a better performance of SF in reducing soil loss compared with SV.
Sustainability 16 00261 g012
Figure 13. Statistical models show a linear relationship between soil loss and land slope at different plot types: bare soil (BS), soil with vegetation (SV), soil with embedded RSPF blocks (SF), and soil with embedded RSPF blocks and vegetation (FV).
Sustainability 16 00261 g013
Table 1. Rice straw-based polyurethane foam (RSPF) formulation.
ComponentsParts per Weight
AMDI110
BRice straw-based polyol15
VORANOL™ 49085
POLYCAT® 81.0–1.5
DABCO® DC53570.5–1.0
Distilled water2.5
Table 2. Summary of factors that varied in the study.
ParametersMicroplots
Nature of rainfallSimulated rainfallnatural Rainfall
Type of plotBare soil (BS)
Soil with vegetation (SV)
Soil with foam (SF)
Soil with foam and vegetation (FV)
Land slope5°, 10°, 20°20°
Rainfall intensity80 mm/h16.26 mm/h a
a denotes average of three natural rainfall events.
Table 3. Physical and mechanical properties of rice straw-based polyurethane foam (RSPF) in comparison with expanded polystyrene (EPS).
PropertyExpanded Polystyrene [40,41]RSPFTest
EPS 12EPS 15EPS 19EPS 22EPS 29EPS 39EPS 46
Density (kg/m3)11.214.418.421.628.838.445.743.29 ± 1.86ASTM D1622 [26]
Thermal conductivity, W/m·K0.029–0.0390.033 ± 0.005ASTM C518 [27]
Compressive strength at 10% strain, kPa4070110135200276345184.55 ± 2.94ASTM D1621 [28]
Water absorption, %4.04.03.03.02.02.02.0262 ± 7ASTM C272 [30]
Table 4. Thermal decomposition temperatures and weight loss of rice straw-based polyurethane foam (RSPF) block.
SamplesThermal Decomposition% Weight Loss
Td1 (°C)Td2 (°C)m1m2
CPPF357.03693.0657.1142.89
RSPF352.44690.3053.4846.52
Table 5. Runoff coefficient under natural rainfall events for bare soil (BS), soil with vegetation (SV), soil with embedded RSPF blocks (SF), and soil with RSPF blocks and vegetation (FV) microplots, showing the lowest coefficients for SF and FV.
Type of PlotRunoff Coefficient, C
BS0.35–2.20
SV0.12–0.92
SF0.10–0.15
FV0.06–0.60
Disclaimer/Publisher’s Note: The statements, opinions and data contained in all publications are solely those of the individual author(s) and contributor(s) and not of MDPI and/or the editor(s). MDPI and/or the editor(s) disclaim responsibility for any injury to people or property resulting from any ideas, methods, instructions or products referred to in the content.

