1. Introduction
Hydropower is one of the major components of global renewable energy generation, contributing to a 1211GW capacity, equivalent to 43% of the total renewable energy capacity [
1]. If we are to achieve the targets set out in the Paris Agreement 2015 [
2], we must look at ways in which we can sustainably increase the global hydropower output. Hydro turbines are a key component of hydropower. They convert mechanical power to electrical power through the redirection of water, thus generating zero carbon emissions making them a great alternative to coal, oil, and natural gas.
The Pelton turbine is a longstanding and highly reliable model for the runner of a high-head hydroelectric turbine. Initially conceived in the 19th century, subsequent improvements have pushed its efficiency into the region of 92% [
3,
4]. This makes it a perfect choice for many high-head hydroelectric applications, such as in dams. However, the Pelton turbine has a critical flaw. The runner is divided into two mirrored halves, with a bucket on either side and an edge known as the splitter in the middle that directs the flow of water from the inlet nozzle into the buckets. The flaw lies in this splitter, which needs to be as sharp as possible to maintain high efficiency, but the same sharpness leads to rapid erosion, reduction of efficiency, and a greater need for maintenance and repairs leading to potential shutdown of power generation [
5,
6,
7,
8,
9,
10,
11]. The full Pelton wheel and bucket can be seen from
Figure 1.
Previous attempts to optimize the Pelton turbine design can be seen from the review of relevant literature conducted by Aggidis et al. in 2023 [
12]. From several studies, the parameters investigated included bucket exit angle [
13,
14], bucket length [
15], bucket depth, bucket width, length/depth ratio, width/depth ratio, internal bucket geometry, splitter inlet angle [
16], and number of buckets [
17].
These parameters were modified with varying success in improving the efficiency of the Pelton turbine and provided evidence that continuous improvements are being made to the design of the Pelton. Whilst the review by Aggidis et al. does use a variety of publicized research, commercial sensitivity means that industrially utilized Pelton turbines were unable to be compared within the review. Despite this, the review concludes that there is potential application for new novel turbine designs to replace erosion-susceptible Pelton turbines that are currently used [
12]. It also states that combining the concept of a Pelton bucket (due to its high efficiency) and a Turgo single-bucket approach (which has a more durable design) could present a good opportunity for an optimized new design.
The motivation for this study, therefore, revolves around a novel turbine design modeled around a combination of a Pelton and Turgo turbine. Erosion of a Pelton splitter due to sediment can cause efficiency losses of up to 1% in one sediment season alone [
5]. The Turgo turbine does not include a splitter; however, its theoretical maximum efficiency is lower than that of a Pelton turbine. This is due to the jet entry not being perpendicular to the turbine shaft and therefore, the maximum force acting on the bucket is a component of the angle.
The proposed design is a combination of the two with a half bucket attached to a backing plate like a Turgo turbine. However, the jet entry is perpendicular to the shaft, so the theoretical efficiency is not limited.
Figure 2 shows how a runner would be composed of a backing plate, to which a set of identical half buckets would be fastened on one side. Instead of the water jet colliding with the splitter and dividing into two streams, it would instead be incident directly on the bucket. This model makes the requirement for sharp edges redundant, removing the maintenance time in sharpening the splitter entirely. A more in-depth methodology regarding the development of this turbine is described in [
12].
When developing this design, the overall sustainability of the product had to be accounted for. When considering the overall sustainability of any proposed design, there are three subsections that must be analyzed. These subsections are economic impact, environmental impact, and social impact. These are typically referred to as the Three Pillars of Sustainability [
18,
19]. All three pillars must be considered when determining if a process or product is sustainable (
Figure 3). Due to the nature of hydro turbines and their ability to harness the natural power of flowing water, they provide and fulfill both the economic and environmental aspects of the three pillars.
2. Materials and Methods
2.1. Governing Equations
2.1.1. Experimental Testing
To determine the efficiency of the runner in operation, the power provided by the inlet flow and power out generated by the turbine needed to be calculated.
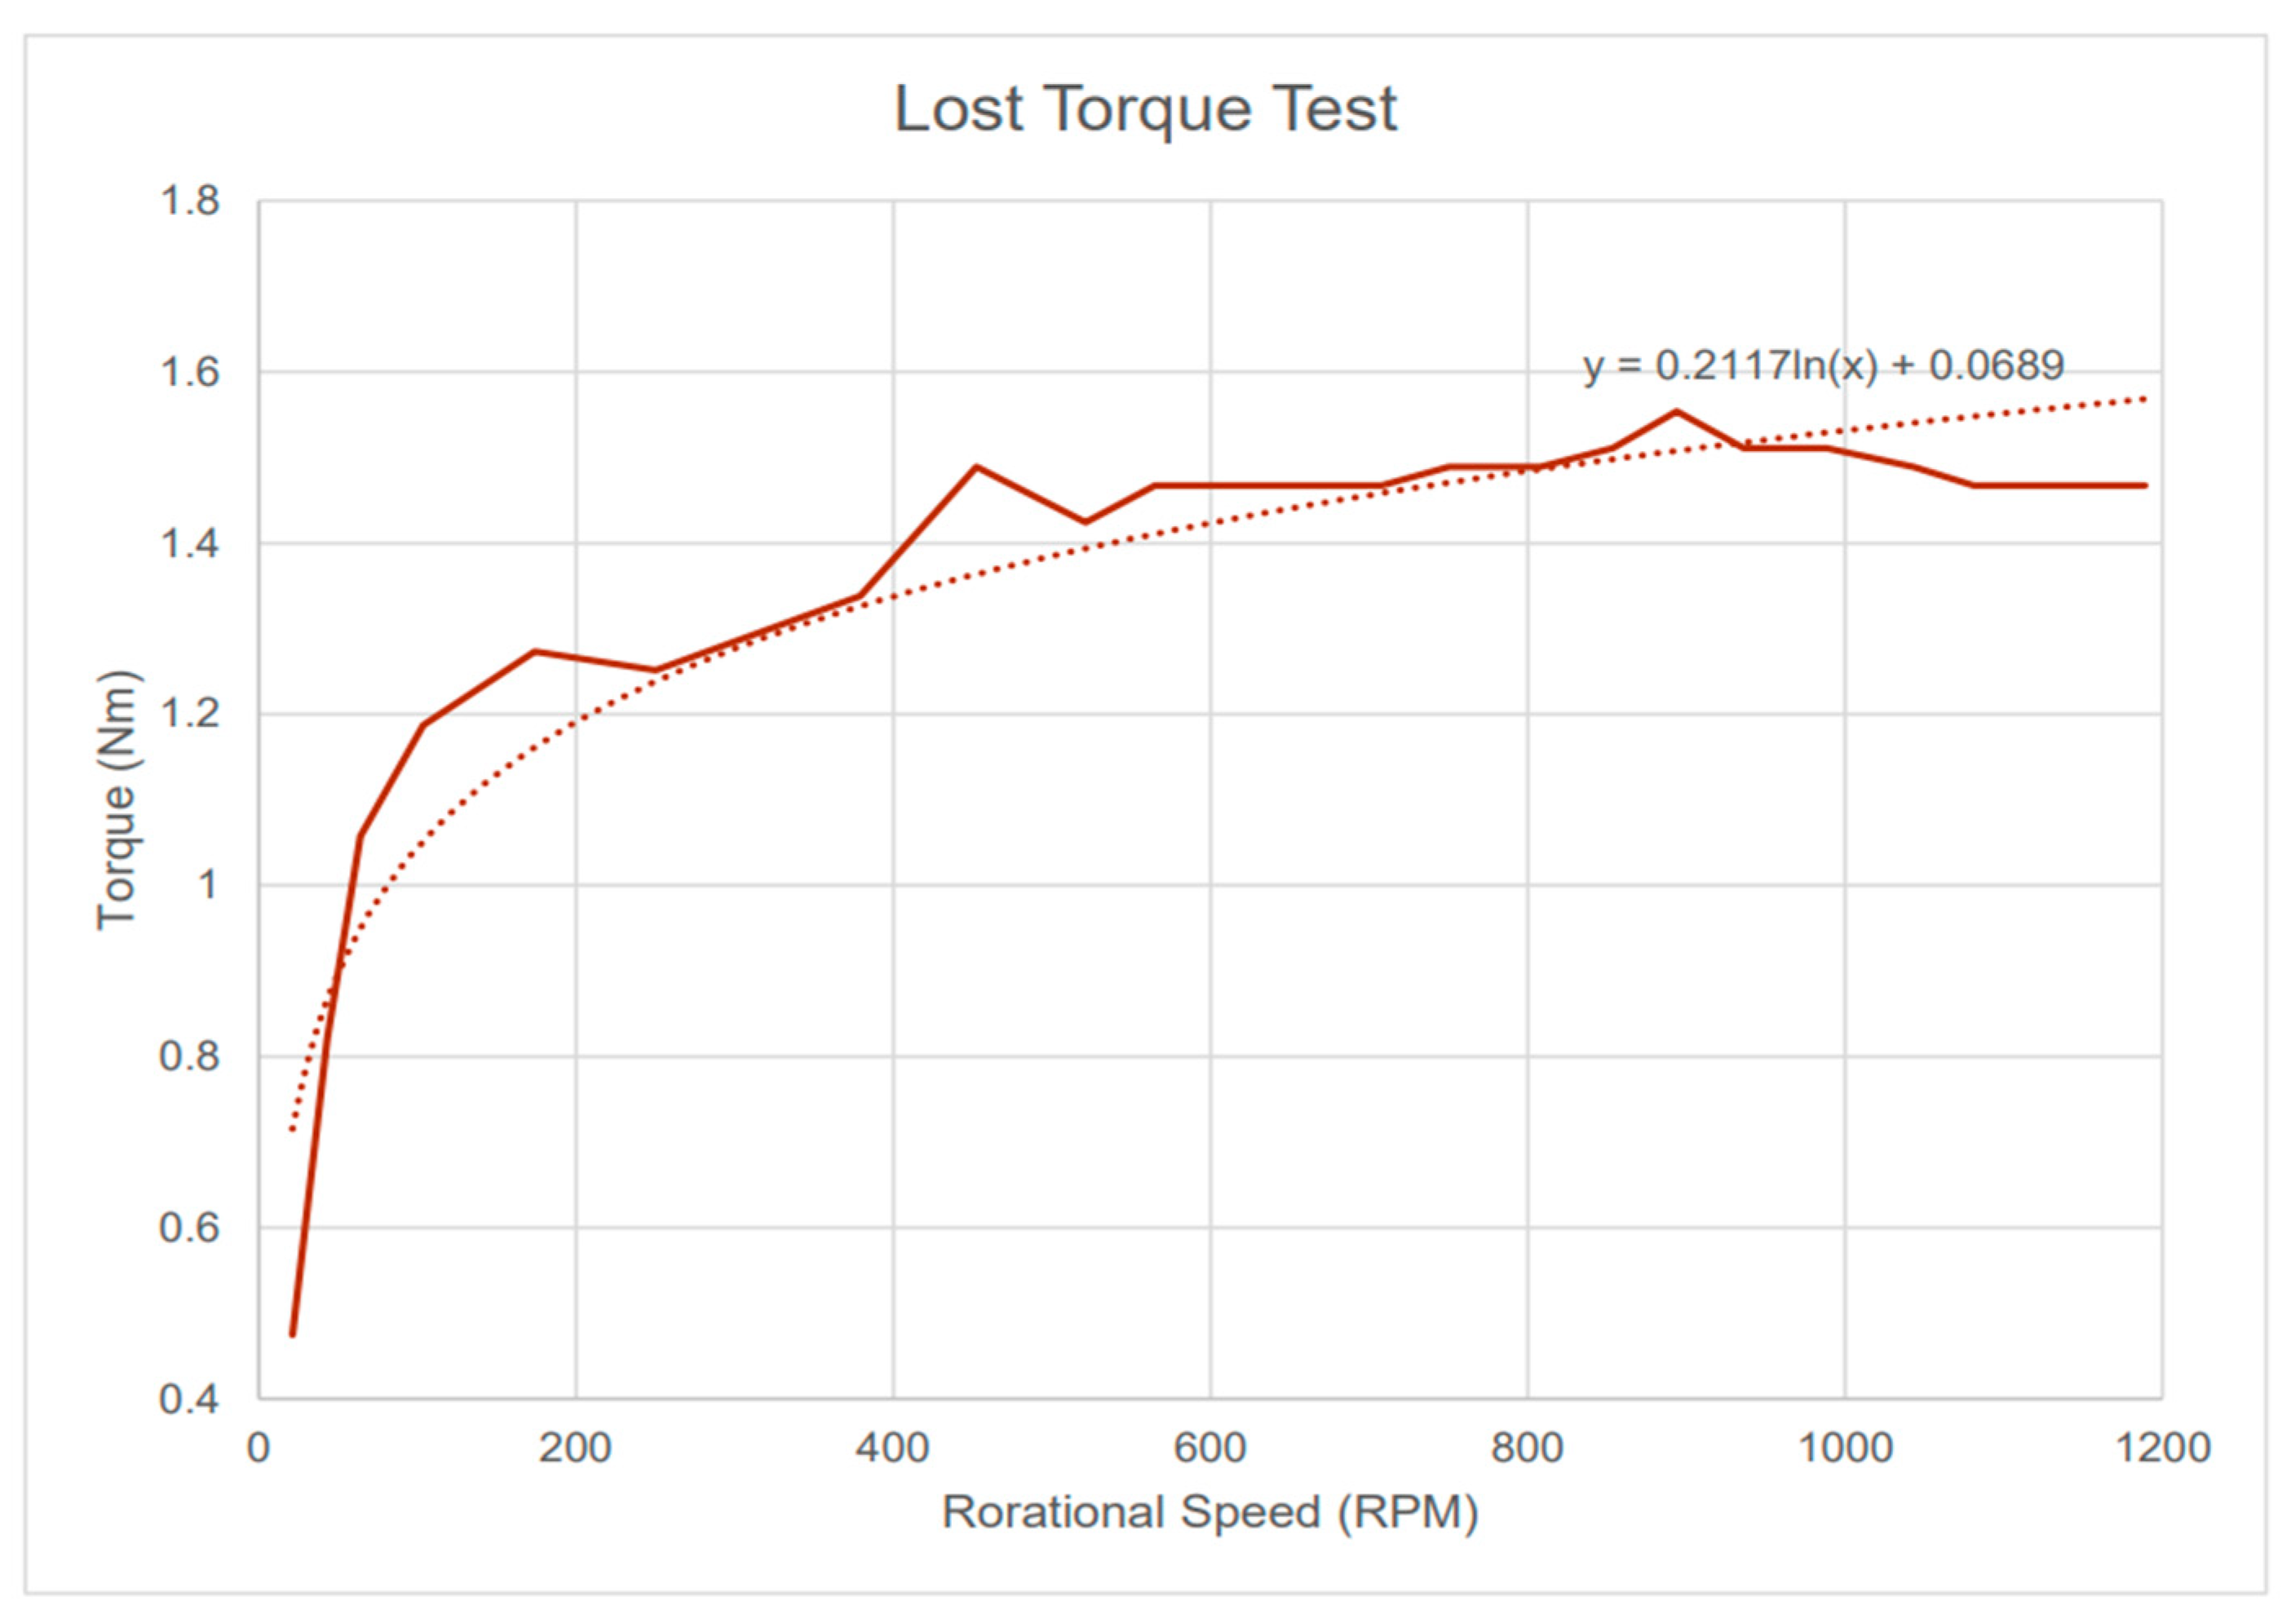
Power in was determined through the available head of the water impacting the turbine buckets along with the number of jets used and the inlet diameter of said inlets: . As the testing rig was fed by a pump for which only a pressure reading was available, an equivalency was used to calculate the available head: . This head measurement was used again to calculate the flow rate: . Power out is determined by the product of torque and angular frequency of the turbine being tested: .
The
value referenced here is the final torque value comprised of the torque calculated from the loadcell reading as well as accounting for the ‘lost torque’ due to the friction inherent within the system. This ‘lost torque’ function was calculated experimentally and then applied to every torque reading in the following tests. If the turbine was at a free-spinning state, with no brake applied, there, theoretically, would not be any forces resisting this motion to generate any torque at the brake to be measured. Therefore, the torque was measured and plotted against the rotational speed of the turbine (as seen in
Figure 4) to generate a function of what torque is being used to overcome the friction (shown by dotted line).
Therefore, the final torque of each turbine being tested is as follows:
where
is the measured torque using the loadcell and
is the measured RPM of the turbine at the testing speed.
For testing the turbines, a two-way approach was undertaken to acquire a full set of results to create a hill chart. To test, either the rotational speed or flow rate was set as constant. This allowed for a grid to be created systematically, aiding in the search for peak efficiency. The grid pattern of searching highlighted where the peak of efficiency was most likely to be and therefore allowed for subsequent tests to be more refined in mapping out that peak.
The fixed rotational speed tests were conducted as follows:
Safely prepare the testing rig.
Select a target testing RPM.
With the brake disengaged, increase the pump flow rate to achieve the selected RPM.
Record the nozzle pressure.
Set loadcell to zero.
Record five measurements from the load cell.
Increase the pump flow rate to reach the first flow rate and record the nozzle pressure.
Set loadcell to zero.
Engage the brake and increase the voltage until the target RPM is achieved.
Record five measurements from the load cell.
Increase pump voltage until the next target flow rate is achieved and record the nozzle pressure.
Repeat steps 9–11 until a full set of results is acquired.
Safely turn the testing rig off and clear the workspace.
The fixed flowrate tests were conducted as follows:
Safely prepare the testing rig.
Select a target pressure.
With the brake disengaged, increase the pump flow rate until the target pressure is achieved and equate this to an equivalent head.
Zero the loadcell
Engage the brake and increase the voltage until the target RPM is achieved.
Record five measurements of RPM and five measurements from the load cell.
Adjust the voltage to the brake until the next target RPM is achieved.
Repeat steps 6–7 until a full set of results is acquired.
Safely turn the testing rig off and clear the workspace.
2.1.2. Computational Equations
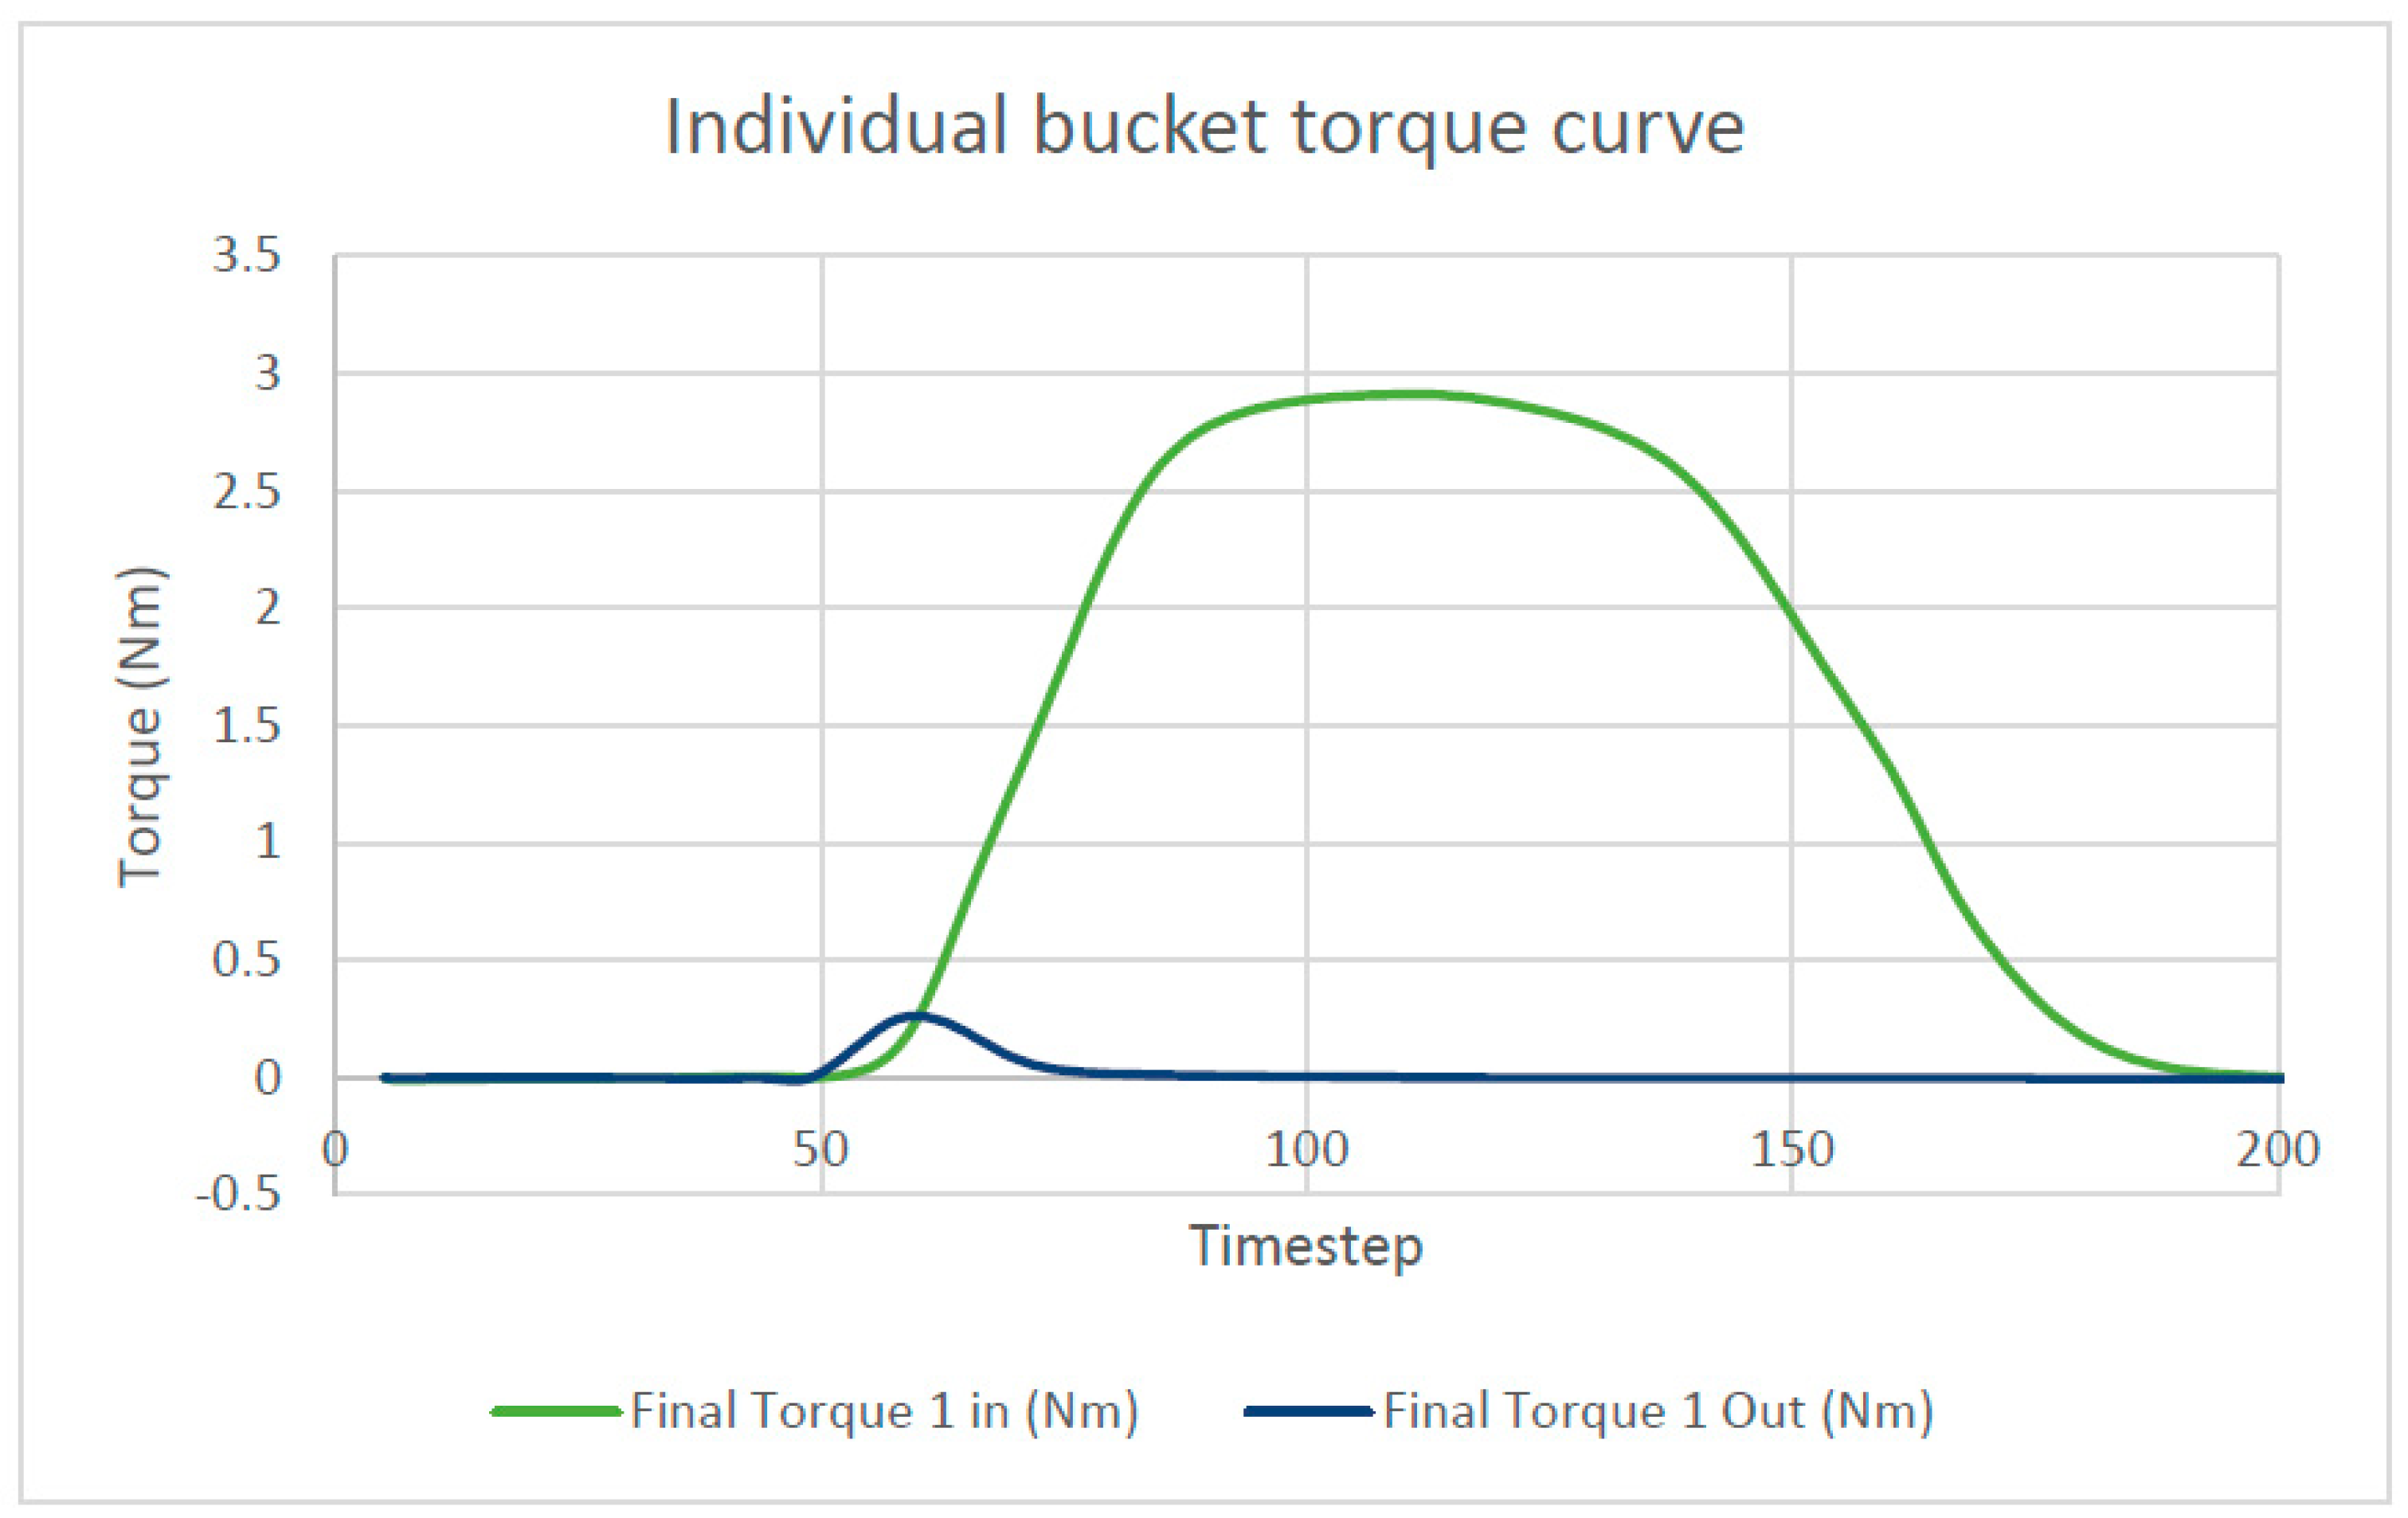
The way in which computational efficiency is calculated differs slightly from the calculations for experimental efficiency outlined above. To calculate the computational efficiency, a torque curve was plotted for an individual bucket across a full rotation. The work done by each bucket was determined by calculating the area under the torque curve via the trapezium rule. The power out can be calculated from the work done per bucket, the time taken for one full rotation, and the number of buckets that are on the runner: .
The power in is calculated from the inlet flow velocity, which is derived from the hydraulic head and acceleration due to gravity through . Using the calculated flow velocity and the mass flow rate, the power in can be determined with . Hence, the overall turbine efficiency can be calculated: .
2.2. Computational Modeling
Computational modeling is now at a suitable level to aid in the development of hydro turbines [
20]. Using CFD, any design changes can be made quickly and at a much lower cost in comparison to prototyping and practical testing methods [
21,
22] To accurately model the turbine design, a homogenous multiphase and k-ω SST turbulence model was set up in ANSYS CFX 2020 R1 software. The turbulence models considered were the k-ω SST and k-ε models; based on the literature, it was decided that the latter would be more suitable due to its ability to better solve flows around the near wall regions [
23].
The homogenous multiphase consists of a water jet travelling through an air domain; the walls of the model have a no slip boundary condition and no mixing of fluids occurs. The choice of this specific software was due to it being widely regarded as the most effective way to determine turbine efficiency [
17].
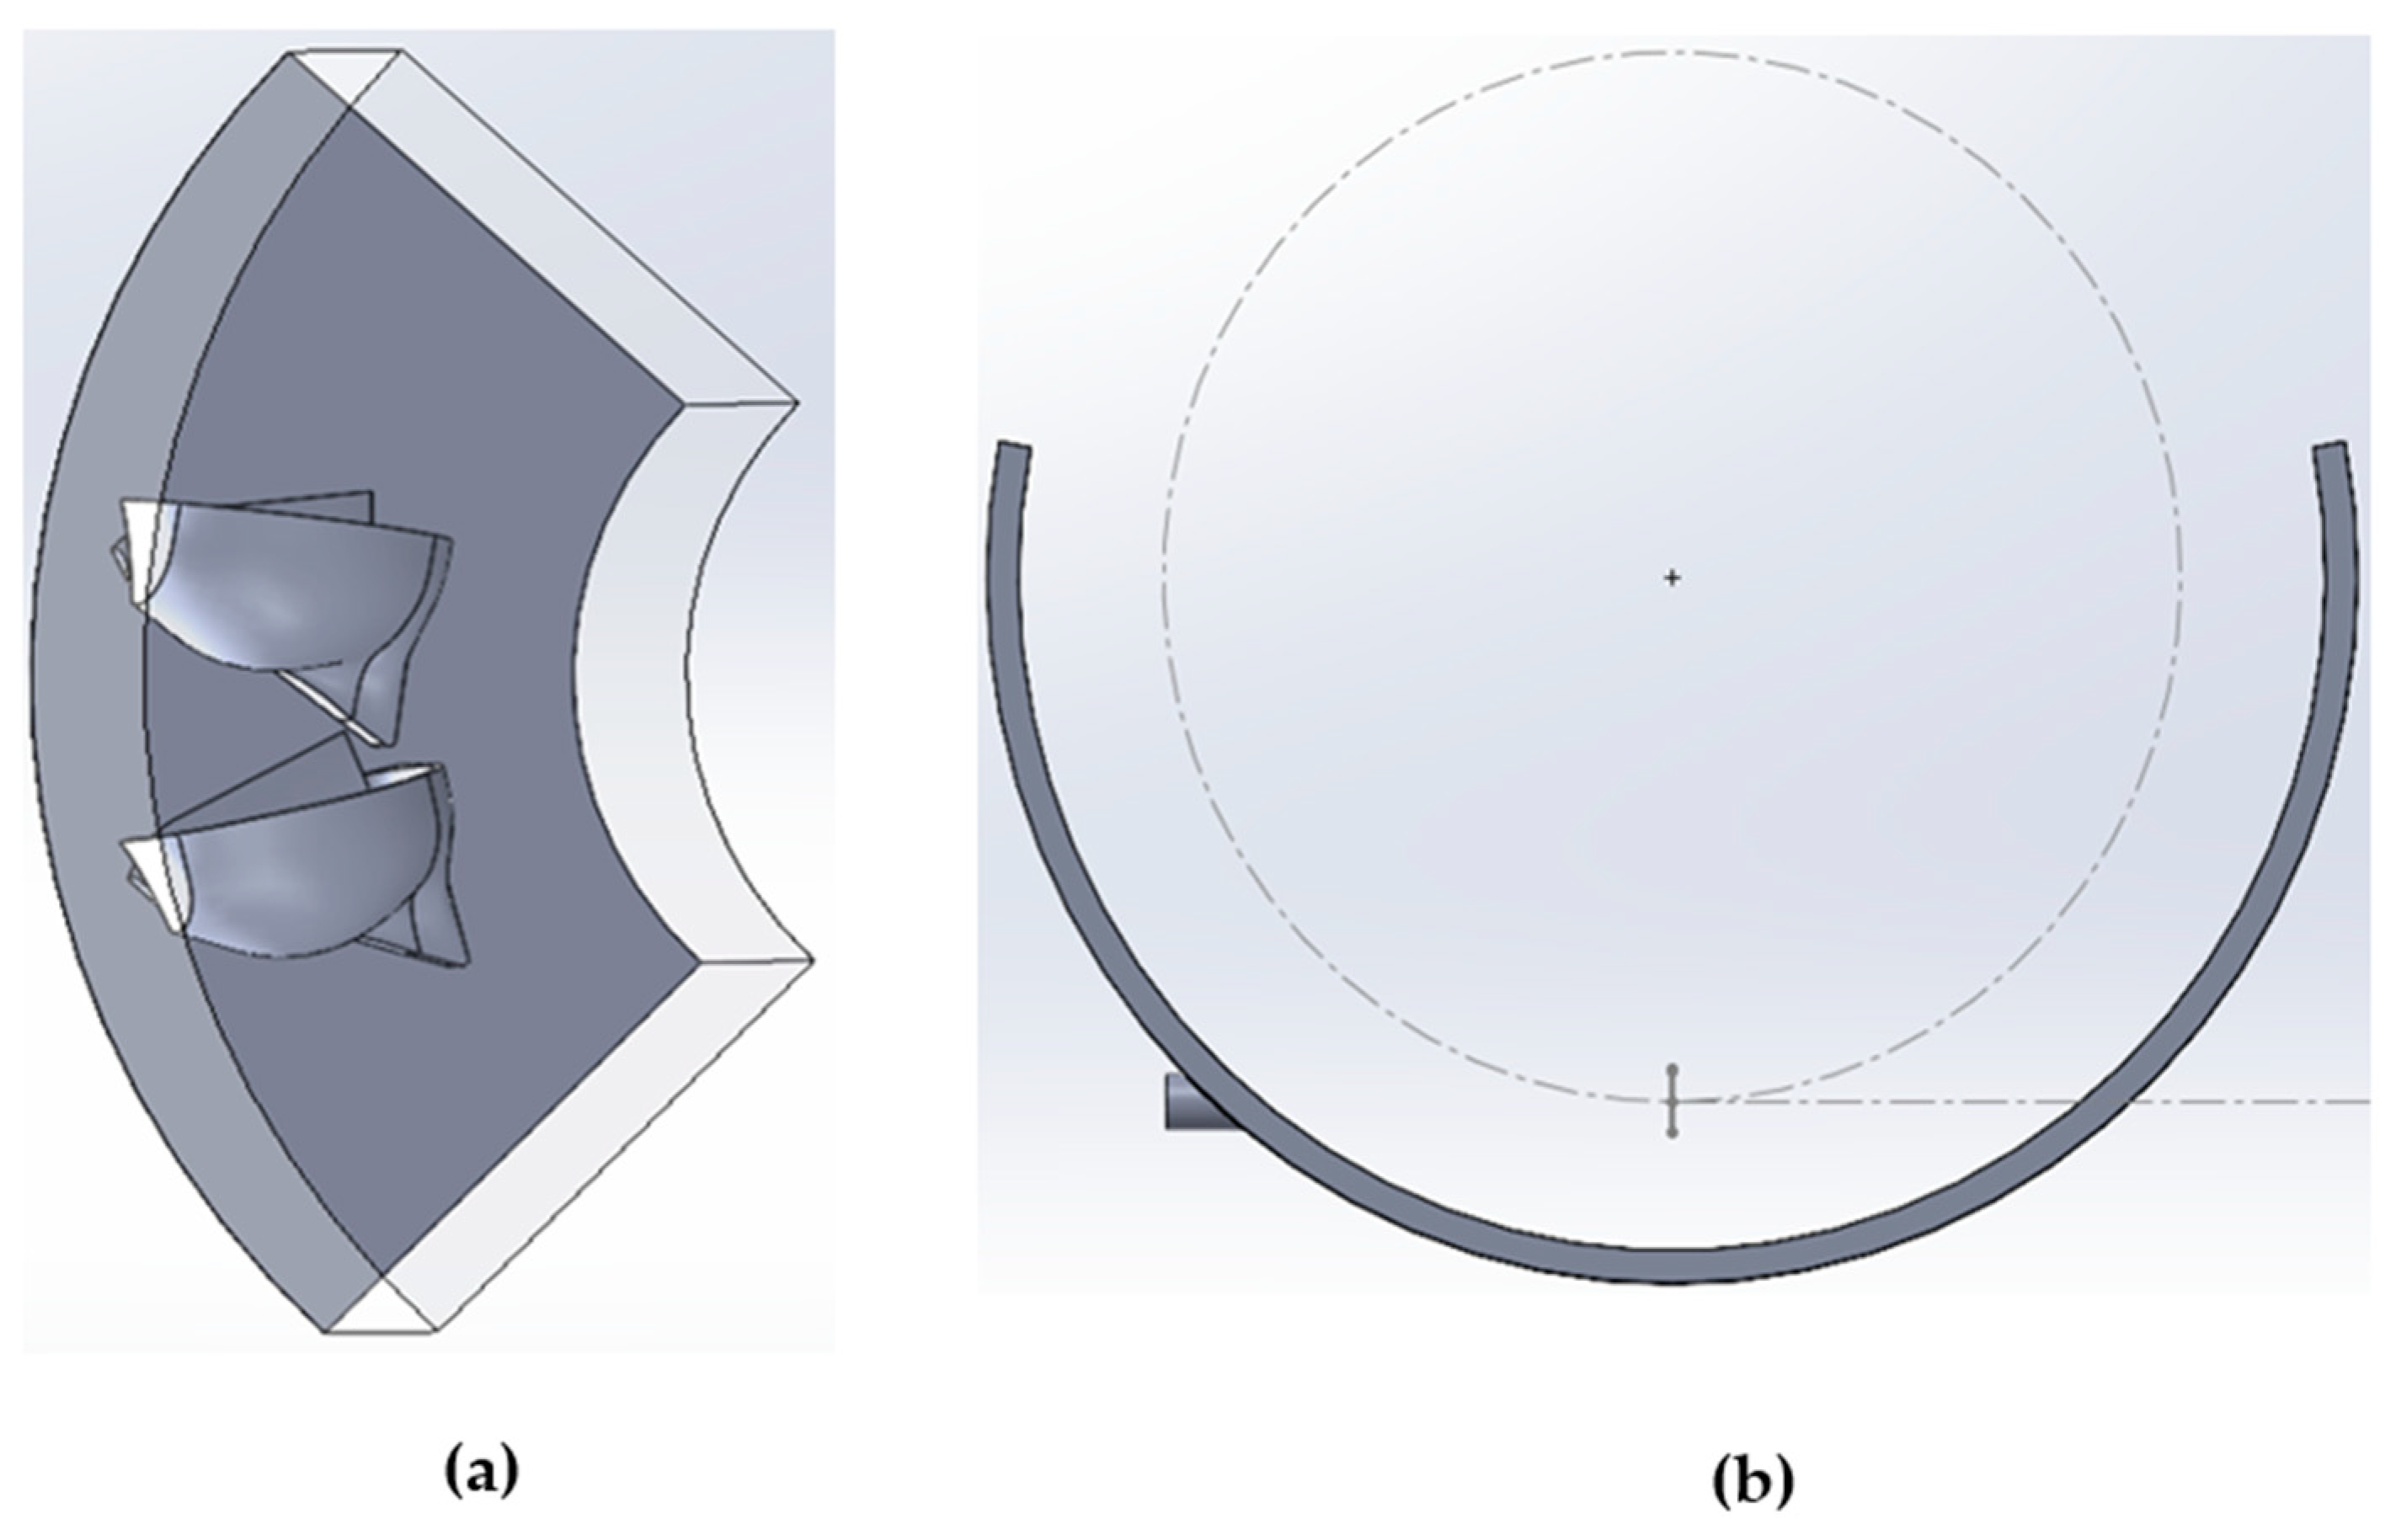
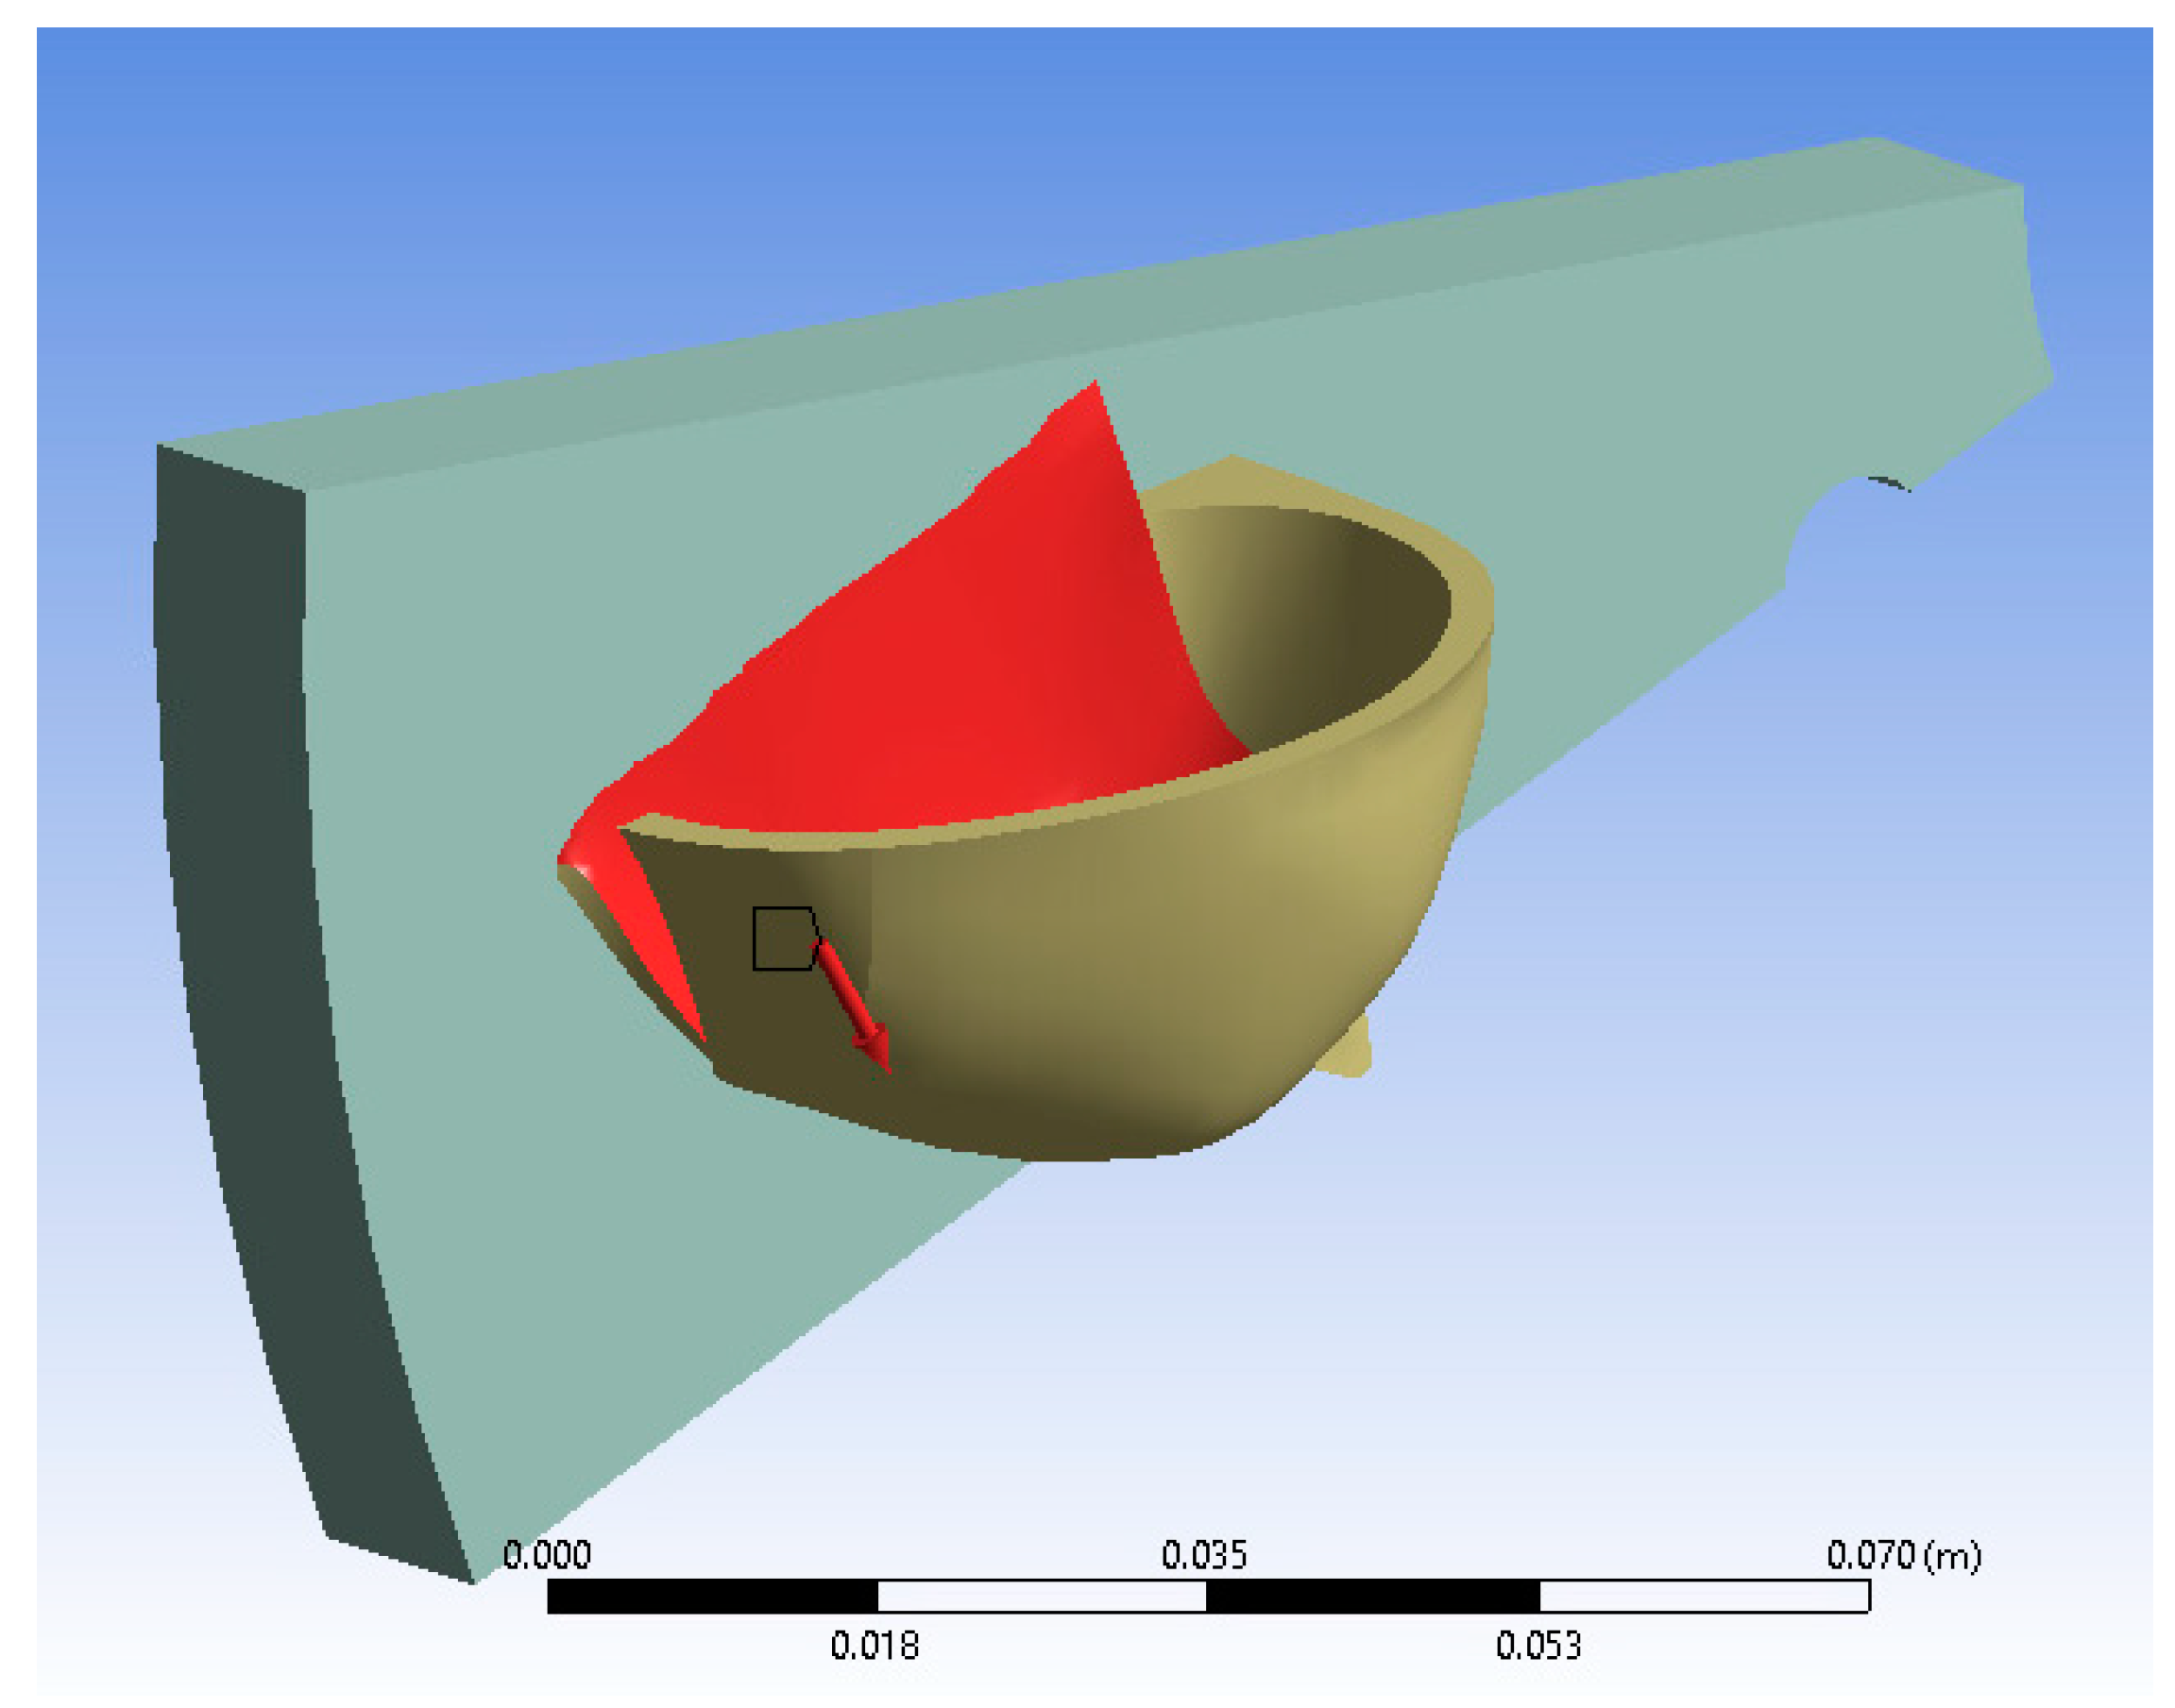
A model was created and imported into the Ansys CFX 2020 R1 software to computationally model the turbine. The model was created using SOLIDWORKS 2022 software where all the optimization changes took place. To be able to model the turbine through a period of rotation, the use of two domains had to be implemented. A turbine housing rotating (R) domain and a single jet stationary (S) domain were created, as shown in
Figure 5. The dotted line in
Figure 5b shows the intersection between the centre of the water jet and the turbine pitch circle.
When inserting the two domains into Ansys CFX, named selections were created separating the two domains into their respective areas allowing for the following boundary conditions to be applied (
Table 1). The inlet flow was set to 19.81 m/s to mirror the 20 m available hydraulic head which was most commonly used during any preliminary practical testing undertaken.
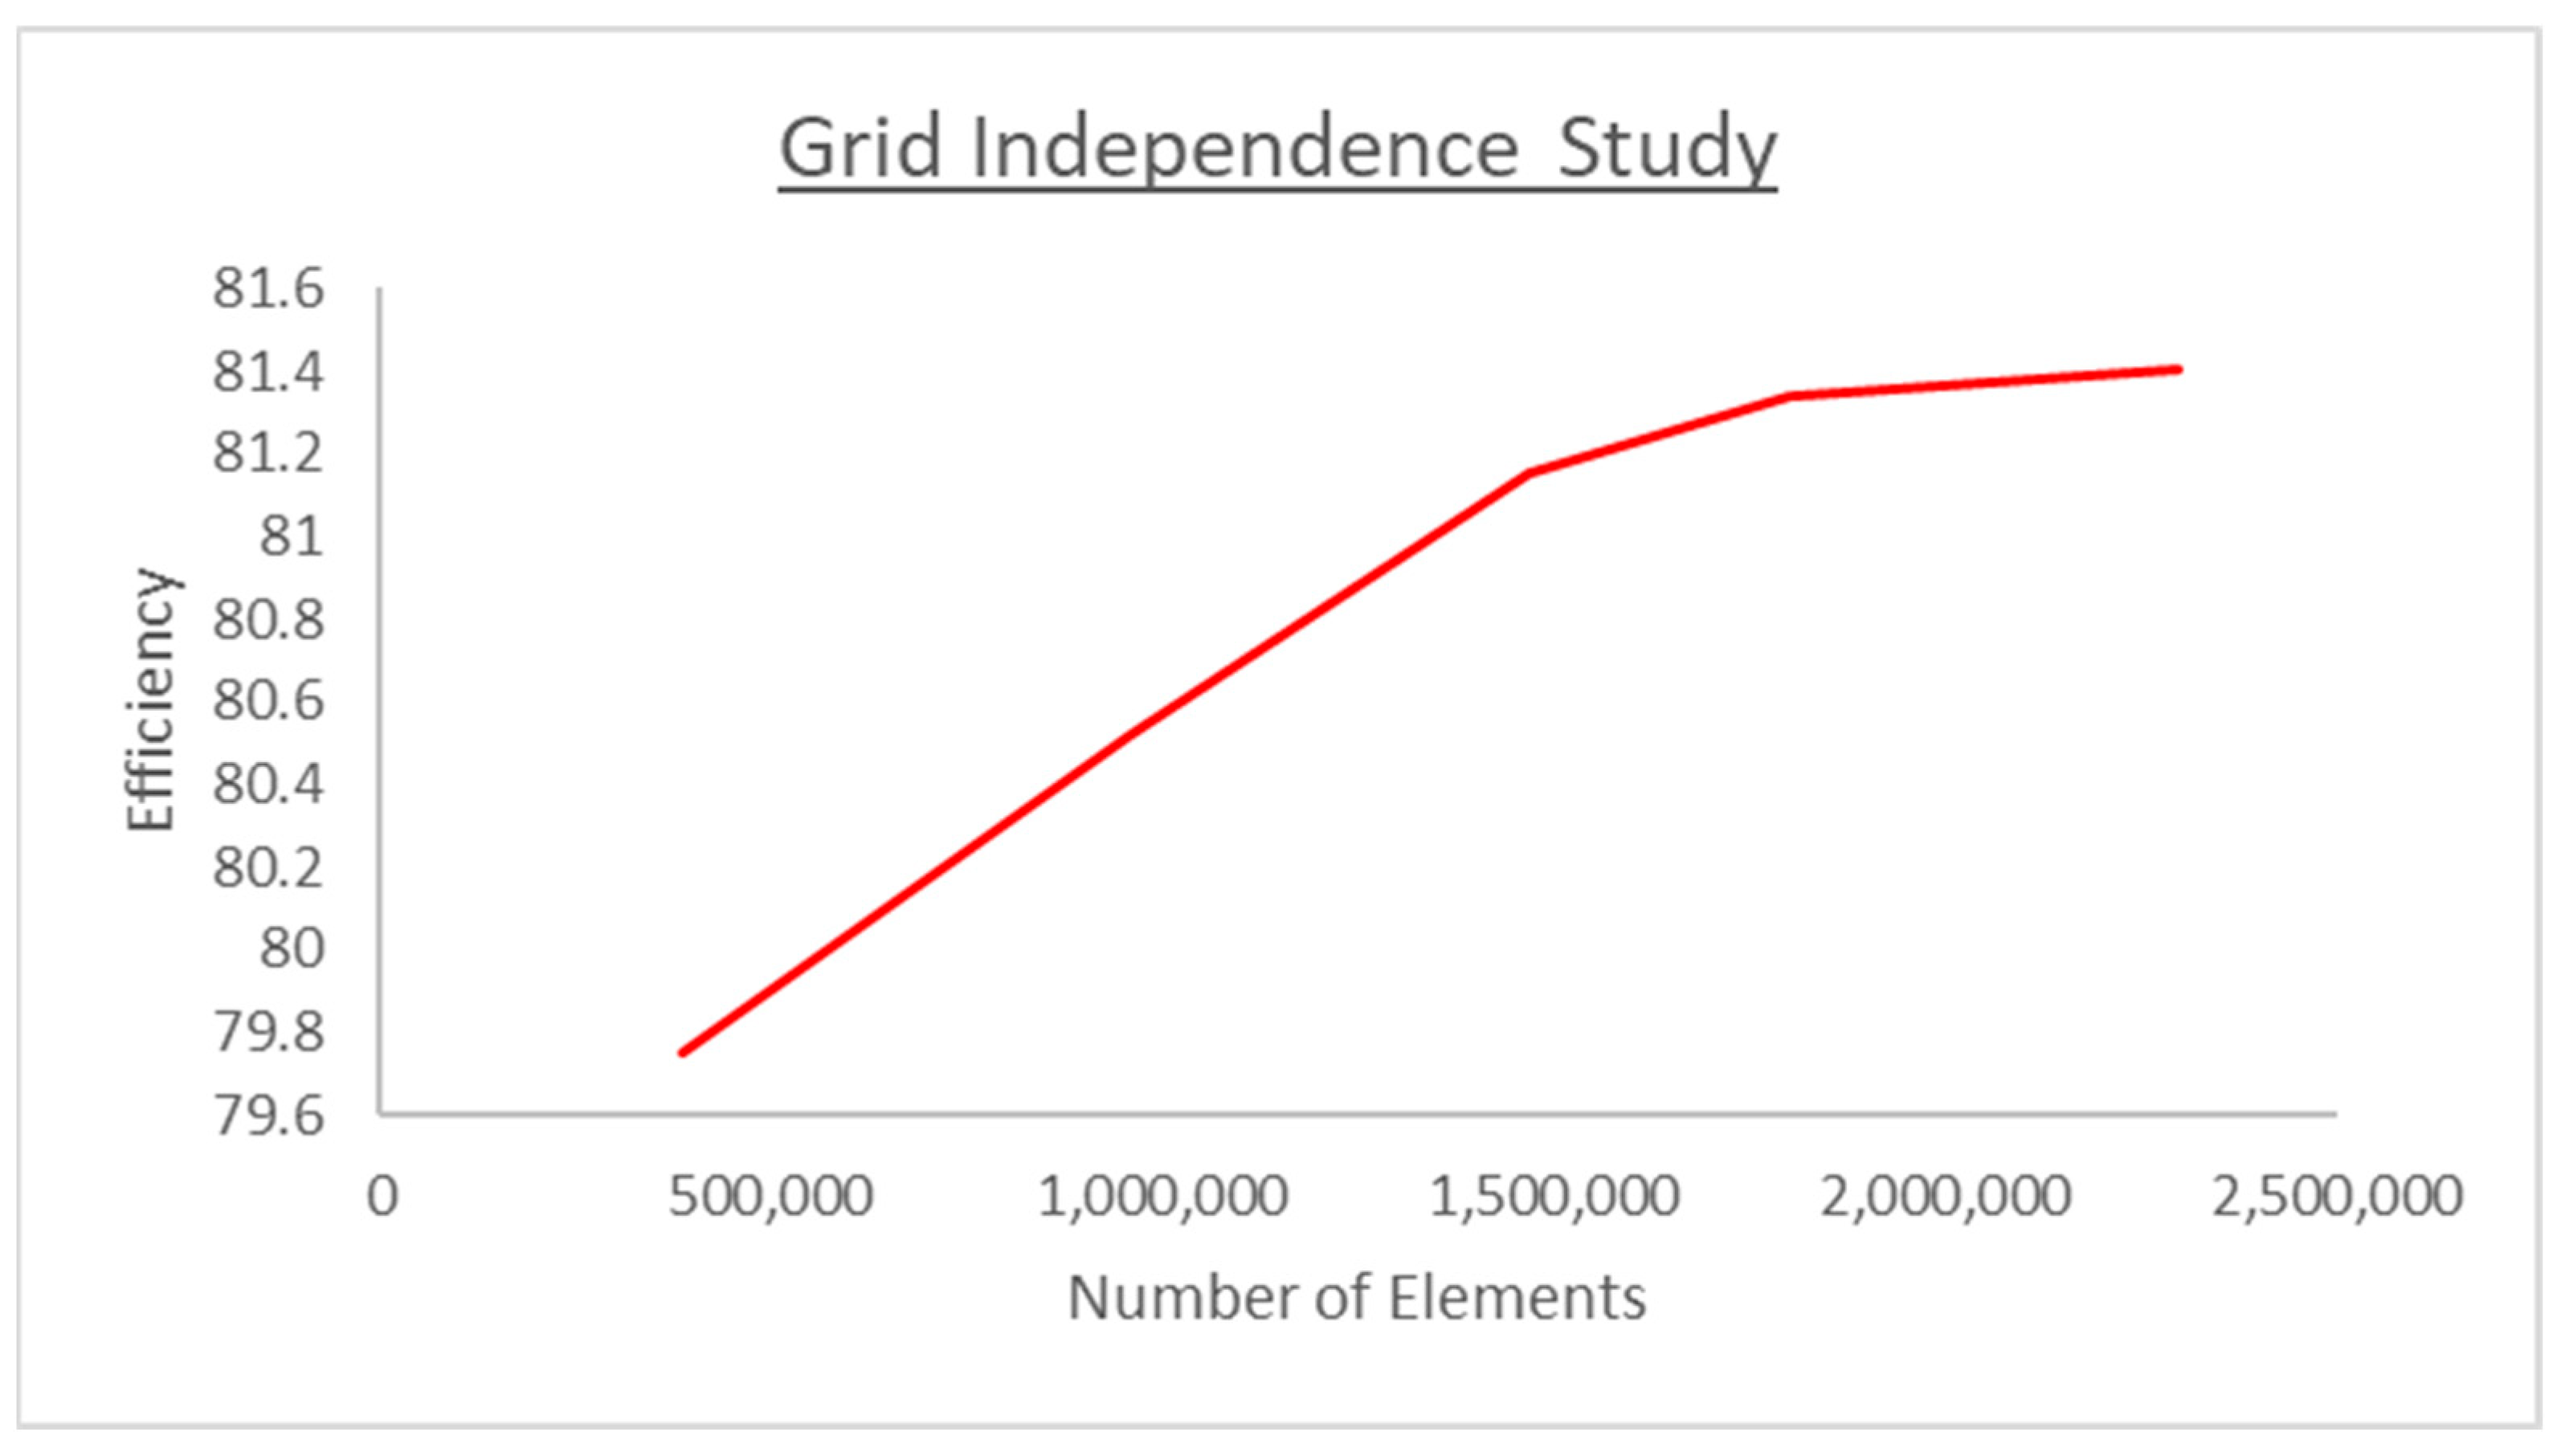
Grid Independence Analysis
A grid independence analysis is used to determine whether the results gathered are independent of the quality of the mesh. When meshing, there has to be a fine balance between the computational cost of simulations and the accuracy of the results. Therefore, finding the minimum number of elements at which the results do not change is key.
In order to complete a grid independence study, a number of meshes were created with the number of elements ranging from 385,000 to up to 2.3 million. By comparing the efficiency of the turbine at different mesh densities, a plot could be made showing the importance of mesh refinement; this is shown in
Figure 6.
Figure 6 illustrates that a grid with an element number above 1,750,000 can be deemed satisfactory with the results being independent of the grid detail.
2.3. Finite Element Analysis
When testing the novel turbine design to obtain experimental results, the buckets mounted to the backplate will experience a range of forces as the water jet strikes them. In this study, 3D-printed Polyamide 12 (Nylon-12) buckets were to be used. In order to predict whether the manufactured buckets would resist the impact of the water pressure, a Finite Element Analysis (FEA) simulation was undertaken. This FEA Simulation was conducted using Ansys Static Structural and aimed to gather stress, strain, and deformation data from a turbine undergoing a ‘worst case’ scenario. For this analysis, it was determined that the ‘worst case’ scenario would involve the turbine operating in a fixed stationary position, while a predetermined water pressure would strike a bucket and exerting a known force.
The setup involved applying symmetric constraints, meaning only a section of the turbine which included one bucket had to be modeled. This reduced the model size, resulting in reduced simulation time and computation costs. The shaft of the turbine was not included in the design as it can be modeled as a fixed boundary support condition in ANSYS Mechanical.
Two main boundary conditions were applied to the model; these included fixed supports to mimic a stationary turbine and a force which represented the pressure of the water applied to the bucket.
Figure 7 illustrates the setup of the FEA simulation.
It was deemed the purpose of this analysis was to determine whether a turbine bucket could survive the initial impact of the water jet at a high pressure within a factor of safety of roughly three. If it did, then it was acceptable for the buckets to be manufactured. One advantage of 3D printing the turbine buckets is that it is highly cost effective to produce when compared to other components in the hydro turbine industry. This meant that if the turbine buckets were damaged during the experiments, then it would not be detrimental to the cost of this project.
This process would be the way in which the analysis of this FEA study was validated. As there were experimental data gathered using Nylon-12 buckets in this study, it meant that the FEA results could be ‘self’ validated. If the turbine buckets were damaged during testing, the areas and severity of damage could be compared to the data acquired from this FEA study.
The entire FEA procedure is in line with the three pillars of sustainability, as a fully verified and validated FEA simulation means that the environmental and economic aspects of the sustainability pillars are considered. By ensuring that the manufactured buckets are resistant to the applied forces of the experimental testing, fewer buckets will deform or fracture—resulting in a reduction in the number of buckets that need to be manufactured. Less materials used benefits the environment by way of a reduction in carbon usage. The economic strain on purchasing more materials is also reduced, as the demand is lower.
2.4. Experimental Procedure
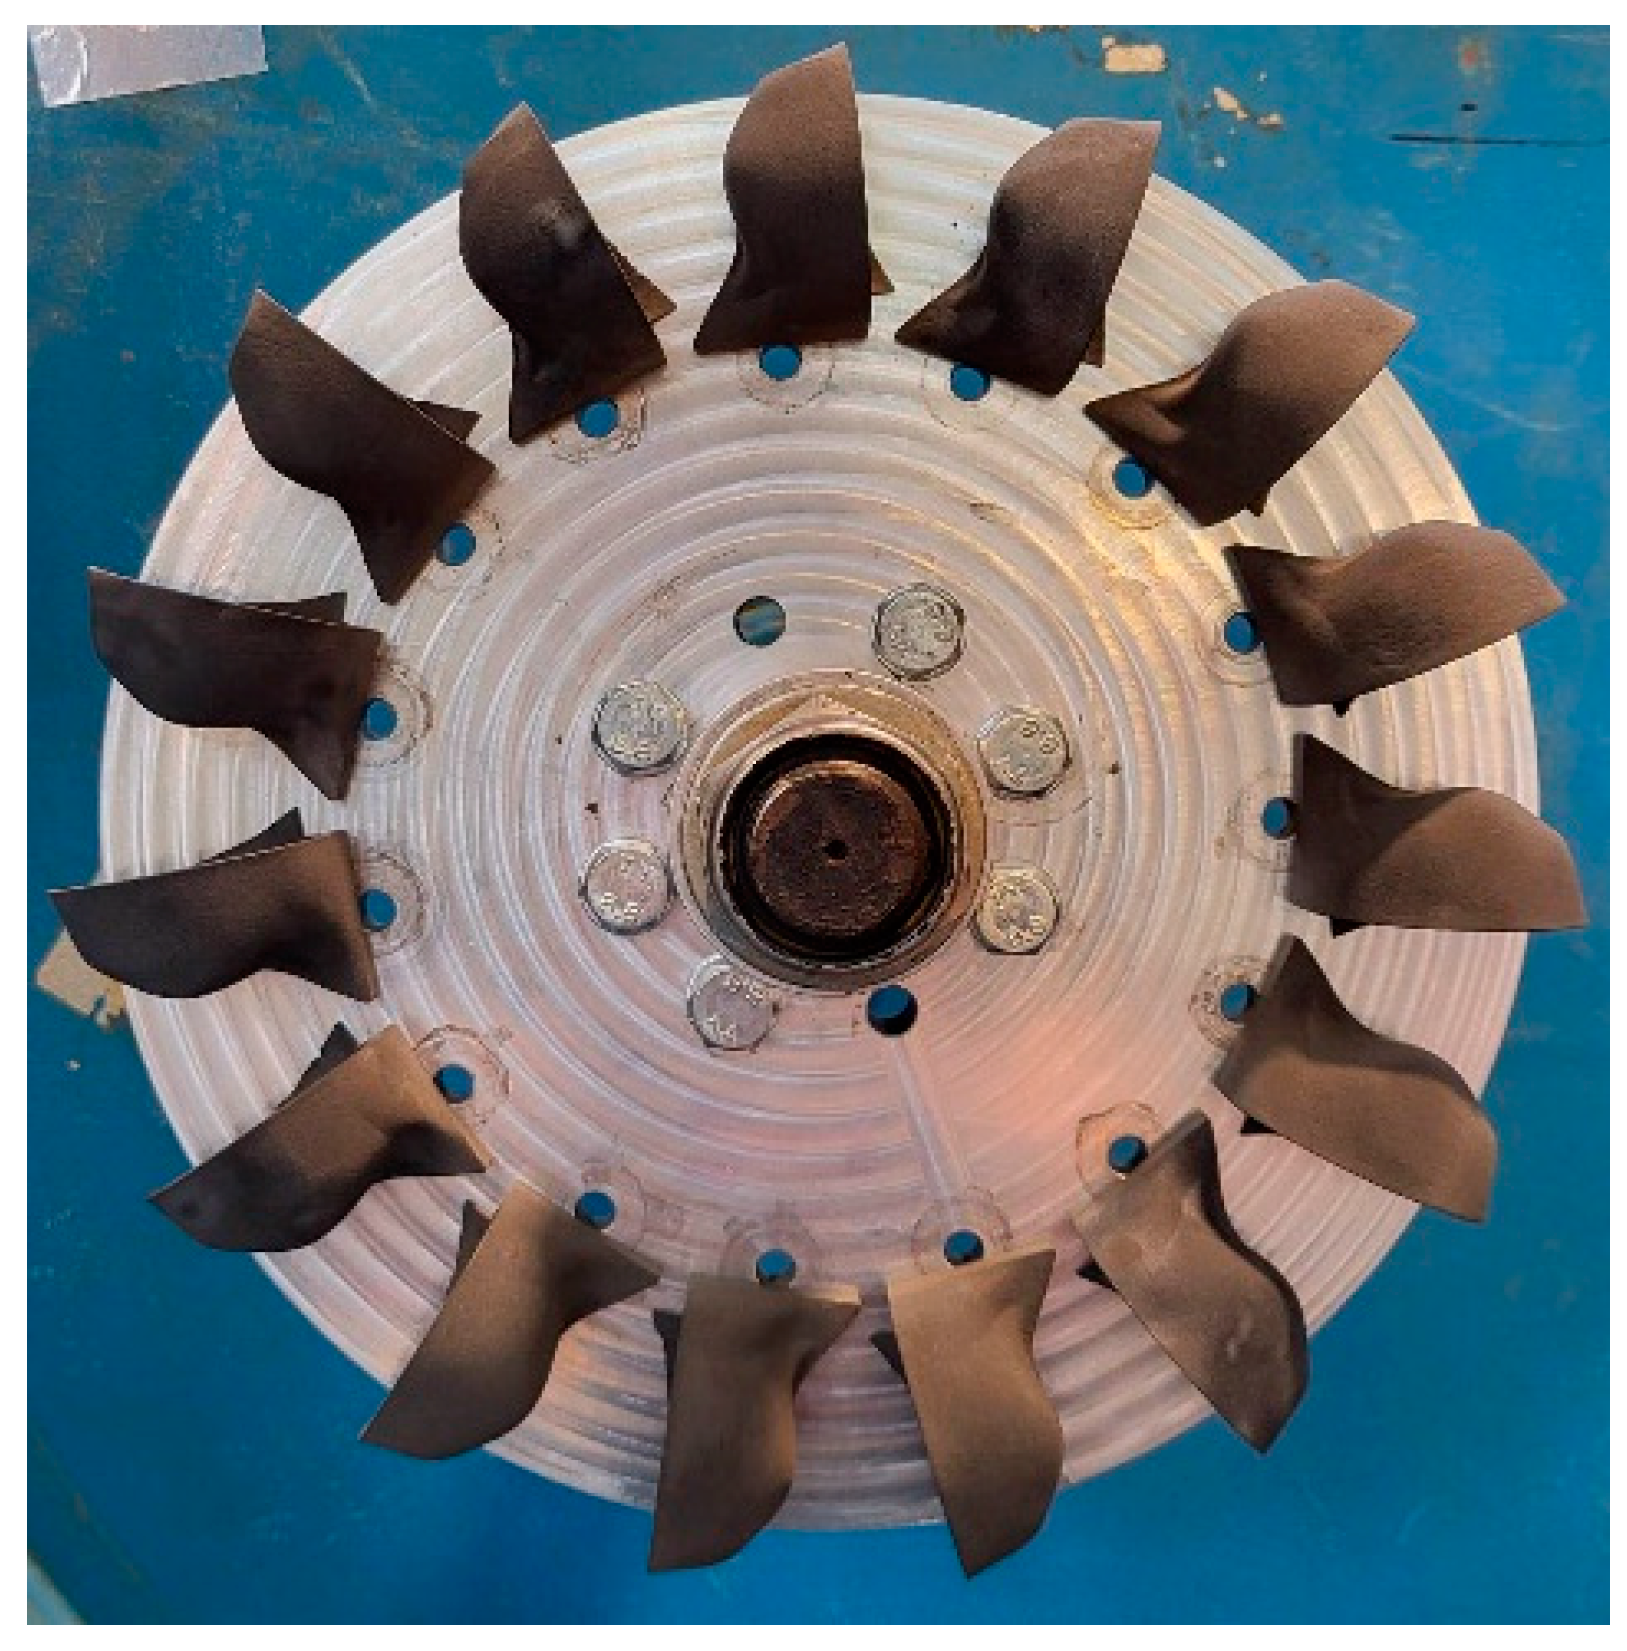
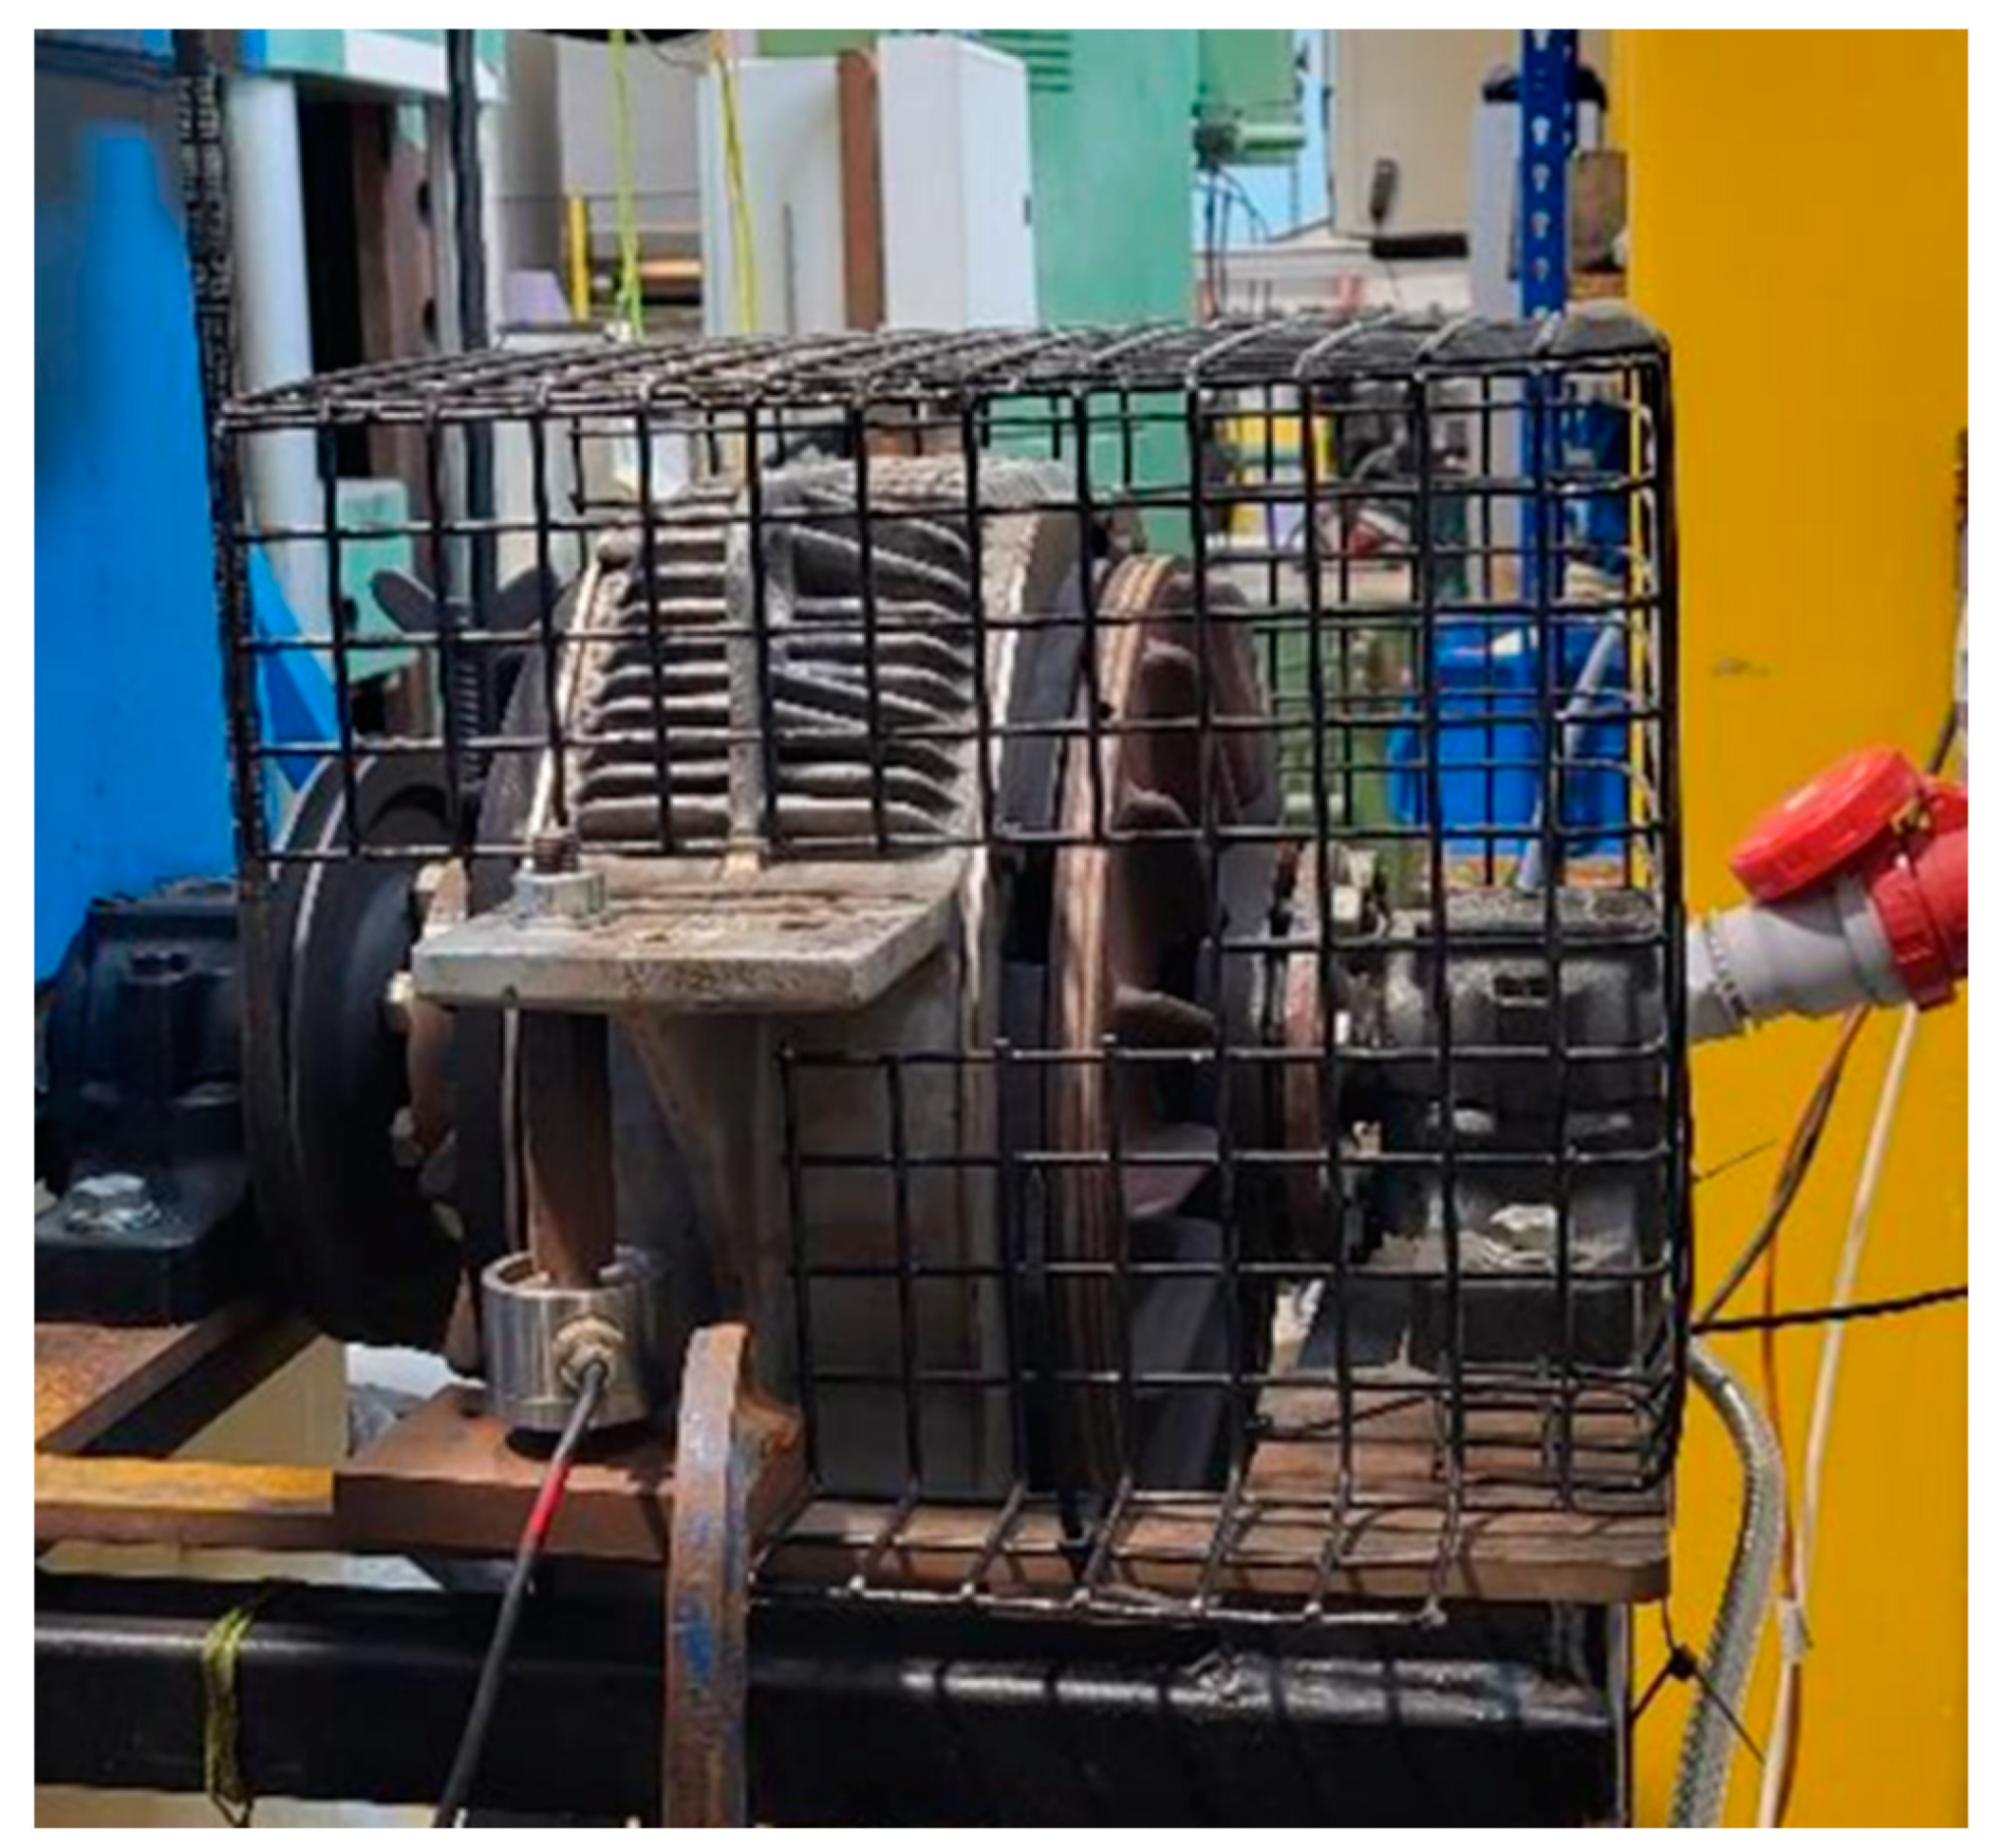
All practical testing took place in the in situ testing rig available in the Lancaster University Engineering building which was specifically designed to test Pelton turbines. As power output is measured through the product of rotational speed and torque, the rig was designed in such a way that these properties are central to its use. The shaft upon which the turbines are mounted can be seen in the center of
Figure 8.
From
Figure 8, the two nozzles on the left are pointed so the jets impact the center of buckets mounted upon a backing plate with a 290 mm diameter. The nozzles are fed directly by a pump which has a variable flow rate that the user can measure using the pressure gauge on the pipes. At the back of the rig, a brake is fixed. This brake is mechanically coupled to the shaft via a driven belt which can be seen in the top left portion of
Figure 9.
The brake is controlled by the user with a power supply and a tachometer to achieve a specific rotational speed for testing. Underneath the brake, a load cell can be seen. This was used to measure the force exerted by the turbine, from which a torque could be calculated using the perpendicular distance to the center of the brake from the loadcell to determine the power and subsequently the efficiency of the tested turbine.
With this setup, a large range of testing conditions can be artificially created to find the highest point of efficiency for any Pelton turbine.
3. Results
3.1. Computational Results
Using CFD modeling, it was determined that this model’s peak efficiency is in the region of 82.9% at a working hydraulic head of 20 m and a rotational speed of 720 rpm.
Figure 10 shows each bucket’s torque output for a rotational period of 100°.
Subsequently,
Table 2 shows the components used when determining the turbine’s overall efficiency with the use of the equations mentioned previously in
Section 2.1.2.
Through the use of Ansys post-processing available through the Ansys CFX 2020 R1 software, an analysis of the flow patterns was used to determine the optimal points for improvement such as bucket depth and width.
Figure 11a,b help to visualize the flow pattern for this novel turbine design.
As displayed in
Figure 11a,b, the flow pattern is very comparable with that of a standard Pelton wheel which is achieved through positioning the nozzle as close to the plate section of the wheel as possible, so that the water flows from the inside to the outside of the bucket geometry.
3.2. Experimental Results
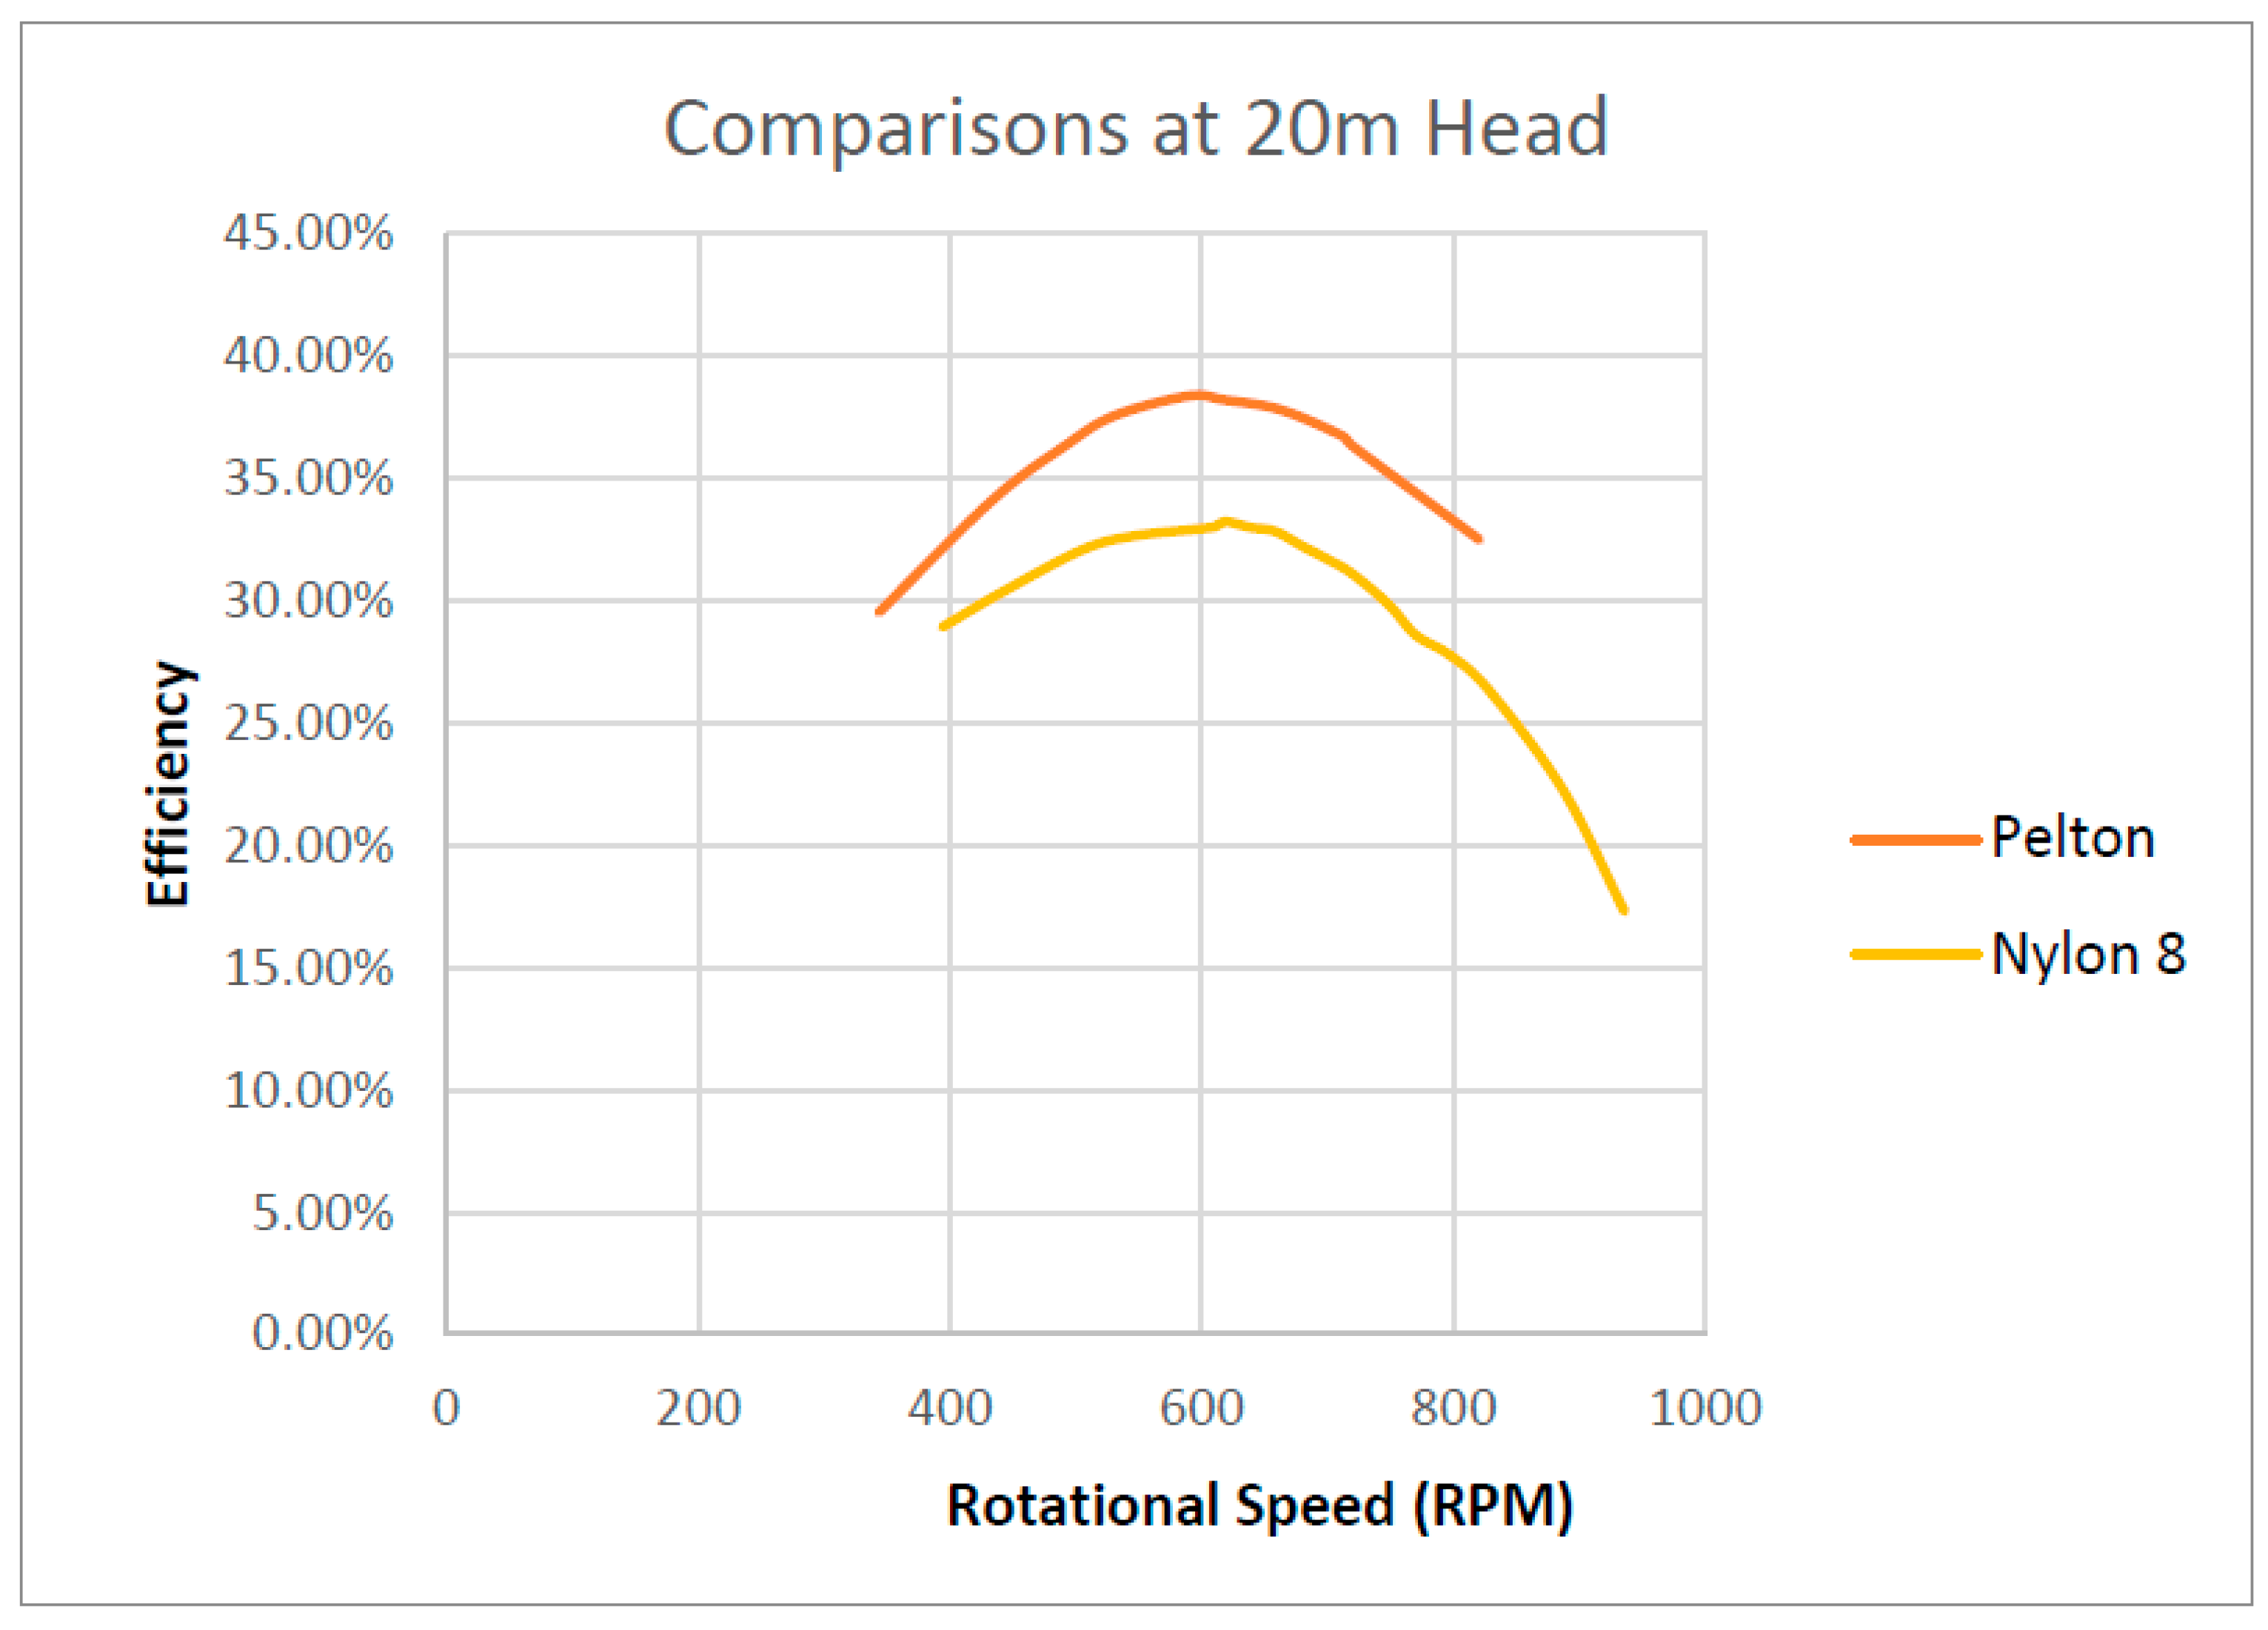
For comparison, experimental tests were performed in Lancaster University’s experimental testing rig. The best design that was created by the team was the eighth iteration of buckets. These buckets were 3D printed using selective laser sintering in Nylon-12. As this bucket design was the eighth and made from Nylon, it was named the Nylon-8.
Due to the limitations of both the testing rig and the Nylon-12 material, namely the multiple points of generated friction within the mechanical couplings of the testing rig and the flexing of the Nylon-12 that eliminates some of the torque of the turbine, the peak experimental efficiency at a hydraulic head of 20 m was 33.24%; however, due to the ease of changing the operating parameters in experimental testing compared to CFD, it was possible to obtain a range of results at varying heads of 20 m, 25 m, and 30 m. This is illustrated in
Figure 12.
However, in the University, there is a standard Pelton turbine that was produced from aluminum–bronze with a CFD efficiency of 84%. This allowed for a more direct comparison between the novel turbine and an industry-standard Pelton wheel. The Pelton wheel hit a peak testing efficiency of 38.39% at a 20 m head, as shown in
Figure 13.
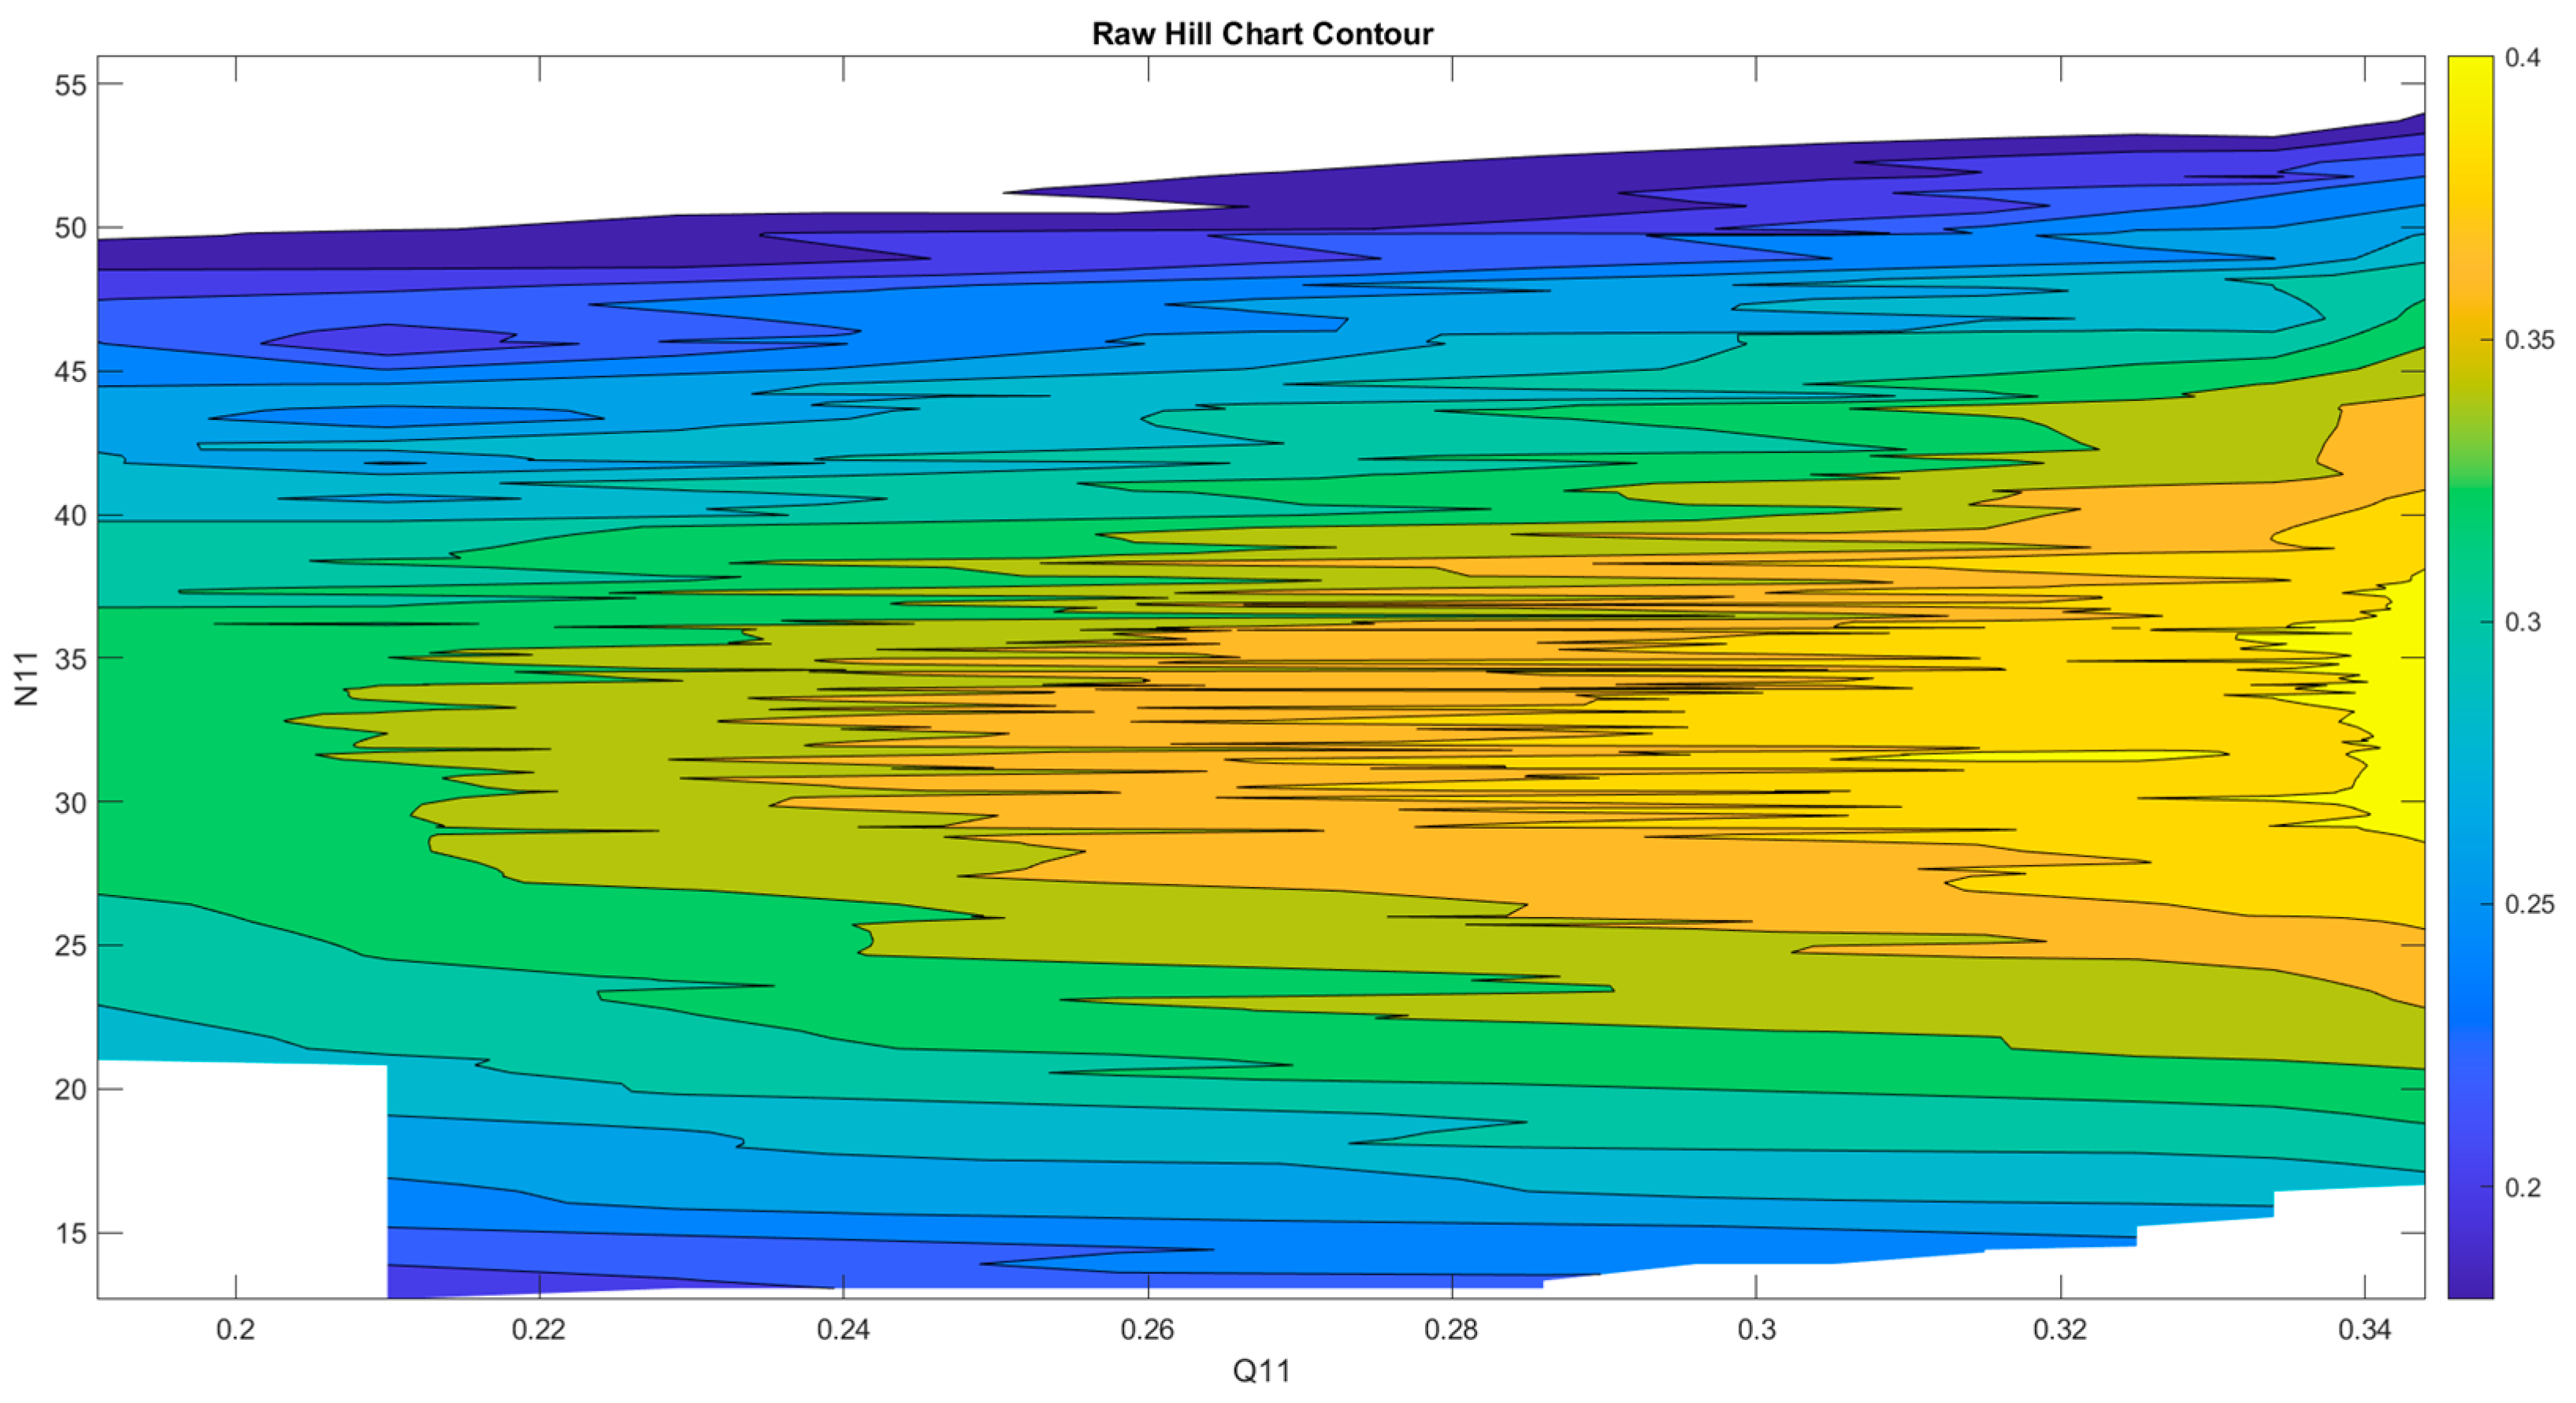
Furthermore, through experimental testing of the novel turbine design, a partial Hill chart could be produced (
Figure 14). This shows that, for this specific turbine size, the efficiency increased above a 20 m head, reaching above 40%; however, due to the limitations associated with the testing, a head beyond 30 m could not be safely achieved. Hence, a full hill chart could not be produced.
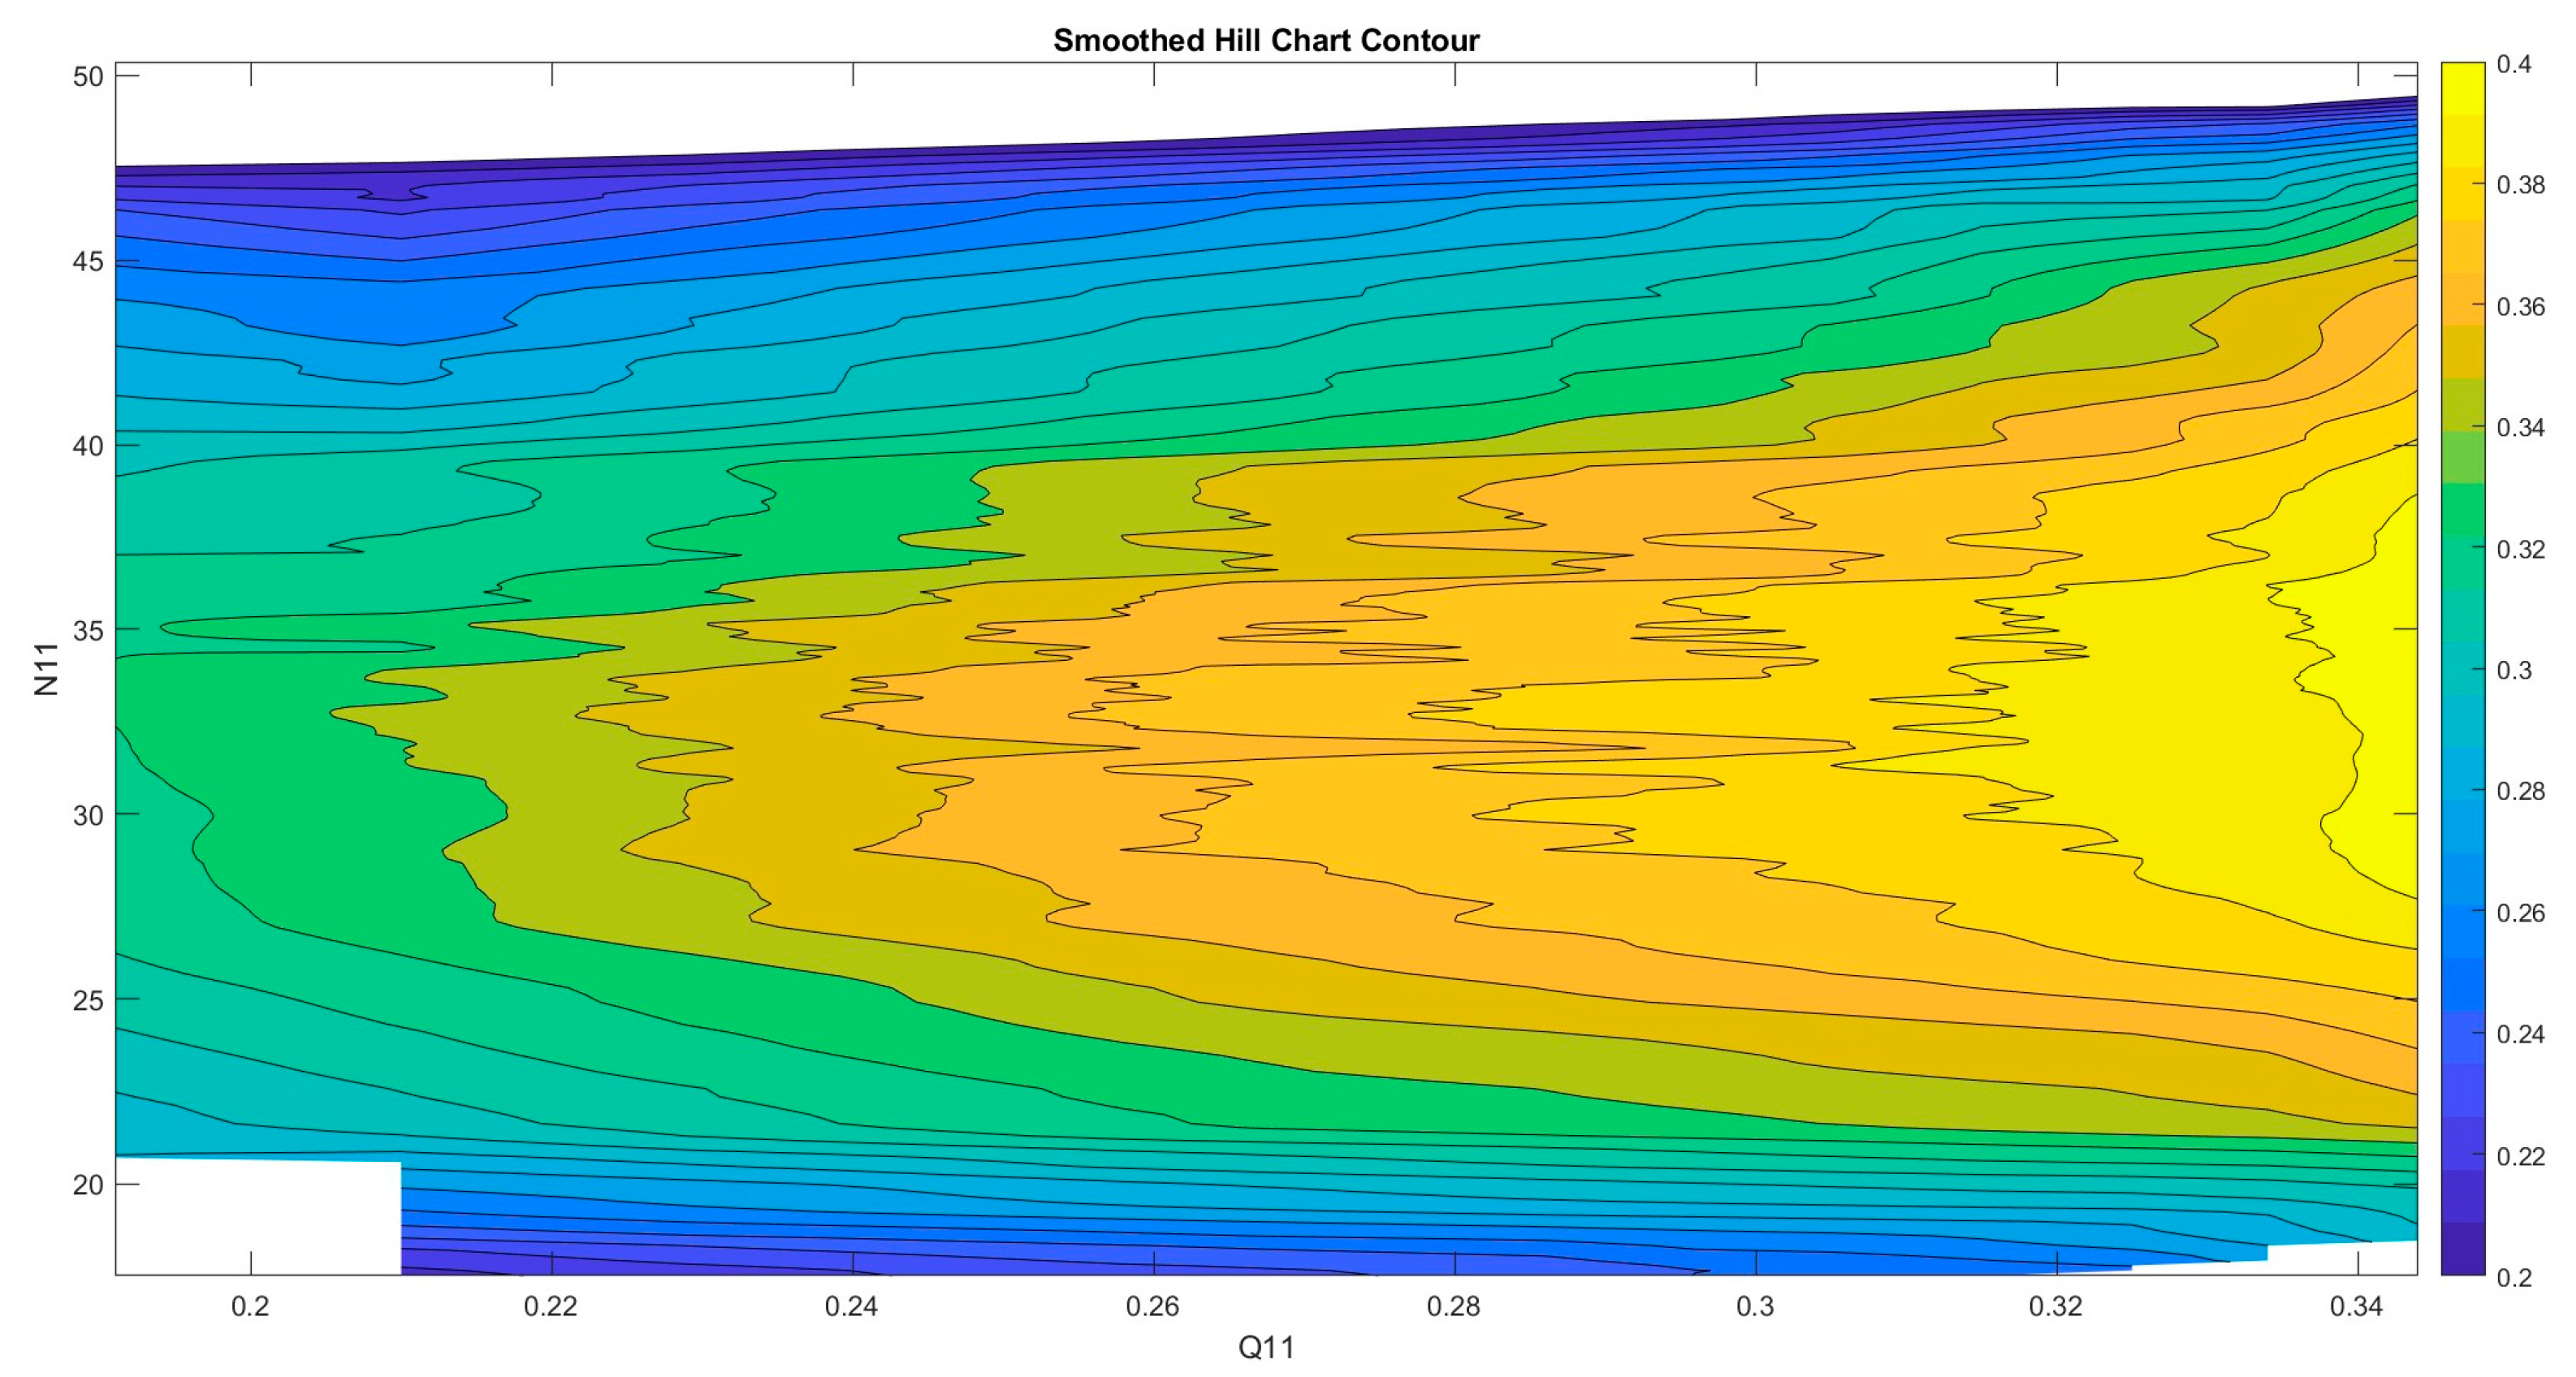
This hill chart data were then smoothed (as seen from
Figure 15) using a regression model coded in MATLAB. The Moving-Average filter computes the average of all the points within a given window size along each matrix axis and plots these average values. The X(Q11) and Y(N11) matrices were smoothed using the default Moving Mean method, with a large window size. MATLAB’s smoothdata function can be applied to either vectors or matrices, but in a matrix, it will only smooth the data in a one-dimensional manner (i.e., along columns or along rows). The X, Y, and Z coordinate matrices were smoothed in this manner and plotted in place of the original data. This helps to fit the noisy raw data closer to a parabolic curve which would be expected in a hill chart.
The default window sizes are computed heuristically [
24]. The default window sizes selected by MATLAB were X = 265, Y = 67 and Z = 11.
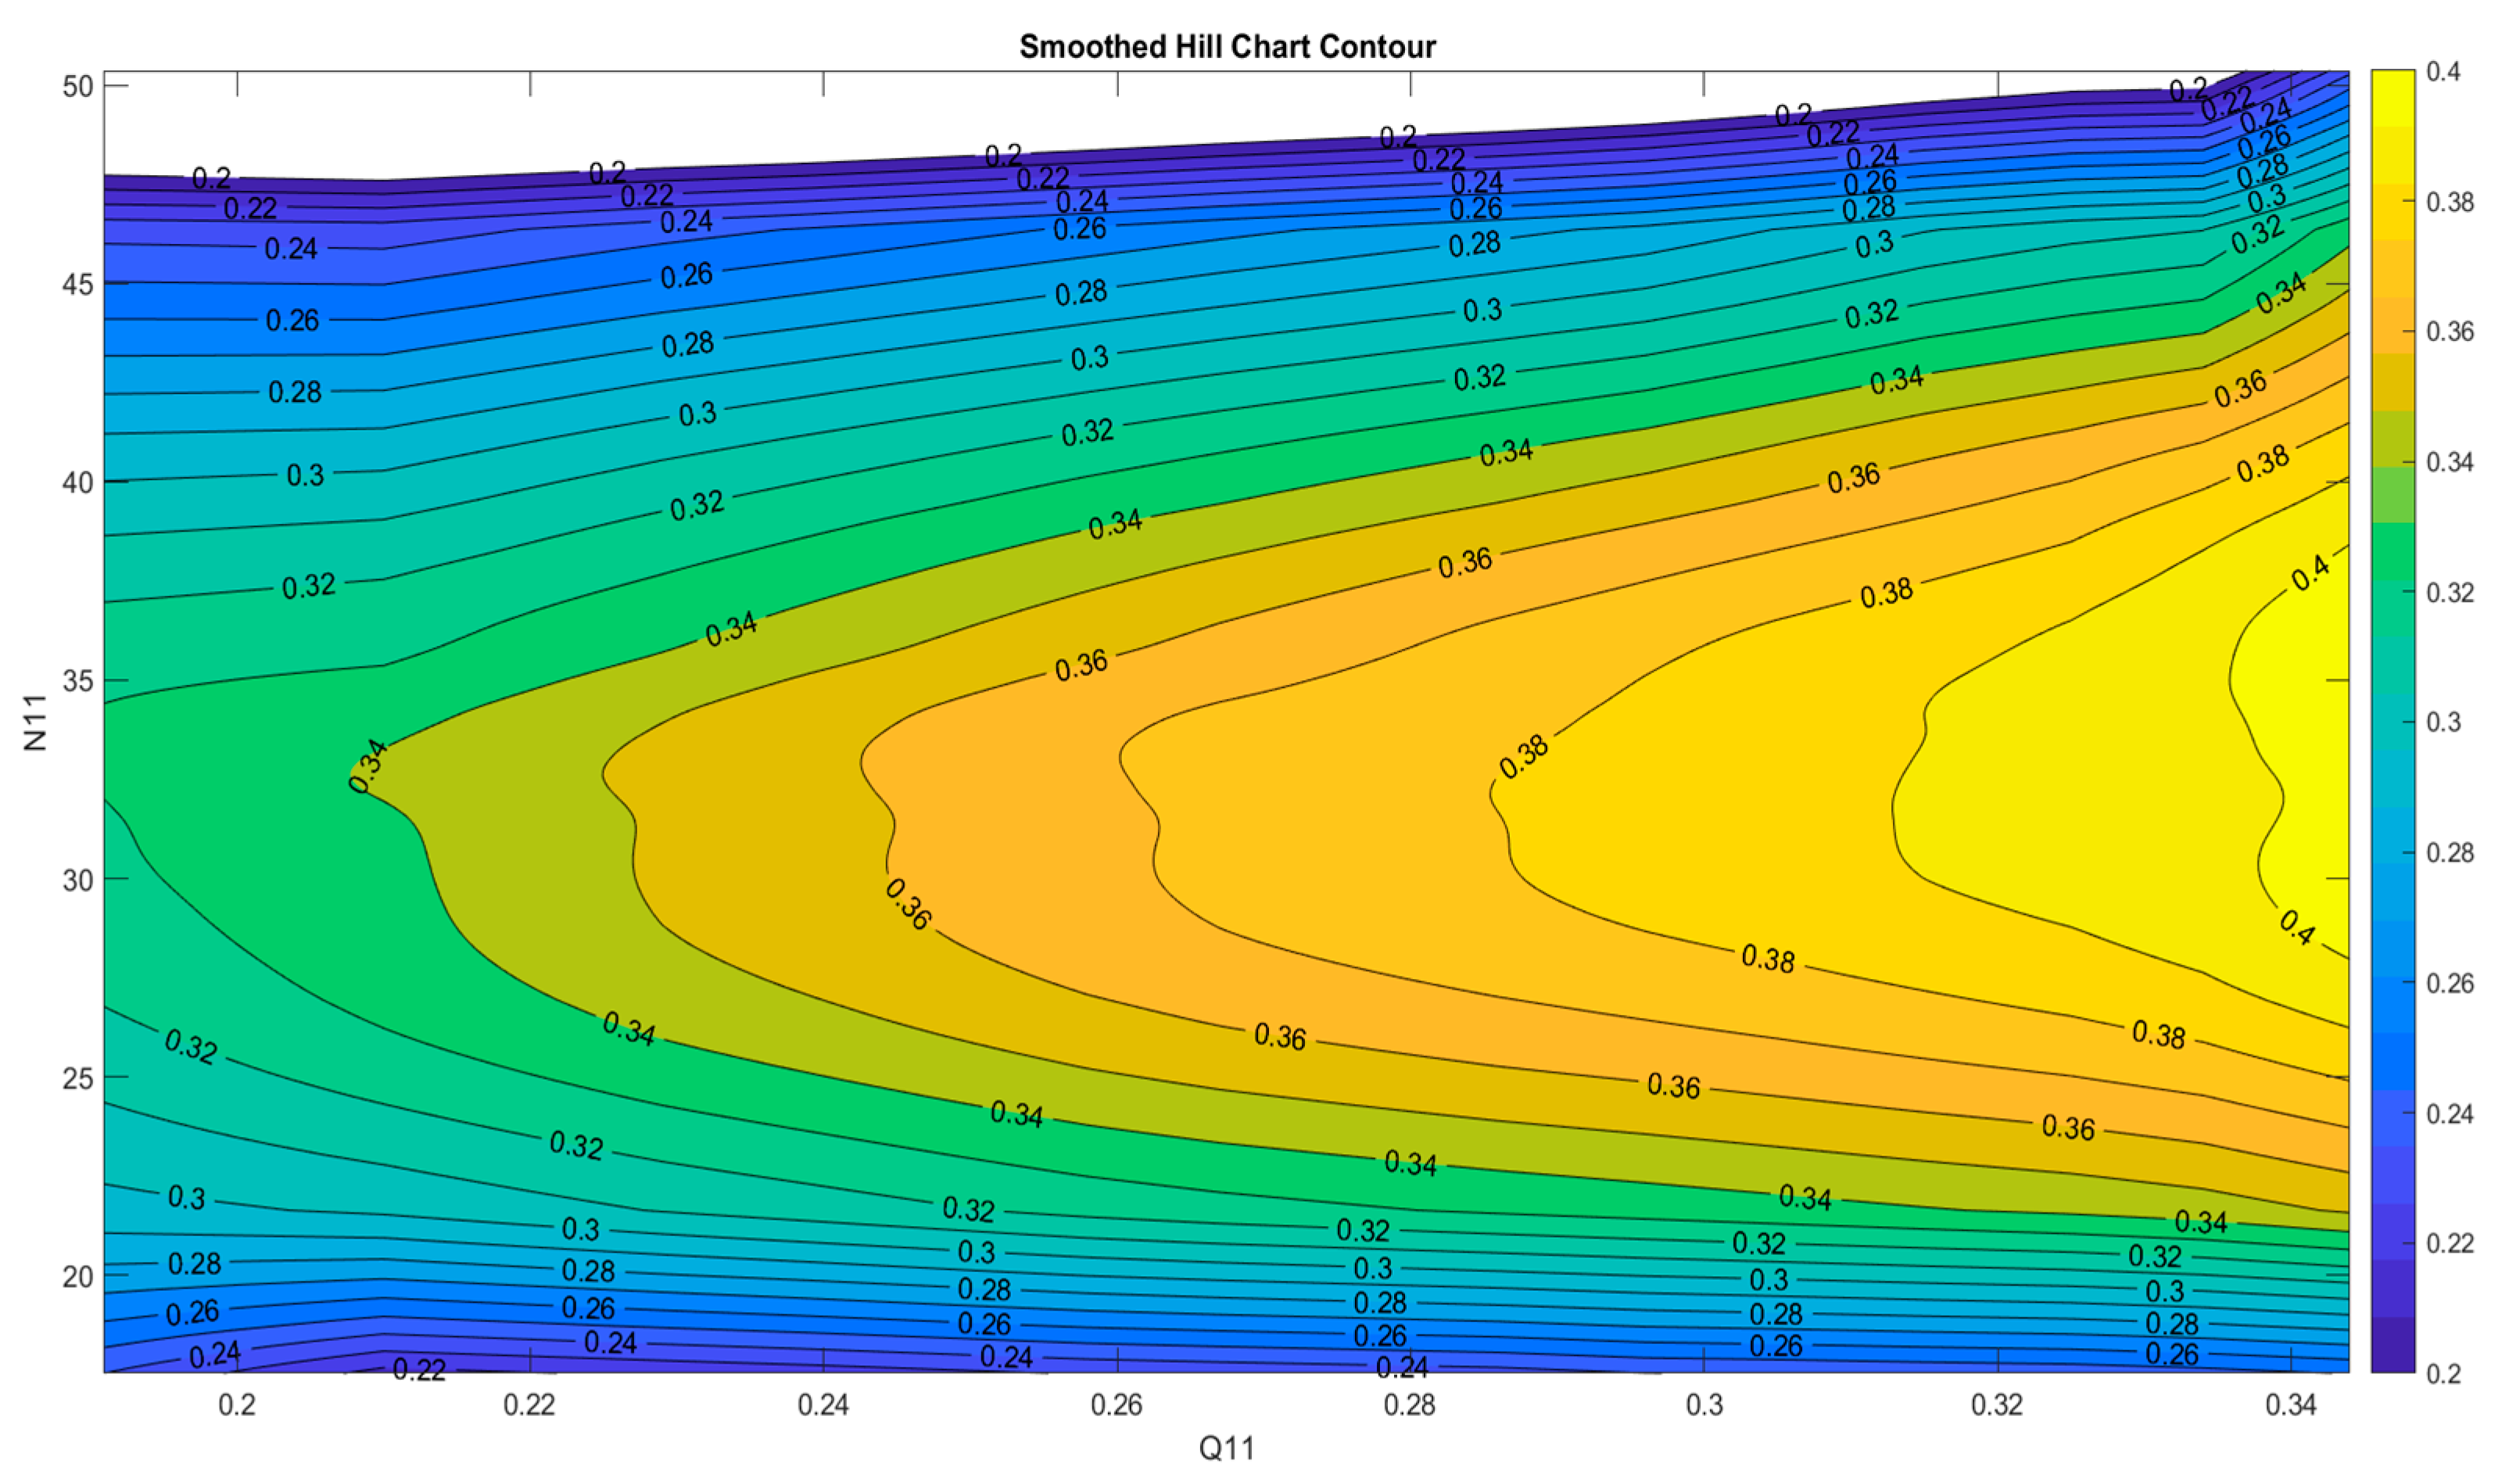
However, an initial analysis can be conducted to assess the suitability of these window sizes and suggest more appropriate values. The suggestion of a large X window implies that there is minimal noise along the X axis. The Y axis showed some noise, but only in the Y–Z direction. The majority of the noise was seen in the Z (efficiency) axis. As such, specifically for the Z matrix, the method was changed from Moving Mean to ‘rloess’, which performs quadratic regression on each column of the matrix in the Y–Z direction. When combined with a larger window size of Z = 120, it produces a more conventional hill chart, and one that likely better represents the underlying performance of the turbine itself that is not affected by the noise introduced from the testing rig. This improved hill chart is displayed in
Figure 16.
3.3. Specific Speed and Nondimensionalized Runner Speed
The nondimensionalized speed of a hydraulic turbine
is related to the turbine power P, water head H, and the turbine rotational speed N. This can be shown via the equation
[
25]. When using the data from the CFD,
was calculated at 369.89 RPM. Using the results from the experimental testing,
was calculated at 458.91 RPM.
The specific speed of a hydro turbine relates to the runner speed N, flow rate Q, and water head H through the equation
. This acquired value can then be used to classify which operating conditions are more favorable. Turbines with lower specific speeds are generally better suited to high-head scenarios while turbines with higher specific speeds are best suited to low-head applications.
Table 3 below [
26] shows the typical specific speeds for the most used hydro turbines.
When using the data from the peak efficiency point in computational simulations, the specific speed for the turbine was 3.73. Using the peak efficiency point from the experimental data, the specific speed was shown to be 3.77. This puts the turbine design in the specific speed range typically associated with traditional Pelton turbines and therefore high head, lower flow rate scenarios.
4. Discussion
Erosion is a significant issue impacting upon the reliability of Pelton turbines; the current methods of resharpening the central turbine splitter and polishing the inside of the buckets leads to extended downtime and therefore an overall reduced power production [
27]. It is important to look for solutions to this issue to ensure a consistent capability for hydropower to meet increasing global renewable energy requirements. The proposed design incorporated a combination of ideas from both existing Pelton and Turgo turbines with the aim of minimizing the effects of erosion and reducing maintenance time, therefore increasing the potential energy output.
When comparing both the experimental and computational results, it can be observed that this design produces promising initial efficiency values. The specific speed value of the turbine shows that it is best suited for high-head and low-flow rate applications. The design shows that, through further development in both the optimization of bucket shape and discovery of optimal operating conditions, the efficiency of this novel design could be within a few percent of that of a traditional Pelton turbine. However, with the possibility of the turbine requiring much less maintenance, there is a potential for an increased power output over time.
This novel hydro turbine provides economic benefits in many aspects. It is proposed that the novel turbine will be less susceptible to splitter erosion than a traditional Pelton. The half-bucket design places the point of the jet incidence closer to the center of the bucket rather than directly on a central splitter. This distributes the force of the jet more evenly and could lead to much slower erosion. As previously explained, splitter erosion is the primary driver in the performance degradation of Pelton turbines, so reduced splitter erosion will lead to the turbine maintaining a higher efficiency for longer periods of time. This will reduce the need for regular maintenance, repairs, and replacements, thus keeping costs lower through the acquisition of materials and hiring maintenance teams being a rarer occurrence.
The ability to remove the buckets from a backing plate makes any required maintenance both easier and cheaper as individual buckets can be replaced rather than the entire wheel. Additionally, the largest piece in the assembly is the backing plate. Theoretically, this should have a much longer lifetime than the buckets as it does not contribute significantly to the overall efficiency of the turbine. Therefore, when replacing the turbine, there will be less material usage as the backing plate will likely not need to be replaced, only resurfaced. This, in turn, reduces the overall carbon footprint of the novel turbine as less raw resources are required over its lifetime than that of a Pelton turbine constructed from one solid piece. It may be the case that using removable buckets may cause some loss of efficiency due to possible movement at the joint between the buckets and the backing place. However, if the fastenings are adequately tightened, this will become negligible. If efficiency drops are noticed because of the fastenings loosening over time, very quick maintenance to tighten the joins can take place. The predominant factor in determining the efficiency of a turbine is the shape of the buckets and redirection of the flow of water. With that in mind, it is easy to see that unless the buckets are significantly loosened, the effects of removable buckets on efficiency will not be severe. The benefits of easy maintenance and repair vastly outweigh the slight potential gain in efficiency that a single piece turbine would garner.
In addition to the aforementioned points, the social impacts of this turbine could be far-reaching. Due to the turbine design requiring potentially far less frequent maintenance and being less susceptible to erosion, the novel turbine may be more accessible to remote areas where sediment levels in the water may be much higher. The lower maintenance requirements further allow the implementation of this turbine in more remote areas or areas where a skilled workforce is limited, potentially providing a means of clean energy generation for remote towns and villages. Finally, the design of the novel turbine to be made with removable buckets makes it far easier to manufacture than one made from a single piece. A much smaller CNC machine or even a 3D printer could now be used to manufacture a hydro turbine as opposed to larger and vastly more expensive multiaxial CNC machines to create a traditional Pelton wheel. All these design features will help to expand the scope of application of hydropower technology facilities and the rollout of renewable energy generation, thus providing more green jobs to the local community and further raising the profile of renewable energy across the globe.
Further steps for this research are needed in many aspects of this turbine to both improve the efficiency of the turbine and understand its optimal operating conditions. Firstly, testing of the turbine design is required to adhere to ISO 19283:2020 standard [
28]. This will allow for a better comparison between computational results and experimental results. Secondly, testing should be conducted beyond 30 m head to gather a complete hill chart and fully understand the turbine’s capabilities. Additionally, an extended endurance test should be completed over a period which includes additional parameter or material testing to ensure both safety and reliability. Testing when the turbine is subjected to heavily sediment-laden water and an overall lifetime test should be performed to compare the blade lifetime to that of a traditional Pelton bucket. Comparisons should then be made to look at how sediment erosion affects the novel turbine in contrast to Pelton turbine bucket erosion.
In terms of blade design, an additional analysis can be undertaken to further enhance the efficiency of the buckets looking at bucket width, depth, water exit angle, and effects of water jet size. Finally, alternative ways to manufacture and attach the buckets could be investigated with a full cost analysis to compare with traditional Pelton turbines.
5. Conclusions
This paper has demonstrated the potential for a novel impulse hydro turbine design to provide renewable energy in high-head water applications at efficiencies comparable to that of industrially used Pelton and Turgo turbines. The novelty of the design comes from combining beneficial aspects from both Pelton and Turgo turbines, as well as parametric optimization of the buckets of the turbine.
In a Pelton style turbine testing rig, the novel design achieved efficiencies within 6% of that of a commercial Pelton turbine under the same operating conditions. The CFD simulations suggest that the turbine is capable of 82.95% efficiency at a 20 m head, which can be further improved upon through design optimization and additional testing. The experimental results suggest that the turbine efficiency may improve as the hydraulic head increases above 35 m. The design has potential for improvements and further research of its performance over a range of operating conditions could help it rival both the Pelton and Turgo turbines in the hydro-power industry.
Additionally, the novel turbine also satisfies the Three Pillars of Sustainability to a more complete standard than a traditional Pelton Turbine. Its design allows for reduced maintenance and cheaper replacement parts via a removable half bucket design, which satisfies both the environmental and economic pillar. Due to its simple manufacturability and greater silt erosion resistance, it can be deployed in remote areas, providing both green electricity and new employment opportunities to the developing world and thus fulfilling the social pillar of sustainability.
Author Contributions
Conceptualization, G.A. and A.Ž.; methodology, D.P.; Simulation, S.O. and L.W.; validation, D.P., L.B., G.P. and M.D.; writing—original draft preparation, S.O., M.D. and G.P.; writing—review and editing, D.P., L.B. and L.W.; supervision, G.A. and A.Ž. All authors have read and agreed to the published version of the manuscript.
Funding
This research received no external funding.
Institutional Review Board Statement
Not applicable.
Informed Consent Statement
Not applicable.
Data Availability Statement
Data are contained within the article. For any further data requests please contact the corresponding author.
Conflicts of Interest
The authors declare no conflict of interest.
Nomenclature
| Number of Jets |
| H | Head (m) |
| Density (kg/ |
| g | Gravitational Constant (m/) |
| P | Pressure (Pa) |
| d | Nozzle Diameter (m) |
| Final Torque (Nm) |
| Load Torque (Nm) |
| Load RPM (RPM) |
| ω | Angular Velocity (rad/s) |
| η | Efficiency |
| Number of Buckets |
| W | Work Done (J) |
| t | Time (s) |
| v | Velocity (m/s) |
| Mass Flow Rate (kg/s) |
| Q | Flow Rate ( |
| Power In (W) |
| Power Out (W) |
References
- Huang, K.; Luo, P.; Liu, P.; Kim, J.S.; Wang, Y.; Xu, W.; He, L.; Gong, Y. Improving complementarity of a hybrid renewable energy system to meet load demand by using hydropower regulation ability. Energy 2022, 248, 123535. [Google Scholar] [CrossRef]
- Van Soest, H.L.; den Elzen, M.G.; van Vuuren, D.P. Net-zero emission targets for major emitting countries consistent with the Paris Agreement. Nat. Commun. 2021, 12, 2140. [Google Scholar] [CrossRef] [PubMed]
- Quaranta, E.; Chirag, T. The state-of-art of design and research for Pelton turbine casing, weight estimation, counterpressure operation and scientific challenges. Heliyon 2021, 7, e08527. [Google Scholar] [CrossRef] [PubMed]
- Xiao, Y.X.; Cui, T.; Wang, Z.U.; Yan, Z.G. Numerical simulation of unsteady free surface flow and dynamic performance for a Pelton turbine. IOP Conf. Ser. Earth Environ. Sci. 2012, 15, 052033. [Google Scholar] [CrossRef]
- Abgottspon, A.; Staubli, T.; Felix, D. Erosion of Pelton buckets and changes in turbine efficiency measured in the HPP Fieschertal. IOP Conf. Ser. Earth Environ. Sci. 2016, 49, 122008. [Google Scholar] [CrossRef]
- Bajracharya, T.; Acharya, B.; Joshi, C.; Saini, R.; Dahlhaug, O. Sand erosion of Pelton turbine nozzles and buckets: A case study of Chilime Hydropower Plan. Wear 2008, 264, 177–184. [Google Scholar] [CrossRef]
- Padhy, M.; Saini, R. Study of silt erosion on performance of a Pelton turbine. Energy 2011, 36, 141–147. [Google Scholar] [CrossRef]
- Padhy, M.; Saini, R. Study of silt erosion mechanism in Pelton turbine buckets. Energy 2012, 39, 286–293. [Google Scholar] [CrossRef]
- Ge, X.; Sun, J.; Zhou, Y.; Cai, J.; Zhang, H.; Zhang, L.; Ding, M.; Ding, C.; Binama, M.; Zheng, Y. Experimental and Numerical studies on Opening and Velocity Influence on Sediment Erosion of Pelton Turbine Buckets. Renew. Energy 2021, 173, 1040–1056. [Google Scholar] [CrossRef]
- Rai, A.K.; Kumar, A.; Staubli, T. Effect of concentration and size of sediments on hydro-abrasive erosion of Pelton turbine. Renew. Energy 2020, 145, 893–902. [Google Scholar] [CrossRef]
- Rai, A.K.; Kumar, A.; Staubli, T. Developing a Test RIg to Measure Hydro-Abrasive Erosion in Pelton Turbine. In Proceedings of the International Conference on Hydropower for Sustainable Development, Dehradun, India, 5–7 February 2015. [Google Scholar]
- Aggidis, G.; Židonis, A.; Burtenshaw, L.; Dubois, M.; Orritt, S.; Pickston, D.; Prigov, G.; Wilmot, L. Methodology for the Optimization of a Novel Hydro Turbine with a Case Study. Energies 2023, 16, 7591. [Google Scholar] [CrossRef]
- Shah, H.A.; Chaudhari, G.C.; Dhiman, V.D. Parametric Optimization & Design of Pelton Turbine Wheel for Hydraulic Efficiency Improvement. J. Phys. Conf. Ser. 2021, 2007, 012019. [Google Scholar]
- Erazo, J.; Barragan, G.; Pérez-Sánchez, M.; Tapia, C.; Calahorrano, M.; Hidalgo, V. Geometrical Optimization of Pelton Turbine Buckets for Enhancing Overall Efficiency by Using a Parametric Model—A Case Study: Hydroelectric Power Plant “Illuchi N2”from Ecuador. Energies 2022, 15, 9052. [Google Scholar] [CrossRef]
- Kumashiro, T.; Fukuhara, H.; Tani, K. Unsteady CFD simulation for bucket design optimization of Pelton turbine runner. IOP Conf. Ser. Earth Environ. Sci. 2016, 49, 022003. [Google Scholar] [CrossRef]
- Solemslie, B.W.; Dahlhaug, O.G. A reference pelton turbine-design and efficiency measurements. IOP Conf. Ser. Earth Environ. Sci. 2014, 22, 012004. [Google Scholar] [CrossRef]
- Aggidis, G.; Zidonis, A. Pelton turbine: Identifying the optimum number of buckets using CFD. J. Hydrodyn. 2016, 28, 75–83. [Google Scholar]
- Purvis, B.; Mao, Y.; Robinson, D. Three pillars of sustainability: In search of conceptual origins. Sustain. Sci. 2019, 14, 681–695. [Google Scholar] [CrossRef]
- Vyas, G.S.; Jha, K.N.; Rajhans, N.R. Identifying and evaluating green building attributes by environment, social, and economic pillars of sustainability. Civ. Eng. Environ. Syst. 2019, 36, 133–148. [Google Scholar] [CrossRef]
- Tiwari, G.; Kumar, J.; Prasad, V.; Patel, V.K. Utility of CFD in the design and performance analysis of hydraulic turbines—A review. Energy Rep. 2020, 6, 2410–2429. [Google Scholar] [CrossRef]
- Sheng, D.-Y. Synthesis of a CFD Benchmark Exercise: Examining Fluid Flow and Residence-Time Distribution in a Water Model of Tundish. Materials 2021, 14, 5453. [Google Scholar] [CrossRef]
- Durkacz, J.; Islam, S.; Chan, R.; Fong, E.; Gillies, H.; Karnik, A.; Mullan, T. CFD modelling and prototype testing of a Vertical Axis Wind Turbines in planetary cluster formation. Energy Rep. 2021, 7, 119–126. [Google Scholar] [CrossRef]
- Stamou, A.; Katsiris, I. Verification of a CFD model for indoor airflow and heat transfer. Build. Environ. 2006, 41, 1171–1181. [Google Scholar] [CrossRef]
- Smoothdata. MathWorks. 2023. Available online: https://uk.mathworks.com/help/matlab/ref/smoothdata.html (accessed on 10 October 2023).
- Sayers, A. Hydraulic, Compressible Flow Turbomachines; McGraw-Hill Publishing Co.: New York, NY, USA, 1990. [Google Scholar]
- Çelikdemir, S.; Yildirim, B.; Özdemir, M.T. Cost Analysis of Mini Hydro Power Plant Using Bacterial Swarm Optimization. Int. J. Energy Smart Grid 2017, 2, 64–81. [Google Scholar] [CrossRef]
- Rai, A.K.; Kumar, A.; Staubli, T. Hydro-Abrasiveerosioninpeltonbuckets:Classificationandfieldstudy. Wear 2017, 392–393, 8–20. [Google Scholar] [CrossRef]
- ISO 19283:2020; Condition Monitoring and Diagnostics of Machines Hydraulic Generating Units. International Organization for Standardization: Geneva, Switzerland, 2020.
| Disclaimer/Publisher’s Note: The statements, opinions and data contained in all publications are solely those of the individual author(s) and contributor(s) and not of MDPI and/or the editor(s). MDPI and/or the editor(s) disclaim responsibility for any injury to people or property resulting from any ideas, methods, instructions or products referred to in the content. |
© 2023 by the authors. Licensee MDPI, Basel, Switzerland. This article is an open access article distributed under the terms and conditions of the Creative Commons Attribution (CC BY) license (https://creativecommons.org/licenses/by/4.0/).


 ,
, 


