Article

A Novel Scale for Evaluating Digital Readiness toward Earthquakes: A Comprehensive Validity and Reliability Analysis

1
Department of Mathematics, Near East University, 99138 Nicosia, Turkey
2
Department of Computer Information Systems, Near East University, 99138 Nicosia, Turkey
3
Computer Information Systems Research and Technology Centre, Near East University, 99138 Nicosia, Turkey
*
Author to whom correspondence should be addressed.
Sustainability 2024, 16(1), 252; https://doi.org/10.3390/su16010252
Submission received: 28 November 2023 / Revised: 21 December 2023 / Accepted: 25 December 2023 / Published: 27 December 2023

Abstract

:
New digital technology trends have the potential to mitigate the effects of earthquakes and improve response and recovery efforts such as earthquake prediction, emergency call-out, and earthquake location notification. Earthquake readiness makes it necessary to have a digitally prepared society. However, no scale has been found in the literature that can measure the digital attitudes and skills of individuals regarding earthquakes. For this reason, to fill this gap in the literature, this descriptive research study aimed to develop an original, valid, and reliable scale to determine the digital readiness of individuals toward earthquakes. Data were collected from 621 adult individuals with different socioeconomic characteristics using the convenience sampling method. An item pool was created through a comprehensive literature review, followed by a series of analyses encompassing content validity, construct validity, convergent validity, discriminant validity, criterion-related validity, reliability analysis, and item analysis in the course of the scale’s development process. For the digital readiness toward earthquakes, the Draft scale, with 21 items remaining, a KMO value (0.894), and a Bartlett sphericity test result of χ2 (91) = 2407.76 (p < 0.001) showed the suitability of the data for exploratory factor analysis (EFA). As a result of the EFA, 14 items were categorized into two dimensions based on whether their eigenvalues exceeded 1. The explained variance was 46.823% (eigenvalue = 6.555) in the first factor, while it was 12.832% (eigenvalue = 1.796) in the second factor, and the total variance was 59.655%. After analyzing the scale’s items within these dimensions, the first dimension was named “Technological Skills”, comprising eight items, and the second dimensions was named “Digital Attitudes”, consisting of six items. The factor loadings for these items ranged from 0.562 to 0.900. Confirmatory factor analysis (CFA) affirmed the factorial structure identified by the EFA. For the five-point Likert-type Digital Readiness toward Earthquakes scale, named the DRE scale, with 14 items after validity analyses, Cronbach’s alpha value was obtained as 0.910, demonstrating high internal consistency. Cronbach’s alpha values of the two factors were 0.910 for the “Technological Skills” dimension and 0.837 for the “Digital Attitudes” dimension. It was concluded that the developed scale is a valid and reliable measurement in evaluating the digital readiness of individuals toward earthquakes.

1. Introduction

Earthquakes are terrible and destructive natural events which occur in a short time [1]. Earthquakes have many devastating social, physical, and economic effects on societies [2]. Turkey is one of the most active earthquake regions in the world due to the complex plate interaction between seismic effects [3]. An earthquake with a magnitude of 7.7 on the Richter scale occurred in the southeast of Turkey, in Kahramanmaraş and surrounding provinces (Gaziantep, Şanlıurfa, Diyarbakır, Adana, Adıyaman, Osmaniye, Kilis, Elazığ, Malatya, and Hatay), in the early hours of Monday, 6 February 2023 [1]. This earthquake was of extraordinary magnitude and was called “the largest in the world” by the world press. There were many casualties as a result of the Kahramanmaraş (Turkey) earthquake [4]. It was reported that the number of deaths in the first week was around 31,643 [5]. The intensity of the earthquake, construction quality of buildings [6], earthquake awareness of individuals, etc., can be considered as the reason for this. There has been great destruction in the region and the region needs to be restructured as everywhere has been plundered.
On the other hand, it is also known that Istanbul is weak and vulnerable to seismic events [7,8]. Recently, experts have emphasized that a major earthquake centered in Istanbul is likely to occur at any time. Therefore, by initiating studies to improve people’s skills and attitudes toward digital earthquake readiness, the loss of life in a possible earthquake can be minimized. In addition, it has become a necessity to increase earthquake awareness and to initiate all studies aimed at increasing earthquake awareness immediately. Digital readiness plays a crucial role in facilitating rapid communication and information dissemination during natural disasters. Individuals, through their digital readiness, can receive real-time updates, emergency alerts, and essential information via mobile devices and social media. This capability enables them to make informed decisions promptly [9]. Recognizing the paramount importance of digital readiness toward earthquakes is integral to improving response mechanisms and mitigating risks effectively. The integration of digital tools not only facilitates communication but also empowers communities and decision-makers with valuable insights, contributing to a more resilient and responsive disaster management framework [10].
With the current state of our knowledge and ability, it may not be possible to protect or minimize damage from natural disasters or events such as earthquakes, but Kontoni et al. [11] emphasized that positive results can be obtained with the introduction of technology. Today, it is known that developments and changes in technology positively affect the lives of human beings in all sectors (e.g., education [12], economics [13], medicine [14], engineering [15], etc.). With new digital technology trends, intervention and improvement efforts such as earthquake prediction, emergency calls, and earthquake location notification can be carried out, and therefore, Kontoni et al. [11] stressed that the damages of earthquakes can be reduced.
Another critical aspect is the coordination and allocation of resources facilitated by digital technologies, such as geographic information systems (GIS) [16]. These technologies allow response teams and aid organizations to allocate resources, aiding responders in reaching affected areas efficiently and distributing resources based on real-time data. Digital platforms, including social media and mobile applications, empower individuals to actively engage in educational resources, training modules, and community forums focused on digital earthquake readiness [17]. This community engagement fosters resilience and enhances overall readiness. Early warning systems, powered by digital technologies, are instrumental in detecting potential disasters, predicting their impact, and issuing timely warnings [18]. This significantly reduces response time and elevates overall readiness for effective disaster management. Digital readiness further enables data-driven decision-making. Through timely information from individuals and the collection of relevant data, informed decisions incorporating data analysis and modeling can be made. This aids in identifying potential risks, security vulnerabilities, and community needs. Public awareness and education are paramount in the digital era. Leveraging social media, websites, and mobile apps, authorities can disseminate information about digital readiness for earthquake measures, evacuation plans, and safety protocols. This ensures a well-informed and educated population, crucial for effective disaster response.
In conclusion, the earthquake readiness of society makes it necessary to have digitally prepared individuals. However, people need to be aware of their usefulness and have the technological skills and digital attitudes to use them. To the best of our knowledge, no scale has been found in the literature to determine the technological skills and digital attitudes that will ensure people’s earthquake readiness. For this reason, this study has aimed to develop a novel scale for evaluating individuals’ digital readiness toward earthquakes to fix the gap in the literature.
Firstly, a new scale makes it possible to include digital readiness toward earthquakes through developing technologies, social media, mobile apps, and other platforms, offering a more precise and nuanced assessment. Secondly, earthquake readiness strategies can be evolved based on society’s and/or individuals’ actual technological skills and digital attitudes in utilizing digital platforms, tools, and apps for digital readiness toward earthquakes. Lastly, developing a novel scale for digital readiness toward earthquakes provides policymakers and intervention planners with accurate insights into the digital aspects of earthquake preparedness. This information is crucial for designing targeted and effective strategies to enhance community resilience. Therefore, the objectives of this study are to create an item pool following a comprehensive literature review, present the item pool to experts for content validity, refine the scale based on pilot testing and item analysis, administer the refined scale for large-scale data collection encompassing various demographic factors, conduct validity and reliability analyses, and ultimately, finalize a valid and reliable scale for measuring individuals’ digital readiness toward earthquakes.

Technology and Earthquakes

Earthquakes are natural events that affect people’s lives in a very important, sudden, and uncontrollable way, and they can be major disasters depending on their intensities [18]. Smartphones, instant earthquake prediction systems, earthquake-related mobile applications, location information systems, siren-based apps, social media, earthquake-related websites, etc., are some of the technological tools/apps that can be used by people easily without the help of IT experts. Moreover, earthquake information publishing systems, geographic information systems, rapid earthquake information-providing systems, earthquake video systems, etc., are some systems that may help save human lives or ensure technological readiness in case of an earthquake.
An earthquake early warning (EEW) system can deliver ground-shaking alerts or warnings to detect ground motion in seconds to minutes [18]. Also, sensors were successfully deployed in Taiwan for the same purpose as EEW systems [19]. Someone using the EEW system receives a warning that shaking will occur within a few seconds, so they can drop, take cover, and hold on [20]. When earthquakes are mentioned, the first thing that comes to mind is Japan. This is because Japan takes effective and sustainable measures against earthquakes thanks to its honest work ethic in public administration, economic life, and the construction sector, and more importantly, its successful use of advanced earthquake technologies [21]. Japan detects ground tremors using seismometers, and then with their nationwide early warning system, sends an automatic warning message to people living in areas where earthquake warnings are received and informs people in advance of imminent strong ground motion [22].
Virtual reality (VR) is one of the new technological trends that offers people intelligent ways to improve knowledge transfer and communication [23]. For this reason, a VR-based application was developed for civil engineering education. The results showed that VR integration into education improved learning outcomes in the construction of earthquake-resistant buildings. By developing web applications, individuals can be easily informed about earthquakes.
Raccanello et al. [24] created a web application to promote emotional knowledge about earthquakes. Also, the use of the ShakeAlert system automatically disables actions set to minimize earthquake damage, injury, and loss of life, helping the individual take personal protective actions such as “Fall, Cover, and Hold On” [25].
The DepApp smartphone application was created by [26] and offers details about the location, magnitude, and timing of a recent earthquake. Additionally, users can benefit both before and after an earthquake by using the general information about earthquakes provided by this app. The makers of the app made the point that users of their specially designed mobile app will be more informed and equipped in the event of an earthquake.
Consequently, emerging technologies (GPS, Bluetooth, the Internet of things, Cloud, virtual reality, etc.) allow scientists to develop new tools capable of giving people the chance to take precautions before the earthquake or get help after the earthquake, to help reduce the negative effects of the earthquake. To reduce the negative effects of earthquakes, many paid/free systems and applications that have the potential to improve response and recovery efforts such as earthquake prediction, emergency calls, earthquake location notification, earthquake training, etc., have been developed and made available for use. Smartphones have become an important and indispensable part of human life in the 21st century [27] due to their advanced features. According to Statista’s 2023 report [28], it is stated that 85.82% of the world’s population owns a smartphone. Individuals always carry them with them and use them for various daily activities because of their mobility features, for example, mobile shopping [29], mobile banking [30], etc. Considering the unpredictability of earthquakes, taking advantage of smartphones always being at hand can be highly beneficial. This is because there are both paid and free earthquake-related applications that are easily accessible on the Internet. These mobile applications can be used conveniently on smartphones, helping to minimize the financial and emotional damages caused by earthquakes to some extent. Keeping track of seismic activity worldwide and being prepared for earthquakes are made easier by mobile applications. Examples of these include data tracking apps (e.g., QuakeFeed), safety apps (e.g., American Red Cross), alert-before-the-earthquake apps (e.g., Earthquake Network), earthquake monitoring apps (e.g., My Earthquake Alerts, LastQuake), GPS apps (e.g., Earthquakes Tracker), emergency whistle apps (e.g., Whistle S.O.S: whistle sounds), Bluetooth-based apps (e.g., Earthquake Alert!, Walkie Talkie To Chat And Text With No Internet Connection Via Mesh Network), etc. Moreover, Muniz-Rodriguez et al. [17] conducted a comprehensive systematic literature review to investigate the impact of social media on the dissemination of emergency warnings and intervention information during and after natural disasters. Through their detailed study, they explored how social media can assist in identifying physical, medical, functional, and emotional needs in the aftermath of a natural disaster. Their findings revealed that social media platforms are defined as dissemination tools that provide an opportunity for public health institutions to share emergency alerts. Furthermore, they observed that social media platforms are effective tools in developing maps as a common method for visualizing data related to natural disasters. By using individuals’ reported locations, these platforms can efficiently identify areas in need of assistance or medical aid. As a result of their retrospective analyses, they concluded that social media analysis is among the promising new technologies in shortening response times and providing the opportunity to determine individuals’ locations.
Figure 1 shows the number of earthquakes worldwide from 1990 to 2023 with a magnitude of five or more (M5+) that were recorded [31,32]. Additionally, Figure 2 reveals a significant increase in the number of earthquakes in Turkey between 1990 and 2023, as documented over the years [33]. Additionally, it can be seen in Figure 3, that the magnitudes of the earthquakes in Turkey are serious [34]. These statistics reveal that the necessary work should be started immediately to minimize the damage from earthquakes by using emergency technologies.

2. Materials and Methods

2.1. Study Design

The objective of this descriptive research is to create a measurement tool for measuring the digital readiness of individuals toward earthquakes. For this purpose, studies were planned following the steps of the scale development process in this study. Presented below are the steps of the study on developing a Digital Readiness toward Earthquakes (DRE) scale, along with the participants’ features. Figure 4 illustrates the flow chart of the scale’s development process. This study has gone through several phases, each of which was essential to the process of developing a scale. The steps involved were the following: reviewing the literature; creating an item pool; presenting the item pool to experts for content validity; implementing a pilot study; analyzing the items after the pilot study; preparing the items and scale for their main implementation; main implementing on a large sample group; conducting exploratory factor analysis (EFA) for construct validity on an explanatory sample; conducting confirmatory factor analysis (CFA) on a confirmatory sample; conducting analysis for convergent and discriminant validity, checking criterion-related validity, conducting reliability analysis, and item analysis; and presenting the DRE scale in its final form. These stages were sequentially undertaken to ensure the validity, reliability, and robustness of the developed scale.

2.2. Data Collection Process

Ethical approval for this study was obtained from the Scientific Research Ethics Committee of Near East University (NEU/AS/2023/194). Following the approval, the data collection process was initiated with a meticulous plan in place. Transparency was promoted by giving potential participants thorough information about the study’s objectives, procedures, and their rights. Only those who voluntarily consented to be part of the study were included, emphasizing the importance of informed participation. They were asked to sign a consent form after deciding to participate in the study. They were informed that even after signing the consent form, they were still free to withdraw at any time without giving a reason. To ensure a diverse and representative sample, data were collected from various socioeconomic backgrounds using the convenience sampling method.

2.3. Participants

A total of 629 participants voluntarily participated in this study. The inclusion criteria for participants in this scale development study were individuals aged 18 years and above who actively used smartphones and social media platforms. Exclusion criteria included individuals below 18 years of age, non-smartphone users, and those with no participation in social media activities. Convenience sampling was used to determine the participants. Before conducting data analysis, data preprocessing was performed to ensure the dataset’s quality and accuracy. It involved the identification and handling of unusual, missing, and extreme observations in the dataset before proceeding with data analysis. In the data, there were no missing observations. Multivariate outlier observations were analyzed using the Mahalanobis distance. Outlier data points were identified and eliminated from the dataset if their Mahalanobis distance values were larger than χ2 = 36.123. This methodical approach to outlier removal led to the elimination of 8 observations (1.27% of observations), which improved the overall robustness and quality of the dataset. A total of 621 observations were incorporated into the analysis after these values were removed.
Various demographic groups may interact with digital tools and platforms in diverse ways. Additionally, their technological skills and digital attitudes can vary. Therefore, demographic characteristics such as participants’ gender, education levels, occupations, and earthquake experiences were collected in the study to enable customization. This ensured that the assessment took into account the diverse demographic characteristics of participants, gathering information about the technological skills and digital attitudes of individuals across all segments of society. Self-reporting bias could not be ruled out, given that the participants self-administered the questionnaire with their sociodemographic characteristics. However, in our study, self-reporting bias was minimized by ensuring anonymity and confidentiality during data collection. Questionnaire items were carefully prepared and piloted to provide clarity, and efforts were made to minimize ambiguity in the questions. To this end, participants were given the assurance that their answers would remain private, which created an atmosphere that encouraged honest and accurate self-reporting. Table 1 presents the demographic information of the participants. A total of 47% (n = 292) of the study group were female and 53% (n = 329) were male. This gender distribution indicates a nearly equal distribution between male and female participants. A huge part of the participants held an undergraduate-level degree (n = 389, 63%), followed by individuals with master’s degrees (n = 111, 18%), those with PhDs (n = 94, 15%), and lastly, the remaining very small part with only a high school education. The majority of participants had a high level of education. This educational diversity suggests a well-educated sample, which may have had an impact on their digital engagement. On the other hand, the participants’ ages ranged from 18 to 67 years old, which highlights the diversity within the study group. The mean age was 36.0 years, with a standard deviation of 11.9 years. Additionally, Table 1 illustrates the diversity of the participants’ occupations, with the highest representation among academicians (n = 251, 41%), followed by engineers, teachers, students, architects, and others. The inclusion of participants from a variety of professional backgrounds provided a broad range of perspectives and experiences. Although the potential for self-reporting bias inherent in survey-based research is acknowledged, the inclusion of different occupational groups could have increased the external validity and generalizability of our findings. On the other hand, according to the distribution for the frequency of controlling notifications on mobile phones, a significant proportion of participants 35% (n = 219) had controlled their notifications more than five times, followed by 34% (n = 208) who had controlled their notifications immediately, and 20% (n = 123) who had controlled them three to five times. Fewer participants, 11% (n = 68), said that they had controlled their notifications once or twice. When the mobile phone notification habits of the participants were examined, it was observed that the majority of them checked frequently. This insight into the participants’ habits contributed to our understanding of their digital engagement. Furthermore, 88% (n = 549) of participants stated that they had experienced and been exposed to earthquakes at least once. This finding indicates significant social exposure and emphasizes the importance of digital readiness during seismic events. Among these 549 participants with earthquake experience, 36% (n = 197) of them mentioned that they had only felt an earthquake without experiencing any material losses or losing any family members, friends, or acquaintances. The remaining 25% (n = 137) of these participants reported that they had not experienced any loss of life among their acquaintances but had suffered material losses. Finally, 39% (n = 215) of participants indicated that they had both experienced material losses and lost family members or close acquaintances.
Two weeks after the application of the original survey, the DRE scale was administered once again to 150 randomly selected people from the study sample to determine the test–retest reliability of the scale. The purpose of the randomization process was to ensure that each individual in the original sample had an equal probability of being included in the retest group. This method reduces selection bias and also increases the generalizability of the test–retest reliability assessment. The random selection process was carried out in a systematic and impartial procedure. A total of 150 participants were selected from the main sample of participants using a randomization algorithm created by a computer. The accuracy of the test–retest reliability process was increased with the assurance of a transparent and fair selection process of this method. Selected participants were given a two-week break following the initial administration of the DRE scale before it was given to them again. This procedure was designed to assess participants’ replies for consistency and stability over time. Each participant was contacted once again and the DRE scale was distributed with the same instructions and criteria as in the first phase. The decision to implement a two-week interval for test–retest reliability evaluation was aimed at minimizing the impact of memory effects on participant responses. This period ensured that participants were not likely to vividly remember their initial answers, thus reducing the likelihood of response repetition. Additionally, a two-week gap provided a balance between allowing for any genuine changes in participants’ experiences related to the measured constructs and maintaining their engagement and commitment to the study. Research suggests that a two-week period strikes a reasonable balance for assessing the reliability of measures, without introducing substantial changes in participants’ cognitive or situational contexts [35,36,37]. This approach aligns with established practices in reliability testing and enhanced the robustness of the study findings.
On the other hand, after reviewing the literature related to scale development research, it was observed that data collected from the sample were generally investigated using exploratory factor analysis (EFA) and confirmatory factor analysis (CFA) after splitting it into 2 subsets. For this reason, the dataset (n = 621) was divided into two independent samples. The first sample (n1 = 311) was utilized as an exploratory sample to help in constructing the scale, while the second sample (n2 = 310) served as a confirmatory sample specifically for validating the scale.

2.4. Process for Scale Development

The DRE scale was created at several stages. Initially, a preliminary pool of 27 items was created, covering a range of topics relating to digital readiness for an earthquake. The evaluation of content validity was performed using qualitative as well as quantitative approaches. A panel of six information technology (IT) specialists and three earthquake scientists with extensive knowledge of the study setting reviewed the 27-item draft questionnaire during the qualitative phase. It has been stated that the optimal number of experts to conduct a content validity analysis ranges from six to a maximum of ten individuals [38]. To further evaluate the scale’s content validity, each item was evaluated during the quantitative phase using the content validity ratio (CVR) and content validity index (CVI). To calculate the CVR, experts were asked to assign each item a score between 1 and 3 on a scale of “not necessary”, “helpful but not essential”, and “essential”, respectively. Each item was acceptable if its CVR exceeded Lawshe’s requirements; otherwise, it was removed. Using Lawshe’s threshold, the crucial CVR value for 9 experts was 0.78 [39]. The item content validity index (I-CVI) and scale content validity (S-CVI/Ave) were then examined using a 4-point scale for relevance, clarity, ambiguity, and simplicity (from 1: not relevant, not simple, doubtful, not clear to 4: extremely relevant, extremely simple, meaningful, very clear) [40,41,42]. An I-CVI of 0.78 or above was regarded as acceptable, whereas values below 0.7 were ruled unsuitable and hence removed, and lastly, values outside this range were corrected [41,43,44]. Acceptable S-CVI/Ave values as the averages of all I-CVIs were more than or equal to 0.90. The average CVR and I-CVI values for the entire scale were also computed both before and after item removal. Based on the obtained content validity rates and indices after the feedback from the experts, 6 items were considered less suitable for inclusion in the scale and were subsequently excluded. Thus, a trial form comprising 21 items rated on a 5-point Likert scale, ranging from “strongly agree” (5) to “strongly disagree” (1), was created. The scale did not include any items that were reversed for scoring. To assess the initial performance of the scale with 21 items, a pilot study was conducted. Whitehead et al. [45] stated that it is sufficient to select at least 30 participants for a pilot study who represent the target population. In the first stage, 35 participants were reached to carry out the pilot study, consisting of 21 males and 14 females, with an average age of 34.4 years (s = 11.3 years). The main purpose of the pilot study was to determine the readability and understandability of the items and whether the scale items were perceived similarly by different people. The interpretation guided decisions on refining, removing, or maintaining items in the scale as the study progressed to its main phase.
In this regard, a pilot study was conducted in a group of 35 people who showed similar characteristics to the main application sample. Table 2 shows the analysis results for the 21 items tested during the pilot study. Items with unclear wording, high variability, or extreme means may have needed to be revised based on descriptive statistics. The consistent and moderate means with lower standard deviations suggest that participants generally understood and responded similarly to the items. Moreover, the overall internal consistency of the scale was found to be high, as evidenced by a Cronbach’s alpha coefficient of 0.857. High internal consistency suggests that the items were highly correlated, and respondents consistently interpreted and responded to them similarly. A high Cronbach’s alpha in the context of a pilot study offers a preliminary indication that a scale is promising in terms of measuring what it is intended to evaluate, even at this early stage. It suggests that the items, as a set, are working well together. On the other hand, item–total correlations further confirmed the strength of the relationship between individual items and the total scale score, ranging from 0.439 to 0.748. Moderate to high item–total correlations in a pilot study suggest a strong association between individual items and the overall scale, indicating that the items are effectively contributing to the measurement of the intended construct. Face-to-face interviews with the same group of pilot study participants yielded qualitative insights. Participants consistently reported a clear understanding of the scale items and their responses during interviews, aligned with their quantitative responses. The qualitative information supported the face validity of the scale. These results provide additional perspective on how participants perceived the scale, indicating that it is consistent with face validity. As a result of the pilot study, all respondents comprehended the items clearly. Based on the input from the pilot participants, no more alterations were required. No items were deleted, the item order was not changed, and no changes were made to the items. These findings opened the door for the next stage of our investigation by confirming that the scale was ready for application in the main study. Additionally, questions were included to determine the demographic information of individuals (age, gender, marital status, country of residence, education level, economic level, job, use of social media, and frequency of following notifications on mobile phones) and their earthquake experience. And, the questionnaire also included the Earthquake Readiness Scale (ERS), which was developed by Spittal et al. [46] to determine the criterion validity of the DRE scale. To evaluate criterion validity for the DRE scale, the ERS was utilized as a reference criterion. The ERS is a well-established measurement tool developed to determine the general earthquake readiness of individuals. The reason for choosing ERS as the reference criterion was because of its comprehensive assessment of earthquake readiness, which serves as an important criterion in determining the accuracy of the DRE scale. Both the DRE scale and the ERS were administered to the same sample of participants for testing criterion validity. This allowed us to investigate how well the DRE scale matched the predetermined standards as measured by the ERS. Specifically, the correlation between scores obtained from the DRE scale and the ERS was assessed. A strong and positive correlation would indicate that our digital readiness scale effectively measured earthquake readiness in alignment with a well-established criterion.

2.5. Data Analysis

In the initial phase of analysis, whether the items were normally distributed was examined by assessing their skewness and kurtosis values. Typically, consideration of item normality involves assessing skewness within the range of −2.00 to 2.00 and kurtosis between −7.00 and 7.00. The values computed for the items’ skewness and kurtosis fell between −2.00 to 2.00 and 7.00 to 7.00, correspondingly. According to a general guideline, there is a requirement for at least ten participants for each item on a scale [47,48]. For the analysis, a scale containing 21 items was used after removing 6 items in accordance with the content validity analysis. As seen in scale development studies for determination of sample size, at least 10 participants for each item are sufficient. Others have suggested a range of 200–300 participants as appropriate for factor analysis [49,50]. Therefore, at least 21 × 10 = 210 people could be sufficient for our study, and both requirements were met by including 311 people for the EFA and 310 people for the CFA separately in our study. In the process of scale development, EFA was conducted on the explanatory sample (n1 = 311) to separate items that loaded more than one dimension and that did not measure the structure [51]. This analysis aimed to reduce the variables from the relevant factors (dimensions) to a smaller number of meaningful and independent factors. Initially, the suitability of the dataset for factor analysis was assessed by conducting Bartlett’s sphericity test and calculating the Kaiser–Meyer–Olkin (KMO) coefficient. The aspects of the scale’s construct validity were then examined using EFA through principal component analysis (PCA) over oblimin rotation. In scale development studies, the purpose of splitting data into two subsets and then conducting EFA and CFA is to discover and verify the internal structural features of the scale. First, with EFA, an exploratory phase is carried out to determine the basic structural features such as the number, relationships, and characteristics of the factors within the scale. Utilizing EFA on the first subset of the dataset aimed to allow the data to guide the identification of potential underlying factors related to digital readiness toward earthquakes. Then, CFA was used to determine how well the structural model represented the data, first determined during the EFA, as well as for the verification of this structural model and its ability to be generalized. Dividing the sample into two strengthened the process of assessing the stability and generalizability of the resulting factor structure, which provided a solid basis for the reliability and validity of the scale. Moreover, Anderson and Gerbing [52] indicated in their paper that “[i]deally, a researcher would want to split a sample, using one half to develop a model and the other half to validate the solution obtained from the first half” (p. 421). In other words, in the CFA phase of scale development, the extent to which the structures detected in the EFA result are confirmed with the data collected for the study is determined [53]. The CFA analysis was conducted on the second sample (n2 = 310), which was the confirmatory sample. In this study, the Chi-square (χ2), normed Chi-square (χ2/df), root-mean-square error of approximation (RMSEA), standardized root-mean-square residual (SRMR), normed fit index (NFI, 1 ), incremental fit index (IFI, 2 ), Bollen’s 1986 non-normed fit index ( ρ 1 ) the non-normed fit index (NNFI, ρ 2 ) comparative fit index (CFI), incremental fit index (IFI), goodness-of-fit index (GFI), and adjusted goodness-of-fit index (AGFI) were examined for CFA [54,55,56]. The complete scale, dimensions, and scale items within each dimension were individually examined regarding convergent and discriminant validity and reliability after the factor analysis. To prove convergent validity, it is recommended that both the composite reliability (CR) and Cronbach’s alpha (Cα) values for each construct exceed 0.70 [57]. Moreover, the average variance extracted (AVE) value for each factor should be greater than 0.50 [58]. The Fornell–Larcker criteria [58] and heterotrait–monotrait (HTMT) correlation ratio [59] criterion procedures were used to test discriminant validity. The square root of the AVE value for each item was compared with the correlation between the factors following the Fornell–Larcker criterion to determine if the scale had discriminant validity. These comparisons resulted in the discriminant validity being guaranteed if the square root value of the AVE for each dimension exceeded the correlation value among the dimensions [58]. Furthermore, the HTMT criterion was utilized for different criteria for discriminant validity in addition to Fornell–Larcker [59]. HTMT scores that were extremely close to 1 indicated that there was not a valid discriminant. If the HTMT score was less than the threshold value of 0.85, it may be said that the discriminant validity was satisfied. Moreover, the reliability of the analysis using several metrics was assessed. Internal consistency scores were determined by calculating the Spearman–Brown coefficient and Cα. In this context, a Cα of 0.70 or higher was considered sufficient for the reliability of the scale scores [60]. A Spearman–Brown split-half coefficient within the range of 0.80 to 0.90 is considered a reliable and acceptable value for any well-constructed research instrument [61]. Additionally, retest reliability was determined by calculating various correlation coefficients. On the other hand, in the process of developing a scale, item analysis methods, such as the Cα if the item was removed, item–total correlation which explains the relationship between scores obtained from individual test items and the total score of the test, and square multiple correlation values, were evaluated. In general, items with item–total correlations of 0.30 or higher are known to effectively differentiate individuals. In a scale development study, a positive and high item–total correlation indicates that the items are related to similar behaviors, demonstrating the high internal consistency of a test. Another item analysis method used in this study was the independent samples t-test. In this test, the significant difference between the mean scores of items for the top 27% and bottom 27% groups based on total scores, as determined by an independent t-test, indicated a sign of internal consistency within groups. Therefore, both item analysis methods revealed the extent to which individuals were distinguished in terms of the behavior being measured. Statistical Package for the Social Sciences (SPSS) version 24, as well as R Studio version 4.1.1, were both used to perform all statistical analyses on the dataset.

3. Results

In this section of the study, the results relating to content validity results, construct validity by EFA, CFA, convergent and discriminant validity analyses, item analysis, and reliability analysis have been presented.

3.1. Content Validity Measures for the DRE Scale

As shown in Table 3, most of the items had content validity ratios (CVRs) between 0.8 and 1.0, except for six items (items 5, 8, 12, 14, 17, and 25), which had CVR values below 0.78. As a result, these six items were eliminated once it was determined they were unacceptable. Furthermore, these six items’ I-CVI values for simplicity, ambiguity, clarity, and relevance were below 0.78, whereas the I-CVI values of the 21 other items ranged from 0.8 to 1, surpassing 0.78. Before the exclusion of the six items, the mean CVI values for simplicity, ambiguity, clarity, and relevance were 0.756, 0.781, 0.774, and 0.785, respectively, resulting in an S-CVI/Ave of 0.774. Following the removal of these items, the mean CVI values for simplicity, ambiguity, clarity, and relevance increased to 0.957, 0.980, 0.986, and 0.995, respectively, and the S-CVI/Ave jumped to 0.980. Conversely, the mean CVR value was 0.622 before the removal of the six items, increasing to 0.952 (>0.78) after their exclusion. These findings collectively signify the enhancement of the overall scale after the elimination of these six items. In alignment with the content validity analysis, a 21-item version of the scale was derived through these steps.

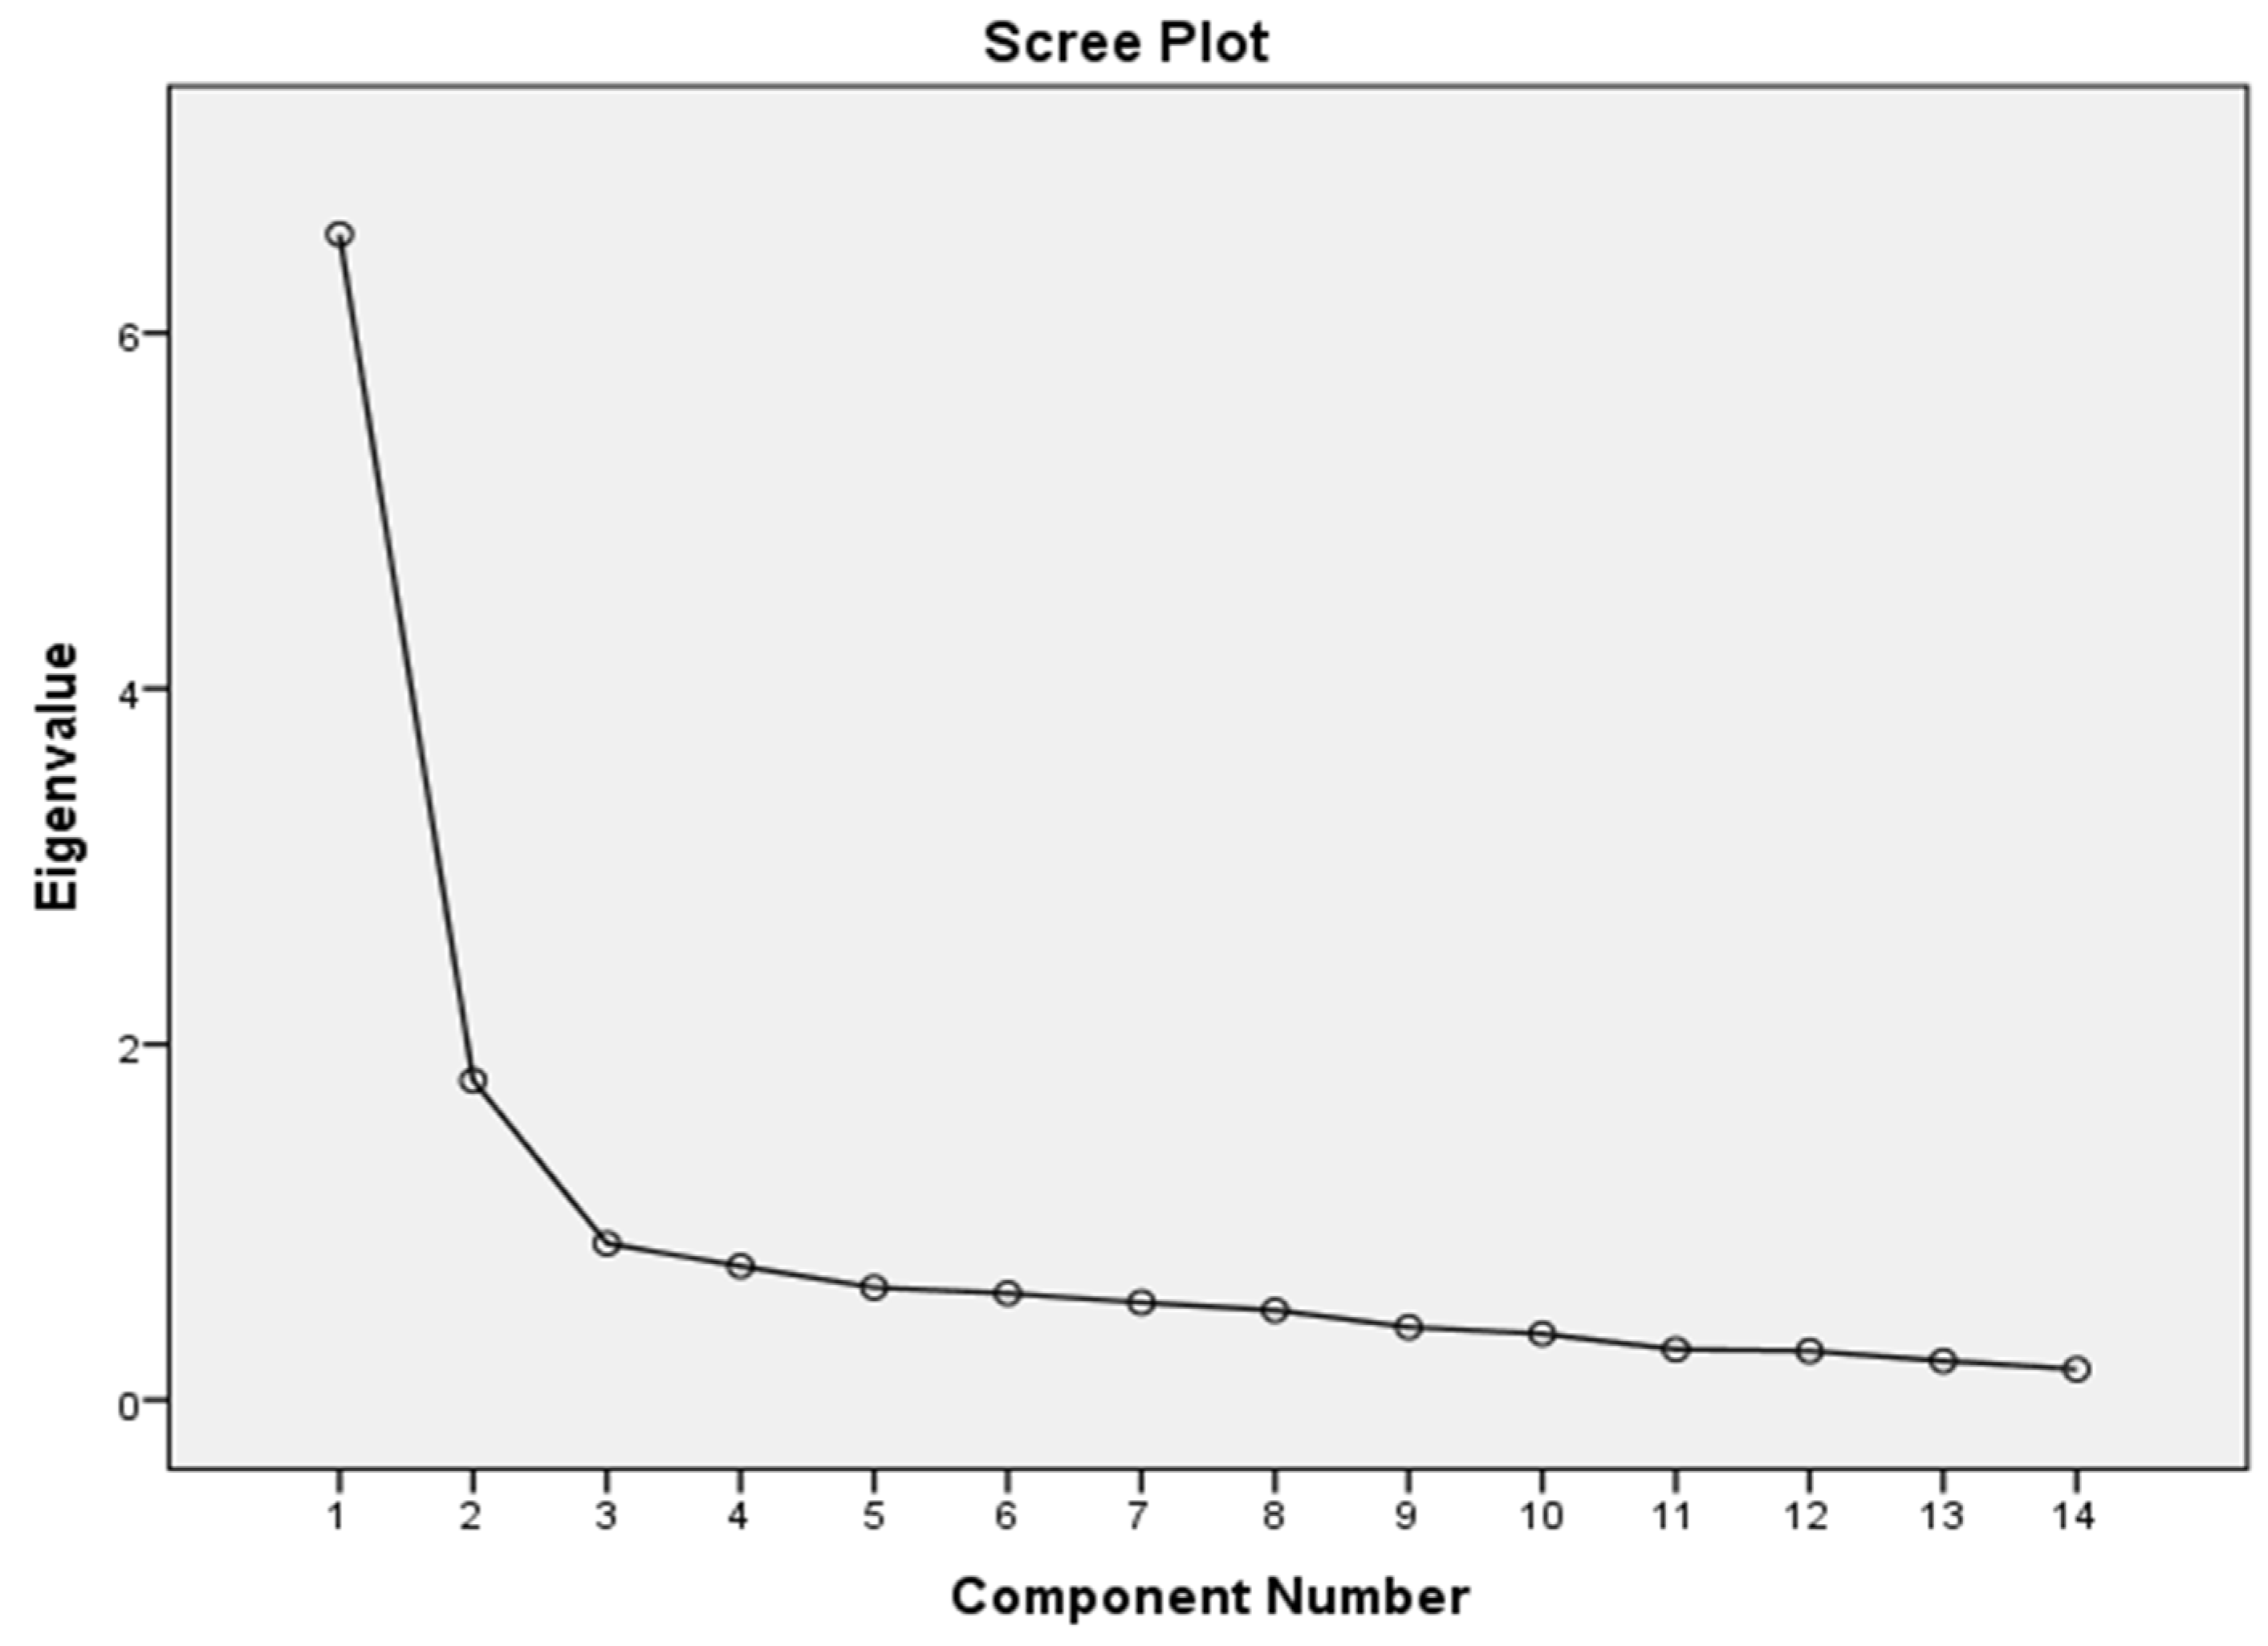
3.2. Construct Validity by EFA of the DRE Scale

Whether the data collected for the DRE scale was suitable for EFA was determined by evaluating the KMO sample adequacy measurement and Bartlett’s sphericity test results. The KMO coefficient gives information about the suitability of a data matrix in terms of factor analysis, and in general, the result should be higher than 0.80 [42]. The Barlett test, on the other hand, examines the relationship between variables based on partial correlations. According to the results of the analysis, it can be seen that the KMO value (0.894) and Bartlett’s sphericity test result (χ2 (91) = 2407.76, p < 0.001) showed the suitability of the data for EFA. In the next step, EFA was employed, utilizing PCA over oblimin rotation, to explore and determine the dimensional structure of the scale. Dimensions within the scale were identified based on specific indicators, including eigenvalues exceeding 1 and the examination of the scree plot. The scale’s factorability was assessed by examining the loadings and communalities of the 21 items. For factor loadings, a threshold value of 0.40 was used, and any values below 0.4 were ignored under this study. As per the instructions given in reference [62], items with communalities lower than 0.20 were also disregarded from the study. In addition, items that were found in more than one factor and whose factor loading difference was less than 0.10 were eliminated. Items with inappropriate factor loads were gradually removed. Since the factor loading of the item “I always carry a wireless charging unit (power bank) with me.” (λ = 0.258) was less than 0.40, it was discarded from the scale. On the other hand, because the other six items, “I have become a member of the groups that give information about earthquakes on social media.”, “I inform the people around me about earthquake-related mobile applications.”, “In the event of an earthquake, smartphones save lives.”, “I am equipped to use digital technologies to communicate with others in the event of an earthquake.” “I’m ready to use cutting-edge technology for earthquake safety.”, and “I view social media as a great source of information.” were found in more than one factor, these six items were also eliminated from the study. As a result, following the gradual removal of items with inadequate unsuitable factor loadings, the remaining 14 items were categorized into two dimensions based on whether their eigenvalues exceeded 1, as indicated in Table 4. The explained variance was 46.823% (eigenvalue = 6.555) in the first factor, while it was 12.832% (eigenvalue = 1.796) in the second factor, and the total variance was 59.655%. When the scree plot in Figure 5 is examined, it can be observed that the slope turns horizontal starting from the 2nd factor. Therefore, the scree plot’s result suggests that the scale exhibited a two-factor structure, as depicted in Figure 5. After analyzing the scale’s items within these dimensions, the labels “Technological Skills” of the first dimension, comprising eight items, and “Digital Attitudes” of the second dimension, consisting of six items, were assigned. The factor loadings for these items ranged from 0.562 to 0.900, while communalities varied from 0.429 to 0.685, as summarized in Table 4. It was calculated that the mean of the items in the first dimension, “Technological Skills”, with a standard deviation, was 3.76 (0.79), and the average of the items in the second dimension, “Digital Attitudes”, with a standard deviation, was 3.52 (0.75). Additionally, two dimensions were significantly positively correlated (r = 0.659, p < 0.001). However, it is important to check to what extent the EFA results matched the CFA results.

3.3. CFA Results

CFA testified and verified the validity of the factor structures obtained as a result of EFA on a confirmatory sample (n2 = 310). The two-factor structure of the 14-item DRE scale was tested using the maximum likelihood estimation method. In this research, various model fit measures were considered, including the Chi-square (χ2), normed Chi-square (χ2/df), root-mean-square error of approximation (RMSEA), standardized root-mean-square residual (SRMR), normed fit index (NFI, 1 ), incremental fit index (IFI, 2 ), Bollen’s 1986 non-normed fit index ( ρ 1 ), the non-normed fit index (NNFI, ρ 2 ), comparative fit index (CFI), incremental fit index (IFI), goodness-of-fit index (GFI), and adjusted goodness-of-fit index (AGFI), to assess the adequacy of the model. According to the confirmatory factor analysis results in Table 5, the fit measure values of the DRE scale were obtained as the following: χ2/df = 1.856; RMSEA = 0.0654; SRMR = 0.0389; ρ 1 = 0.9711 ;   Δ 1 = 0.9759 ; ρ 2 = 0.9865 ;   Δ 2 = 0.9887 ;   C F I = 0.9886 ;   G F I = 0.9385 ; a n d     A G F I = 0.9296 . The RMSEA and GFI values were acquired within the acceptable fit range, while the other values were obtained within the excellent fit range, yielding very good results, following the cutoff values listed in the table. The proposed two-factor model for the DRE scale is supported (confirmed) by all of the fit measure values, indicating an excellent fit and suitability of the application.

3.4. Convergent and Discriminant Validity

Each dimension must exhibit CR and Cα values above 0.70 to show convergent validity [57]. Additionally, each factor’s AVE should be at least 0.50 [58]. In our analysis, it was observed that the AVE value of the “Technological Skills” dimension was higher than 0.5 (AVE = 0.609), as well as the Cα = 0.910 and CR = 0.926 values, which were higher than 0.7. Likewise, “Digital Attitudes” also had an AVE that exceeded 0.50 (AVE = 0.525), and the Cα = 0.837 and CR = 0.865 values were higher than 0.7, as seen in Table 6. The Fornell–Larcker [58] and HTMT [59] criterion procedures were used to investigate discriminant validity. The square root of the average variance extracted (AVE) value for each dimension was compared with the correlation between the dimensions in accordance with the Fornell–Larcker criterion to determine whether the scale had discriminant validity. These comparisons resulted in the discriminant validity being guaranteed if the square root value of AVE for each factor was greater than the correlation coefficient among the dimensions [58]. The alternative test for discriminant validity was the HTMT ratio of correlation. It has been determined that discriminant validity does not exist if HTMT values are approaching 1 closely. Exceeding the 0.85 threshold for HTMT values suggests a lack of discriminant validity. However, our evaluation of the developed DRE scale’s discriminant validity, using both the Fornell–Larcker criterion and HTMT criterion, yielded positive results, as seen in Table 7. According to the Fornell–Larcker criterion, the square root of the AVE values for the dimensions (Technological Skills = 0.780, Digital Attitudes = 0.725) exceeded the correlation coefficient between the dimensions (r = 0.659), demonstrating satisfactory discriminant validity. Additionally, the HTMT value (0.625) was below the 0.85 threshold, further confirming that discriminant validity was met according to the HTMT criterion as well.

3.5. Criterion-Related Validity of the DRE Scale

The correlation analysis result for examining criterion validity showed that there was a significant positive relationship between the DRE scale and ERS (r = 0.634, p < 0.001). Due to the significant positive correlation result obtained with the reference criterion, ERS, it can be concluded that the scale demonstrates concurrent criterion validity.

3.6. Reliability Assessment for the DRE Scale

The internal consistency of the DRE scale was found to be strong, as evidenced by a Cα value of 0.910 for all 14 items. When examining the two dimensions of the DRE scale separately, both the “Technological Skills”, consisting of eight items (Cα = 0.910), and “Digital Attitudes”, consisting of six items (Cα = 0.837), demonstrated robust internal consistency. Moreover, the removal of any individual item from either dimension did not significantly impact the Cα values. Additionally, the Spearman–Brown split-half reliability coefficient for all items of the DRE scale was strong (r = 0.785). Both DRE scale dimensions also displayed favorable values, from 0.875 (Technological Skills) to 0.807 (Digital Attitudes) for the Spearman–Brown split-half reliability coefficient. To evaluate test–retest reliability, Pearson’s r and the intraclass correlation coefficient were computed based on DRE scale scores from 150 participants who filled out the questionnaire twice with a two-week interval. The findings highlighted the consistency of the DRE scale scores across the two-week interval, as shown by the intraclass correlation coefficient (0.991, p < 0.001) and Pearson’s r (0.984, p < 0.001).

3.7. Analyzing Items in the DRE Scale

The results of the item analysis are detailed in Table 8 and Table 9. Table 8 shows that when the 14 items were run through an independent samples t-test and the mean scores of the top 27% (n = 84) and bottom 27% (n = 84) groups were compared, significant differences were identified. The DRE scale’s items have high validity and efficiently measure the same underlying construct, according to the t-test results, which ranged from 9.136 (p < 0.001) to 15.067 (p < 0.001). As a result of the item analysis, every item in the scale distinguishes between those who have and do not have the specific attribute. On the other hand, as shown in Table 9, the item–total correlations displayed a range of 0.492 to 0.708 across all items in the scale. Impressively, every item’s correlation coefficient with the total score exceeded the threshold of 0.300, which indicates their strong contribution to the scale’s reliability. The item–total correlations exceeded 0.300 for both subfactors as well. In addition, the squared multiple correlation values of the items varied between 0.359 and 0.718, and these values being greater than 0.20 are sufficient within the scope of item analysis [63]. Items with high item–total correlations and SMC values are often strongly related to the relevant construct and significantly contribute to a scale’s reliability and validity. Furthermore, systematically removing each item from the scale and calculating their Cα revealed that none of the resulting alpha values surpassed the overall alpha value of 0.910. It is important to note that this pattern continued when performing this analysis for each subfactor separately. These illuminating results from the item analysis highlight the necessity of keeping all 14 items from the DRE scale. These findings show that each item of the scale was compatible with the construct being measured and made a positive contribution to the reliability and validity of the scale.

4. Discussion

The process of developing scales is essential to the advancement of knowledge in human and social sciences. Scales are useful instruments for assessing thoughts, emotions, and perspectives in quantifiable forms [64,65]. In this study, a valid and reliable scale was developed that can determine the technological skills and digital attitudes that individuals need to have to use technological systems, apps, and devices to create digital readiness against earthquakes. Emerging technologies have the potential to mitigate the effects of earthquakes and improve response and recovery efforts. However, individuals need to have the technological skills and digital attitudes to use them. The comprehensive validity and reliability of the developed novel scale are scientifically proven and it can be used for evaluating individuals’ digital readiness toward earthquakes for future studies. An earthquake is defined as “unexpected vibration movements occurring on the earth’s surface” [66] and it poses severe dangers. It is important that efforts to increase individuals’ earthquake awareness be carried out without wasting time. First of all, a knowledge base that will provide useful information about earthquakes should be created [67]. Later, as Uludag [6] emphasizes, it will be of great benefit to include geography and earthquake courses in the curriculum in schools. In addition, when planning earthquake preparedness training programs, people with low education levels should also be taken into consideration and should be organized accordingly [68]. In addition, when planning earthquake-related training, care should be taken to include emotional elements [6]. This is because people are also negatively affected emotionally by an earthquake [69]. Subedi et al. [70] pointed out that through scientific education, individuals and therefore communities can reduce the risks associated with earthquakes.
Uludag [6] emphasized that governments should set strict rules in building construction, especially since it was seen that the quality of the buildings played an important role in the great damage caused by the great earthquake in Kahramanmaraş. Earthquakes occur worldwide and lead to severe human and economic losses. For example, according to Statista’s report [71], the earthquake that struck Tohoku, Japan, in 2011 resulted in the highest economic losses, totaling USD 210 billion. Additionally, the earthquake in 2008 in China caused the second-highest economic damages of USD 85 billion. Subsequently, the earthquake that occurred in Turkey/Syria in 2023 resulted in USD 34 billion in damages. On the other hand, according to Statista’s report [72], when examining the earthquakes that have led to the most fatalities, the 1976 Tangshan earthquake in China stands out with a recorded death toll of 242,000. Following closely, the 2010 earthquake in Haiti comes in second place with a death toll of 222,570. Moreover, as stated in the Kahramanmaraş earthquake situation report published by ReliefWeb [73], three months after the earthquake centered in Kahramanmaraş, the Ministry of the Interior of the Republic of Turkey released its latest statement, reporting a death toll of 50,783 and 107,000 injuries resulting from the earthquake centered in Kahramanmaraş. Necessary government policies must be established urgently to reduce the damages caused by earthquakes [6]. In addition, it is inevitable that the necessary work should be started immediately so that the quality construction of new buildings, the control of existing buildings, and informing the public about earthquakes become the main focus of government policies.
In addition, studies conducted in Turkey show that individuals’ earthquake awareness and preparedness are insufficient. In Ref. [74], it was determined that the earthquake preparedness levels of university staff were insufficient. Additionally, Yildiz et al. [75] concluded in their study that children did not have sufficient knowledge about the correct actions to be taken during a disaster. However, when studies on earthquakes in the literature were examined, it was seen that studies investigating how earthquake preparedness could be improved upon were not sufficient [6]. However, Mermer et al. [76] found that individuals’ earthquake knowledge and preparedness scores increased with earthquake training. For this reason, using the developed scale, the digital attitudes and technological skills of individuals should be identified, and initiatives such as workshops, seminars, public service announcements, etc., should be promptly organized to enhance technological competence, enabling the public to benefit from technology before, during, and after earthquakes, with immediate planning and initiation.
The DRE scale is aimed at determining individuals’ digital attitudes and technological skills toward earthquake-related smartphone technologies. Policymakers can organize seminars, workshops, or similar events if the scale reveals that individuals lack the necessary digital attitudes and skills to use technologies in smartphones such as GPS and Bluetooth. Additionally, based on the data obtained through the implementation of the scale, earthquake-related policies and initiatives can be developed in the desired direction. On the other hand, educators can identify areas of improvement in digital literacy related to earthquake readiness by integrating the scale into educational programs and customizing their curricula accordingly. Data collected using the scale can guide the design of specific training programs to address specific gaps in digital attitudes or technological skills in communities, with the assistance of educators in raising public awareness of the field. Moreover, emergency responders can provide immediate help and support to those affected (they can call for help, the location of those affected can be determined) and their suffering can be minimized. Namely, assessing and understanding individuals’ digital readiness against earthquakes can help create more effective communication strategies. Consequently, the DRE scale can provide a practical tool for shaping earthquake policies, developing emergency response strategies, and guiding education efforts to build a more resilient society in earthquake-prone regions.
On the other hand, evaluating the applicability of the DRE scale in different geographic and cultural contexts is a significant aspect of its general usability. The scale was meticulously developed to determine the digital readiness of individuals toward earthquakes, but its effectiveness may vary in different regions and cultural environments. An important issue is examining the differences between the digital readiness levels of individuals in different geographical regions and evaluating the general applicability of the scale, especially considering the differences in earthquake frequency, technological infrastructure, and cultural norms in these regions. Understanding geographic and cultural diversity is important for providing greater insight into the universality and general validity of the scale. In this context, future research aims to increase the adaptability of the scale to a wide range of uses by examining in more detail how the DRE scale performs in different geographical and cultural contexts. Furthermore, the generalizability of the results to other disasters or emergencies was examined. Although this research focused on the development of a Digital Readiness toward Earthquakes scale, it is important to evaluate the potential for the general applicability of the results obtained for other disaster or emergency events. The comprehensive process followed in creating the DRE scale meticulously examined individuals’ digital attitudes and skills in the context of earthquakes, and these findings can provide insight into various disaster or emergency events (e.g., fire, flood, tsunami, epidemic, etc.). In other words, it is thought that the insights obtained from this study may shed light on the readiness of individuals for different emergency events. However, because understanding the specifics and details of each disaster type is critical, future research could increase the broader applicability of the developed scale by examining how the DRE scale can be adapted and validated in different disaster scenarios.
Furthermore, the scale includes items related to the digital attitudes and technological skills that individuals should have regarding earthquake-related technologies. Before, during, and after an earthquake, the use of earthquake-related smartphone technologies to alleviate or minimize individuals’ distress may require Internet connectivity in some cases, while in others, it may not be necessary. In regions where technological infrastructure may not be sufficiently developed and there is a high probability of complete loss of Internet connectivity during earthquakes, the scale incorporates items addressing the potential use of applications for those affected to seek help, provide location information, and other relevant scenarios. However, studies are planned to generalize the scale by making necessary adjustments based on data collected using the scale in regions with different technological capabilities. Additionally, it is recognized that cultural differences play a significant role in shaping individuals’ digital attitudes and technological skills. Therefore, future work is planned to enhance the cross-cultural applicability of the scale by validating and adapting it to different cultural contexts.

5. Conclusions

The last earthquake centered in Kahramanmaraş once again reminded the whole world that societies should carry out the necessary checks regarding earthquakes (e.g., building stability, building suitability, etc.), individuals should be aware of earthquakes, and advanced technologies should be used wherever possible immediately. It can be said that new technology trends have positive effects on all sectors and will be useful in minimizing both life and property losses from earthquakes. But first of all, in order for societies to be digitally ready, individuals’ technological skills and digital attitudes need to be determined. However, the scale to be used for this purpose needs to be developed. In this study, a valid and reliable scale was developed that can determine the technological skills and digital attitudes that individuals need to have in order to use technological systems, apps, and devices in order to create digital readiness against earthquakes. At the end of this descriptive research, the comprehensive results proved that the developed scale is valid and reliable for scientific research. We hope that the developed novel scale will be used by researchers to investigate individuals’ digital readiness in response to earthquakes and if these needs determine training on earthquakes. Furthermore, by determining the digital preparedness of individuals within the community through the developed scale, improvements in earthquake response mechanisms and the effective reduction in risks can be achieved. Moreover, the data collected with the newly developed scale will empower communities and decision-makers with valuable insights, assisting them in establishing more resilient and responsive disaster management practices.
Just as every study has Its limitations, this study was limited to the items used in the developed scale and the smartphone technologies used such as apps related to earthquakes. The developed scale items are limited to mobile applications associated with earthquakes, including early earthquake warnings, GPS, Bluetooth, earthquake prediction, emergency calls, earthquake location notification, earthquake training, and social media. On the other hand, while the focus of this study was on technological skills and digital attitudes related to earthquakes, it may not have covered a broader spectrum which includes factors like access to technology, education, and socioeconomic concerns affecting digital readiness toward earthquakes. The subjective nature of the interpretation of factors such as “Technological Skills” and “Digital Attitudes” based on the judgment of the researchers is also an inherent limitation of this study.
In the future, it is recommended that researchers investigate technological integration/usage with other related issues such as preparedness, response, and recovery. Also, it is suggested that researchers focus on which technology can be used in which process/stage in other earthquake-related subjects such as preparedness, response, and recovery in the future. Moreover, exploring the applicability of the scale in different cultural contexts or testing its effectiveness in predicting actual digital readiness behaviors during earthquake events is recommended for further investigation.
On the other hand, it is recommended that researchers investigate awareness, attitudes, skills, and competencies, etc., that individuals must have in order to use technologies effectively and efficiently for earthquake preparedness, response, and recovery. And if a scale is needed, further scales must be developed. Also, it is suggested that the government develop policies on technology usage in earthquakes for preparedness, response, and recovery for future disasters.

Author Contributions

Conceptualization, N.S. and N.C.; methodology, N.S. and N.C.; validation, N.S. and N.C.; formal analysis, N.S. and N.C.; investigation, N.S. and N.C.; data curation, N.S.; writing—original draft preparation, N.S. and N.C.; writing—review and editing, N.S. and N.C. All authors have read and agreed to the published version of the manuscript.

Funding

This research received no external funding.

Institutional Review Board Statement

This study was approved by the Scientific Research Ethics Committee of Near East University (NEU/AS/2023/194).

Informed Consent Statement

Informed consent was obtained from all subjects involved in the study.

Data Availability Statement

The data that support the findings of this study are available upon request from the corresponding author.

Conflicts of Interest

The authors declare no conflicts of interest.

References

  1. Sarı, H.; Özel, M.; Akkoç, M.F.; Şen, A. First-week analysis after the Turkey earthquakes: Demographic and clinical outcomes of victims. Prehosp. Disaster Med. 2023, 38, 294–300. [Google Scholar] [CrossRef] [PubMed]
  2. Wu, J.; He, X.; Li, Y.; Shi, P.; Ye, T.; Li, N. How earthquake-induced direct economic losses change with earthquake magnitude, asset value, residential building structural type and physical environment: An elasticity perspective. J. Environ. Manag. 2019, 231, 321–328. [Google Scholar] [CrossRef] [PubMed]
  3. Oduoye, M.O.; Nazir, A.; Gharaibeh, R.S.; Yoruk, E.; Sulakci, A.B.; Nafula, W.P.; Akilimali, A. Devastating earthquake in Turkey: A call for global action. Int. J. Surg. Glob. Health 2023, 6, e128. [Google Scholar] [CrossRef]
  4. Jia, Z.; Jin, Z.; Marchandon, M.; Ulrich, T.; Gabriel, A.-A.; Fan, W.; Shearer, P.; Zou, X.; Rekoske, J.; Bulut, F.; et al. The complex dynamics of the 2023 Kahramanmaraş, Turkey, Mw 7.8-7.7 earthquake doublet. Science 2023, 381, 985–990. [Google Scholar] [CrossRef] [PubMed]
  5. AFAD—Ministry of Interior Disaster and Emergency Management Presidency. Press Bulletin 13.02.2023 about the Earthquake in Kahramanmaraş—29. Available online: https://en.afad.gov.tr/pressbulletin-29-about-the-earthquake-in-kahramanmaras (accessed on 27 September 2023).
  6. Uludag, K. Improving Earthquake Awareness and Preparedness Concerning Building Houses in Turkey. 2023. [CrossRef]
  7. Eraybar, K.; Okazaki, K.; Ilki, A. An exploratory study on perceptions of seismic risk and mitigation in two districts of Istanbul. Disasters 2010, 34, 71–92. [Google Scholar] [CrossRef]
  8. Ersoy, Ş.; Koçak, A. Disasters and earthquake preparedness of children and schools in Istanbul, Turkey. Geomat. Nat. Hazards Risk 2016, 7, 1307–1336. [Google Scholar] [CrossRef]
  9. Fauzi, M.A. Social media in disaster management: Review of the literature and future trends through bibliometric analysis. Nat. Hazards 2023, 118, 953–975. [Google Scholar] [CrossRef]
  10. Sakurai, M.; Murayama, Y. Information technologies and disaster management–Benefits and issues. Prog. Disaster Sci. 2019, 2, 100012. [Google Scholar] [CrossRef]
  11. Kontoni, D.P.N.; Kumar, A.; Arora, H.C.; Jahangir, H.; Kapoor, N.R. Damage detection in reinforced concrete structures using advanced automatic systems: An overview. In Automation in Construction toward Resilience: Robotics, Smart Materials and Intelligent Systems; Farsangi, E.N., Noori, M., Yang, T.T.Y., Lourenço, P.B., Gardoni, P., Takewaki, I., Chatzi, E., Li, S., Eds.; CRC Press: Boca Raton, FL, USA, 2023; pp. 469–484. [Google Scholar]
  12. Ayotunde, O.O.; Jamil, D.I.; Cavus, N. The impact of artificial intelligence in foreign language learning using learning management systems: A systematic literature review. Inf. Technol. Learn. Tool 2023, 95, 215–228. [Google Scholar] [CrossRef]
  13. Lee, C.-C.; Chen, M.-P.; Yuan, Z. Is information and communication technology a driver for renewable energy? Energ. Econ. 2023, 124, 106786. [Google Scholar] [CrossRef]
  14. Arjmand, B.; Rabbani, Z.; Soveyzi, F.; Tayanloo-Beik, A.; Rezaei-Tavirani, M.; Biglar, M.; Adibi, H.; Larijani, B. Advancement of organoid technology in regenerative medicine. Regen. Eng. Transl. Med. 2023, 9, 83–96. [Google Scholar] [CrossRef] [PubMed]
  15. Said, S.H.; Dida, M.A.; Kosia, E.M.; Sinde, R.S. A blockchain-based conceptual model to address educational certificate verification challenges in Tanzania. Eng. Technol. Appl. Sci. Res. 2023, 13, 11691–11704. [Google Scholar] [CrossRef]
  16. Theilen-Willige, B.; Savvaidis, P.; Tziavos, I.N.; Papadopoulou, I. Remote Sensing and Geographic Information Systems (GIS) contribution to the inventory of infrastructure susceptible to earthquake and flooding hazards in North-Eastern Greece. Geosciences 2012, 2, 203–220. [Google Scholar] [CrossRef]
  17. Muniz-Rodriguez, K.; Ofori, S.K.; Bayliss, L.C.; Schwind, J.S.; Diallo, K.; Liu, M.; Yin, J.; Chowell, G.; Fung, I.C. Social. media use in emergency response to natural disasters: A systematic review with a public health perspective. Disaster Med. Public. Health Prep. 2020, 14, 139–149. [Google Scholar] [CrossRef]
  18. Allen, R.M.; Melgar, D. Earthquake early warning: Advances, Scientific Challenges, and Societal Needs. Annu. Rev. Earth Planet. Sci. 2019, 47, 361–388. [Google Scholar] [CrossRef]
  19. Wu, Y.M.; Chen, D.Y.; Lin, T.L.; Hsieh, C.Y.; Chin, T.L.; Chang, W.Y.; Li, W.S.; Ker, S.H. A high density seismic network for earthquake early warning in Taiwan based on low cost sensors. Seismol. Res. Lett. 2013, 84, 1048–1054. [Google Scholar] [CrossRef]
  20. Strauss, J.A.; Allen, R.M. Benefits And Costs Of Earthquake Early Warning. Seismol. Res. Lett. 2016, 87, 765–772. [Google Scholar] [CrossRef]
  21. Kalaycı, İ.; Çokgüngör, H.Ö. Technological, political and economic lessons from Japan to Turkey against the destructive effects of the earthquake. Sci. Collect. 2023, 156, 11–15. Available online: https://archive.interconf.center/index.php/conference-proceeding/article/view/3438 (accessed on 27 September 2023).
  22. Kodera, Y.; Hayashimoto, N.; Tamaribuchi, K.; Noguchi, K.; Moriwaki, K.; Takahashi, R.; Morimoto, M.; Okamoto, K.; Hoshiba, M. Developments of the nationwide earthquake early warning system in Japan after the 2011 Mw 9.0 Tohoku-Oki earthquake. Front. Earth Sci. 2021, 9, 726045. [Google Scholar] [CrossRef]
  23. Kuncoro, T.; Ichwanto, M.A.; Muhammad, D.F. VR-based learning media of earthquake-resistant construction for civil engineering students. Sustainability 2023, 15, 4282. [Google Scholar] [CrossRef]
  24. Raccanello, D.; Vicentini, G.; Brondino, M.; Burro, R. Technology-Based Trainings on Emotions: A Web Application on Earthquake-Related Emotional Prevention with Children. In Advances in Intelligent Systems and Computing, Proceedings of the 9th International Conference on Methodologies and Intelligent Systems for Technology Enhanced Learning, MIS4TEL 2019, Avila, Spain, 26–28 June 2019; Gennari, R., Vittorini, P., Prieta, F., Mascio, T.D., Temperini, M., Silveira, R.A., Carranza, D.A.O., Eds.; Springer: Cham, Switzerland, 2020; Volume 1007. [Google Scholar] [CrossRef]
  25. Sumy, D.F.; Jenkins, M.R.; McBride, S.K.; de Groot, R.-M. Typology development of earthquake displays in free-choice learning environments, to inform earthquake early warning education in the United States. Int. J. Disast Risk Reduct. 2022, 73, 102802. [Google Scholar] [CrossRef]
  26. Kirci, P.; Arslan, D.; Dincer, S.F. A communication, management and tracking mobile application for enhancing earthquake preparedness and situational awareness in the event of an earthquake. Sustainability 2023, 15, 970. [Google Scholar] [CrossRef]
  27. Singh, M.K.; Samah, N.A. Impact of smartphone: A review on positive and negative effects on students. Asian Soc. Sci. 2018, 14, 83–89. [Google Scholar] [CrossRef]
  28. Statista’s. Number of Smartphone Users Worldwide from 2013 to 2028. 2023. Available online: https://www.statista.com/forecasts/1143723/smartphone-users-in-the-world (accessed on 17 October 2023).
  29. Prodanova, J.; Chopdar, P.K. The interplay of app characteristics and smartphone addiction in mobile shopping behaviour. Int. J. Consum. Stud. 2023. [Google Scholar] [CrossRef]
  30. Cavus, N.; Mohammed, Y.B.; Bulama, M.; Isah, M.L. Examining user verification schemes, safety and secrecy issues affecting m-banking: Systematic literature review. SAGE Open 2023, 13, 1–18. [Google Scholar] [CrossRef]
  31. Kaggle. All the Earthquakes Dataset: From 1990–2023. 2023. Available online: https://www.kaggle.com/datasets/alessandrolobello/the-ultimate-earthquake-dataset-from-1990-2023/ (accessed on 13 December 2023).
  32. Statista. Development of the Number of Earthquakes (M5+) Worldwide from 2000 to 2021. 2023. Available online: https://www.statista.com/statistics/263105/development-of-the-number-of-earthquakes-worldwide-since-2000/ (accessed on 13 December 2023).
  33. Statista. Number of Earthquakes in Turkey from 1990 to 2023. 2023. Available online: https://www.statista.com/statistics/1309531/turkey-number-of-earthquakes/ (accessed on 23 November 2023).
  34. Statista. Earthquakes with the Highest Magnitude in Turkey from 1912 to 2023. 2023. Available online: https://www.statista.com/statistics/1368153/turkey-earthquakes-with-the-highest-magnitude/ (accessed on 23 November 2023).
  35. Streiner, D.L.; Norman, G.R.; Cairney, J. Health Measurement Scales. In A Practical Guide to Their Development and Use, 4th ed.; Oxford University Press: New York, NY, USA, 2014. [Google Scholar]
  36. Neuhaus, C.; Camathias, C.; Mumme, M.; Faude, O. The German version of the KOOS-Child questionnaire (Knee injury and Osteoarthritis Outcome Score for children) shows a good to excellent internal consistency and a high test–retest reliability in children with knee problems. Knee Surg. Sports Traumatol. Arthrosc. 2023, 31, 1354–1360. [Google Scholar] [CrossRef] [PubMed]
  37. Munis, Ö.B.; Parlak, M.M. Validity and reliability of the Turkish version of the Holden Communication Scale. Brain Behav. 2023, 13, e3223. [Google Scholar] [CrossRef] [PubMed]
  38. Yusoff, M.S.B. ABC of content validation and content validity index calculation. Educ. Med. J. 2019, 11, 49–54. [Google Scholar] [CrossRef]
  39. Lawshe, C.H. A quantitative approach to content validity. Pers. Psychol. 1975, 28, 563–575. [Google Scholar] [CrossRef]
  40. Yaghmaie, F. Content validity and its estimation. J. Med. Educ. 2003, 3, 25–27. Available online: https://scirp.org/reference/referencespapers.aspx?referenceid=2384151 (accessed on 5 April 2023).
  41. Polit, D.F.; Beck, C.T.; Owen, S.V. Is the CVI an acceptable indicator of content validity? Appraisal and recommendations. Res. Nurs. Health 2007, 30, 459–467. [Google Scholar] [CrossRef] [PubMed]
  42. Namlu, A.G.; Odabasi, F. Unethical computer using behaviour scale: A study of reliability and validity on Turkish university students. Comput. Educ. 2007, 48, 205–215. [Google Scholar] [CrossRef]
  43. Lynn, M.R. Determination and quantification of content validity. Nurs. Res. 1986, 35, 382–385. [Google Scholar] [CrossRef] [PubMed]
  44. Cavus, N.; Sancar, N. The Importance of Digital Signature in Sustainable Businesses: A Scale Development Study. Sustainability 2023, 15, 5008. [Google Scholar] [CrossRef]
  45. Whitehead, A.L.; Julious, S.A.; Cooper, C.L.; Campbell, M.J. Estimating the sample size for a pilot randomised trial to minimise the overall trial sample size for the external pilot and main trial for a continuous outcome variable. Stat. Methods Med. Res. 2016, 25, 1057–1073. [Google Scholar] [CrossRef] [PubMed]
  46. Spittal, M.J.; Walkey, F.H.; McClure, J.; Siegert, R.J.; Ballantyne, K.E. The earthquake readiness scale: The development of a valid and reliable unifactorial measure. Nat. Hazards 2006, 39, 15–29. [Google Scholar] [CrossRef]
  47. Tabachnick, B.G.; Fidell, L.S. Experimental Designs Using ANOVA; Thomson/Brooks/Cole: Belmont, CA, USA, 2007. [Google Scholar]
  48. Nunnally, J.C. Pyschometric Theory; McGraw-Hill: New York, NY, USA, 1978. [Google Scholar]
  49. Guadagnoli, E.; Velicer, W.F. Relation of sample size to the stability of component patterns. Am. Psychol. Assoc. 1988, 103, 265–275. [Google Scholar] [CrossRef] [PubMed]
  50. Comrey, A.L. Factor-analytic methods of scale development in personality and clinical psychology. Am. Psychol. Assoc. 1988, 56, 754–761. [Google Scholar] [CrossRef]
  51. Worthington, R.L.; Whittaker, T.A. Scale development research: A content analysis and recommendations for best practices. Couns. Psychol. 2006, 34, 806–838. [Google Scholar] [CrossRef]
  52. Anderson, J.C.; Gerbing, D.W. Structural equation modeling in practice: A review and recommended two-step approach. Psychol. Bull. 1988, 103, 411. [Google Scholar] [CrossRef]
  53. Tabachnick, B.G.; Fidell, L.S.; Ullman, J.B. Using Multivariate Statistics; Pearson: Boston, MA, USA, 2013; Volume 6, pp. 497–516. [Google Scholar]
  54. Bollen, K.A. Sample size and Bentler and Bonett’s nonnormed fit index. Psychometrika 1986, 51, 375–377. [Google Scholar] [CrossRef]
  55. Bollen, K.A. A new incremental fit index for general structural equation models. Sociol. Methods Res. 1989, 17, 303–316. [Google Scholar] [CrossRef]
  56. Schermelleh-Engel, K.; Moosbrugger, H.; Müller, H. Evaluating the fit of structural equation models: Tests of significance and descriptive goodness-of-fit measures. MPR-Online 2003, 8, 23–74. [Google Scholar]
  57. Hair, J.F.; Tatham, R.L.; Anderson, R.E.; Black, W. Multivariate Data Analysis with Readings, 5th ed.; Prentice Hall: Englewood Cliffs, NJ, USA, 1998. [Google Scholar]
  58. Fornell, C.G.; Larcker, D.F. Evaluating structural equation models with unobservable variables and measurement error. J. Mark. Res. 1981, 18, 39–50. [Google Scholar] [CrossRef]
  59. Henseler, J.; Ringle, C.M.; Sarstedt, M. A new criterion for assessing discriminant validity in variance-based structural equation modeling. J. Acad. Mark. Sci. 2015, 43, 115–135. [Google Scholar] [CrossRef]
  60. Taber, K.S. The use of Cronbach’s alpha when developing and reporting research instruments in science education. Res. Sci. Educ. 2018, 48, 1273–1296. [Google Scholar] [CrossRef]
  61. Cohen, L.; Manion, L.; Morrison, K. Research Methods in Education, 8th ed.; Routledge: London, UK, 2017. [Google Scholar] [CrossRef]
  62. Child, D. The Essentials of Factor Analysis, 3rd ed.; Continuum: New York, NY, USA, 2006. [Google Scholar]
  63. Hooper, D.; Coughlan, J.; Mullen, M. Structural equation modeling: Guidelines for determining model fit. Electron. J. Bus. Res. Methods 2008, 6, 53–60. [Google Scholar]
  64. Arpaci, I.; Ateş, E. Development of the cybercrime awareness scale (CAS): A validity and reliability study in a Turkish sample. Online Inf. Rev. 2023, 47, 633–643. [Google Scholar] [CrossRef]
  65. Arpaci, I.; Seong, M.; Karataş, K. Pandemic awareness scale (PAS): Evidence of validity and reliability in a Turkish sample during the COVID-19 pandemic. Trends Psychol. 2022, 30, 316–327. [Google Scholar] [CrossRef]
  66. Song, D.; Che, A.; Chen, Z.; Ge, X. Seismic stability of a rock slope with discontinuities under rapid water drawdown and earthquakes in large-scale shaking table tests. Eng. Geol. 2018, 245, 153–168. [Google Scholar] [CrossRef]
  67. Shaw, R.; Kobayashi, K.S.H.; Kobayashi, M. Linking experience, education, perception and earthquake preparedness. Disaster Prev. Manag. 2004, 13, 39–49. [Google Scholar] [CrossRef]
  68. Tekeli-Yeşil, S.; Dedeoğlu, N.; Braun-Fahrlaender, C.; Tanner, M. Earthquake awareness and perception of risk among the residents of Istanbul. Nat. Hazards 2011, 59, 427–446. [Google Scholar] [CrossRef]
  69. Lok, I.; Eschelmuller, E.; Haukaas, T.; Ventura, C.; Bebamzadeh, A.; Slovic, P.; Dunn, E. Can we apply the psychology of risk perception to increase earthquake preparation? Collabra Psychol. 2019, 5, 47. [Google Scholar] [CrossRef]
  70. Subedi, S.; Hetényi, G.; Shackleton, R. Impact of an educational program on earthquake awareness and preparedness in Nepal. Geosci. Commun. 2020, 3, 279–290. [Google Scholar] [CrossRef]
  71. Statista. Most Severe Earthquakes by Economic Damage Worldwide from 1980 to 2023 (in Billion U.S. Dollars). 2023. Available online: https://www.statista.com/statistics/273943/biggest-earthquakes-worldwide-by-economic-damage/ (accessed on 17 October 2023).
  72. Statista. Earthquakes with the Highest Death Toll Worldwide from 1900 to September 2023. 2023. Available online: https://www.statista.com/statistics/266325/death-toll-in-great-earthquakes/ (accessed on 17 October 2023).
  73. Reliefweb. Devastating Earthquakes in Southern Türkiye and Northern Syria, 18 May 2023, Situation Report 23 [EN/TR]. 2023. Available online: https://reliefweb.int/report/turkiye/devastating-earthquakes-southern-turkiye-and-northern-syria-18-may-2023-situation-report-23-entr#:~:text=Three%20months%20have%20passed%20since,50%2C783%2C%20with%20107%2C000%20reported%20injuries. (accessed on 17 October 2023).
  74. Ozdemir, R.; Demir, C.; Catak, B. Faculty members’ earthquake preparedness levels and their related factors: A cross-sectional study from a university in a high-risk earthquake zone in Turkey. J. Inj. Violence Res. 2021, 13, 151–160. [Google Scholar] [CrossRef]
  75. Yildiz, A.; Dickinson, J.; Priego Hernández, J.; Teeuw, R. Children’s disaster knowledge, risk perceptions, and preparedness: A cross country comparison in Nepal and Turkey. Risk Anal. 2023, 43, 747–761. [Google Scholar] [CrossRef]
  76. Mermer, G.; Donmez, R.O.; Daghan, S. The evaluation of the education for earthquake preparation addressed to middle school students. J. Pak. Med. Assoc. 2018, 68, 1809–1815. [Google Scholar]
Figure 1. Number of earthquakes (M5+) worldwide from 1990 to 2023.
Sustainability 16 00252 g001
Figure 2. Number of earthquakes in Turkey from 1990 to 2023.
Sustainability 16 00252 g002
Figure 3. Earthquakes with the highest magnitude in Turkey from 1912 to 2023.
Sustainability 16 00252 g003
Figure 4. Flow chart of the scale development process.
Sustainability 16 00252 g004
Figure 5. Scree plot.
Sustainability 16 00252 g005
Table 1. Demographic information.
Variablef%
GenderFemale29247
Male32953
Age18–25 8213
26–2912720
30–3410116
35–399215
40–449716
45–49508
50–54366
55–59183
60+183
Marital StatusMarried25942
Single34055
Other224
Country of residenceNorth Cyprus19531
Turkey42669
Education levelHigh school274
Undergraduate38963
Master’s degree11118
PhD9415
Economic levelPoor305
Middle33554
Good25641
JobStudent468
Academician25141
Teacher6210
Engineer7412
Architect457
Work-from-home professionals325
Nurse254
Medical doctor396
Advocate396
Not working81
Frequency of controlling notifications on mobile phoneImmediate20834
1–2 times6811
3–5 times12320
>521935
None30 (0.4)
Earthquake experienceYes54988
No7212
Table 2. Pilot study results.
Item x ¯ ( s ) Median (IQR)Corrected Item–Total Correlation
1.
In the event of an earthquake, smartphones save lives.
3.79 (0.95)4 (1)0.654
2.
I can use mapping and GPS tools to find safe locations during an earthquake.
3.91 (1.01)4 (1)0.748
3.
I regularly check the earthquake-related “do/don’t” lists on websites.
3.56 (0.89)4 (1)0.569
4.
I often follow earthquake-related mobile applications from application stores (Apple Store, Google Play, Blackberry, etc.).
3.38 (0.90)4 (1)0.688
5.
I inform the people around me about earthquake-related mobile applications.
3.85 (1.00)4 (2)0.448
6.
I have become a member of the groups that give information about earthquakes on social media.
3.76 (1.03)4 (1)0.439
7.
I can use mobile applications that can make loud noises (whistle, etc.) on my smartphone so that I can inform people around me of my location.
3.95 (0.99)4 (1)0.598
8.
I always confirm the accuracy of the information shared about earthquakes on social media.
3.82 (0.75)4 (1)0.601
9.
I am equipped to use digital technologies to communicate with others in the event of an earthquake.
3.77 (1.01)4 (1)0.458
10.
I can use mobile applications that can give live earthquake information from all over the world to my smartphone.
3.57 (0.79)4 (1)0.674
11.
I can use mobile applications that can be used in the event of an earthquake to my smartphone.
3.64 (0.73)4 (1)0.557
12.
I can use earthquake-related mobile applications that work with Bluetooth connections instead of the Internet to my smartphone.
3.81 (0.97)4 (1)0.689
13.
I can use mobile applications that can give advance warning of an approaching earthquake on my smartphone.
3.58 (0.88)4 (1)0.530
14.
I always carry a wireless charging unit (power bank) with me.
3.67 (0.95)4 (1)0.481
15.
I can use mobile applications related to earthquakes on my smartphone.
3.49 (0.91)4 (1)0.623
16.
I view social media as a great source of information.
3.39 (0.84)4 (1)0.471
17.
I’m ready to use cutting-edge technology for earthquake safety.
3.43 (0.90)4 (1)0.509
18.
I always make sure that my smartphone is fully charged.
3.59 (0.79)3 (1)0.605
19.
I often follow the instructions about earthquakes from official sites.
3.66 (0.82)4 (1)0.499
20.
I often follow up-to-date information about earthquakes from official sites.
3.87 (0.96)4 (1)0.637
21.
I can use mobile applications that make instant earthquake predictions to my smartphone
3.75 (0.99)4 (1)0.683
Table 3. Content validity analysis results.
ItemCVRI-CVI
(Simplicity)
I-CVI
(Ambiguity)
I-CVI
(Clarity)
I-CVI
(Relevance)
Interpretation
  • In the event of an earthquake, smartphones save lives.
11111Remained
2.
I can use mapping and GPS tools to find safe locations during an earthquake.
11111Remained
3.
I regularly check the earthquake-related “do/don’t” lists on websites.
0.80.90.911Remained
4.
I often follow earthquake-related mobile applications from application stores (Apple Store, Google Play, Blackberry, etc.).
11111Remained
5.
I can use emergency call applications from my smartphone during an earthquake.
−0.60.10.200.1Eliminated
6.
I inform the people around me about earthquake-related mobile applications.
11111Remained
7.
I have become a member of the groups that give information about earthquakes on social media.
0.80.90.911Remained
8.
I believe that the paid earthquake-related mobile applications are more reliable.
0.30.10.10.20.1Eliminated
9.
I can use mobile applications that can make loud noises (whistle, etc.) on my smartphone so that I can inform people around me of my location.
11111Remained
10.
I always confirm the accuracy of the information shared about earthquakes on social media.
10.9111Remained
11.
I am equipped to use digital technologies to communicate with others in the event of an earthquake.
0.80.9111Remained
12.
I can use earthquake-related applications more comfortably on the latest model smartphones.
−0.80.10.100Eliminated
13.
I can use mobile applications that can give live earthquake information from all over the world to my smartphone.
1.000.9111Remained
14.
Technical knowledge is required for an individual to use earthquake-related mobile applications.
−10000Eliminated
15.
I can use mobile applications that can be used in the event of an earthquake to my smartphone.
0.80.80.90.90.9Remained
16.
I can use earthquake-related mobile applications that work with Bluetooth connections instead of the Internet to my smartphone.
10.9111Remained
17.
If I install a free application related to earthquakes on my smartphone, I may encounter security issues.
−10000Eliminated
18.
I can use mobile applications that can give advance warning of an approaching earthquake on my smartphone.
1.001111Remained
19.
I always carry a wireless charging unit (power bank) with me.
11111Remained
20.
I can use mobile applications related to earthquakes on my smartphone.
110.8911Remained
21.
I view social media as a great source of information.
0.80.9111Remained
22.
I’m ready to use cutting-edge technology for earthquake safety.
11111Remained
23.
I always make sure that my smartphone is fully charged.
11111Remained
24.
I often follow the instructions about earthquakes from official sites.
1110.91Remained
25.
I can only find information about earthquakes on social media platforms.
−0.100.100.1Eliminated
26.
I often follow up-to-date information about earthquakes from official sites.
11111Remained
27.
I can use mobile applications that make instant earthquake predictions to my smartphone.
1110.91Remained
Table 4. Item descriptions and factor loading ( λ i ) and communality ( h i 2 ) values for the Digital Readiness toward Earthquakes scale.
Item λ i h i 2
Dimension 1: Technological Skills
DRE1I can use mobile applications related to earthquakes to my smartphone.0.8170.681
DRE2I can use mobile applications that can give advance warning of an approaching earthquake on my smartphone.0.8170.637
DRE3I can use mobile applications that make instant earthquake predictions to my smartphone.0.8160.679
DRE4I can use mobile applications that can give live earthquake information from all over the world to my smartphone.0.7940.635
DRE5I can use mobile applications that can be used in the event of an earthquake to my smartphone.0.7910.664
DRE6I can use mobile applications that can make loud noises (whistle, etc.) on my smartphone so that I can inform people around me of my location.0.7620.559
DRE7I can use mapping and GPS tools to find safe locations during an earthquake.0.7460.565
DRE8I can use earthquake-related mobile applications that work with Bluetooth connections instead of the Internet to my smartphone.0.6920.517
Dimension 2: Digital Attitudes
DRE9I often follow up-to-date information about earthquakes from official sites.0.9000.685
DRE10I often follow the instructions about earthquakes from official sites.0.8730.680
DRE11I always make sure that my smartphone is fully charged.0.6810.545
DRE12I regularly check the earthquake-related “do/don’t” lists on websites.0.6500.590
DRE13I always confirm the accuracy of the information shared about earthquakes on social media.0.6120.429
DRE14I often follow earthquake-related mobile applications from application stores (Apple Store, Google Play, Blackberry, etc.).0.5620.486
λ i : factor loading of ith item, h i 2 : communality of ith item.
Table 5. CFA fit measure values for the DRE scale.
MeasureValueSuggested Intervals
Excellent FitAcceptable Fit
χ 2 141.056 0 χ 2 2 d f 2df < χ 2 3 d f (df = 76)
χ 2 / d f 1.856 0 χ 2 / d f 2 2 < χ 2 / d f 3
RMSEA0.0654 R M S E A 0.05 0.05 < R M S E A 0.08
SRMR0.0389 S R M R 0.05 0.05 < S R M R 0.10
ρ 1 0.9711 ρ 1 0.97 0.95   T L I < 0.97
1 0.9759 1 0.95 0.90   N F I < 0.95
ρ 2 0.9865 ρ 2 0.97 0.95   T L I < 0.97
2 0.9887 2 0.95 0.90   I F I < 0.95
CFI0.98860.97   C F I 1.00 0.95   C F I < 0.97
GFI0.93850.95   G F I 1.00 0.90   G F I < 0.95
AGFI0.92960.90   A G F I 1.00 0.85   A G F I < 0.90
Table 6. Convergent validity measures.
DimensionCRCαAVE
Technological Skills0.9260.9100.609
Digital Attitudes0.8650.8370.525
Table 7. Discriminant validity by Fornell–Larcker and HTMT criteria.
DimensionFornell–LarckerHTMT
Technological SkillsDigital
Attitudes
Technological SkillsDigital
Attitudes
Technological Skills0.780
Digital Attitudes0.6590.7250.625
Table 8. Item statistics and independent samples t-test results for the top 27% and bottom 27%.
Item x ¯   ( s ) Median (IQR)t
(Top 27%—Bottom 27%)
Dimension 1: Technological Skills
DRE13.86 (0.97)4 (2)13.533 ***
DRE23.90 (0.95)4 (1)12.258 ***
DRE33.62 (1.10)4 (1)15.067 ***
DRE43.59 (1.06)4 (1)12.452 ***
DRE53.93 (0.89)4 (1)10.705 ***
DRE63.92 (0.96)4 (1)14.989 ***
DRE73.81 (0.92)4 (1)9.922 ***
DRE83.48 (1.07)4 (1)10.544 ***
Dimension 2: Digital Attitudes
DRE93.76 (0.92)4 (1)9.340 ***
DRE103.71 (0.98)4 (1)12.599 ***
DRE113.25 (1.04)3 (1)9.687 ***
DRE123.53 (1.05)4 (1)14.809 ***
DRE13 3.77 (0.95)4 (1)12.610 ***
DRE143.08 (1.10)3 (2)9.136 ***
x ¯ : mean, s: standard deviation, IQR: interquartile range *** p < 0.001.
Table 9. Corrected item–total correlation, squared multiple correlation (SMC), and Cα values of the removed items.
ItemCorrected Item–Total CorrelationSMCCα of the Removed Item
Dimension 1: Technological Skills
DRE10.7070.7180.901
DRE20.6650.6070.902
DRE30.7080.6730.900
DRE40.6800.6060.901
DRE50.7080.6930.901
DRE60.6150.5320.904
DRE70.6370.5100.903
DRE80.6170.4410.904
Dimension 2: Digital Attitudes
DRE90.4950.5220.908
DRE100.5320.5450.907
DRE110.5740.4370.906
DRE120.6400.5750.903
DRE130.4920.3590.908
DRE140.5840.4900.906
Disclaimer/Publisher’s Note: The statements, opinions and data contained in all publications are solely those of the individual author(s) and contributor(s) and not of MDPI and/or the editor(s). MDPI and/or the editor(s) disclaim responsibility for any injury to people or property resulting from any ideas, methods, instructions or products referred to in the content.

