Article

Exploring the Use of Wood Pellets as a Sustainable Alternative for Indoor Insulation

1
Department of Architectural Engineering, University of Sharjah, Sharjah 27272, United Arab Emirates
2
Department of Architectural Engineering, Assiut University, Asyut 71516, Egypt
*
Author to whom correspondence should be addressed.
Sustainability 2024, 16(1), 25; https://doi.org/10.3390/su16010025
Submission received: 21 November 2023 / Revised: 13 December 2023 / Accepted: 18 December 2023 / Published: 19 December 2023

Abstract

:
This study utilized industrial waste in the form of wood pellet shavings as a sustainable alternative for indoor insulation, aiming at improving materials’ performance, reducing energy consumption, and promoting efficient waste management. Samples were made with various percentages of wood pellets mixed with clay, sand, and lime at 2%, 5%, and 10%. The physical and mechanical tests revealed that water exposure decreases samples’ mechanical and thermal properties. Despite the literature suggesting that a mixture with higher amounts of natural fibers often exhibits lower thermal conductivity, this study found that samples with higher proportions of wood pellets performed worse than expected. The reduction in performance is believed to be due to the increased water input into the mixture during the flow table test. Further, results show that samples with 2% exhibit high thermal conductivity compared to 5% and 10% due to having fewer voids within them than the other mixtures, showing a clear correlation between the wood pellet amount and sample density. This reveals an apparent lack of correlation between the density samples and thermal conductivity. However, given their impressive hygroscopic qualities, the materials show promising solutions as an indoor air regulatory aid.

1. Introduction

The construction sector is a major contributor to global economic growth, with a predicted increase of 70% by 2025 [1]. However, it also has a significant environmental impact, being a major source of pollution, waste production, and energy consumption [1,2]. In the EU, it accounts for 40% of energy usage and 36% of CO2 emissions [2]. On the other hand, bio-based construction materials offer a sustainable solution, with the EU recognizing them as a high-potential growth area. Bio-based insulation methods in the building sector refer to using natural, renewable materials as insulation in construction. These materials include plant-based materials, such as cellulose, cork, hemp, and flax, and are used as an alternative to conventional synthetic insulation materials, like fiberglass and polystyrene. Using bio-based insulation materials in construction has been demonstrated to possess several advantages, primarily due to their hygroscopic nature and capacity to act as a passive indoor air regulator [3,4]. These bio-based composites are frequently fabricated from natural fibers that would have otherwise been discarded, thereby augmenting their sustainability profile. Despite the exploratory stage of this field, there remains ample scope for further investigation and contribution to the existing corpus of literature. Bio-based materials are showing promise in the race for sustainably focused alternative building refurbishment solutions, aiming to improve in-use energy efficiency and often contributing to an improvement in internal air quality [3,5]. Ledhem et al. [5] states that the “bio-based product refers to products wholly or partly derived from biomass, such as plants, trees or animals”.
The novelty of this paper is the utilization of wood pellet shavings as a sustainable indoor insulation alternative for the first time. This study provides a detailed literature review on the impact of bio-based materials implemented in the building sector. This research further discussed the effect of materials on building performance, energy consumption, and waste management. The key contributions of this research review are presented as follows:
  • Characterizing wood pellets’ waste materials based on physical and chemical properties observed in the laboratory test;
  • Defining standards for developing and manufacturing sustainable high-performance bio-based insulation products with wood pellets added;
  • Investigating the physical, mechanical, and thermal properties of the wood pellets blended with a high-performance insulation product in the laboratory to explore the optimized level of wood pellets for the composites’ internal matrix;
  • Utilizing wood pellets in building insulation is a new vision to recycle more waste.

2. Related Work

This section analyzes existing research studies on bio-based materials and their impact on the construction sector. Bio-based materials are derived from renewable natural resources like animals and plants. These materials are considered more sustainable and environmentally friendly than traditional construction materials. Using bio-based materials in the construction sector aims to reduce the environmental impact by reducing carbon emissions and promoting sustainable practices in the building sector, in addition to their excellent thermal properties, and can contribute to building energy efficiency.
In a review undertaken by Mujalli et al. [6], they found that bio-based insulation methods have been in a state of constant progression since 2003, with research on hemp, straw, wood, coconut, sunflower, and corn being most prominent, with 73% of published papers reviewing these elements alone. Traditional construction methods involving the earth as a material that could provide sustainable, ecological, and economic benefits to the industry are also being revisited in the literature [3]. Earth also has the potential to be an excellent humidity and moisture regulator, given its high hygroscopic and low thermal conductivity behaviors [7]. Hassan et al. [8] examined the thermal properties of brick samples made of sugarcane, sludge, and bagasse ash to determine the possibility of utilizing these bricks to reduce energy consumption. The outcomes revealed a substantial improvement in thermal conductivity, with the brick samples recording a range of 0.11 to 0.26 W/m·K, compared to traditional brick types with a range of 0.33 to 1.6 W/m·K. Statistical analysis revealed the advantage of using the materials proposed, resulting in a reduction of 64% of heat flow in comparison to typical wall systems. The study found that using these brick samples led to a 16.5% decrease in annual energy consumption in buildings and improved thermal comfort by 6.3% (from 16.3 to 22.6%).
Often, bio-based products house less embodied energy from the cradle to the grave, using recyclable and renewable materials to create innovative solutions; this is in line with the UK government vision, led by the Green Construction Board, which seeks to heavily reduce and eventually eliminate carbon emissions from the construction industry as per the Construction 2025 Act and the Carbon Plan, which is housed in the Climate Change Act [1]. All new buildings built within the EU by 2020 should be nearly zero carbon, with high levels of energy performance as per the European Union Directive 2010/31/EU [1]. The demand for alternative building materials in new and renovation projects has increased interest in hygroscopic bio-based materials, like hempcrete. Numerous environmental benefits, such as low thermal conductivity, good moisture buffering capacity, and potentially shallow carbon life cycles, have already been mentioned. They have also been shown to positively affect building energy consumption compared to traditional concrete [9]. The study by Cetiner and Shea [10] examined the effect of plant-based bio-insulation materials on industry and their impact on a building’s ecological footprint. The study discovered that these materials could capture atmospheric carbon dioxide through photosynthesis, with the sequestered carbon dioxide typically exceeding the embodied carbon dioxide produced during manufacturing. This suggests that utilizing plant-based bio-insulation materials in practice could significantly decrease the embodied carbon dioxide of the building, resulting in a negative carbon footprint for the structure. Palumbo et al. [11] investigated the climatic impact of bio-based materials and reported that in almost every case they studied, the increase of bio-based material content resulted in a reduced climatic impact of the building, indicating that a positive effect of biogenic carbon storage in bio-based materials. Hui and Ma [12] evaluated the impact of various green wall and insulation materials and their impact when utilized in a brick wall. The study revealed that applying green walls could be more environmentally friendly when recycled materials are used. The results indicated that recycled materials could decrease embodied energy by 40–49% and embodied carbon by 6–19%. Similarly, Ben-Alon et al. [13] compared various bio-based walls containing light straw, clay, rammed earth, and cob with traditional wall materials to demonstrate that walls with low carbon emissions in manufacturing substantially reduce operational energy.
There is a belief that bio-based products, particularly insulation materials, positively impact indoor air quality due to their hygroscopic nature. This allows for the absorption and desorption of water vapor into their porous structure, creating a dynamic equilibrium with their surrounding environment and providing a hygric buffer that lowers the energy requirements of air conditioning. The quantity of moisture absorbed is specific to the material and is determined by the relative humidity and temperature of the environment [11]. Controlling these values can accurately map bio-based materials’ sorption/desorption characteristics by monitoring the mass change over time, following the NORD Test protocol [14]. Often, insulation materials are not used as a direct wall finish, which may affect their ability to regulate the indoor air quality (IAQ) of a building given this lack of exposure to the internal environment. Some researchers have started to look towards using bio-based materials in an aggregate form, with [4,7] creating a highly absorbent bio-based aggregate within an MDF composite. The researchers in [15] investigated the impact that adding cut oat fibers (1–2 cm long) would have on the hygroscopic behavior of an earth-based mortar. They found that the mortar had a very high adsorption capacity while also having the ability to desorb all the absorbed water vapor. The addition of fibers has been shown to impact the literature positively and negatively.
Charai et al. [16] conducted an experimental investigation on the effect of incorporating cannabis fibers into the plaster and their thermal performance. The results showed that a 6% addition of hemp stems reduced the thermal conductivity from 0.53 W/mK to 0.36 W/mK and reduced thermal diffusivity from 0.39 mm2/s to 0.36 mm2/s. Additionally, Czajkowski et al. [17] performed a study to verify the thermal properties of cereal straw manufactured panels. The results indicated that the panels’ high specific heat reached 1600 J/(kg K), while thermal conductivity ranged between 0.025 to 0.075 W/(m K), depending on the method used for its measurement. This study provides valuable information on the thermal properties of panels made from cereal straw and supports the potential use of this material in building and construction applications. The research study by Jannat et al. [18] explored the influence of bamboo, sisal, and wood fiber on soil blocks, which are all in plentiful supply in Brazil. They found that the fibers dramatically reduced shrinkage cracks from the drying process and had marginal benefits to the compressive strength of the blocks. Adding off-fibers has influenced composite materials’ mechanical and hygrothermal properties in much of the literature. The researchers in Gameiro et al. [19] found that incorporating cork fibers in concrete improved thermal performance but dissipated the material’s mechanical performance. In general, the effect natural fibers seemingly have on thermal conductivity is mainly positive throughout the literature, thus alluding to the fact that they may be suited as insulation and an indoor air regulatory measure [20]. This is because the lower the material’s thermal conductivity, the less heat transfers through that material, resulting in a higher insulative capacity.
The effect of fiber-infused bio-based materials on mechanical strength, the material’s compression, and tensile/flexural strength is largely debatable. Much of the literature emphasizes the need to examine the effect of fiber in relation to the internal porous structure of the material. This seems logical given that the reasoning behind the hygrothermal success of these materials derives from the internal modification of this structure via the inputting of the fibers. Millogo et al. [21] touched on this in their study, noting that too high a fiber content led to an internal weakness within their earth-based bio-composites, reducing the mechanical strength of these samples. Ledhem et al. [5] found that thinner (fine fibers) often performed better when measured for thermal conductivity but were more sensitive to compression. Ranesi et al. [22] discovered an interesting comparison between the density of a bio-based material and its mechanical strength, which will be explored later in this paper. Investigating how much fiber needs inputting into a particular bio-based composite requires trial and error. Each composite is different. They may use other binding agents and different base materials with specific functionality requirements unique to that composite. Getting the balance right for mechanical strength and thermal performance will be important for many designers, especially those looking to create insulation materials that will stand the test of time. In summary, researchers explore using bio-based materials in aggregate forms, showing potential in regulating indoor air quality. Experimental investigations on incorporating fibers from hemp, cereal straw, bamboo, sisal, wood, and cork reveal positive effects on thermal performance but varied impacts on mechanical strength.
In summary, the literature demonstrates that bio-based materials offer promising solutions for sustainable construction, providing benefits of reduced environmental impact, improved thermal properties, and potential contributions to indoor air quality. Ongoing research focuses on optimizing the balance between mechanical strength and thermal performance in these materials.

3. Materials and Methods

The study aims to utilize wood pellets as a possible sustainable indoor insulation. Thus, samples with clay, sand, and lime, with different percentages of wood pellets (2%, 5%, and 10%), were produced in addition to the reference samples with 0% additives. Prior research and literature in the field suggest that these percentages have shown promising results regarding specific properties [7,18]. Therefore, researchers often build on existing knowledge and experiments when designing their studies. Wood pellets are wasted wood materials, and they gained popularity as a sustainable, eco-friendly way to mitigate climate change. The materials utilized to produce the samples are presented in Table 1.

3.1. Samples’ Composition

Given that this composite has never been studied before, the production process was trial and error to the authors’ knowledge. The project aimed to see the impact of different values of wood pellets on the overall performance of a novel bio-based product, and as such, it was proposed that a 2%, 5%, and 10% step variation in mass should be tested. This step variation was derived from various literature sources, with some stating that small wood additions improved mechanical and thermal performance indicators [23]. The 10% was deemed the highest due to much of the literature stating that too high a proportion of wood drastically affected the structural integrity of the mixture created due to the decrease in density [7,24]. The main volume of the composite came from the sand, clay, and lime content, in addition to tap water. The water values and content results from the flow table test findings are presented in Table 2.

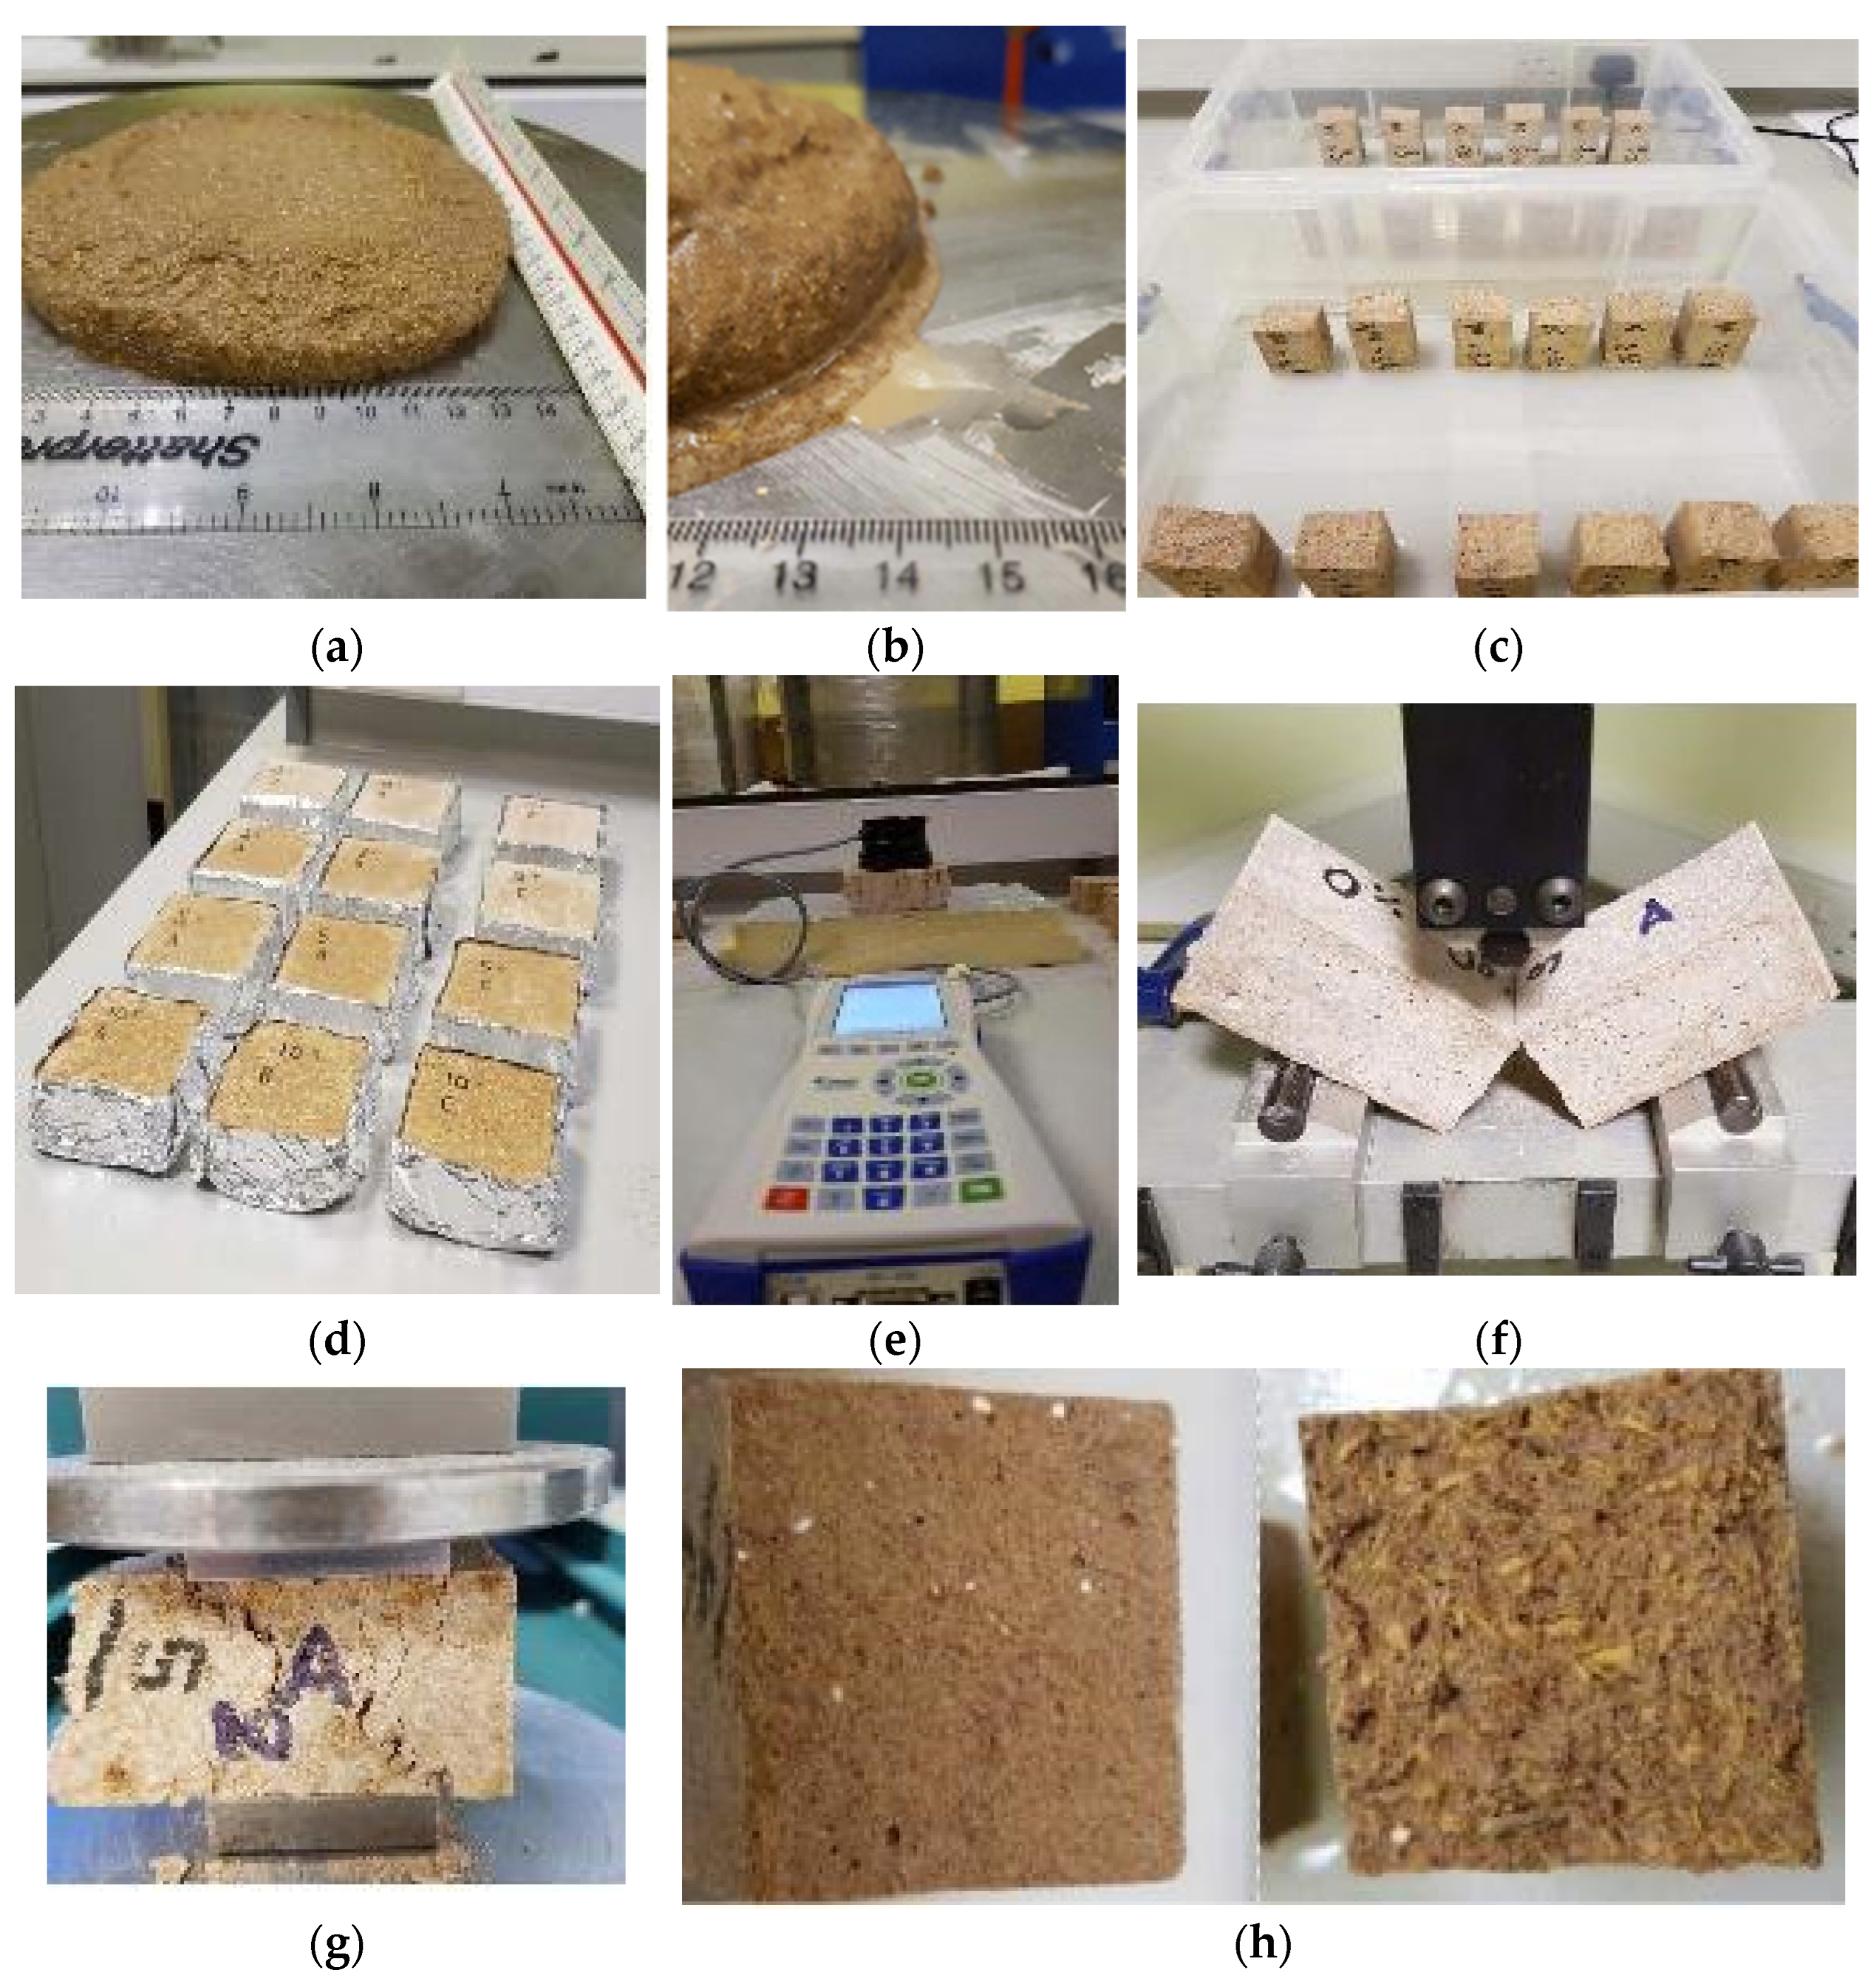
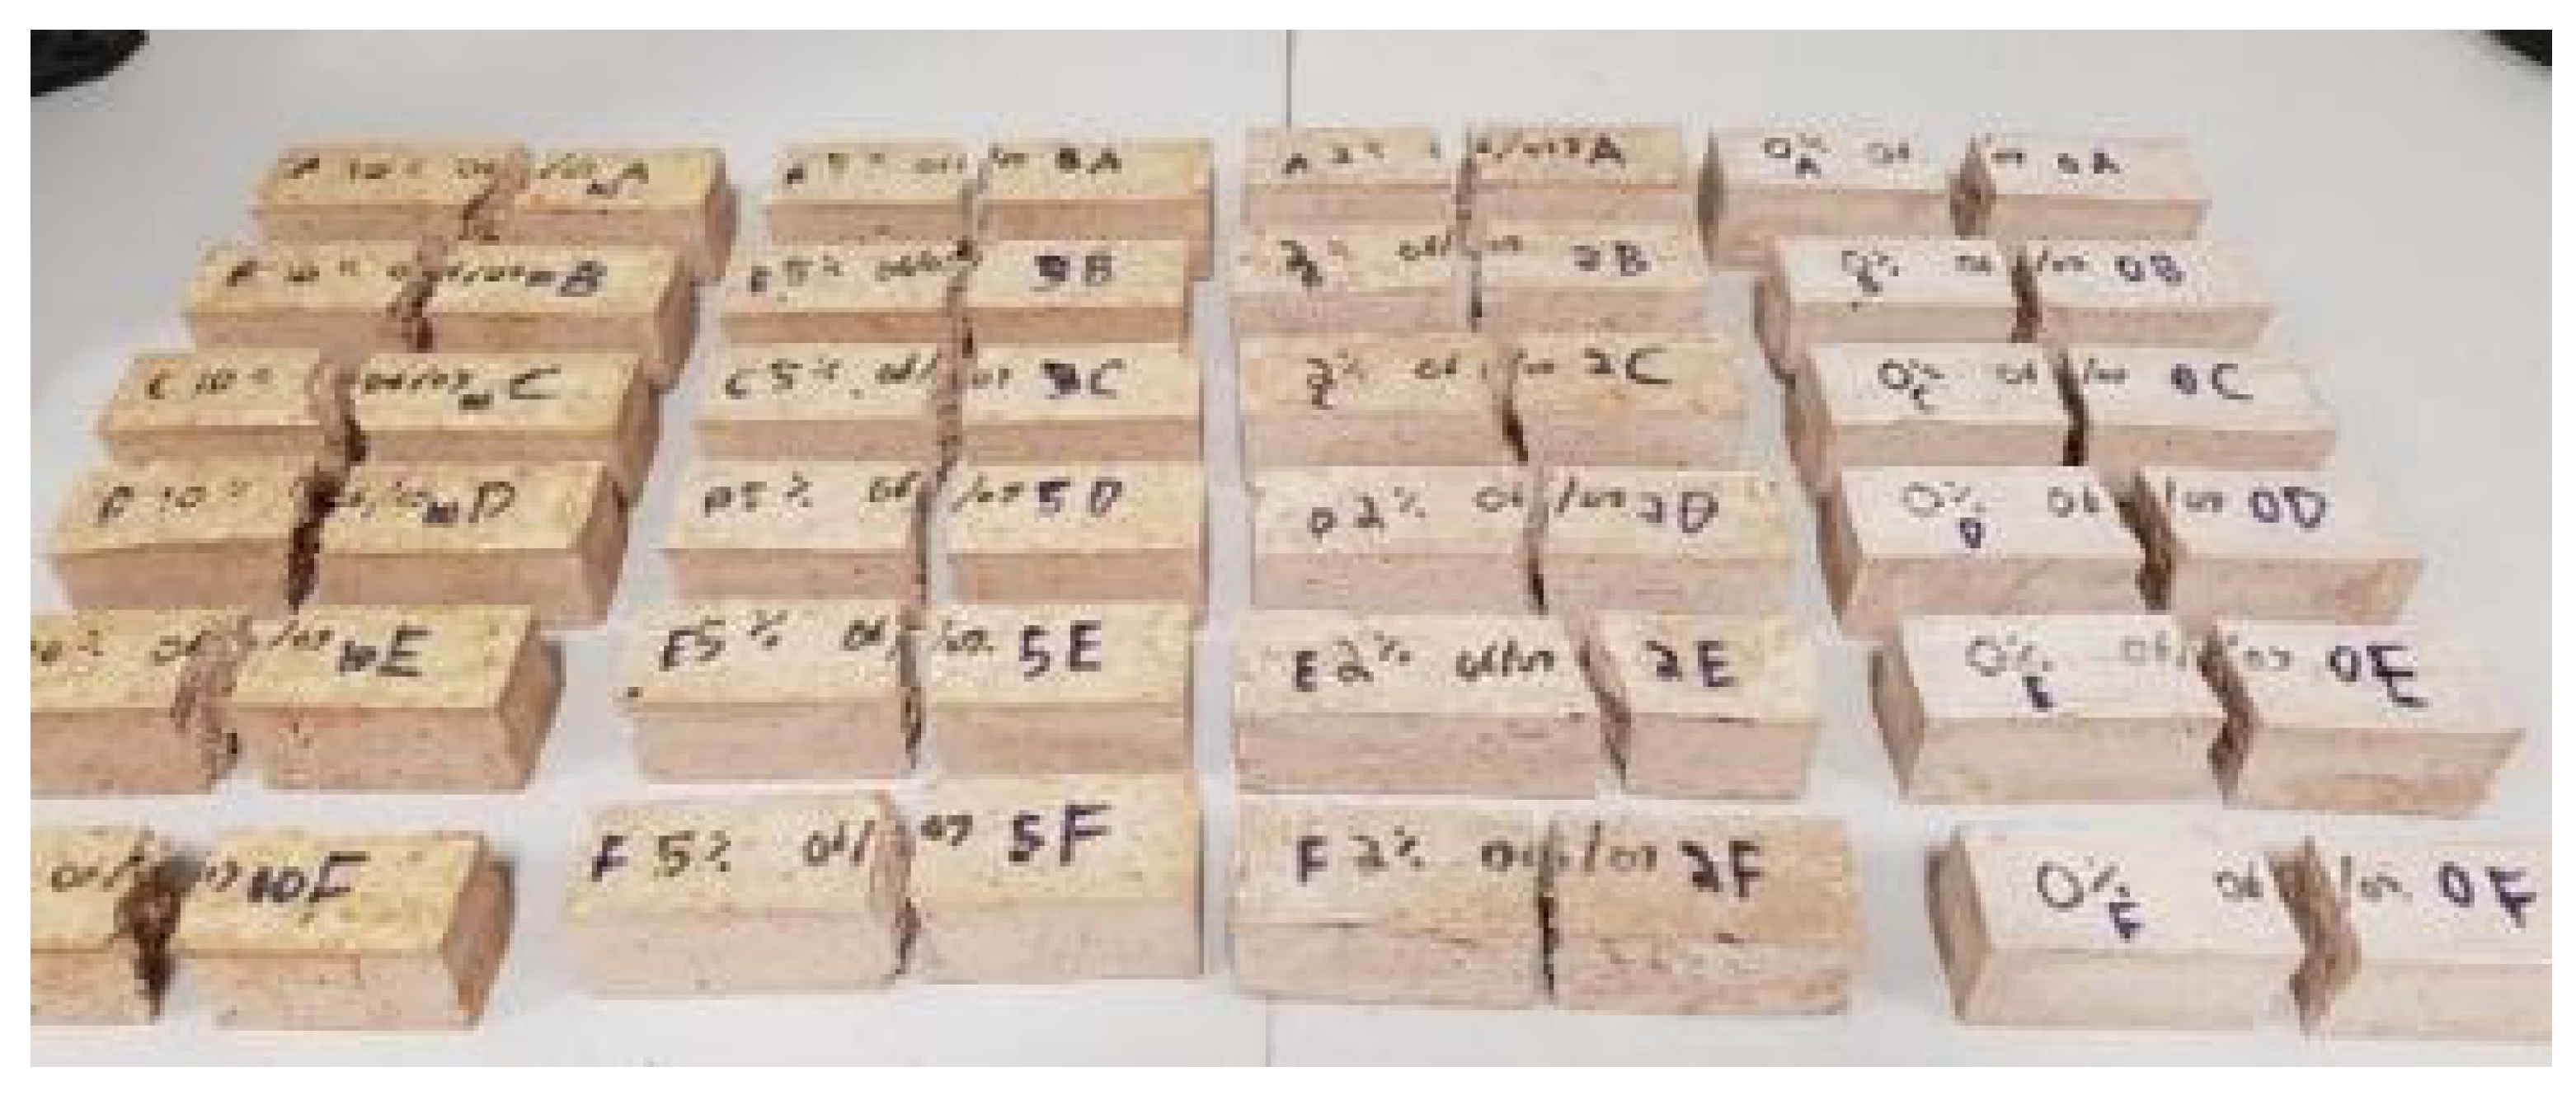
3.2. Samples’ Preparation

According to several research studies [3,25], mixing the original dry ingredients was carried out first before the slow, steady addition of the wood pellet shavings. The mixing was carried out in a large metal tray and homogenized via a metal trowel. Time was taken to ensure the mixture was fully integrated before adding the water. The water was added in stages slowly while ensuring that the dry ingredients were constantly mixed with the water. The EN 1015-2 (1999) [26] standard was followed throughout the mixing process to ensure consistency across the board. Table 2 shows that the four composite mixes were cast into three 100 × 100 × 35 mm3 wooden molds and 9 of the 40 × 40 × 160 mm prismatic samples.
To simplify the process, the mixes were cast using a trowel and placed into the molds in 2–3 stages. To ensure the mixes congealed into 1 singular structure and to reduce the possibility of layering, the molds were banged on the workbench with significant force when the mixes had been cast inside them to ensure the mix was brought together as one. Air bubbles in the mixture were brought to the surface. It should be noted that before the composite mixes, the square wooden 100 × 100 × 35 mm3 molds were wrapped in plastic wrap, and the casting was completed on top of this wrap, thus ensuring that the samples would be released with relative ease once cured. For the 40 × 40 × 160 mm3 prismatic samples, mold oil was used to lubricate areas of the prism that would come in contact with the composite, again reducing the risk of damaging the samples once they were ready to be released from the prisms. The mixture was cured for a minimum of 28 days to ensure the composite samples were thoroughly dried. The samples were left to dry in laboratory conditions with a temperature of 19 °C and relative humidity of 65%. Given their large exposure area (100 × 100 mm2), the wooden samples were covered with clear plastic wrap to reduce the possibility of cracking due to the rapid moisture release. In addition, it helps maintain a constant hydrothermal environment for the samples and generally protects the surface from dust and other potential contaminants. After 14 days, the prismatic and wooden samples were de-molded and left for another 14 days to dry out fully and thoroughly. The samples were spaced out so that each one could attain complete exposure. The samples were also turned in after 7 days to allow for drying on each surface.

3.3. Testing Methods

Several physical and mechanical tests were conducted, including flow table, thermal conductivity, capillary water absorption, moisture buffer value, flexural strength, and compressive strength. To ensure the quality and performance of materials in construction and thermal insulation applications, the test used in this study follows the standards developed by the European Committee for Standardization. The EN 1015-2 (1999) [26] standard outlines methods for bulk sampling and preparation of test mortars used in masonry construction. EN 12664 (2001) [27] and EN 12667 (2001) [28] refer to thermal resistance in building materials, classifying between dry and moist products of medium to low thermal resistance and those of high and medium thermal resistance, respectively. EN 12939 (2001) [29] focuses on the thermal performance of buildings, specifically on determining ventilated façade thermal performance [7,18,23]. Test details are explained as follows.

3.3.1. Flow Table Test

The flow table test was used to investigate how much water the newly created mixture required to meet industry norms regarding the workability of mortar. Square samples (100 × 100 × 35 mm3) were used for the test, as per EN 1015-3 (1999) [30]. The mold was positioned in the middle of the flow table before being packed in two layers; each layer was compressed with the tamper ten times. After waiting 15 s, the mold was removed before jolting the turntable at a rate of 1 jolt per second for 15 s. The diameter of the spread was then measured using Equation (1).
D 1 + D 2 + D 3 3        
where D1, D2, and D3, are the diameter of the 3 samples.

3.3.2. Thermal Conductivity

Thermal conductivity tests allow for measuring the conduction of heat in materials and the amount of heat that passes through that material [31]. The weight of the samples was taken, and the density was calculated before testing. Samples from each composition were tested twice, and the mean average of these readings was used during the analysis. The square samples used (100 × 100 × 35 mm3) were measured after they were used for the moisture buffer value (MBV) testing. Before the MBV testing, the samples had spent 28 days drying out, with 21 days spent in a climatic chamber under the controlled conditions of 23 °C and 53% humidity for 8 h, in addition to 23 °C and 75% humidity for 16 h. This cycle was repeated every day for 21 days, allowing the samples to stabilize. The samples were then removed from the climatic chamber and left for 14 days in a laboratory with a temperature of 19 °C and relative humidity of 65%, which allowed the samples to stabilize once again before testing, as per EN 12664 (2001), EN 12667 (2001) and EN 12939 (2001) standards [31]. Upon testing, the samples were placed on a 50 mm thick polyurethane block to prevent possible interference from equipment nearby. Testing was only conducted on the main face of the square samples, with each sample wiped with a microfiber cloth before testing. The probe was placed in the middle of the main face (Figure 1e). Thermal conductivity was calculated via Equation (2).
k = Q Δ x A Δ T
where k is the thermal conductivity, Q is the amount of heat transferred, A is the cross-sectional area through which heat is transferred, ΔT is the temperature difference across the material, and Δx is the distance or thickness of the material through which heat is transferred.

3.3.3. Capillary Water Absorption Test

The capillary water absorption test was conducted at half prism, with average dimensions of 50 mm × 50 mm × 35 mm, and samples masses were recorded. As the samples had dissimilar sizes after the breakage in the flexural strength test, the flat faces of the samples were immersed in a constant headwater bath to a depth of 5 mm. Then, samples were removed from the water, and their masses were noted. The capillary water absorption (average of three samples per mixture) was calculated using the following Equation (3).
Cw = 0.1 × (MtMi)
where Cw is the water content, Mt is the final mass, and Mi is the initial mass.

3.3.4. Moisture Buffer Value Test

The MBV is a key indicator as to how much moisture a material can adsorb and desorb when exposed to repeated daily variations in relative humidity between two given levels. Following guidance from the NORDTEST document [14], cycles were monitored until they exhibited no more than a 5% difference for 3 consecutive cycles, thus indicating that they had stabilized. For the MBV, square samples (100 × 100 × 35 mm3) were used. Each category had 3 samples, so a total of 12 samples were tested in the MBV test. Each sample was wrapped in aluminum tape, leaving 1 exposed face of 100 × 100 mm2. Limiting moisture loss from the other sides of the square samples allows for more effective cross-examination between samples. The MBV was calculated using Equation (4):
M B V = M f R H f M i R H i
where Mf is the final moisture content of the material, Mi is the initial moisture content of the material, RHf is the final relative humidity, and RHi is the initial relative humidity.

3.3.5. Flexural Strength Test

The test was performed on the 40 × 40 × 160 mm3 prism samples 35 days after being cast, meaning the samples were fully de-molded for 21 days before testing. The test was conducted at a 1 mm/min velocity with a distance between the supports of 100 mm. The 6 samples from each category were tested, meaning a total of 24 samples were tested, leading to the creation of 48 half samples at the end of the tensile flexural strength test. These were later used for both the water capillary test and the compressive strength tests.
f = 1.5 F L   b d 2
where f (MPa) is the flexural strength, F (N) is the obtained load, L (mm) is the distance between the supports, b (mm) is the height of the sample, and d (mm) is the width of the sample.

3.3.6. Compressive Strength Test

The compressive strength test was conducted following EN 1015-11 [32]. The samples, which were on average 40 × 40 × 80 mm3 were lined up centrally between two bearing plates of steel with a surface hardness of at least 600 HV Vickers hardness value. The bearing plates measured 40 × 40 mm2 and fulfilled the requirements of EN 1015-11. The samples were compressed at a constant rate of 1 mm per minute.
C = F A
where C (MPa) is the compressive strength, F (kN) is the ultimate load, and A (mm2) is the area of the bed face.

4. Results and Discussion

This section presents the setup of the physical and mechanical tests undertaken on the sample prepared. In addition, the section discusses the test results in detail to justify the wood pellets’ performance as indoor insulation.

4.1. Flow Table Test Results

Table 3 demonstrates that including wood pellet shavings in the mixture notably elevates the water demand, aligning the material with the specified industry norms. The results further clarify the percentage absorption of water in relation to the dry mass of the wood pellet shavings, offering a comprehensive understanding of the water absorption characteristics within the bio-based composites analyzed in this study. These results contribute valuable insights as to optimizing composite formulations for enhanced performance and adherence to industry standards. During the experiment, adding the wood increased the rigidity of the mixture, with the wood holding its shape even after 15 consecutive turns. Often, water would excrete from the mix, and the central mass would stay very much intact after the 15 turns, even though it was clear to the human eye that the mixture had been over-absorbed (Figure 1a,b). This proved challenging as adding water visibly made the mixture excrete large amounts of excess moisture and did not fulfill the 165 mm industry standard EN 1015-3 (1999) [30]. In addition, an area between 150 mm and 155 mm was used to reduce the risk of over-expulsion and the negative consequences. However, this aligns with EN 1015-3 (1999) [30], allowing for a 10% adjustment. However, even with the lower target, all mixtures with wood additions (2WP, 5WP, and 10WP) were still visibly leaking excess moisture and struggling to meet the 150 mm threshold.
A previous study by Ledhem et al. [5] showed a similar outcome, where non-treated wood shavings could retain 24% of their initial dry density. This may be because the wood was untreated, reducing the amount of water absorption. A study by [33] pointed out that absorption can be lowered by treating the wood.

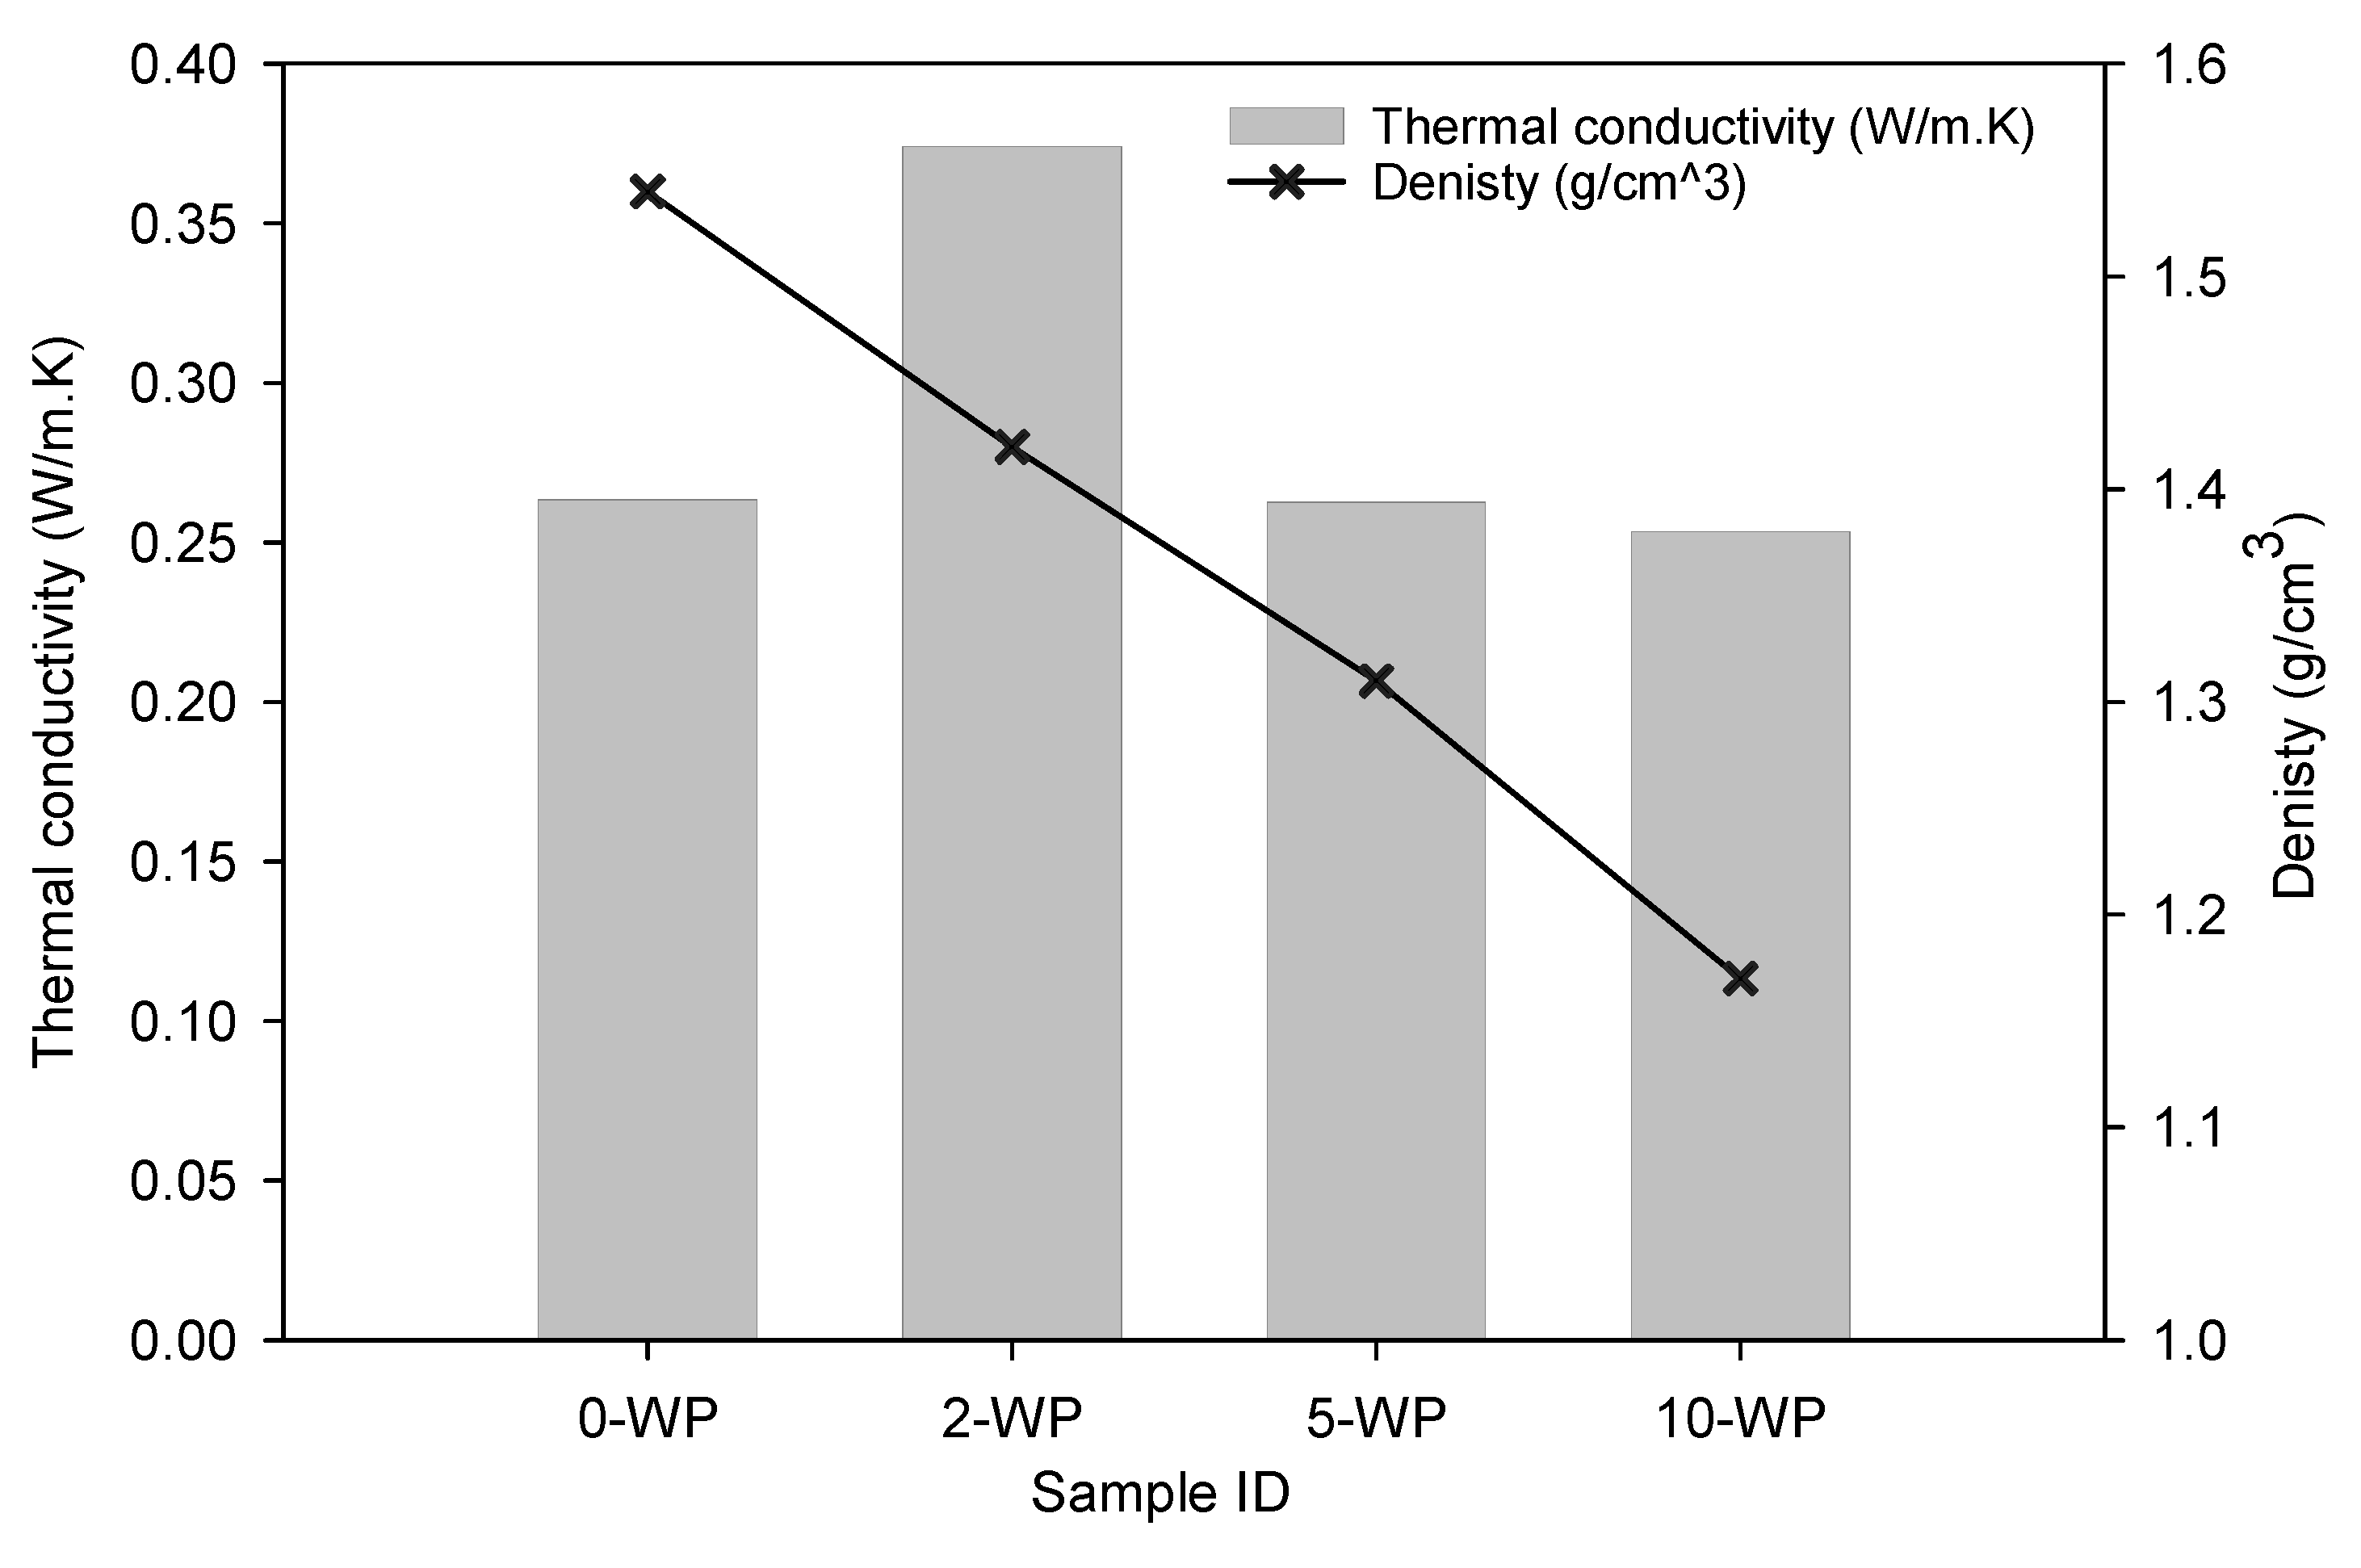
4.2. Thermal Conductivity Test Results

Figure 2 reveals a decrease in the thermal conductivity of samples when the amount of additive increased above 2% of wood pellet shavings. The difference between 5WP and 10WP is negligible, meaning that the composite does not change from a thermal conductivity perspective if more wood pellet shavings are added. This may be due to the amount of water absorbed into the mixture before curing. Sample 2WP exhibits some interesting characteristics, given its noticeably high thermal conductivity value compared with 0WP, 5WP, and 10WP. This would suggest that the small addition of wood shavings (2%) may have led to the composite having fewer voids within it than the other mixtures, thus justifying its higher thermal conductivity measurements. Whilst there is a clear correlation between the percentage of wood pellet shavings and the density of the samples, there is a surprising lack of correlation between the density and the thermal conductivity of the samples. Samples 0WP, 5WP, and 10WP all have the characteristics of a low thermal conductive composite, given that they noticeably decreased in density compared to reference sample 0WP. This is due to a more porous inner structure. As such, given the results of the thermal conductivity test, however, they may still offer some benefit in terms of their contribution to indoor air quality.
In previous studies, [8,34,35] showed similar results, with a strong correlation between the increase in wood shavings and a decrease in thermal conductivity. However, most samples referred to in these studies had been treated in some way to maximize the ratio incorporation, whereas the samples in this study were left untreated. A study by Abu-Jdayil et al. [36] illustrates the impact that water intake can have on the thermal performance of a composite, resulting in voids left in the inner matrix of a composite, especially prevalent for untreated wood due to the swelling and shrinkage of the material when subject to moisture.

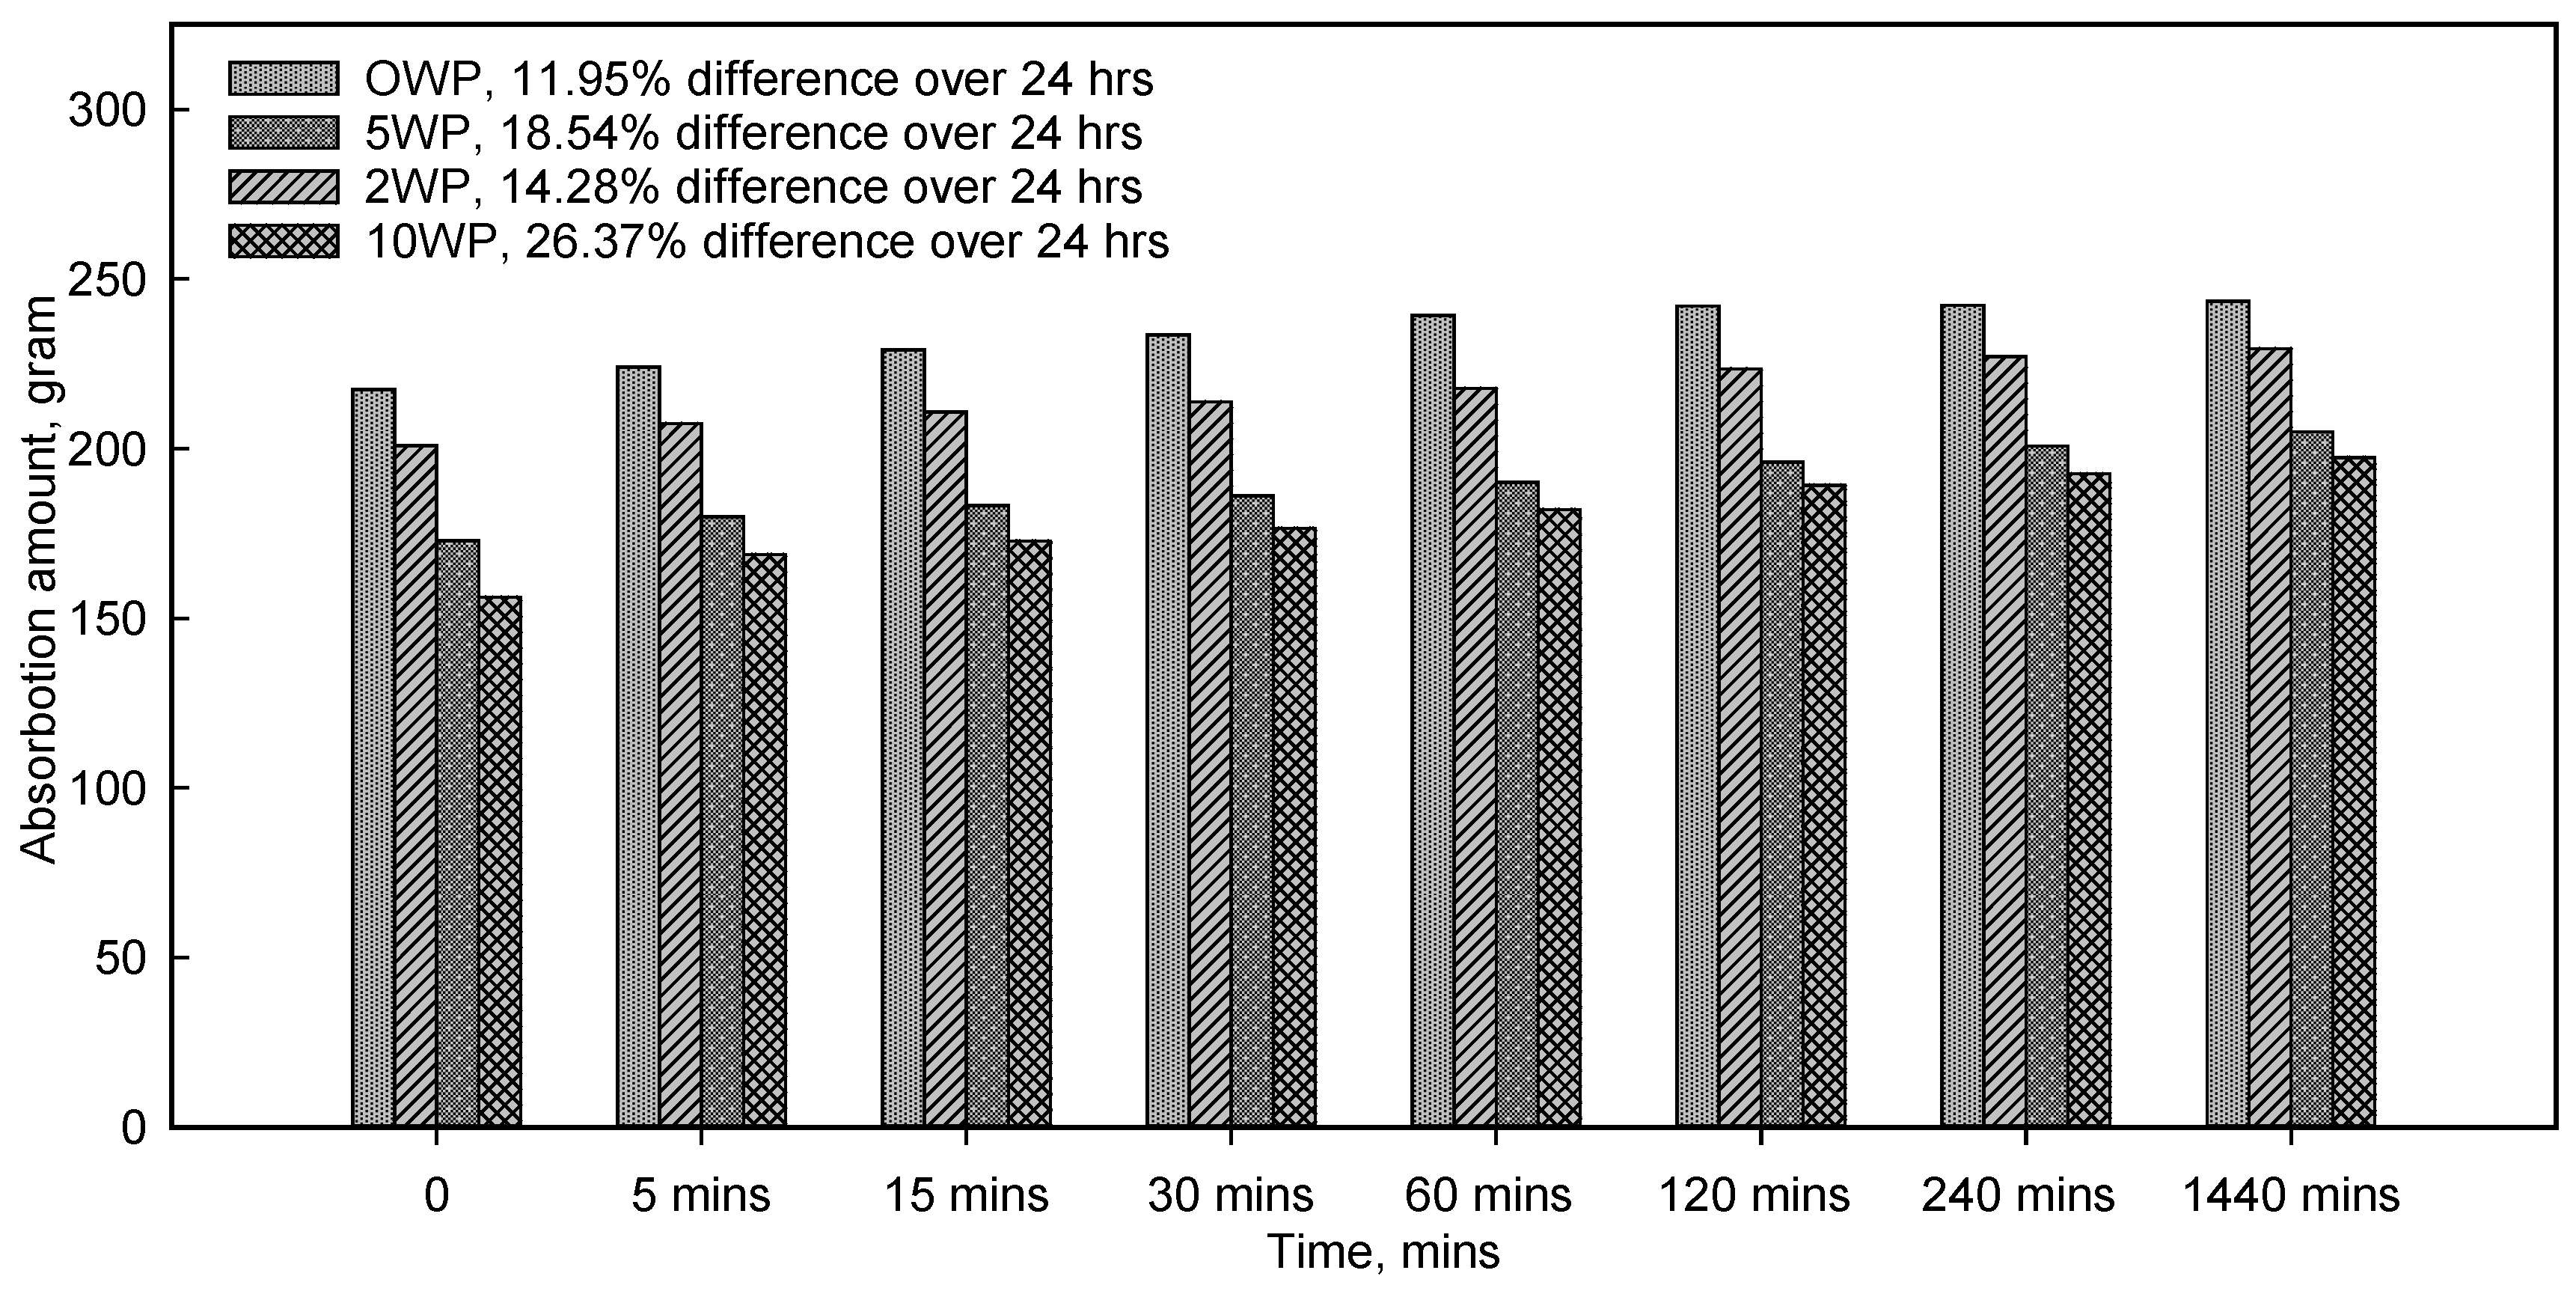
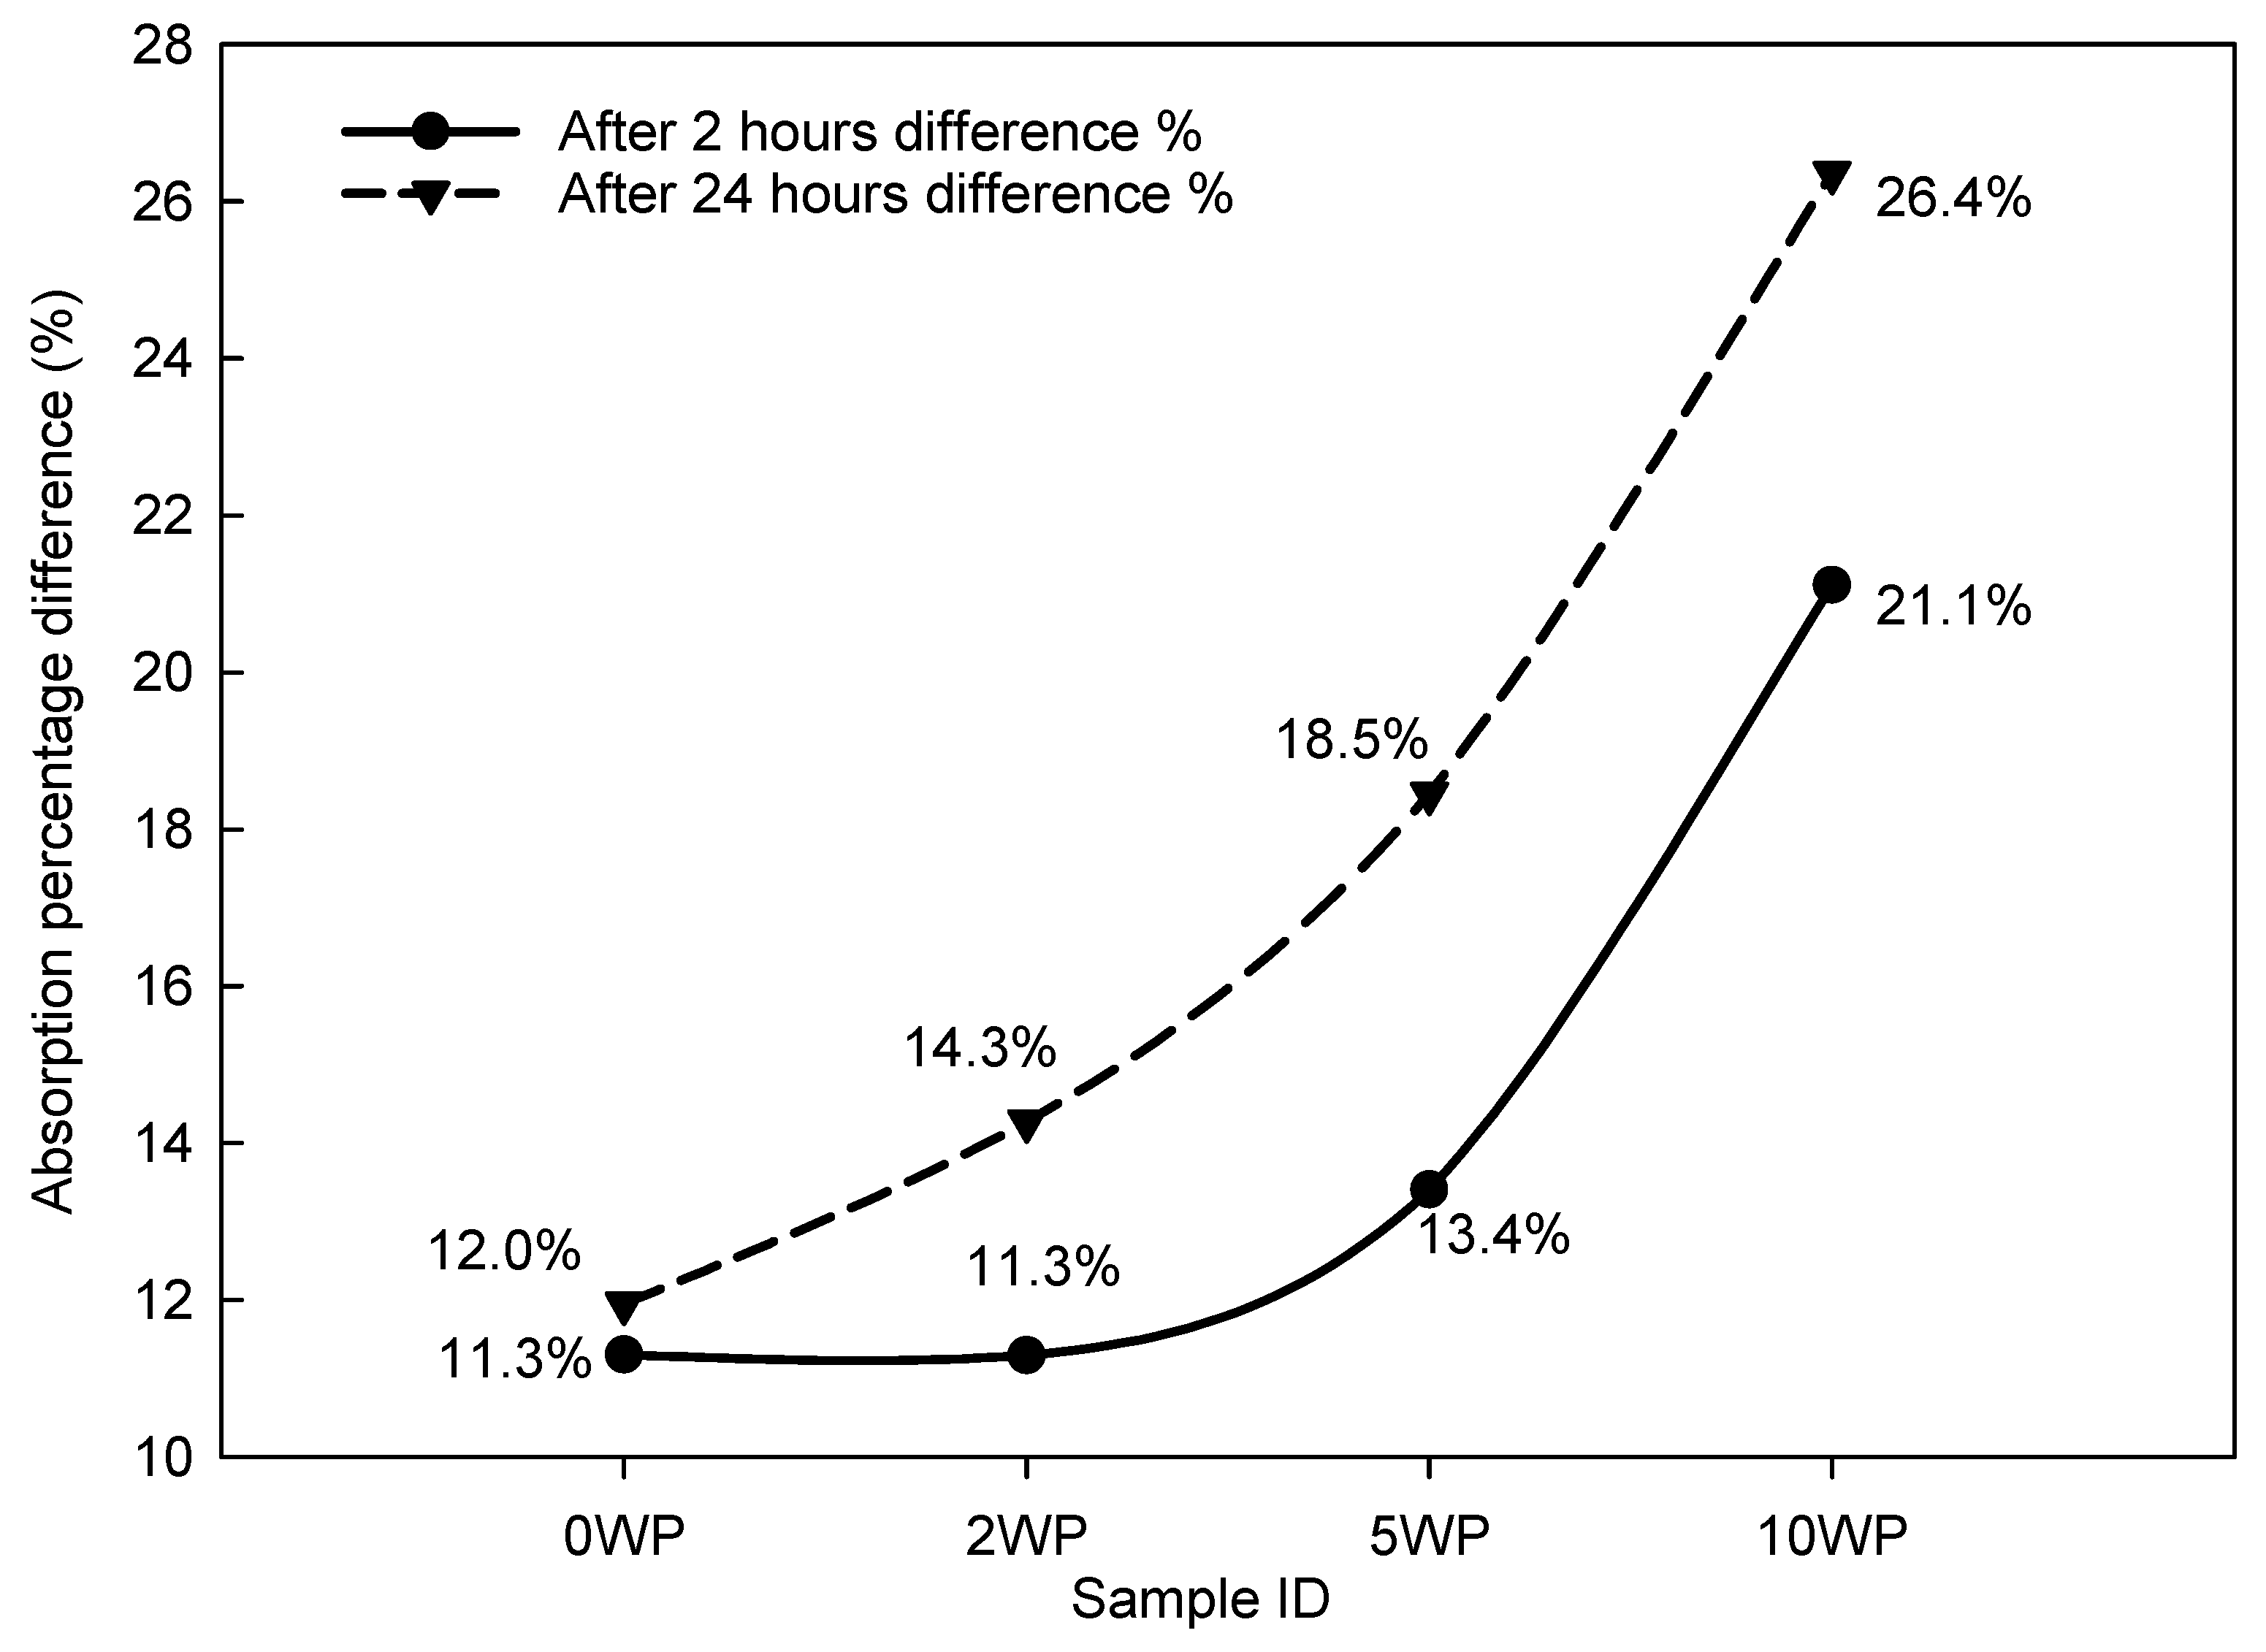
4.3. Capillary Water Absorption Test Results

The average results in Figure 3 shows the first 2 h’ absorption rate when the samples were most absorbent.
Figure 4 links back to much of what has already been discussed concerning the absorption capacity of wood, with 10WP absorbing nearly double the amount of water that 0WP did when analyzing the % difference column. Figure 4, which comprises the mean averages for each sample, also clearly shows the difference in density due to the addition of the wood pellet shavings. The difference between the absorption levels during the first 5 min showcases the ability to react to changing conditions that wood has as a material, again pointing to the notion that as an indoor air regulator, there may be some benefit to the material.
Figure 5 displays the results of the first 24 h of sample absorption, showing that 0WP soon reaches a plateau in terms of its moisture absorption capacity, with slight variation between 2 h and 1 d. In contrast, the samples with the higher proportions of wood pellet shavings maintained a steady absorption rate for a total of 24 h. When comparing the four samples categories, the results reveal that the higher the proportion of wood shavings, the higher the percentage of moisture intake during the experiment.
The capillary coefficient for each of the categories is listed in Table 4. It should be noted that this is based on the values in Figure 3 and relates to the 0–24 h absorption period mentioned. Table 5 shows that the capillary coefficient is tighter for 0WP, 2WP, and 5WP. After that increase, the wood shaving ratio increases the velocity of water absorption. After 2 days, all the samples tend to plateau. Figure 1h gives insight into the porous structure of the samples taken after the 14-day water capillary test period and provides a glimpse into the structure. It was clear when viewing the two together that the 0WP samples were more cohesive in their structure, while the 10WP samples had empty pockets within them, many of which would have resulted from the samples breaking in half due to the tensile flexural strength test. The wood was swelled with moisture, illustrating the fantastic ability of untreated wood to absorb moisture.
Interestingly, in previous study the results go against the study by [10] in that as the density increases, so does the capillary coefficient of water absorption. They found that the higher-density samples in their study absorbed 48% more than the lower-density samples, citing the reason behind this increase as being due to the number of particles in the higher-density samples. It was decided that viewing the absorption throughout 14 days may be of interest (Table 5).

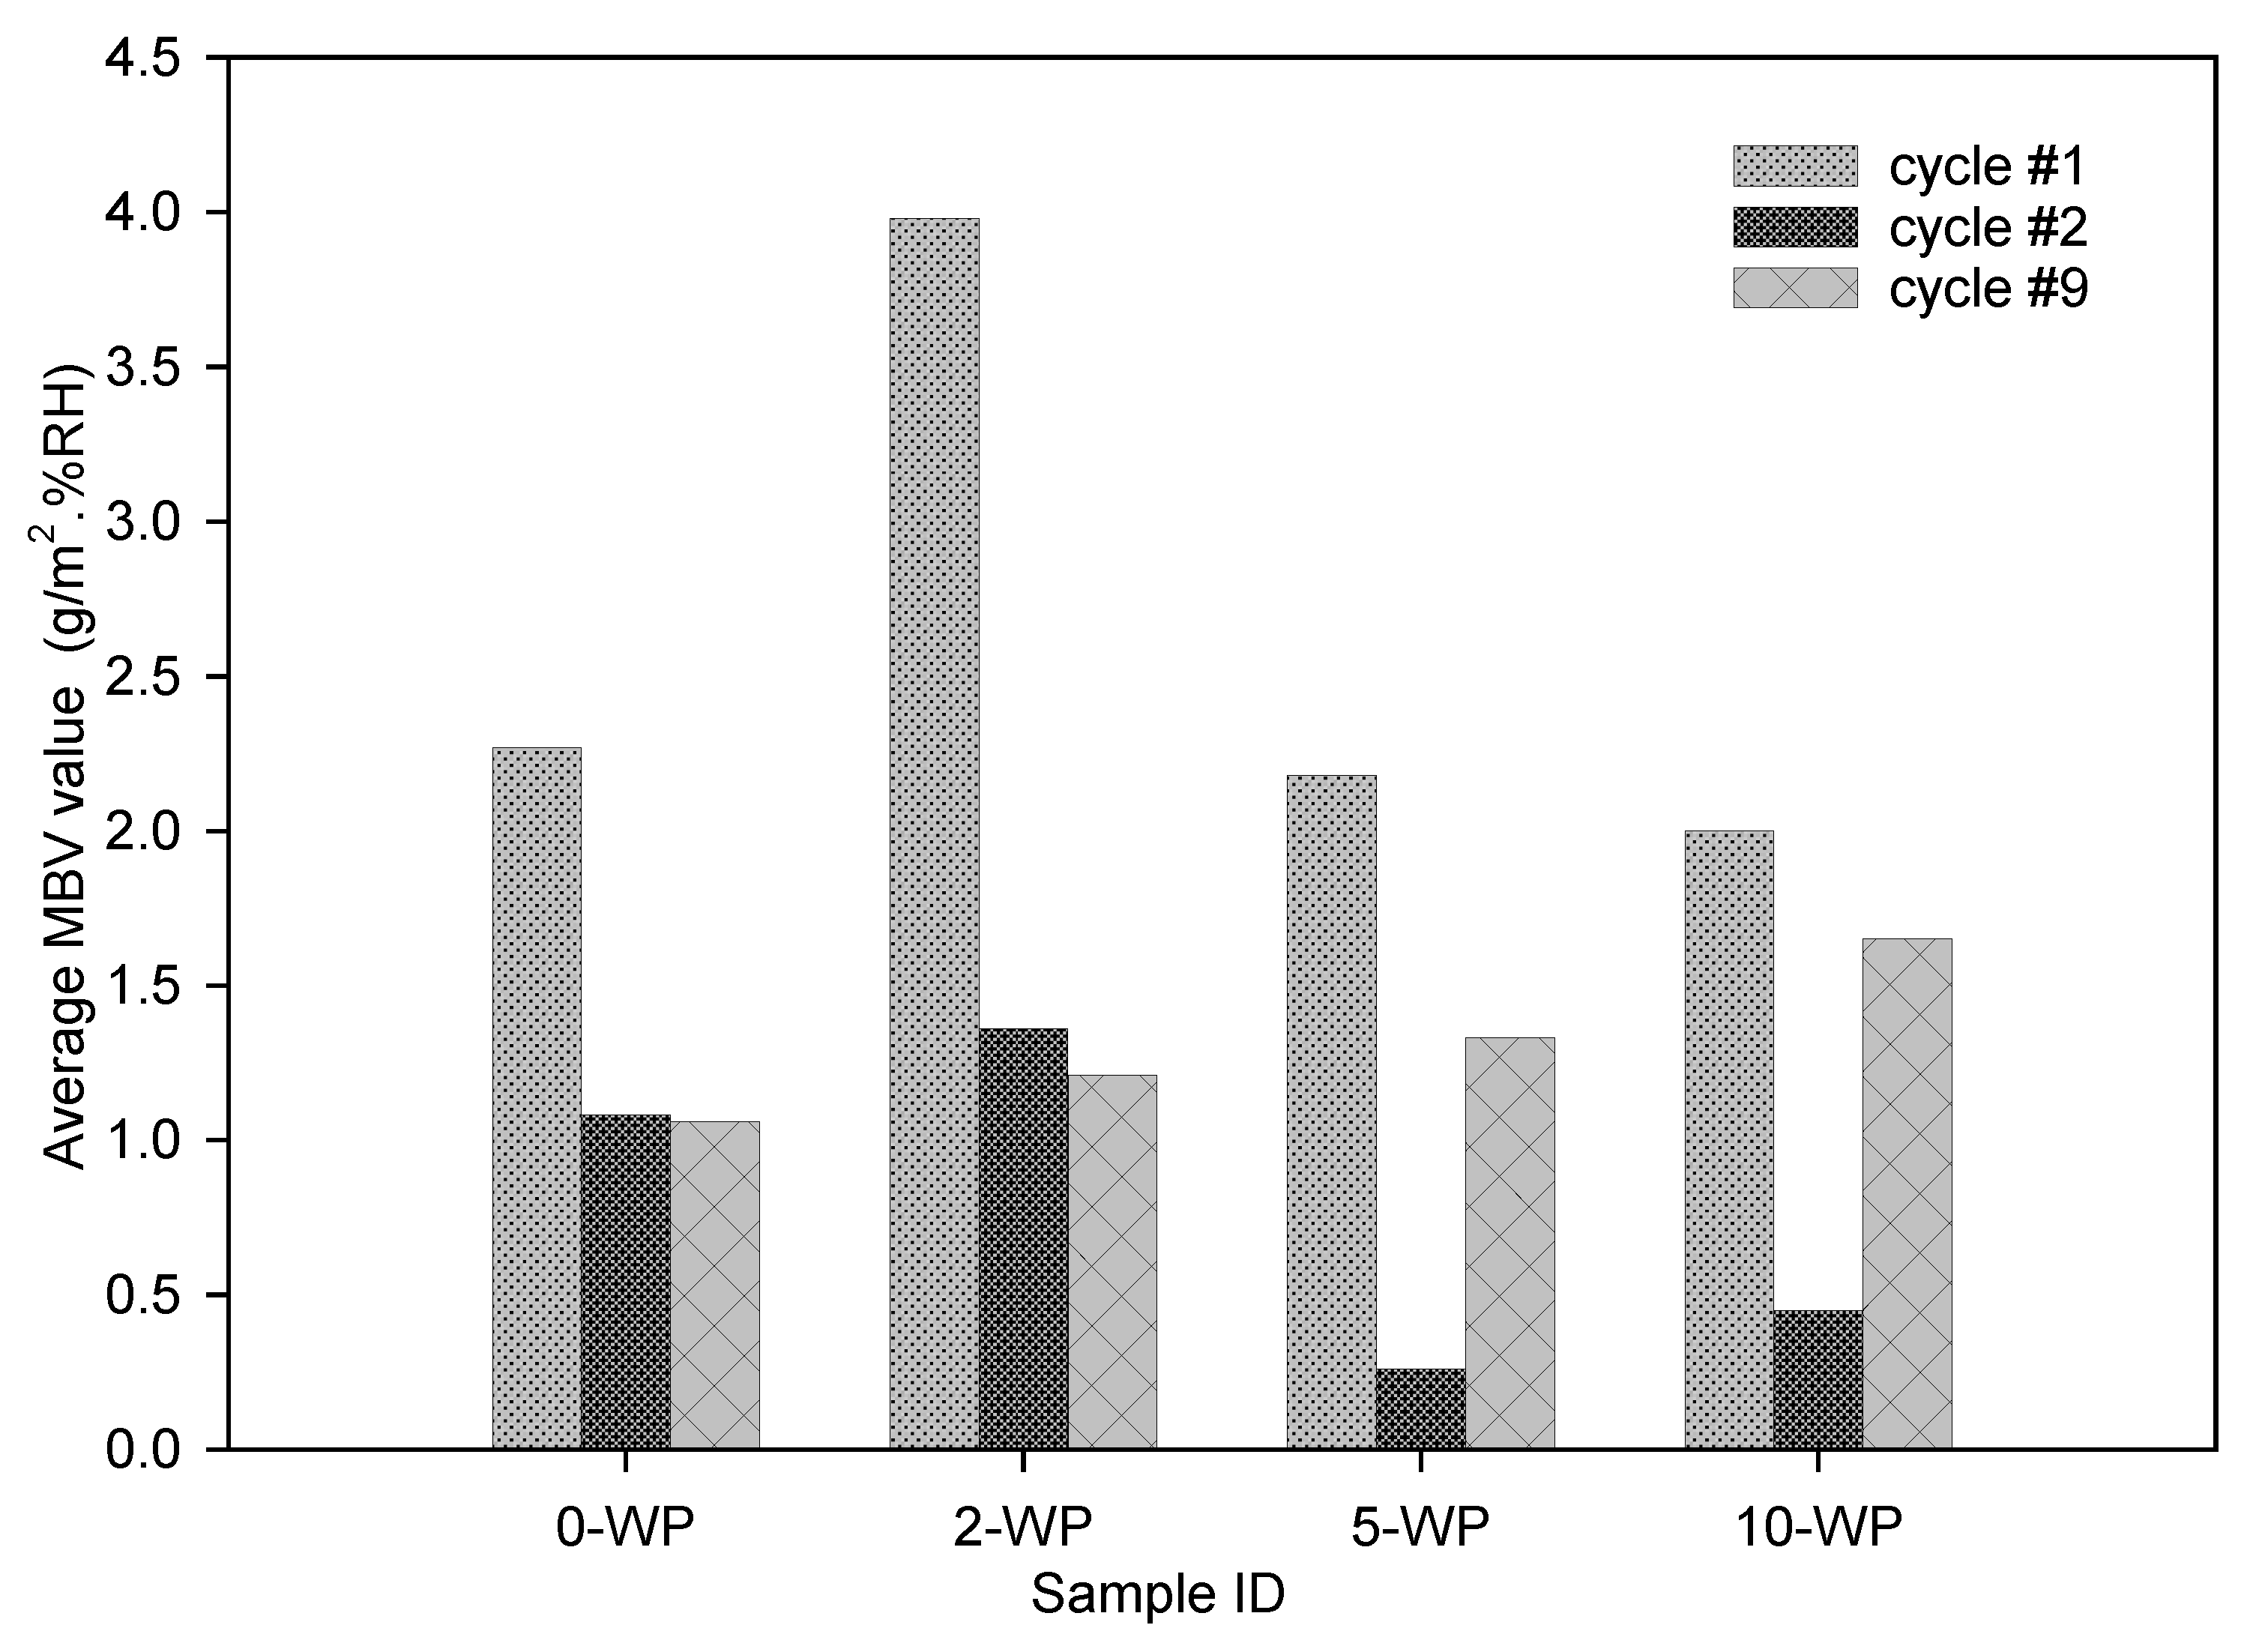
4.4. Moisture Buffer Value Test Results

Table 6 shows that all 12 samples were stabilized (0A–C, 2A–C, 5A–C, 10A–C) on cycle 9; cycle 9 was used to measure the MBV as this was the final cycle in the stabilization period. Table 7 presents the MBV results for the first cycle. It should be noted that due to existing work arrangements, a small section of the final cycle has had specific estimations made on it; due to an inability to measure the readings at the allotted time, these estimations are believed to be accurate to 0.03 g (+/−).
It is clear from Table 6 that the addition of wood positively affects the MBV characteristics of the composites, with a visible improvement noted as the amount of wood increases from 0WP to 10WP. Figure 6 presents the MBV results—stable cycle—mean average of samples. It is evident that the mixture with a higher wood content has an enhanced ability to absorb and desorb moisture in and out of its internal porous structure. To investigate why the samples performed slightly below expectations and analyze the variations between different cycles, it was decided to analyze the MBV of three cycles, the process’s first, second, and end cycles (cycles 1, 2, and 9). Results from this investigation are listed in Figure 6 Although the protocol set out in the NORDTEST [14] was followed, and a 24 h conditioning program was run in the chamber, the difference between the MBV of cycle 1 to cycles 2 and 9 is very noticeable, especially for 5WP and 10WP, showing it takes some time for the samples to stabilize. The faster a sample stabilizes, the quicker it can start to react to the hygrothermal conditions of the chamber.
For this reason, a faster stabilization time would be required when installing a product in the industry. While becoming a common theme of the paper, it is well reported in the literature that due to excessive moisture intake, wood-based mixtures often suffer a decline in performance and damage to their internal matrix structure [5]. This could again provide some reasoning for the performance of the mixture when compared to those in the literature, as a result of the excessive moisture intake while trying to reach industry standards, as displayed in the flow table test EN 1015-3 (1999).
The results of a previous study by Palumbo et al. [34] show that two wood products (wood wool and wood fiber) produced MBV results of 2.6 and 1.9, respectively, when analyzed to the nearest decimal place. Although the samples used in [34] were of a lesser depth, they were still subject to the same MBV conditions used in this study (53–75%, 23 °C).

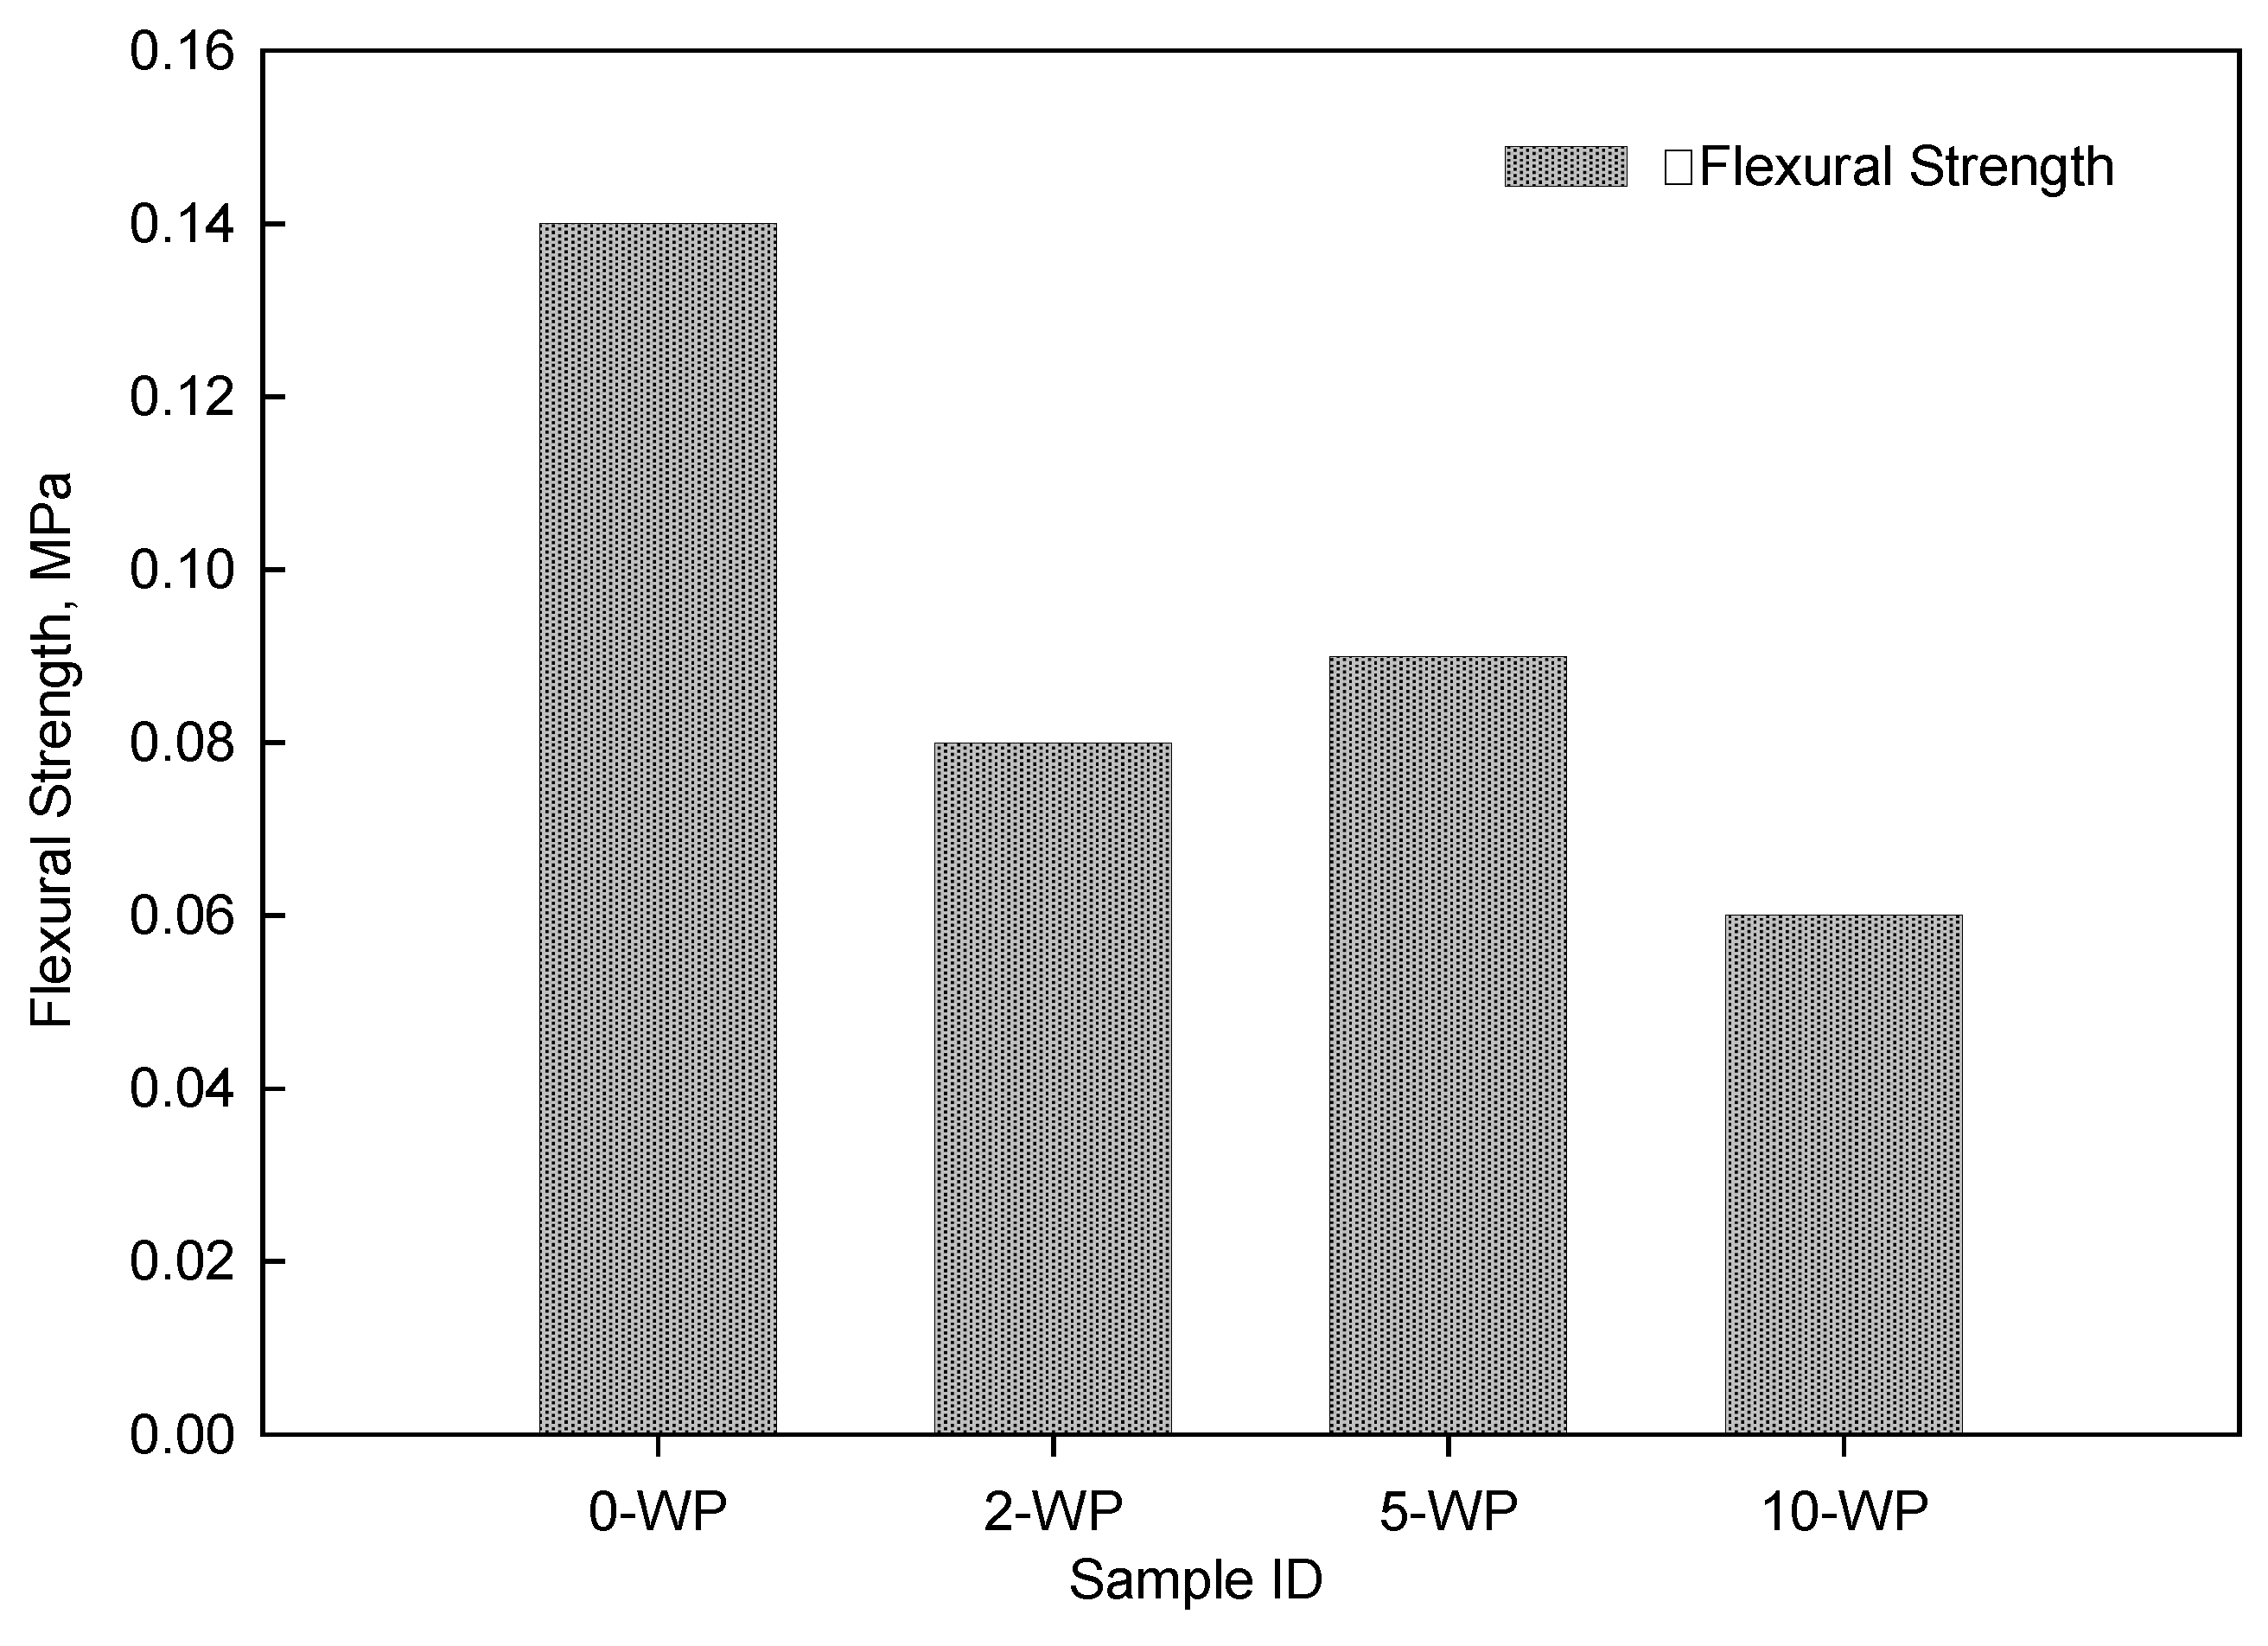
4.5. Flexural Strength Test Results

The average results for the flexural strength test are presented in Figure 7. Based on the results, the increase in untreated wood shavings has been shown to have a negative effect on the flexural strength of the composite used in this study. As shown in Figure 7, there is no sign that adding a small number of shavings (2WP) positively affects the mechanical strength, as was put forward by [35]. There was a noticeable difference in how the mixture without wood addition (0WP) broke under the force of the flexural strength test when compared against those with wood added, especially 10WP. The 0WP sample, as shown in Figure 1f, split into two halves in an exact manner, with a clean split between both halves in all six instances. In comparison, 10WP samples had no uniform breakage, with all samples breaking into different sizes, often with a sizeable disparity between the two halves, as can be seen in Figure 8. The crumbling effect indicates that as the load is bored down on the sample, it is spread across the internal fiber structure, leaving a crumbling effect. While spreading the load would often be positive, due to the relatively short fiber length and cluttered inner matrix, this negatively affects the mechanical strength of the samples. It would be interesting to see the impact of specific treatments on the wood chippings, such as boiling the wood. In some cases, this has been shown to create a more cohesive inner matrix and improve the mechanical strength of the mixture [5].
The results in previous studies [23,37,38] found that the reduction in density caused by the increase in the wood was detrimental to the mechanical strength of a composite. In [5,39], the researchers further investigated the impact of wood’s ability to absorb water on the inner structure of a composite, concluding that the swelling of the wood shavings negatively influences mechanical performance, such as the tensile flexural strength of a composite. The literature in this instance links to the results found in the present study, with a dramatic drop in density and a significant rise in moisture absorption being apparent when comparing the 10WP samples to the 0WP samples.

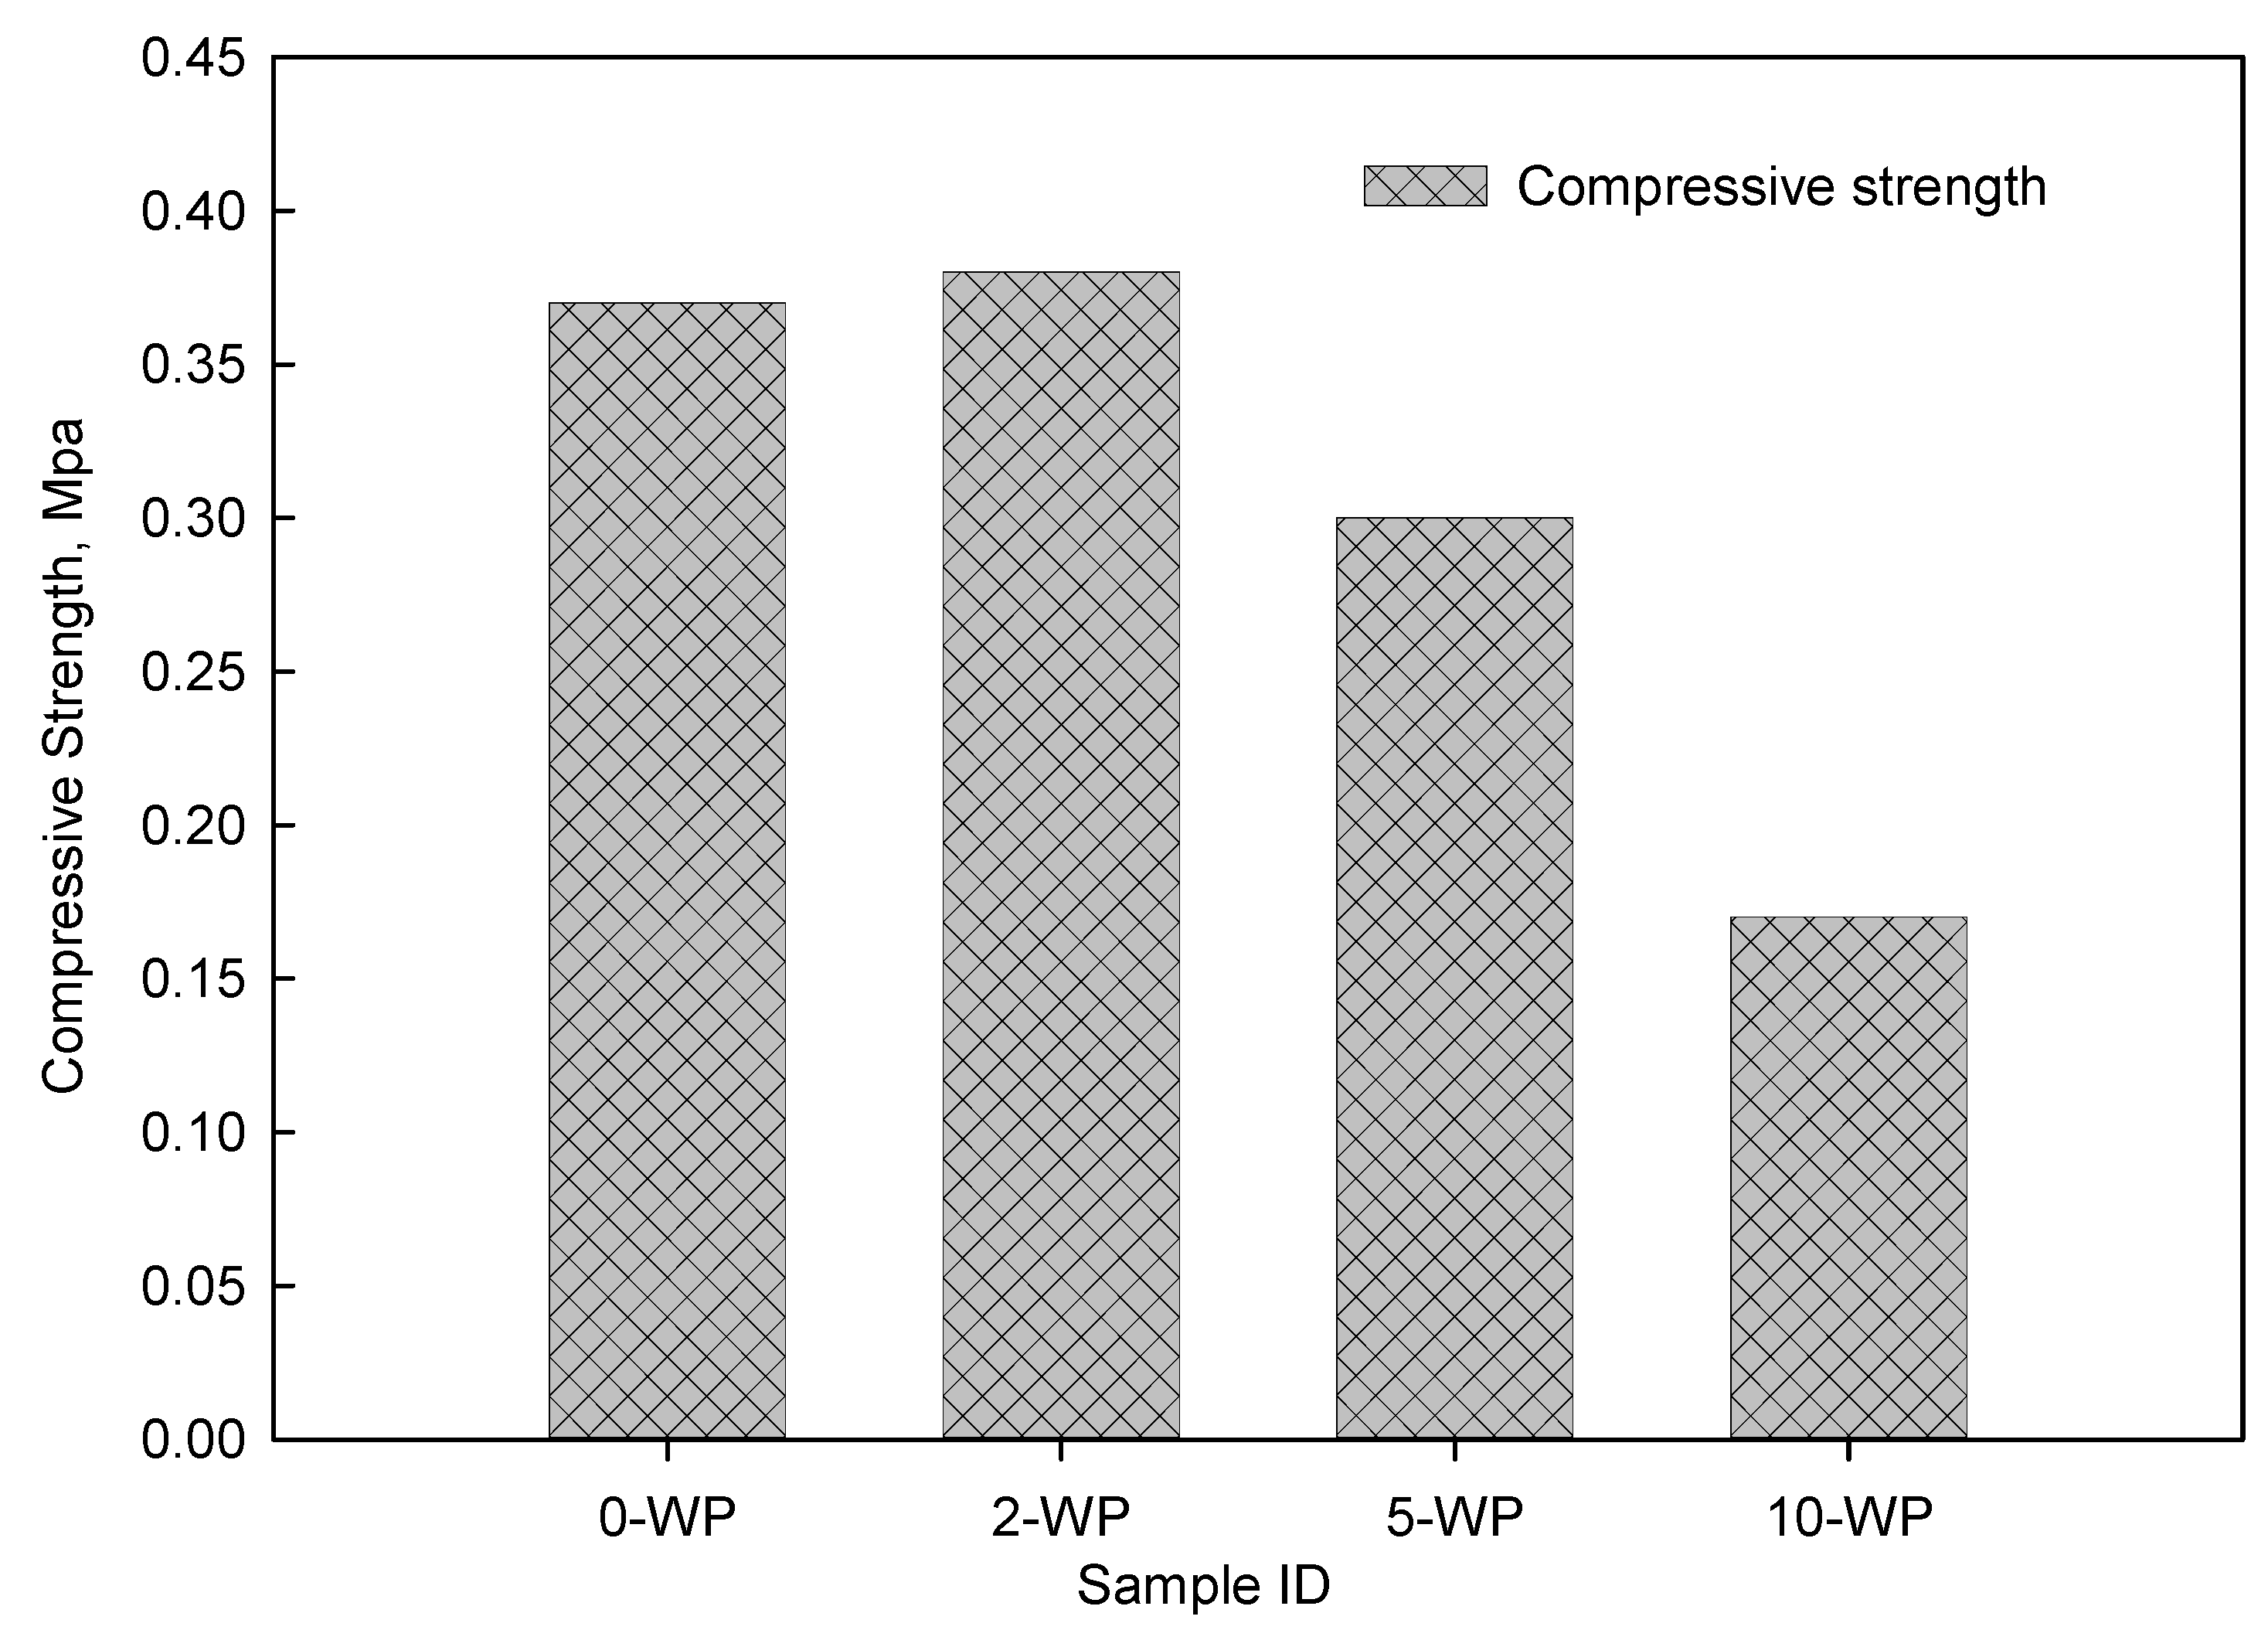
4.6. Compressive Strength Test Results

The average results for all four of the wood pellet mixtures are shown below in Figure 9. The 10WP composite again performed poorly compared to the other composites, showing that an increase in wood shavings negatively affects the mechanical strength of the mixture’s inner matrix compared to 0WP. Interestingly, 2WP exhibited the highest compression resistance of the four composites, performing the second worst, behind 0WP and 5WP. As discussed earlier, the adhesion bore to the structure by the wood shavings has provided some interesting results, with the force of compression again showing signs of spreading throughout the structure of the mixture with higher quantities of wood. A comparison between how the samples were compressed under force is shown in Figure 1g. There is a visible crumbling effect as the addition of wood becomes more prevalent, much like the tensile flexural strength test. The difference between 0WP and 10WP is striking and highlights the impact of wood’s addition on the internal matrix of bio-based material.
The results of a previous study published by Bederina et al. [35] show that a small amount of wood shavings benefited the mechanical strength. It is noted in the literature that researchers who found that fibers benefitted the mechanical strength of a bio-based composite often placed significant emphasis on the orientation of those fibers, with the studied fibers (hemp, wool, etc.) often being long in length and thin in diameter, providing good adhesion to the internal structure.

5. Discussion and Conclusions

This research aimed at developing a high-performance wood pallet insulation product using a sand–lime–soil matrix reinforced with wood pellet shavings while exploring the optimum wood shavings ratio for the internal matrix of the composites. The key findings highlight several important aspects of the developed wood pellet insulation product:
  • Effect of wood pellet shavings on density: positive correlation. The research observes a visible correlation between the increase in wood pellet shavings and a reduction in density among different samples. This is consistent with expectations as wood pellet shavings are generally lighter than the matrix materials;
  • Impact on thermal conductivity: Surprisingly, the thermal conductivity, contrary to the literature suggestions, and the decrease in density did not significantly impact thermal conductivity. Even with higher porosity in samples with more wood pellet shavings, the improvement in thermal conductivity was minimal. This unexpected result challenges conventional assumptions;
  • Mechanical properties and porosity: Higher proportions of wood pellet shavings reduced mechanical properties, likely due to increased porosity. This aligns with the idea that poor adhesion of wood pellet shavings to the inner matrix could compromise overall strength;
  • Compression testing and water capillary test: Despite the general trend of reduced mechanical properties, the 2WP composite showed promise in compression testing, outperforming other mixtures. The wood-based mixture demonstrated a significant capacity to absorb water during the water absorption test, as seen in the water capillary test. This property should be considered in practical applications;
  • MBV results and flow table test: While MBV results were good compared to guidelines, the 100 × 100 × 35 mm samples did not perform as well as expected. Excessive moisture during the mixing stage, influenced by the flow table test, may have negatively impacted results;
  • Flow table test challenges: The results negatively affected the experiment, leading to increased water absorption by samples with wood pellet additions. The necessity to meet minimum consistency requirements impacted the overall performance;
  • Workability and consistency measurement: The research suggests that the mixture with wood pellet additions, especially 10WP, was in a workable state for casting before the flow table test. This highlights a potential issue with the current method of measuring consistency. The study recommends exploring new methods to measure the required consistency of wood-based bio-mixture;
  • Wood fiber treatment: The research emphasizes the importance of improving adhesion between wood pellet fibers and the inner matrix to reduce porosity. Treating wood fibers could be a critical factor in enhancing the mechanical strength of wood-based bio-composites;
  • Cost efficiency: A high-performance wood pallet insulation product using wood pellet shavings, sand, lime, and clay can be influenced by various factors. These factors include material costs, manufacturing processes, energy efficiency, durability, and overall performance. Achieving the ideal wood shavings ratio requires experimentation to balance thermal properties and structural integrity. Considerations of market demand, environmental impact, and adherence to regulations also play a role. Optimizing manufacturing processes for scalability and efficiency can contribute to overall cost-effectiveness.
In conclusion, the research provides valuable insights into the development of high-performance bio-based insulation products. The unexpected findings regarding thermal conductivity and the challenges posed by the flow table test underscore the complexity of developing effective wood-based composites. The recommendations for new consistency measurement methods and wood fiber treatment offer avenues for further research and improvement in the field.

Author Contributions

Conceptualization, A.H.; Methodology, A.H., A.M. and A.A.; Software, A.A.; Validation, A.H. and E.N.; Formal analysis, E.N.; Investigation, A.H.; Resources, A.M.; Data curation, A.M.; Writing—original draft, A.H.; Writing—review & editing, A.M., A.A. and E.N. All authors have read and agreed to the published version of the manuscript.

Funding

The University of Sharjah funded this work under the SEED Research Grant Project No. (2102040168).

Informed Consent Statement

Not applicable.

Data Availability Statement

No new data were created or analyzed in this study.

Acknowledgments

The authors acknowledge the financial and laboratory support provided by the University of Sharjah.

Conflicts of Interest

The authors declare no conflict of interest.

References

  1. Cabeza, L.; Rincón, L.; Vilariño, V.; Pérez, G.; Castell, A. Life cycle assessment (LCA) and life cycle energy analysis (LCEA) of buildings and the building sector: A review. Renew. Sustain. Energy Rev. 2014, 2, 9394–9416. [Google Scholar] [CrossRef]
  2. Vinolas, B.; Casanovas-Rubio, M.; Silva, A.; Roa, J.B.; Andrade, A.; Carvalho, F.; Gonçalves, H.; Rocha, H.J.A. Flexural Strength of High-Performance Soil-Cement: A New, Alternative, Sustainable Construction Material. Sustainability 2023, 15, 15369. [Google Scholar] [CrossRef]
  3. Moujoud, Z.; Harrati, A.; Manni, A.; Naim, A.; El Bouari, A.; Tanane, O. Study of fired clay bricks with coconut shell waste as a renewable pore-forming agent: Technological, mechanical, and thermal properties. J. Build. Eng. 2023, 68, 06107. [Google Scholar] [CrossRef]
  4. Wang, Z.; Wang, D. Can Paper Waste Be Utilised as an Insulation Material in Response to the Current Crisis. Sustainability 2023, 15, 15939. [Google Scholar] [CrossRef]
  5. Ledhem, A.; Dheilly, R.; Benmalek, M.; Quéneudec, M. Properties of wood-based composites formulated with aggregate industry waste. Constr. Build. Mater. 2000, 14, 341–350. [Google Scholar] [CrossRef]
  6. Mujalli, M.; Dirar, S.; Mushtaha, E.; Hussien, A.; Maksoud, A. Evaluation of the Tensile Characteristics and Bond Behaviour of Steel Fibre-Reinforced Concrete: An Overview. Fibers 2022, 10, 104. [Google Scholar] [CrossRef]
  7. Jannat, N.; Al-Mufti, R.; Hussien, A.; Abdullah, B.; Cotgrave, A. Influences of agro-wastes on the physico-mechanical and durability properties of unfired clay blocks. Constr. Build. Mater. 2022, 318, 126011. [Google Scholar] [CrossRef]
  8. Hassan, A.; Abdeen, A.; Mohamed, A.; Elboshy, B. Thermal performance analysis of clay brick mixed with sludge and agriculture waste. Constr. Build. Mater. 2022, 344, 128267. [Google Scholar] [CrossRef]
  9. Lelievre, D.; Colinart, T.; Glouannec, P. Hygrothermal behavior of bio-based building materials including hysteresis effects: Experimental and numerical analyses. Energy Build. 2014, 84, 617–627. [Google Scholar] [CrossRef]
  10. Cetiner, I.; Shea, A. Wood waste as an alternative thermal insulation for buildings. Energy Build. 2018, 168, 374–384. [Google Scholar] [CrossRef]
  11. Palumbo, M.; Lacasta, A.; Giraldo, M.; Haurie, L.; Correal, E. Bio-based insulation materials and their hygrothermal performance in a building envelope system (ETICS). Energy Build. 2018, 174, 147–155. [Google Scholar] [CrossRef]
  12. Hui, S.; Ma, T. Analysis of environmental performance of indoor living walls using embodied energy and carbon. Int. J. Low-Carbon Technol. 2017, 12, 67–74. [Google Scholar] [CrossRef]
  13. Ben-Alon, L.; Loftness, V.; Harries, K.; Hameen, E. Life cycle assessment (LCA) of natural vs conventional building assemblies. Renew. Sustain. Energy Rev. 2021, 144, 110951. [Google Scholar] [CrossRef]
  14. Rode, A.; Peuhkuri, R.; Hansen, K.; Time, B.; Svennberg, K.; Arfvidsson, J.; Ojanen, T. NORDTEST project on moisture buffer value of materials. In Proceedings of the AIVC 26th Conference: Ventilation in Relation to the Energy Performance of Buildings, Air Infiltration and Ventilation, Brussels, Belguim, 21–23 September 2005. [Google Scholar]
  15. Faria, P.; Santos, T.; Aubert, J. Experimental characterization of an earth eco-efficient plastering mortar. J. Mater. Civ. Eng. 2016, 28, 04015085. [Google Scholar] [CrossRef]
  16. Charai, M.; Sghiouri, H.; Mezrhab, A.; Karkri, M. Thermal insulation potential of non-industrial hemp (Moroccan cannabis sativa L.) fibers for green plaster-based building materials. J. Clean. Prod. 2021, 292, 126064. [Google Scholar] [CrossRef]
  17. Czajkowski, Ł.; Kocewicz, R.; Weres, J.; Olek, W. Estimation of Thermal Properties of Straw-Based Insulating Panels. Materials 2022, 15, 1073. [Google Scholar] [CrossRef] [PubMed]
  18. Jannat, N.; Al-Mufti, R.; Hussien, A.; Abdullah, B.; Cotgrave, A. Utilisation of nut shell wastes in brick, mortar and concrete: A review. Constr. Build. Mater. 2021, 293, 123546. [Google Scholar] [CrossRef]
  19. Gameiro, A.; Silva, A.; Faria, P.; Grilo, J.; Branco, T.; Veiga, R.; Velosa, A. Physical and chemical assessment of lime–metakaolin mortars: Influence of binder: Aggregate ratio. Cem. Concr. Compos. 2014, 45, 264–271. [Google Scholar] [CrossRef]
  20. Limam, A.; Zerizer, A.; Quenard, D.; Sallee, H.; Chenak, A. Experimental thermal characterization of bio-based materials (Aleppo Pine wood, cork and their composites) for building insulation. Energy Build. 2016, 116, 89–95. [Google Scholar] [CrossRef]
  21. Millogo, Y.; Morel, J.; Aubert, J.; Ghavami, K. Experimental analysis of Pressed Adobe Blocks reinforced with Hibiscus cannabinus fibers. Constr. Build. Mater. 2014, 52, 71–78. [Google Scholar] [CrossRef]
  22. Ranesi, A.; Faria, P.; Correia, R.; Freire, M.; Veiga, R.; Gonçalves, M. Gypsum Mortars with Acacia dealbata Biomass Waste Additions: Effect of Different Fractions and Contents. Buildings 2022, 12, 339. [Google Scholar] [CrossRef]
  23. Bederina, M.; Marmoret, L.; Mezreb, K.; Khenfer, M.; Bali, A.; Quéneudec, M. Effect of the addition of wood shavings on thermal conductivity of sand concretes: Experimental study and modelling. Constr. Build. Mater. 2007, 21, 66. [Google Scholar] [CrossRef]
  24. Divya, H.; Jeevan, T.; Ashrith, H.; Rudresh, B. Effect of wood filler on the mechanical and thermal behavior of polypropylene/short glass/short carbon fiber-reinforced hybrid composites. J. Braz. Soc. Mech. Sci. Eng. 2022, 44, 265. [Google Scholar] [CrossRef]
  25. Kumar, V.; Kumar, A.; Prasad, B. Mechanical behavior of non-silicate based alkali-activated ground granulated blast furnace slag. Constr. Build. Mater. 2019, 198, 494–500. [Google Scholar] [CrossRef]
  26. EN 1015-2:1999; Methods of Test for Mortar for Masonry—Part 2: Bulk Sampling of Mortars and Preparation of Test Mortars. British Standards Institution: London, UK, 1999.
  27. EN 12664:2001; Thermal Performance of Building Materials and Products—Determination of Thermal Resistance by Means of Guarded Hot Plate and Heat Flow Meter Methods—Dry and Moist Products of Medium and Low Thermal Resistance. British Standards Institution: London, UK, 2001.
  28. EN 12667:2001; Thermal Performance of Building Materials and Products—Determination of Thermal Resistance by Means of Guarded Hot Plate and Heat Flow Meter Methods—Products of High and Medium Thermal Resistance. British Standards Institution: London, UK, 2001.
  29. EN 12939:2001; Thermal Performance of Building Materials and Products—Determination of Thermal Resistance by the Guarded Hot Plate Method and the Fluxmetric Method—Thick Products with High and Medium Thermal Resistance. British Standards Institution: London, UK, 2001.
  30. EN 1015-3:1999; Methods of Test for Mortar for Masonry—Part 3: Determination of Consistence of Fresh Mortar (By Flow Table). British Standards Institution: London, UK, 1999.
  31. Pásztory, Z. An overview of factors influencing thermal conductivity of building insulation materials. J. Build. Eng. 2021, 44, 102604. [Google Scholar]
  32. EN 1015-11:2019; Methods of Test for Mortar for Masonry—Part 11: Determination of Flexural and Compressive Strength of Hardened Mortar. British Standards Institution: London, UK, 2019.
  33. Bederina, M.; Gotteicha, M.; Belhadj, B.; Dheily, R.; Khenfer, M.; Queneudec, M. Drying shrinkage studies of wood sand concrete–Effect of different wood treatments. Constr. Build. Mater. 2012, 36, 1066–1075. [Google Scholar] [CrossRef]
  34. Palumbo, M.; Lacasta, A.; Holcroft, N.; Shea, A.; Walker, P. Determination of hygrothermal parameters of experimental and commercial bio-based insulation materials. Constr. Build. Mater. 2016, 124, 269–275. [Google Scholar] [CrossRef]
  35. Bederina, M.; Hadjoudja, M.; Dheilly, R.; Makhloufi, Z.; Quéneudec, M. Combined effect of sand grain size and contents of wood and filler on the physicomechanical properties and the microstructure of lightweight sand concrete. J. Adhes. Sci. Technol. 2016, 30, 1391–1412. [Google Scholar] [CrossRef]
  36. Abu-Jdayil, B.; Mourad, A.; Hittini, W.; Hassan, M.; Hameedi, S. Traditional, state-of-the-art and renewable thermal building insulation materials: An overview. Constr. Build. Mater. 2019, 214, 709–735. [Google Scholar] [CrossRef]
  37. Al Rim, K.; Ledhem, A.; Douzane, O.; Dheilly, R.; Queneudec, M. Influence of the proportion of wood on the thermal and mechanical performances of clay-cement-wood composites. Cem. Concr. Compos. 1999, 21, 269–276. [Google Scholar] [CrossRef]
  38. Harada, T.; Hirata, T.; Setoyama, K.; Ohkoshi, M. Utilization of wood and its feasibility as ecomaterials. In Ecomaterials; Elsevier: Amsterdam, The Netherlands, 1994; pp. 677–680. [Google Scholar]
  39. Winandy, J.; Morrell, J. Improving the utility, performance, and durability of wood-and bio-based composites. Ann. For. Sci. 2017, 74, 25. [Google Scholar] [CrossRef]
Figure 1. (a,b) Flow table test, (c) capillary water absorption test, (d) square samples with exposed face, (e) thermal conductivity test, (f) flexural Tensile Strength Test, (g) compressive test, and (h) 0Wp and 10%WP after 14-day water capillary absorption test.
Sustainability 16 00025 g001
Figure 2. Thermal conductivity and density of samples 63 days after casting.
Sustainability 16 00025 g002
Figure 3. The 24 h absorption statistics—mean averages.
Sustainability 16 00025 g003
Figure 4. The 2 h and 24 h absorption percentage difference.
Sustainability 16 00025 g004
Figure 5. The 24 h absorption statistics for all samples.
Sustainability 16 00025 g005
Figure 6. The MBV average results for cycles 1, 2, and 9.
Sustainability 16 00025 g006
Figure 7. The average tensile flexural strength of samples.
Sustainability 16 00025 g007
Figure 8. The breakage comparison between samples.
Sustainability 16 00025 g008
Figure 9. The compressive strength average for samples.
Sustainability 16 00025 g009
Table 1. Materials used in the mixtures.
MaterialsDescription
ClayReddish-brown clay was purchased from Al Diyar Bricks and Cladding Brick Slip Manufacturer and Supplier from Sharjah, U.A.E.
A hydrometer analysis was performed on the clay to obtain its soil classification as silty clay with 10% sand.
The grain-size distribution for the clay was measured via the hydrometer test.
SandFine sand was used for the composite, purchased from local supplier Al Diyar Bricks and Cladding Brick Slip Manufacturer and Supplier, U.A.E.
The sand was stored inside the lab to ensure no excess moisture was present in the sand.
LimeHydrated air lime was added to the composite due to its stabilizing effects. The hydrated air lime was purchased from the Emirates Lime Factory Manufacturer and Supplier, Abu Dhabi, U.A.E.
Wood PelletsThe wood pellets used were purchased from a local supplier, Saleh International Building Materials, Dubai, U.A.E.
Wood pellets were grinded and sieved to have a controlled particle size between 1.18 mm and 2 mm.
Table 2. Mixing proportions of samples and breakdown of composite samples created.
SampleSandLimeClayWood Pellets WaterWood Molds 100 × 100 × 35 mm3Prismatic
Samples 40 × 40 × 160 mm3
%g%g%g%gmL39
0WP88.6686010.311001.03100024039
2WP88.6686010.311001.0310219.429539
5WP88.6686010.311001.0310543.534539
10WP88.6686010.311001.0310109748039
Table 3. Flow table test results.
MaterialWood Pellet Shavings (g)Water Volume (mL)Consistency (mm)Difference (mL)% Absorption of Water by Wood Shavings
0WP02401520N/A
2WP19.429515445232%
5WP43.5345155105241%
10WP97480153240247%
Table 4. The capillary water absorption coefficient of samples.
SampleCapillary Water Absorption Coefficient
0WP0.0162 kg/m2S0.5
2WP0.0179 kg/m2S0.5
5WP0.0200 kg/m2S0.5
10WP0.0258 kg/m2S0.5
Table 5. The 14 days’ absorption statistics mean average and percentage differences.
Sample ID0′1D7D8D13D14D% Difference
0WP217.45243.43246.12246.36247.26274.2613.71%
2WP200.86229.53234.77235.20237.43237.5418.26%
5WP172.94205.00211.93212.48215.11215.2324.45%
10WP156.27197.47205.69205.69207.58207.7032.92%
Table 6. The average MBV as well as the coefficient of variation% (COV) for each sample type in the stable cycle.
SampleMoisture Buffering Value (MBV) (g/M2. % RH)Coefficient of Variation % (COV)
0WP1.0616
2WP1.214
5WP1.337
10WP1.659
Table 7. The MBV results first cycle and cycle 9 stable cycle.
SampleMoisture Buffering Value (MBV) (g/M2. % RH)
MBV Results First Cycle
Moisture Buffering Value
(MBV) (g/M2. % RH)
MBV Results Stable Cycle
0A3.231.18
0B0.590.86
0C3.001.14
2A5.181.18
2B5.181.27
2C1.591.18
5A1.951.41
5B1.911.23
5C2.681.36
10A2.361.82
10B2.951.55
10C0.681.59
Disclaimer/Publisher’s Note: The statements, opinions and data contained in all publications are solely those of the individual author(s) and contributor(s) and not of MDPI and/or the editor(s). MDPI and/or the editor(s) disclaim responsibility for any injury to people or property resulting from any ideas, methods, instructions or products referred to in the content.

