Abstract
Autonomous vehicles (AVs) are expected to be seen easily on our roads, providing benefits to society in the future. However, due to the challenges faced such as technical and regulatory issues, it will take a long time to reach 100% AVs, suggesting the coexistence of AVs and human-driven vehicles (HVs) for a substantial time. This coexistence of the mixed traffic of AVs and HVs may affect network performances in urban areas. Under this circumstance, to promote the rapid advancement of AV technology, transportation authorities are considering introducing AV-exclusive lanes. This study evaluates AV lane operation scenarios with mixed traffic consisting of both AVs and HVs. We utilized a macroscopic traffic simulation-based approach to measure the effects of AV lanes on two urban expressways in Seoul, South Korea. We varied the market penetration rate (MPR) from 10 to 80% in 10% increments. The simulation results indicate that the impact of exclusive lanes can be either negligible or beneficial depending on the characteristics of the roads. The results also showed that, in terms of the efficient use of road capacity, AV lanes should be introduced when the MPR reaches at least 20 to 30%. The results also showed that the capacity gain effect is more sensitive over a lower MPR range. We expect this study to not only enhance policy makers’ and planners’ fundamental understanding of the early stages of AV-exclusive lanes, but also help them prepare a large-scale urban network structure in the future.
1. Introduction
Autonomous vehicles (AVs) can increase mobility in cities by making it more efficient, user friendly, environmentally friendly, and ubiquitous by addressing issues such as road congestion, parking, and pollution [1]. With continuous testing and prototyping, the global race to develop AVs is progressing rapidly [2]. The U.S. declared that it would invest USD 4 billion over a 10-year period beginning in 2016, and has approved the use of AVs in 33 states. The EU is also committed to working with its members to commercialize AVs, as shown by its Declaration of Amsterdam in April 2016. In addition, the top 10 industries listed in Japan’s Strategic Innovation Promotion Program included the AV sector [3].
Following this trend, in 2019, the Korean government enacted the “Act on the Promotion and Support of Autonomous Vehicle Commercialization” to facilitate the rapid advancement of AV-related technology and services. Indeed, the Korean government has initiated several AV research and development (R&D) programs since 2021, allocating a budget of KRW 1.974 trillion (equivalent to USD 861 million) over the subsequent seven years. The Korean Ministry of Land, Infrastructure, and Transport (MOLIT) aims to build real-time communication infrastructure for safe and efficient AV operations on roads across the country by 2030, and to install such systems in congested areas (such as downtown areas) by 2027, in conjunction with local governments. Major expressways are to be completed by 2023, urban and national main roads by 2027, and national roads by 2030. The MOLIT announced that the market penetration rate (MPR) for AVs will reach 50% by 2035, due to its numerous R&D programs. These policies and financial investments of the Korean government illustrate the strong support of growth of AVs.
Currently, the Korean government is focusing on developing and introducing new AV-related technologies [4]. Examples include V2V (Vehicle-to-Vehicle), which enables AVs to communicate with each other, and V2I (Vehicle-to-Infrastructure), which enables AVs to communicate with infrastructure in real time [5]. With the introduction of AVs, traffic accidents are expected to decrease as human-related factors such as distraction and impaired driving are reduced [2,6]. However, the MPR of AVs has not grown as quickly as expected [5]. According to a recent study, the MPR of level-4 AVs will only reach 24.8% by 2045 [7]. Considering that autonomous driving still faces numerous challenges including technical immaturity, regulations, and ethics, AVs and human-driven vehicles (HVs) will coexist for a long time in the future before the MPR reaches 100% [8,9,10]. Considering the realistic and short- to mid-term outlook for AVs, this study considered the MPR range of AVs between 10% and 80%.
A notable risk factor is that the introduction of AVs may have a negative impact on mixed traffic (i.e., traffic with both AVs and HVs). This is because AVs may not be able to deal well with the diverse set of environments likely to occur on real-world roadways with mixed traffic, including complex turbulence incurred by irregular driving behaviors of HVs. In other words, the operating conditions of mixed traffic may be beyond the capabilities of AVs. Unfortunately, mixed traffic flow is expected to continue for a considerable period of time after the introduction of AVs. Thus, even when AV adoption is very common, governments may forbid their use on major and local roads due to safety concerns regarding collisions with HVs [11]. This may be because expressways will be the first roads to have V2I capabilities, which will help ensure safety. An alternative approach would be for central or local governments to sequentially introduce exclusive lanes for AVs on certain sections of roadways, while waiting for the technology to advance [12].
The goal of this study is to analyze the effect of exclusive lanes for AVs on expressways under mixed traffic (AVs and HVs). To introduce AVs on actual roads with minimal conflict between AVs and HVs, it is necessary to understand the consequences of mixed traffic flow. In previous studies, the results for capacity gain (e.g., capacity increases due to the minimized perception reaction time by the sensors installed on AVs) were not consistent, and there were few instances including exclusive lanes for AVs. This study simulated the real-world traffic network in Seoul, South Korea by applying capacity gain values as suggested in the revised Highway Capacity Manual (HCM) (2022). This study is an early attempt to define an integrated approach for evaluating the introduction of AV-exclusive lanes on urban expressways with mixed traffic. The most important contribution of this paper is to provide quantitative evidence on the impact of exclusive lanes for AVs in improving the efficiency of traffic operations in a real and large-scale urban network.
The remainder of this paper is structured as follows. Section 2 covers previous studies related to the capacity gain of AVs. Section 3 describes the methodology (simulation) and the input data in detail. Subsequently, Section 4 discusses the effects of AVs exclusive lanes on road performance and sensitivity analysis results obtained by changing capacity gain values. Finally, Section 5 presents policy implications and provides limitations and future study directions.
2. Literature Review
AVs have the potential to significantly improve the capacity of roadways due to their faster recognition and reaction times compared to HVs [6,11]. Another factor likely to increase road capacity is that the recommended following distance (between a vehicle and the vehicle preceding it) is smaller for AVs than for HVs. Additionally, as a direct result of the increased road capacity, situations with a higher MPR have a longer free-flow phase which is able to move vehicles with less influences from other vehicles within the same traffic stream or in the opposite traffic stream [13].
Previous studies have demonstrated the capacity gain of AVs in simulated experiments [11,13,14,15,16,17,18]. For example, the study in [17] used macroscopic traffic flow models to analyze the effect of AVs on the capacities of freeways and intersections. In the study, Friedrich assumed a minimum following distance of 3 m. Temporal distances to the preceding vehicle (time gaps) of 1.15 s for HVs and 0.5 s for AVs were assigned. AVs were found to produce a capacity gain of up to 78% on freeways at 100% MPR. Using a cellular automation model, the study in [13] simulated the change in capacity associated with MPR for freeway traffic. They found that capacity eventually grows up to MPR of 30% for connected AVs (CAVs). When the MPR exceeded 30%, the capacity was primarily determined by the desired net time gap. Ye and Yamamoto estimated that a 50% capacity increase would occur under the conditions of 100% AVs and a net time gap (between each CAV and the vehicle preceding it) of 0.8 s.
The study in [18] simulated the situation of 100% AVs and the current traffic conditions in the city of Rome, Italy. Fully autonomous vehicles were assumed to be electric vehicles with connectivity, light detection, and ranging sensors. The travel demand for AVs was assumed to be equal to the current car demand. They found that, at 100% MPR, the capacity gain was up to 80% for freeways and up to 40% for urban roads. Over the entire simulated network, the number of vehicle kilometers traveled (VKT) was almost the same for the two scenarios. However, in the 100% AV scenario, the total time spent driving decreased by 33%, and the average network speed increased by 51%, with better performance he on freeways.
A macroscopic modelling approach has often been employed to simulate AV operating conditions. For instance, using EMME 4 (Version 23.00.01.23), a macroscopic traffic simulation tool (software), the study in [11] simulated AV penetration scenarios in the Greater Toronto, Canada. The study assumed a freeway capacity gain of 3%, 21%, and 80% at 10%, 50%, and 90% MPR, respectively. The study results showed that, in an AV operations scenario for freeways, the average travel time savings at the 10%, 50%, and 90% MPR levels were 2.9%, 9.3%, and 22.9%, respectively. They also found that average travel times increased by up to 25% on several ramps and on nearby arterial streets connecting the freeway with downtown. Kloostra and Roorda also found that, under the scenario of AV operations on all routes, the monetary value of the travel time savings amounted to approximately CAD $508 million annually.
Confirming the capacity gains presented by numerous studies, the Highway Capacity Manual 7th Edition (HCM, 2022) provides capacity adjustment factors for basic freeway segments. These capacity adjustment factors are varied depending on the MPR of CAVs. The HCM (2022) suggests an increase of 7–27% in the capacity of a freeway at 40% MPR and a 33–78% increase in capacity at 100% MPR (at a segment capacity of 2400 to 1800 pc/h/ln). Figure 1 compares the capacity gain results of the studies discussed above. When the MPR changes from 10% to 20%, the change (slope) in capacity gain is the largest. From MPR 30%, the value of capacity gain increases, but the rate of increase in capacity gain gradually decreases.
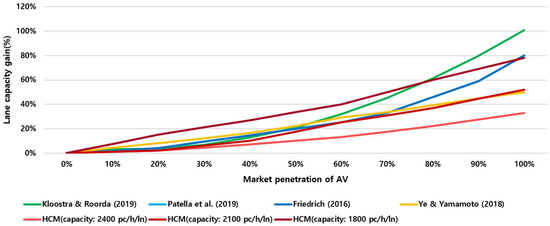
Figure 1.
Predicted capacity gain of AVs at different levels of market penetration [11,13,17,18].
The use of exclusive lanes such as bus lanes and high-occupancy vehicle (HOV) lanes has often been proposed as a traffic management strategy to alleviate the congestion and safety issues caused by mixed traffic [19,20]. The implementation of an AV-exclusive lane can be a viable strategy to mitigate interaction and enhance the efficiency of mixed traffic based on prior successful experience [21]. For instance, the study in [22] evaluated an exclusive lanes system (for AVs on arterial roads of São Paulo, Brazil) on travel time using a mesoscopic traffic simulation. The study assumed that the capacity of the AV-exclusive lane would be 10–50% larger than the capacity of the HV lanes. The results showed that the average travel time decreased until the MPR of 35%, and travel times on some parts of the network were shorter than the base scenario (without AV lanes) for the MPRs between 25% and 50%.
Previous studies (Ma and Wang, 2019 [12]; Hua et al., 2020 [21]; Baek et al., 2021 [23]; Zhang et al., 2020 [24]) have simulated the effect of exclusive lanes for AVs under different MPRs using toy networks. The study in [12] simulated exclusive lanes for AVs on freeway sections. They found that traffic flow was asymptotically steady, and that the impact of AV-exclusive lanes on traffic flow declined at MPRs above 60%. Their study also identified a maximum capacity gain of 37%. The study in [24] analyzed the safety of exclusive lanes for AVs on freeways, with varying MPRs and traffic demands using a calibrated microscopic simulation model. Additionally, the PreScan simulation program was utilized for building an overtaking-maneuver scenario through the use of advanced driver-assistance systems (ADAS) [25]. The widely applied microscopic simulation models include MATLAB-based ones, cellular automata (CA) model, and VISSIM [14,21,24].
The introduction of AVs may change the current travel demand situations. Indeed, the study in [26] argued that AVs will allow people without a driver’s license (children, the disabled, etc.) to travel in cars. Thus, travel demand is likely to increase due to these new user groups. Additionally, since their passengers can engage in non-driving activities, AVs will decrease drivers’ willingness to pay for reduced travel times, thus value of time reduction, for travelers [18,27,28,29]. As a result, a significant mode shift to AVs from public transportation is anticipated [14].
Previous studies illustrate that capacity gain and impacts according to MPRs after the introduction of AV-exclusive lanes differ depending on the traffic environment (e.g., traffic volume, number of lanes, studied road lengths). In order for the impacts to be accurately projected for diverse locations, further studies considering different traffic conditions are required. This study attempts to add to the current body of knowledge by examining the impacts of AV-exclusive lanes on major urban expressways in Seoul, South Korea, a dense metropolitan city. The results are expected to provide insights toward AV-exclusive lane operations under mixed traffic conditions.
3. Methodology
3.1. Simulation
In our simulation, we assumed fully automated vehicles with level 4 or higher driving automation, connectivity, and ranging sensors. In addition, it was assumed that private vehicle trips were converted into AV trips according to MPR scenario. Thus, factors that may influence travel demand, such as mode choice, population growth, and regional trip distribution, were excluded from consideration. We also assumed that the AVs performed all driving tasks, and that no human attention or interaction was required.
We conducted multiple simulations using Emme4 software to assess network performance on a regional scale in response to varying AV operating scenarios. Emme4 is one of the most widely applied macroscopic transportation simulation models, and the Korea Transport Database (KTDB) provides the updated Emme4 applicable network every year for various traffic impact analyses. KTDB is a publicly available travel demand database that includes origin–destination (O–D) trip data and transportation networks to which travel demands can be assigned under various AV operating scenarios. It is commonly believed that KTDB is the most reliable transportation database in South Korea and numerous macroscopic transportation studies are conducted using its network and O–D trips [30]. Emme4 performs a static user equilibrium assignment of auto traffic [11,18,31]. Regarding travel demand, we utilized daily O–D trips observed on a typical weekday in the Seoul metropolitan area. Therefore, the scope of this study is limited to the typical daily traffic conditions, not focusing on peak/off-peak hours or weather affected traffic conditions.
Based on the simulation, we measured changes in traffic volume, VKT, travel time, and speed based on MPR for AV-exclusive lanes and regular lanes on urban expressways.
3.2. Study Area
We targeted the city of Seoul, the capital of South Korea (Figure 2) and home to 9.6 million people (18.55% of the total population of South Korea as of 2022). Seoul has a relatively high transit mode share compared to other global cities by virtue of a well-established transit network and transit-oriented development. This transit network is credited for changing the spatial structure of Seoul to decentralized from monocentric. Indeed, the mode share of public transit in Seoul is approximately 70% [32]. It is also known that 31.9 million trips are generated by all motorized travel modes every day, and that 17 expressways are under operation in Seoul, handling high-speed traffic and providing rapid mobility for long trips.
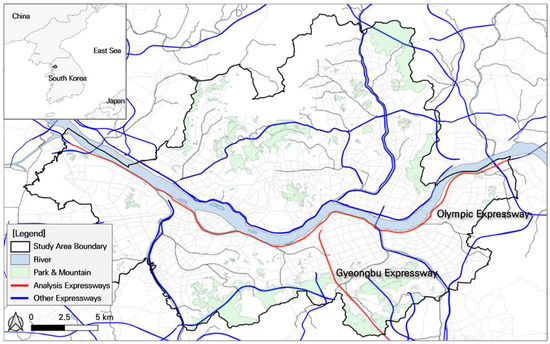
Figure 2.
Study area.
As previously mentioned, Korean MOLIT is seeking to preemptively introduce autonomous driving on urban expressways. In our simulation, we assumed that AV-exclusive lanes were created through conversion of existing lanes. This assumed conversion seems reasonable in that it is difficult to build additional roads in a high-density city. The segments of expressways with converted lanes were selected based on popularity and number of lanes. A minimum of three lanes was a criterion so that the remaining two lanes could be used for HVs. Expressway popularity was measured by congestion level; we assumed that road segments experiencing a certain level of congestion are preferred by car travelers. To assess congestion, weighted average congestion frequency/time intensity was calculated using the View-T data provided by the KTDB (https://viewt.ktdb.go.kr/cong/map/second_map.do, accessed on 11 August 2023). The congestion frequency intensity is the ratio of the number of vehicles experiencing congestion to the total number of vehicles. The congestion time intensity is the ratio of the total travel time of vehicles experiencing traffic congestion to the total travel time of all vehicles. The KTDB illustrates that the congestion time intensity tends to be higher than the congestion frequency intensity. Based on the criteria mentioned above, the Gyeongbu expressway and the Olympic expressway were selected for the roadways where an AV lane is installed. The selected segments were 11 km and 43 km, respectively, and can serve partly or fully as a major travel path with a sufficient driving distance for AVs. These two urban expressways have four lanes on most segments and show the congestion intensity of over 70. The roadway capacities of the selected segments of the Gyeongbu and Olympic expressways are 2100 pc/h/lane and 1900 pc/h/lane, respectively. Figure 2 shows the locations of the selected expressways, and the top two rows of Table 1 provide basic information about the roadways.

Table 1.
List of urban expressways in the study area.
3.3. Input Data
The network and O–D data provided the KTDB consisted of 1305 traffic analysis zones (TAZs) and approximately 257,500 links. The data were constructed based on the conditions of the year 2019. Each link in the road network data contains information on length, number of lanes, and capacity [30]. In addition, the link includes an associated volume delay function (VDF) that relates the travel time to the volume-to-capacity ratio [11]. The proposed VDFs in the KTDB are variations in the Bureau of Public Roads equation. After completing the trip assignment procedures, we loaded the weekday O–D trip matrix into the traffic network, which resulted in 28,623,764 assigned vehicle trips. To simulate AV-exclusive lanes, we implemented a network modification of adding one-lane links along the experimented expressways; thus, the number of regular lanes was reduced by one for the segments.
3.4. AV Operating Scenarios
This study assumed that AVs were used only as personal vehicles, ignoring potential new uses such as dynamic ride sharing or autonomous taxis. We also did not consider the mode shifts that may occur with adoption of AVs. The travel demand of AVs (in particular, the trip distribution patterns) was assumed to be equal to the current car travel demand.
AVs’ short following distances due to their faster recognition and reaction times offer the potential advantage of significantly improving the roadway capacity. The capacity changes for AV-exclusive lanes on expressways are based on results from the HCM. The HCM is the most authoritative publication issued by the Transportation Research Board (TRB) in the United States. The capacity gains in the HCM encompass the results of multiple previous studies. Figure 1 illustrates the capacity gain proposed by HCM based on the capacity level of the roadway, demonstrating that the smaller is the capacity of the expressway, the greater is the capacity gain (for the same level of MPRs). Thus, AV lanes on the Olympic expressway (capacity = 1900 pc/h/lane) had a greater gain compared to those on the Gyeongbu expressway (capacity = 2100 pc/h/lane). For the exclusive lane simulation experiment, we assumed that the exclusive AV lane was the inner lane, and that other lanes had mixed traffic (both AVs and HVs).
The following measures of effectiveness were extracted from the traffic simulations to evaluate the effect of exclusive lanes for AVs on urban expressways:
- -
- Change in average number of auto trips,
- -
- Percentage change in VKT,
- -
- Percentage change in total time spent driving (TTS), and
- -
- Change in average network speed.
The range of MPRs used in this study was 10–80%, within the realm of mixed traffic.
4. Results and Discussion
4.1. AV Simulation Results
The O–D trip matrix was loaded onto the road network to estimate traffic flow, average speeds, VMT, and TTS. Figure 3 visualizes traffic volume differences before and after the introduction of AV-exclusive lanes on the expressways (although it cannot clearly demonstrate the changes due to the scale of the network). The thick red lines along the expressways illustrate significant changes in the increase in traffic volume for the links. However, the changes for the regular lanes are hidden by the thick AV lines.
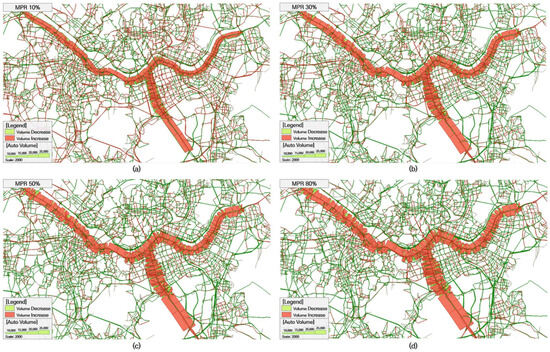
Figure 3.
Traffic volume differences after the introduction of AV lanes for different MPR scenarios. (a) MPR = 10%, (b) MPR = 30%, (c) MPR = 50%, and (d) MPR = 80%.
The simulation results comparing the AV scenarios with the current network performances are summarized in Table 2 and Figure 4. Overall, the introduction of AV-exclusive lanes on the two expressways tended to improve travel speed between 0.22% and 0.43% for the entire network depending on MPR. The VKT for the entire network also increased, suggesting increased capacity with the use of AV-exclusive lanes. Figure 3 illustrates that traffic volumes on the two expressways generally increased, although some links over the expressways experienced lower traffic volumes. The effects of exclusive lanes differed on the Gyeongbu Expressway and the Olympic Expressway.
Table 2.
Summary of VKT, TTS, and network speed changes.
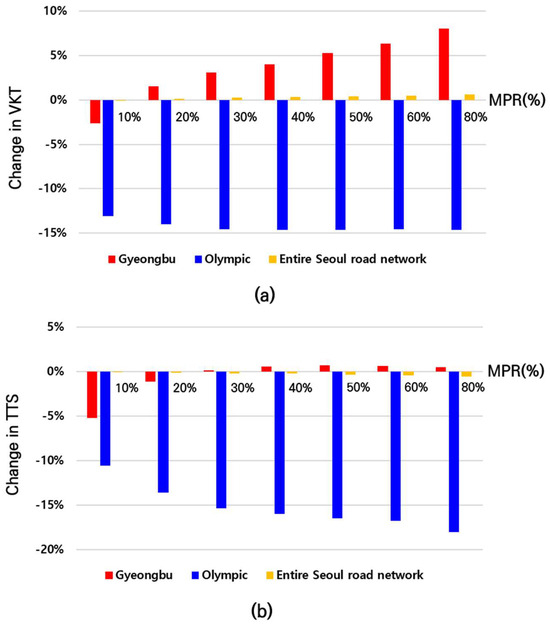
Figure 4.
Percentage changes in VKT and TTS for all auto trips. (a) VKT; (b) TTS.
For the Gyeongbu Expressway, the VKT increased with MPR. Although the VKT decreased approximately −2.60% at 10% MPR, it increased from 1.57% to 8.0% over the MPR range of 20–80%. The TTS also generally increased with MPR, with a maximum change of 0.72% at 50% MPR. The increase in TTS may be due to the increased traffic volume on the expressway, although the pattern of increase is non-linear, with a peak at 50% MPR. Speed change had the opposite pattern, with a minimum percentage change of −0.10% at 40% MPR. This unexpected negative speed change at 40% MPR indicates that the capacity gain may not be sufficient to handle the induced additional traffic volume. The interpretation of AV mixed traffic flow situations is complicated as the capacity gain varies with MPR, and travel routes are altered by capacity changes. The positive maximum speed change occurred at 10% MPR, which seems to be related to the significant reduction in traffic volume at that level (a −4.91% reduction). At the low AV MPR (i.e., 10%), the introduced AV-exclusive lanes may be underutilized compared to their capacity, resulting in increased travel speeds on the lanes. Overall, the introduction of AV-exclusive lanes on the Gyeongbu Expressway increased traffic flow, with improved speed likely due to capacity gains (particularly at higher MPR).
In the case of the Olympic Expressway, traffic volume tended to increase with MPR, similarly to the Gyeongbu Expressway, with a maximum change of 9.11% at 80% MPR. However, at 10% MPR, traffic volume decreased, contrary to the results at other MPR. In contrast to the results for the Gyeongbu Expressway, VKT and TTS decreased compared to the base scenario. Our results showed percentage changes ranging between −13.09% and −14.61%, and between −10.6% and −18.08%, respectively, for VKT and TTS. Meanwhile, as expected, travel speeds increased for all MPR, with a minimum change of 0.88% at 20% MPR and a maximum change of 4.27% at 80% MPR.
The decreased VKT and TTS were unexpected considering the increase in traffic volume on the expressway. This may be partially explained by the increases in traffic volumes primarily on the shorter sections, which are located near major business areas (at the intersection of the two expressways). Meanwhile, traffic volume increases were minimal at longer links on the east and west ends of the Olympic Expressway. These results imply that travel patterns can be altered by the introduction of AV-exclusive lanes. Note that the current capacity of the Olympic Expressway is smaller than that of the Gyeongbu Expressway, and the capacity gain of the Olympic Expressway is greater than that of the Gyeongbu expressway, providing more opportunity for change in travel route on the Olympic Expressway. However, the decrease in VKT implies that the gained capacity is used inefficiently. This indicates that the conversion of regular lanes into AV-exclusive lanes should consider current travel patterns and the expected capacity gains.
Additionally, the specific characteristics of the expressways may be the cause of the different effects of the Gyeongbu and Olympic Expressways. The experimented segment of the Gyeongbu Expressway runs through the main business area, Gangnam; thus, the ramp density is significantly high and the trips on the expressway tend to be rather short. On the other hand, the Olympic Expressway crosses the whole city along the Han River from the city boundary to boundary. Cars on this expressway tend to travel longer and the ramp density is relatively lower, compared to the Gyeongbu Expressway.
The results suggest that the introduction of AV-exclusive lanes may not be always effective to increase the overall capacity of the roadway. More specifically, for the Gyeongbu Expressway, the exclusive lanes were effective at MPR levels of 30% or higher, while those for the Olympic Expressway were effective at 20% or higher. In our results, at 10% MPR, the traffic volumes on both expressways were lower in the scenario with AV-exclusive lanes than in the base scenario (zero AVs). Due to this reduced traffic volume, the VKT decreased as well. Although the speeds of regular and AV lanes are not separately reported in this paper, the low MPR allows AVs to operate at higher speeds in the exclusive lanes, while regular lanes can easily become congested. Due to this, we assume that some HVs were allocated to other routes different from those in the base scenario under the equilibrium assignment procedures, resulting in more congested conditions on the routes.
This study suggests that the introduction of AV-exclusive lanes cannot be guaranteed to be effective at MPR levels below 20 to 30%, given the assumed capacity gains provided by HCM. This study demonstrates that, in terms of road management, installing an exclusive lane under low MPRs may not be optimal. These results are similar to the findings of previous studies [12,22] in which the introduction of AVs exclusive lanes was ineffective at MPRs below 20%, although the applied value of capacity gain was different.
4.2. Sensitivity Analysis
The capacity gain values of HCM assumed in the previous simulation analysis may be less applicable since roadway conditions in Korea may be different from those in HCM. Moreover, the expected capacity gain cannot be easily realized when the AV technology is immature. To address such uncertainty, an additional analysis was conducted by reducing the capacity gain values by half; the case of increased capacity was not tested since the capacity gains suggested in HCM appear to be considerably high already.
The analysis result was summarized in Figure 5 and Figure 6, and Table 3, showing that the trends of the indicators are similar to the case of full capacity (use of originally suggested capacity gain values in HCM). One notable thing is that when the MPR is small, the difference between the results of full capacity and half capacity gain is small; in other words, the larger the MPR, the larger the difference. As expected, for the half capacity case, traffic volumes handled by the expressways and travel speed improvements become smaller, compared to the full capacity case. Interestingly, even when the capacity gain value is reduced by half, the MPRs on Gyeongbu and Olympic expressways must be over 30% and 20%, respectively, to maintain the current service level of traffic operations in terms of traffic volume and travel speed. In other words, below MPR 20 to 30%, AV-exclusive lanes cannot be efficiently operated due to their underutilization incurred by the insufficient demand of AV trips.
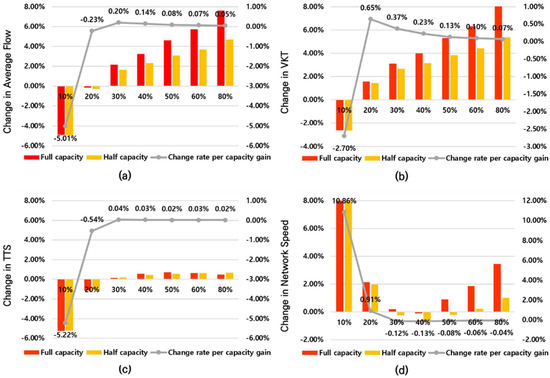
Figure 5.
Comparison of percentage changes between full capacity and half capacity on the Gyeongbu Expressway. (a) Average flow, (b) VKT, (c) TTS, and (d) network speed.

Figure 6.
Comparison of percentage changes between full capacity and half capacity on the Olympic Expressway. (a) Average flow, (b) VKT, (c) TTS, and (d) network speed.
Table 3.
Results of sensitivity analysis.
The sensitivity to capacity gain value with different MPRs was explained using the example of the Gyeongbu Expressway. Looking at the rate of change of half capacity case compared to full capacity case per capacity gain (line graph, Figure 5), in VKT, the rate of change decreases from the point after MPR 20%, and in TTS, the rate of change decreases from the point after MPR 30%. Therefore, the higher MPR is less sensitive to capacity gain.
5. Conclusions
The aim of this study was to evaluate the introduction of AV-exclusive lanes on expressways with mixed traffic (AVs and HVs) in the urban mobility context. We simulated potential AV operating scenarios in Seoul, South Korea, by assuming the conversion of one existing vehicle lane into an AV-exclusive lane. Two representative congested expressways in Seoul were selected for the conversion, and link capacity was adjusted to reflect the capacity gains by AV operations as proposed in HCM.
Our traffic simulation results suggest that the AV operating scenarios lead to an overall improvement in network performance in terms of traffic volume and network speed as MPR increases. However, the results for the two expressways illustrate that the impacts may vary depending on traffic characteristics such as roadway capacity and service areas. For the Gyeongbu Expressway, the VKT increased and the TTS decreased with the introduction of AV lanes, as expected. This is easily understood as the result of the increased traffic volumes induced by the capacity gain. On the other hand, the results for the Olympic Expressway were unexpected in that both VKT and TTS decreased despite traffic volume increases. This situation was explained by the traffic volume increases occurring mostly on shorter links near major business areas, while longer links in less populated areas of the expressway experienced reduced traffic. This interpretation implies that travel routes were significantly altered after the introduction of AV-exclusive lanes. More importantly, some of the capacity gain may not be efficiently utilized depending on travel patterns and roadway characteristics.
Our simulation results indicate that, under the circumstance of low MPR, the simulated AV-exclusive lanes cannot be fully utilized and reducing the number of regular lanes by one can induce traffic congestion. Indeed, the two tested expressways demonstrated inefficiency at 10% MPR. The study results suggest that an MPR in the range of 20–30% is the minimum needed to introduce an AV-exclusive lane from the perspective of efficient operation of the target expressways. Therefore, as stated earlier, before introducing AV-exclusive lanes on expressways under mixed traffic conditions, it is necessary to consider the characteristics of the target roads and travel patterns according to MPR. This situation was confirmed even when the assumed capacity gain was reduced by half.
Despite our meaningful findings, this work has some limitations. First, we made simplified assumptions concerning travel patterns. We assumed that current private car trips would convert into AV trips without any changes in travel patterns and demand. As mentioned in the literature review, AVs do not require users to possess a driver’s license, allowing children and the disabled to travel by car. This may induce additional demand for private transport and a shift from public transport to AVs [18]. In addition, travel patterns may change since AVs may be preferred for longer trips due to the lowered burden of driving [28]. If such changes can be reflected in future simulation models, the outputs may be more reliable and interpretable. Second, this study did not fully reflect AV operational conditions, particularly mixed traffic conditions. Although we used an authoritative source, HCM, the suggested capacity gains may not be completely applicable to the context of this study. It is well-known that road capacity varies considerably depending on road environment and driver population. Moreover, this may be related to the effectiveness of the current traffic simulation model based on HV operating characteristics. Future work should attempt to address these issues to produce more realistic results. Third, this study was a network-based macroscopic analysis and did not reflect the microscopic characteristics, such as obeying traffic laws of individual vehicles, sensor modeling and different types of weather.
AVs are likely to be built as battery electric vehicles rather than internal combustion engine vehicles for the better AVs’ system design and optimization [18,33]. It is well-known that BEVs are more energy-efficient and release less CO2 [33,34,35]. Future studies are recommended to measure the environmental impact of the introduction of AVs and AV-exclusive lanes.
Author Contributions
Conceptualization, J.P. and J.K.; methodology, J.P. and S.J.; writing—original draft, J.P. and S.J.; writing—review and editing, J.K.; supervision, J.K. All authors have read and agreed to the published version of the manuscript.
Funding
This work was supported by Korea Institute of Police Technology (KIPoT) grant funded by the Korea government (KNPA) (No. 092021C28S01000, Development of integrated road traffic control system and operation technology when autonomous driving is mixed with normal vehicles).
Institutional Review Board Statement
Not applicable.
Informed Consent Statement
Not applicable.
Data Availability Statement
Data will be made available on request.
Conflicts of Interest
The authors declare that they have no known competing financial interests or personal relationships that could have appeared to influence the work reported in this paper.
References
- McKinsey Report. The Future of Mobility 2020. 2020. Available online: https://www.mckinsey.com/industries/automotive-and-assembly/our-insights/the-future-of-mobility-is-at-our-doorstep (accessed on 4 August 2023).
- Bansal, P.; Kockelman, K.M.; Singh, A. Assessing public opinions of and interest in new vehicle technologies: An Austin perspective. Transp. Res. Part C Emerg. Technol. 2016, 67, 1–14. [Google Scholar] [CrossRef]
- Jun, W.K.; An, M.H.; Choi, J.Y. Impact of the connected & autonomous vehicle industry on the Korean national economy using input-output analysis. Technol. Forecast. Soc. Change 2022, 178, 121572. [Google Scholar]
- Maeng, K.; Jeon, S.; Park, T.; Cho, Y. Network effects of connected and autonomous vehicles in South Korea: A consumer preference approach. Res. Transp. Econ. 2021, 90, 100998. [Google Scholar] [CrossRef]
- Rahman, M.S.; Abdel-Aty, M. Longitudinal safety evaluation of connected vehicles’ platooning on expressways. Accid. Anal. Prev. 2018, 117, 381–391. [Google Scholar] [CrossRef] [PubMed]
- Jung, A.; Young, J.; Cheol, O. A methodology of identifying hazardous freeway segment based on multi-agent driving simulations for the mixed situation of autonomous and manual vehicles. J. Korean Soc. Transp. 2023, 41, 495–508. [Google Scholar] [CrossRef]
- Bansal, P.; Kockelman, K.M. Forecasting Americans’ long-term adoption of connected and autonomous vehicle technologies. Transp. Res. Part A Policy Pract. 2017, 95, 49–63. [Google Scholar] [CrossRef]
- Zhang, Y.T.; Hu, M.B.; Chen, Y.Z.; Shi, C.L. Cooperative platoon forming strategy for connected autonomous vehicles in mixed traffic flow. Phys. A 2023, 623, 128828. [Google Scholar] [CrossRef]
- Wang, Y.; Jiang, Y.; Wu, Y.; Yao, Z. Mitigating traffic oscillation through control of connected automated vehicles: A cellular automata simulation. Expert Syst. Appl. 2024, 235, 121275. [Google Scholar] [CrossRef]
- Wang, Z.; Huang, H.; Tang, J.; Hu, L. A deep reinforcement learning-based approach for autonomous lane-changing velocity control in mixed flow of vehicle group level. Expert Syst. Appl. 2024, 238, 122158. [Google Scholar] [CrossRef]
- Kloostra, B.; Roorda, M.J. Fully autonomous vehicles: Analyzing transportation network performance and operating scenarios in the Greater Toronto Area, Canada. Transp. Plan. Technol. 2019, 42, 99–112. [Google Scholar] [CrossRef]
- Ma, K.; Wang, H. Influence of exclusive lanes for connected and autonomous vehicles on freeway traffic flow. IEEE Access 2019, 7, 50168–50178. [Google Scholar] [CrossRef]
- Ye, L.; Yamamoto, T. Modeling connected and autonomous vehicles in heterogeneous traffic flow. Phys. A 2018, 490, 269–277. [Google Scholar] [CrossRef]
- Fernandes, P.; Nunes, U. Platooning of autonomous vehicles with intervehicle communications in SUMO traffic simulator. In Proceedings of the 13th International IEEE Conference on Intelligent Transportation Systems, Funchal, Portugal, 19–22 September 2010. [Google Scholar]
- Tientrakool, P.; Ho, Y.; Maxemchuk, N.F. Highway Capacity Benefits from Using Vehicle-to-Vehicle Communication and Sensors for Collision Avoidance. In Proceedings of the 73rd IEEE Vehicular Technology Conference, San Francisco, CA, USA, 5–8 September 2011. [Google Scholar]
- Wagner, P. Traffic control and traffic management in a transportation system with autonomous vehicles. In Autonomous Driving: Technical, Legal and Social Aspects; Springer: Berlin/Heidelberg, Germany, 2016; pp. 301–316. [Google Scholar]
- Friedrich, B. The effect of autonomous vehicles on traffic. In Autonomous Driving: Technical, Legal and Social Aspects; Springer: Berlin/Heidelberg, Germany, 2016; pp. 317–334. [Google Scholar]
- Patella, S.M.; Scrucca, F.; Asdrubali, F.; Carrese, S. Carbon Footprint of autonomous vehicles at the urban mobility system level: A traffic simulation-based approach. Transp. Res. Part D Transp. Environ. 2019, 74, 189–200. [Google Scholar] [CrossRef]
- Sakamoto, K.; Abhayantha, C.; Kubota, H. Effectiveness of bus priority lane as countermeasure for congestion. Transp. Res. Rec. 2007, 2034, 103–111. [Google Scholar] [CrossRef]
- Zhu, H.B. Numerical study of urban traffic flow with dedicated bus lane and intermittent bus lane. Phys. A 2010, 389, 3134–3139. [Google Scholar] [CrossRef]
- Hua, X.; Yu, W.; Wang, W.; Xie, W. Influence of lane policies on freeway traffic mixed with manual and connected and autonomous vehicles. JAT 2020, 2020, 3968625. [Google Scholar] [CrossRef]
- Santana, E.F.Z.; Covas, G.; Duarte, F.; Santi, P.; Ratti, C.; Kon, F. Transitioning to a driverless city: Evaluating a hybrid system for autonomous and non-autonomous vehicles. Simul. Model. Pract. Theory 2021, 107, 102210. [Google Scholar] [CrossRef]
- Baek, S.; Yun, D.; Park, J. A Study on the Scenario Development for the Analysis of Mixed Traffic Flow Characteristics Following the Introduction of Freeway Exclusive Lanes for Autonomous Vehicles. J. Korean Soc. Transp. 2021, 39, 838–848. [Google Scholar]
- Zhang, J.; Wu, K.; Cheng, M.; Yang, M.; Cheng, Y.; Li, S. Safety evaluation for connected and autonomous vehicles’ exclusive lanes considering penetrate ratios and impact of trucks using surrogate safety measures. J. Adv. Transp. JAT 2020, 2020, 5847814. [Google Scholar] [CrossRef]
- Ortega, J.; Lengyel, H.; Ortega, J. Design and Analysis of the Trajectory of an Overtaking Maneuver Performed by Autonomous Vehicles Operating with Advanced Driver-Assistance Systems (ADAS) and Driving on a Highway. Electronics 2022, 12, 51. [Google Scholar] [CrossRef]
- Lutin, J.M.; Kornhauser, A.L.; Masce, E.L.L. The revolutionary development of self-driving vehicles and implications for the transportation engineering profession. ITE J. 2013, 83, 28–32. [Google Scholar]
- Cairns, S.; Harmer, C.; Hopkin, J.; Skippon, S. Sociological perspectives on travel and mobilities: A review. Transp. Res. Part A Policy Pract. 2014, 63, 107–117. [Google Scholar] [CrossRef]
- Choi, S.; Kim, D.; Ko, J.; Park, J.; Ko, Y. Value of travel time savings of autonomous vehicle commuters: A segmented valuation for local and inter-city travel. Int. J. Urban Sci. IJUS 2023, 27, 645–669. [Google Scholar] [CrossRef]
- Gucwa, M. Mobility and energy impacts of automated cars. In Proceedings of the Automated Vehicles Symposium, San Francisco, CA, USA, 15–17 July 2014. [Google Scholar]
- Kim, C.; Rim, H.; Oh, D.; Kang, D. Estimating the Benefits of Korea’s Intercity Rail Speed Increase Project: An Agent-Based Model Approach. Modelling 2022, 3, 94–104. [Google Scholar] [CrossRef]
- Florian, M.; Hearn, D. Chapter 6: Network equilibrium models and algorithms. In Handbooks in Operations Research and Management Science; Ball, M.O., Magnanti, T.L., Monma, C.L., Nemhauser, G.L., Eds.; North-Holland: Amsterdam, The Netherlands, 1995; Volume 8, pp. 485–550. [Google Scholar]
- Ha, J.; Ki, D.; Lee, S.; Ko, J. Mode choice and the first-/last-mile burden: The moderating effect of street-level walkability. Transp. Res. Part D Transp. Environ. 2023, 116, 103646. [Google Scholar] [CrossRef]
- Lee, U.; Jeon, S.; Lee, I. Design for shared autonomous vehicle (SAV) system employing electrified vehicles: Comparison of battery electric vehicles (BEVs) and fuel cell electric vehicles (FCEVs). Clean. Eng. Technol. 2022, 8, 100505. [Google Scholar] [CrossRef]
- Kirgizov, A.K.; Dmitriev, S.A.; Safaraliev, M.K.; Pavlyuchenko, D.A.; Ghulomzoda, A.H.; Ahyoev, J.S. Expert system application for reactive power compensation in isolated electric power systems. Int. J. Electr. Comput. Eng. IJECE 2021, 11, 3682–3691. [Google Scholar] [CrossRef]
- Martyushev, N.V.; Malozyomov, B.V.; Khalikov, I.H.; Kukartsev, V.A.; Kukartsev, V.V.; Tynchenko, V.S.; Tynchenko, Y.A.; Qi, M. Review of Methods for Improving the Energy Efficiency of Electrified Ground Transport by Optimizing Battery Consumption. Energies 2023, 16, 729. [Google Scholar] [CrossRef]
Disclaimer/Publisher’s Note: The statements, opinions and data contained in all publications are solely those of the individual author(s) and contributor(s) and not of MDPI and/or the editor(s). MDPI and/or the editor(s) disclaim responsibility for any injury to people or property resulting from any ideas, methods, instructions or products referred to in the content. |
© 2023 by the authors. Licensee MDPI, Basel, Switzerland. This article is an open access article distributed under the terms and conditions of the Creative Commons Attribution (CC BY) license (https://creativecommons.org/licenses/by/4.0/).