Article

Robust Optimization of Large-Scale Wind–Solar Storage Renewable Energy Systems Considering Hybrid Storage Multi-Energy Synergy

1
Northwest Engineering Corporation Limited, PowerChina, Xi’an 710065, China
2
School of Automation Science and Engineering, Xi’an Jiaotong University, Xi’an 710049, China
*
Author to whom correspondence should be addressed.
Sustainability 2024, 16(1), 243; https://doi.org/10.3390/su16010243
Submission received: 28 November 2023 / Revised: 22 December 2023 / Accepted: 25 December 2023 / Published: 27 December 2023

Abstract

:
With the rapid integration of renewable energy sources, such as wind and solar, multiple types of energy storage technologies have been widely used to improve renewable energy generation and promote the development of sustainable energy systems. Energy storage can provide fast response and regulation capabilities, but multiple types of energy storage involve different energy conversion relationships. How to fully utilize the advantages of multiple energy storage and coordinate the multi-energy complementarity of multiple energy storage is the key to maintaining a stable operation of the power system. To this end, this paper proposes a robust optimization method for large-scale wind–solar storage systems considering hybrid storage multi-energy synergy. Firstly, the robust operation model of large-scale wind–solar storage systems considering hybrid energy storage is built. Secondly, the column constraint generation (CCG) algorithm is adopted to transform the original problem into a two-stage master problem and sub-problem for solving to obtain the optimal strategy of system operation with robustness. Finally, the validity of the proposed method is verified through case tests. The results show that the proposed method can effectively coordinate the multi-energy complementary and coordinated operation of multiple hybrid energy storage, and the obtained operation strategy of large-scale wind–solar storage systems can well balance the economy and robustness of the system.

1. Introduction

1.1. Motivation

To achieve the goal of carbon peak and carbon neutrality, China will promote power systems to adapt to the large scale and high proportion of renewable energy [1], and the large-scale wind–solar storage renewable energy systems will maintain the rapid development trend to promote the development of sustainable energy systems [2]. However, wind and solar power are generally characterized by randomness and volatility [3,4], and how to ensure a stable operation of large-scale renewable energy systems and improve the efficiency of renewable energy consumption is the key to achieving the goal of “double carbon” [5].
With the development of energy storage technologies, various energy storage devices are widely used in large-scale wind–solar storage systems, such as pumped hydro energy storage (PHES), electrochemical energy storage (EES), hydrogen energy storage (HES), and thermal energy storage (TES). Different energy storage devices are characterized by differences in technologies, economic indicators, and functions [6]. Fully meeting the system requirements through a single energy storage technology is very challenging and can lead to load shifting unless one has an extraordinarily large storage capacity [7]. Hybrid energy storage technologies with multiple energy storage types can utilize the complementary characteristics among multiple energy storage devices to make the system more reliable and sustainable [8]. Therefore, it is important to study the multi-energy synergy of hybrid storage in the optimal operation of large-scale wind–solar storage renewable energy systems under uncertainty.

1.2. Literature Review

In hybrid energy storage, the PHES is currently the most commonly used large-scale energy storage technology, with large capacity, high efficiency, and unlimited storage cycles, but it is limited by geographical location [9,10]. The solar thermal power plant (STPP) with TES is considered an important support technology for high penetration of renewable energy to the grid, which can consume excess renewable energy and convert it into thermal energy, and it can be quickly adjusted for backup, but it has a low heat-to-electricity conversion efficiency [11,12]. Hydrogen, as an ideal secondary energy source, is an excellent energy storage carrier, and the combined electrical and thermal utilization of hydrogen energy has high energy utilization efficiency, but it is less efficient in the hydrogen production process [13,14]. The EES has the advantage of fast response time, utilization flexibility, and it can provide emergency backup, but it has high investment cost and short life cycle [15]. The above energy storage technologies can be integrated together to form hybrid energy storage, giving full play to the advantages of different types of energy storage and utilizing the complementary characteristics of multiple energy sources to maximize the operation requirements of the system.
The operation optimization of energy systems with hybrid energy storage has been widely studied. Zheng et al. [16] incorporated STPP and HES into an integrated energy system to achieve the multi-energy joint storage and supply, and they improved the efficiency of renewable energy consumption through the hierarchical utilization of hybrid energy storage. Javed et al. [7] developed a coordinated operation strategy of EES and PHES in a standalone wind-scenic interconnection system and proposed the novel rule-based operation strategy based on the minimum part-load operating conditions of the pump/turbine. Awan et al. [17] analyzed the techno-economic performance of hybrid energy storage systems with HES, EES, and PHES and optimized different system configuration schemes. Ma et al. [18] proposed an economic model and sizing calculation method for hybrid energy storage systems with EES and PHES. Zhang et al. [19] utilized the simulated annealing algorithm to optimize the renewable energy hybrid system with EES and HES. Wang et al. [20] proposed the solar-assisted hydrogen fuel and power production system to improve energy efficiency through the synergistic operation of HES, PHES, and STPP. Jiao et al. [21] proposed the corresponding life cycle assessment method to optimize the operation of hybrid energy storage systems with EES, HES, and PHES. Moreover, optimization studies of energy systems with hybrid energy storage need to consider the impact of uncertainty on system operation. Shen et al. [22] developed the multi-timescale rolling optimization of the hybrid energy storage system considering multiple uncertainties, and they incorporated the scheduling model into the model predictive control framework to efficiently deal with price, renewable energy, and load uncertainties. Qiu et al. [23] proposed a coordinated dispatch model based on two-stage distribution robust optimization for the hybrid electric–hydrogen energy storage energy system, and they utilized the column constraint generation (CCG) algorithm to achieve an efficient solution. Rasool et al. [24] proposed the comparative multi-objective framework and utilized the genetic algorithm to analyze the grid-interacting hybrid renewable energy system with EES and PHES.
The comparison of the above literature review is shown in Table 1. Although the above studies have examined the joint operation of renewable energy and energy storage, as well as the optimal scheduling of power systems with uncertainty, they have mainly focused on improvement of the operational efficiency of two or three common types of hybrid energy storage systems, with a focus on how to make full use of the charging and discharging operation of different storage energies, as well as the optimal configuration of different storage systems. However, with the further increase in hybrid energy storage types, this will bring more challenges to the stable and economic operation of the system. First, the further increase in hybrid energy storage types makes the system face more complex multi-energy coupling characteristics of electricity–heat–gas–renewable energy sources, and more accurate models are needed to reflect the operation and coupling mechanisms of all components. Secondly, due to the time-shifting characteristics of energy storage, the further increase in hybrid energy storage types will make the time-coupling characteristics of the system more complex, and reasonable coordination and optimization strategies need to be developed to make full use of the multi-energy complementary characteristics of multi-type hybrid energy storage. Finally, the effects of source and load uncertainties need to be considered to ensure real-time supply and demand matching of the system.

1.3. Contributions

In order to solve the above challenges, this paper proposes the robust optimization method for large-scale wind–solar storage systems considering hybrid storage multi-energy synergy. The method considers the comprehensive hybrid energy storage system including PHES, STPP, HES, and EES, taking into account the high source and load uncertainties. This paper aims to improve the economy and robustness of the large-scale wind–solar storage systems’ operation considering hybrid storage and multi-energy synergy in order to achieve technologically optimized energy system operation solutions and sustainable energy system development. The main contributions are as follows:
(1)
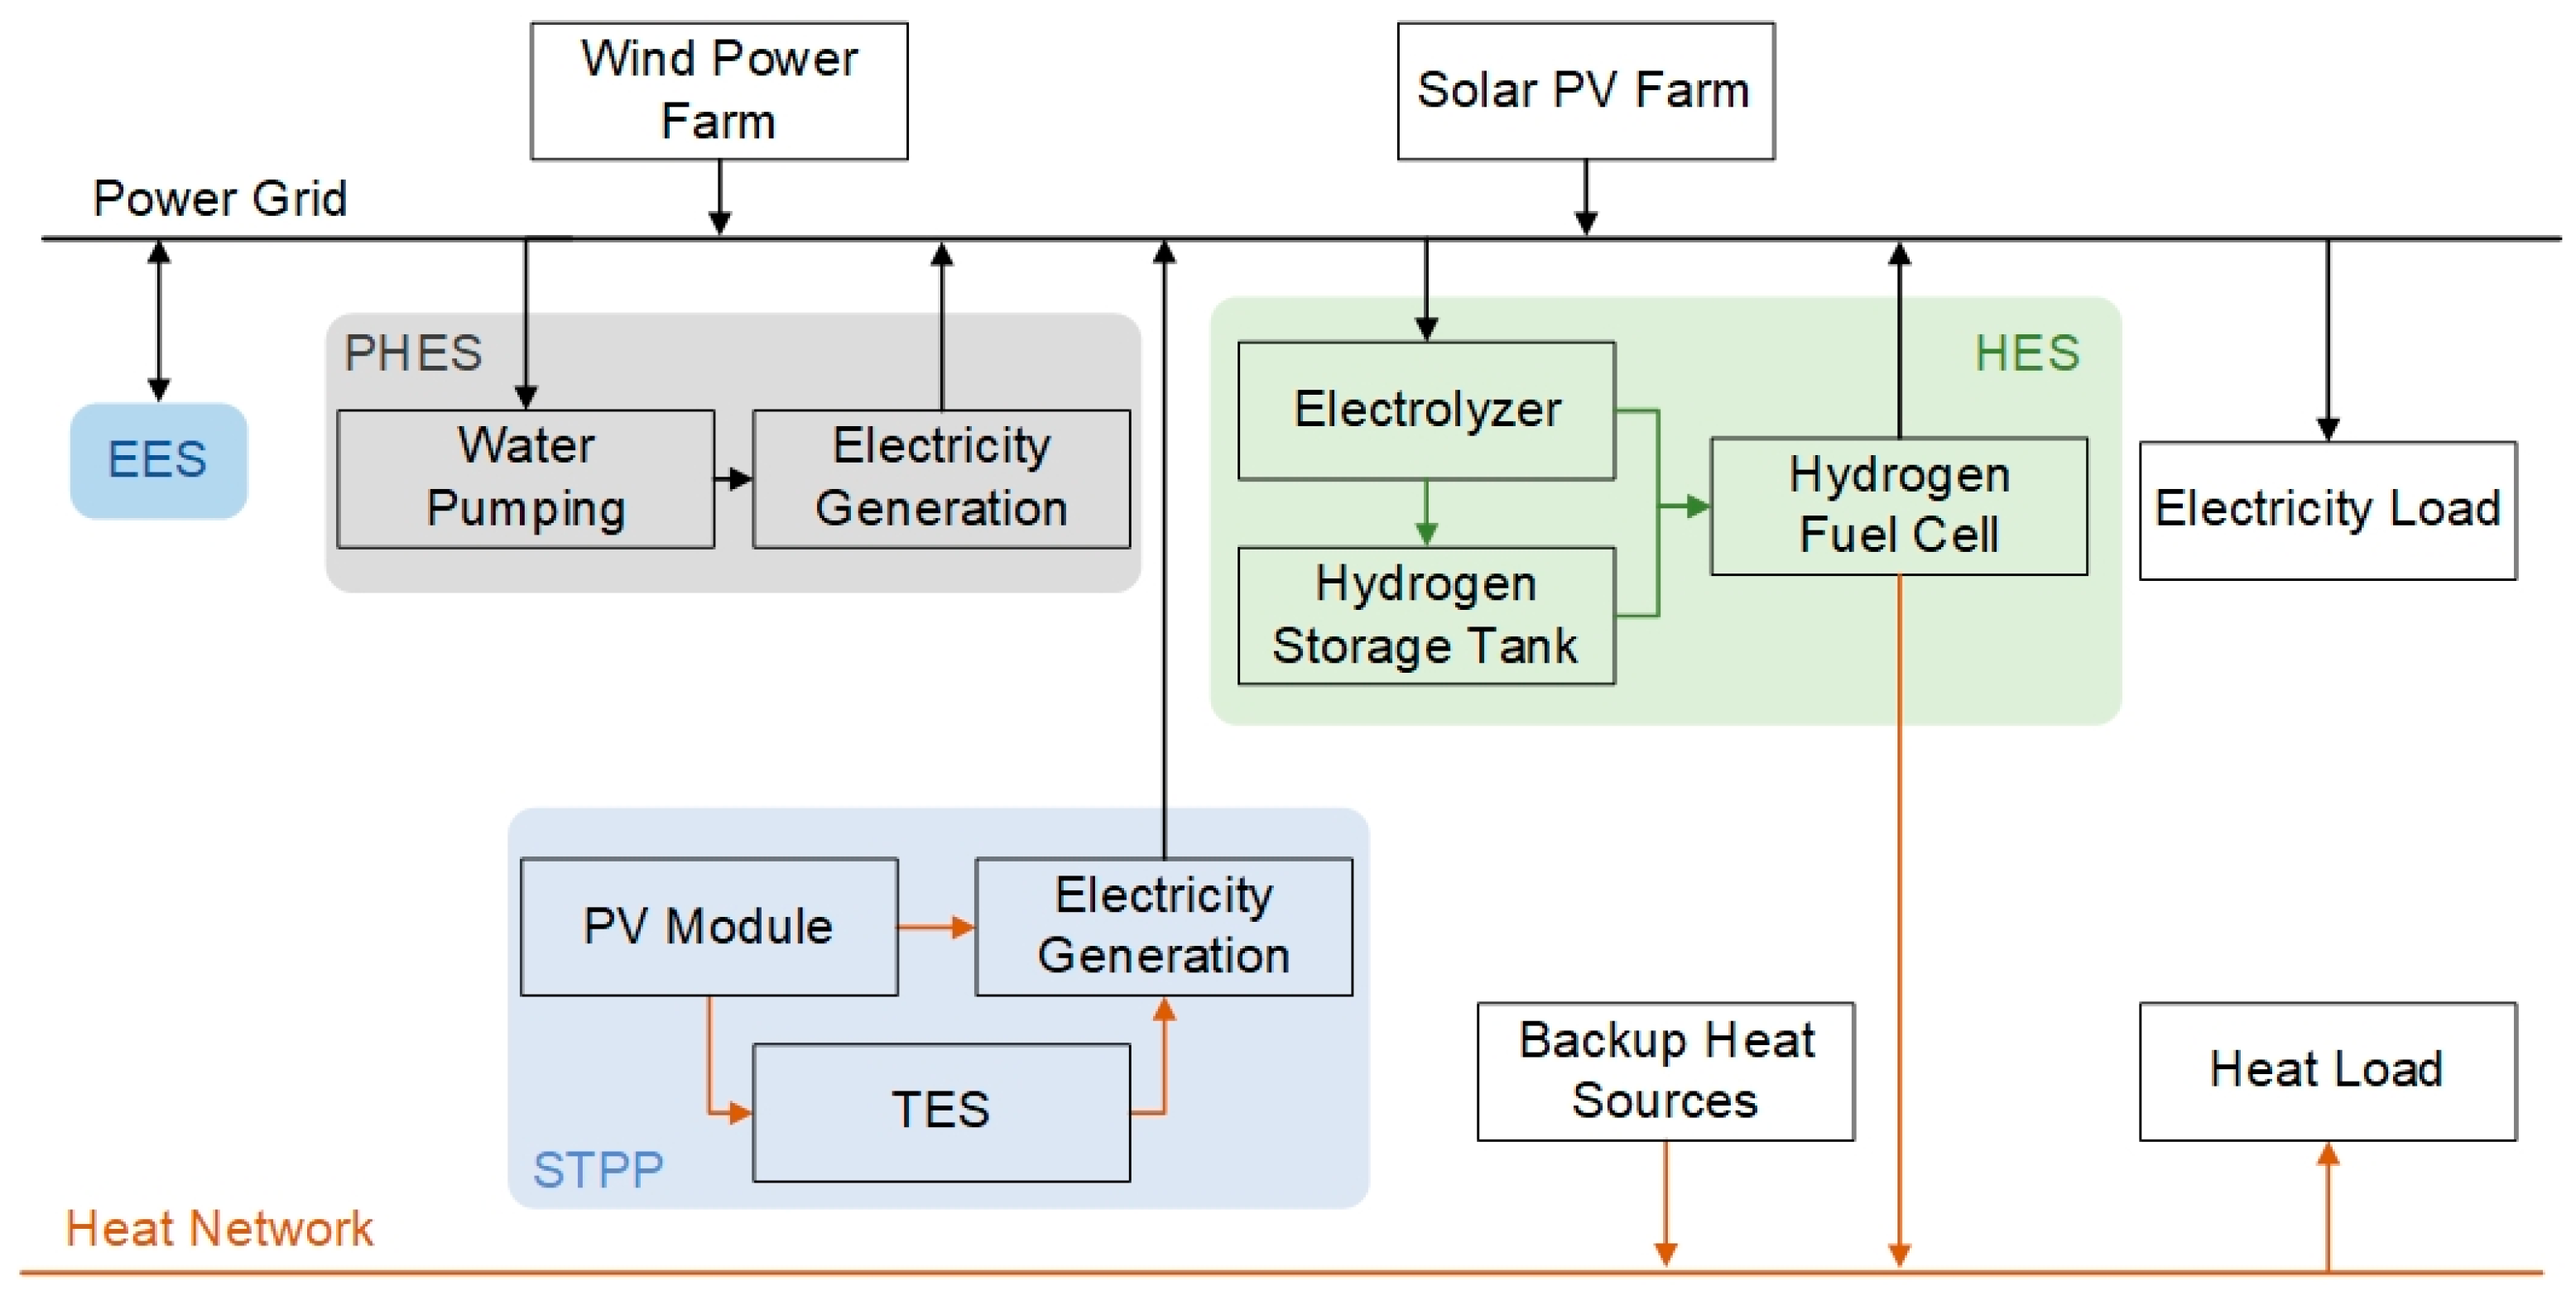
The robust optimization model for hybrid energy storage renewable energy systems integrated with PHES, STPP, HES, and EES is built. The model can accurately describe the production, storage, conversion, and consumption processes of various energy sources, such as electricity, heat, gas, and renewable energy, in the system while effectively reducing the impact of source and load uncertainties on system operation.
(2)
The two-stage robust optimization method considering hybrid energy storage and multi-energy synergy is proposed. The method can coordinate and utilize the time-shifting characteristics of multiple energy storage and the multi-energy complementary characteristics of the system and achieve real-time supply and demand matching of the system under uncertainty through multi-energy synergy.
(3)
The original problem is transformed into the two-stage main problem and sub-problem for iterative solution based on the CCG algorithm, and the optimal system operation strategy with economy and robustness is finally obtained. The results show that the optimal scheduling strategy can improve the flexibility and renewable energy consumption efficiency of the system.
The rest of this paper is organized as follows. The structure of the system is described in Section 2. The robust optimization model of the problem is built in Section 3. Section 4 presents the solution methodology. The case test results are shown in Section 5. Finally, conclusions are given in Section 6.

2. System Description

The large-scale wind–solar storage renewable energy system with multiple types of energy storage consists of wind power farms, solar PV farms, hybrid energy storage system including EES, PHES, HES, and STPP, and backup energy sources (the power grid for electricity and the gas boiler/heat pump for heat). The structure of the system is shown in Figure 1.
In the system, the electrical energy is mainly provided by wind power farms, solar PV farms, PHES, and EES. The thermal energy is mainly provided by the heat generated by the TES of the STPP and the hydrogen fuel cells in the HES, with the shortfall being supplemented by backup heat sources. After the thermal load of the system is satisfied, the excess energy of the STPP and the hydrogen fuel cell is supplied to the electric load. The PHES pumps water during the peak period of renewable energy generation and generates electricity during the trough period, realizing the potential–electric energy conversion. The EES mainly satisfies the short term and a small number of loads supplying insufficiency, realizing the chemical–electrical energy conversion. In the STPP, the thermal energy collected by the PV module and the thermal energy supplied by the TES together realize the thermal–electrical energy conversion in STPP. In the HES, hydrogen–electric (thermal) energy conversion is realized by electrolyzers and hydrogen fuel cells. Wind power farms and PV farms are the main output electric power components. Through the multi-energy complementary and joint optimization of multi-type energy storage systems including EES, PHES, HES, and TES in STPP, the renewable energy output fluctuation can be balanced together to promote renewable energy consumption efficiency and reduce the operation cost of the system.

3. Model Formulation

The robust optimization model of large-scale wind–solar storage renewable energy systems considering multiple types of energy storage and multi-energy complementation is developed in this sub-section while considering the uncertainties of renewable energy outputs, electric and thermal loads in the system, as well as the actual operation constraints of each device. The scheduling period of the model is 24 h, and a step size of Δ t = 1 is employed. The nomenclature is shown in Table 2.

3.1. System Operating Costs

The system operating costs include operation and maintenance (O&M) costs for the wind power farm, the solar PV farm, PHES, STPP, EES, the electrolyzer, hydrogen fuel cells, and backup heat sources, as expressed below:
F o p = t = 1 T [ c w P w , t + c p v P p v , t + c c s p ( P c s p , t + H t e s , h l , t ) + c h f c ( P h f c , e , t + H h f c , h , t ) + c e c P e c , t + c p g ( P p u m p , t + P g e n , t ) + c s ( P s , c h , t + P s , d i s , t ) + c g H g , t ]
where T is the system scheduling horizon. c w , c p v , c c s p , c h f c , c e c , c p g , c s , and c g are the unit O&M costs of wind power, PV, STPP, hydrogen fuel cell, electrolyzer, PHES, EES, and backup heat sources, respectively. P w , t and P p v , t are the output power of wind power and PV, respectively, at time t in kW. P c s p , t and H t e s , h l , t are the generating power of STPP and the thermal power supplied to the heat loads directly at time t in kW. P h f c , e , t and H h f c , h , t are the electrical and thermal output power of the hydrogen fuel cell at time t in kW, respectively. P e c , t is the input power of the electrolyzer at time t in kW. P p u m p , t and P g e n , t are the pumping and generating power of the PHES at time t in kW, respectively. P s , c h , t and P s , d i s , t are the charging and discharging power of the EES at time t in kW, respectively. H g , t is the output power of the backup heat sources at time t in kW.

3.2. Energy Balance Constraints

The electrical power balance constraint of the system is expressed as follows:
P w , t + P p v , t + P c s p , t + P h f c , e , t P e c , t + P g e n , t P p u m p , t + P s , d i s , t P s , c h a , t = P L , e , t
where P L , e , t is the electrical load demand of the system at time t.
The heat balance constraint of the system is expressed as follows:
H t e s , h l , t + H h f c , h , t + H g , t = H L , h , t
where H L , h , t is the heat load demand of the system at time t.

3.3. Renewable Power Generation Constraints

The output power constraints for wind and PV power generation are as follows:
0 P w , t P ¯ w , t 0 P p v , t P ¯ p v , t
where P ¯ w , t and P ¯ p v , t are the predicted output power of wind and PV power generation at time t, respectively.

3.4. Hybrid Energy Storage Constraints

3.4.1. Operation Constraints on the PHES

The PHES has mature technology and fast response speed. Its working principle is to utilize renewable energy generation dispatch pumps to pump water to the upper reservoir during the low electricity load period and release water to the lower reservoir during the peak electricity load period to drive the generating units to generate electricity. The dynamic change process of the capacity of the PHES is expressed as follows:
V u r , t = V u r , t 1 + μ p g , t η p u m p P p u m p , t ρ g h Δ t + ( 1 μ p g , t ) P g e n , t η g e n ρ g h Δ t
where V u r , t is the upper reservoir capacity at time t in m3. μ p g , t is the pumping/generation state variable, where the value of 1 indicates pumping, and the value of 0 indicates power generation. η p u m p and η g e n are the pumping and power generation efficiencies of the PHES, respectively. ρ is the density of the water. g is the acceleration of gravity. h is the head of the water.
The capacity of the PHES reservoir is subject to the following constraints:
V ¯ u r V u r , t V ¯ u r
where V ¯ u r and V ¯ u r are the minimum and maximum capacity of the reservoir, respectively.
The beginning and ending capacity state of the PHES reservoir capacity during a dispatch cycle shall be within a certain range of deviations, constrained as follows:
( 1 σ ) V u r , 0 V u r , T V u r , 0 ( 1 + σ ) V u r , 0
where σ is the allowable deviation from the initial and final state of the PHES reservoir capacity.
The water pumps and generators need to meet the following output constraints:
P ¯ p u m p P p u m p , t P ¯ p u m p P ¯ g e n P g e n , t P ¯ g e n
where P ¯ p u m p and P ¯ g e n are the rated power of the pump and generator, respectively. P ¯ p u m p and P ¯ g e n are the lower limit of the output of the pump and generator, respectively.

3.4.2. Operation Constraints on the STPP

The STPP consists of three sub-systems—the PV module, the TES, and the electricity generation unit—and the energy transfer is carried out through the heat-conducting medium. The PV module converges solar energy into the collector and heats the heat-conducting medium in the collector, and the heated medium can enter the TES for direct heat exchange or enter the electricity generation unit to heat liquid water to drive the steam turbine to generate electricity.
The STPP converts the solar energy into thermal energy through the PV module, and the amount of obtained thermal energy is expressed as follows:
H s t f , t = η s h S m D t
where H s t f , t is the obtained thermal energy of the PV module at time t in kWh. η s h is the photothermal conversion efficiency. S m is the area of the mirror farm. D t is the direct radiance factor of the solar energy at time t.
When the system heat load is high, the heat converted by the collector is used directly to meet the heat load; when the load is low, the heat is stored in the TES and discharged to generate electricity during the peak load period. The charging and discharging constraints of the TES are expressed as follows:
H t e s , t = ( 1 θ ) H t e s , t 1 + η t e s , c h a H c h a , t H d i s , t / η t e s , d i s
where H t e s , t is the heat stored in the TES at time t in kWh. θ is the self-loss coefficient of the TES. η t e s , c h a and η t e s , d i s are the charging and discharging heat efficiencies of the TES, respectively. H c h a , t and H d i s , t are the charging and discharging heat of the TES, respectively, at time t in kWh.
The TES supply heat load needs to satisfy the heat balance constraints:
H s t f , t = H c s p , e , t + H c h a , t + H l o s s , t H d i s , t = H t e s , e , t + H t e s , h l , t
where H c s p , e , t is the amount of heat supplied by the collector to the electricity generation unit at time t in kWh. H l o s s , t is the amount of heat discarded at time t in kWh. H t e s , e , t is the amount of heat supplied by the TES to the electricity generation unit at time t in kWh.
The power generation of the STPP comes partly from the PV module collector and partly from the TES, which is expressed as follows:
P c s p , t = η h e ( H c s p , e , t + H t e s , e , t )
where η h e is the thermoelectric conversion efficiency.
The output energy of the STPP needs to satisfy the following constraints:
0 P c s p , t P ¯ c s p 0 H t e s , h l , t H ¯ t e s , h l
where P ¯ c s p is the output upper limit of the electricity generation unit. H ¯ t e s , h l is the output upper limit of the TES supplied directly to the heat load.

3.4.3. Operation Constraints on the HES

The HES system consists of three parts: a hydrogen storage tank, an electrolyzer, and a hydrogen fuel cell. Hydrogen produced by the electrolyzer is converted into heat and electricity by the hydrogen fuel cell to meet the load demand, and the remaining hydrogen enters the hydrogen storage tank for storage.
The electrolyzer converts surplus electricity from renewable power generation into hydrogen, subject to the following constraints:
E e c , t = η e c P e c , t
where E e c , t is the hydrogen power obtained from the electrolyzer at time t in kW. η e c is the electric–hydrogen conversion efficiency.
The hydrogen fuel cells consume hydrogen energy to produce electrical and thermal energy, realizing the coupling of electrical energy, hydrogen energy, and thermal energy, with the following constraints:
P h f c , e , t = η h f c , e P h 2 , d i s , t H h f c , h , t = η h f c , h P h 2 , d i s , t
where η h f c , e and η h f c , h are the electrical/thermal conversion efficiency of hydrogen fuel cells.
The hydrogen storage tank stores hydrogen energy and discharges for hydrogen fuel cells to generate electricity when hydrogen is needed in the system, and the dynamic process of storing energy is expressed as follows:
E h 2 , t = E h 2 , t 1 + μ h 2 , t P h 2 , c h a , t η h 2 , c h a ( 1 μ h 2 , t ) P h 2 , d i s , t / η h 2 , d i s
where E h 2 , t is the power of hydrogen stored in the hydrogen storage tank at time t. μ h 2 , t is the state variable of hydrogen charge and discharge, which takes the value of 1 to indicate hydrogen charge and 0 to indicate hydrogen discharge. P h 2 , c h a , t is the power of hydrogen charge at time t. η h 2 , c h a and η h 2 , d i s are the efficiency of hydrogen charge and discharge, respectively.
The output power of the hydrogen fuel cell and electrolyzer needs to satisfy the following constraints:
0 P h f c , e , t P ¯ h f c , e 0 P e c , t P ¯ e c 0 H h f c , h , t H ¯ h f c , h
where P ¯ h f c , e is the upper limit of the power generation output of the hydrogen fuel cell. P ¯ e c is the upper limit of the input power of the electrolyzer. H ¯ h f c , h is the upper limit of the thermal energy output of the hydrogen fuel cell.

3.4.4. Operation Constraints on the EES

The dynamic process of storing energy of the EES is expressed as follows:
E s , t = E s , t 1 + ( P s , c h a , t η s , c h a P s , d i s , t / η s , d i s ) Δ t
where E s , t is the electricity stored in the EES at time t in kWh. P s , c h a , t and P s , d i s , t denote the charging and discharging power of EES at time t in kW, respectively. η s , c h a and η s , d i s denote the charging and discharging efficiencies of EES, respectively.
The capacity state of the EES is subject to the following constraints:
( 1 D O D ) E ¯ s E s , t E ¯ s
where DOD is the maximum depth of EES discharge. E ¯ s is the rated capacity of the EES.
The beginning and ending capacity states of EES capacity during a dispatch cycle shall be within a certain range of deviation, constrained as follows:
( 1 λ ) E s , 0 E s , T E s , 0 ( 1 + λ ) E s , 0
where λ is the allowable deviation from the initial and final state of EES capacity.
The EES output needs to satisfy the following constraints:
0 P s , c h a , t μ s , t P ¯ s 0 P s , d i s , t ( 1 μ s , t ) P ¯ s
where P ¯ s is the rated power of the EES. μ s , t is the charging/discharging state variable, which takes the value of 1 for charging and 0 for discharging.

3.5. Backup Heat Sources Constraints

In the system, the heat load demand is mainly met by the heat generated by the hydrogen fuel cell and the TES. Meanwhile, backup heat sources are required to ensure a stable heat supply, such as gas boilers, electric boilers, or heat pumps. In this paper, we select the common gas boiler as a backup heat source to supplement the insufficient heat for the system. The operation constraints of the gas boiler are as follows:
H g , t = η g V g , t
V ¯ g V g , t V ¯ g
where η g is the heat generation efficiency of the gas boiler. V g , t is the amount of natural gas consumed by the gas boiler at time t in m3. V ¯ g and V ¯ g are the minimum and maximum values of natural gas consumed by the gas boiler, respectively.

3.6. Objective Function

The two-stage robust operation optimization model developed in this paper is designed to obtain the operation result with the minimum economic cost when the uncertain variable u varies toward the worst conditions in the uncertainty set U, which is the min-max-min problem, formulated as follows:
min x   max u U min y Ω ( x , u ) c T y s . t . x = [ μ t e s , t , μ h 2 , t , μ p g , t , μ s , t ] T   y = [ P w , t , P p v , t , P c s p , t , P h f c , e , t , P e c , t , P g e n , t , P p u m p , t , P s , d i s , t , P s , c h a , t , H t e s , h l , t , H h f c , h , t , H g , t , ] T   u = [ u w , t , u p v , t , u l , t ] T
where the first stage problem is outer layer minimization, and the optimization variables are x. The second stage problem is inner layer maximum minimization, and the optimization variables are u and y. The minimization problem involves minimizing the operating cost of the system.
The uncertainty set U is formulated as follows:
U = u w , t [ u w , t Δ u max , w , t , u w , t + Δ u max , w , t ] u p v , t [ u p v , t Δ u max , p v , t , u p v , t + Δ u max , p v , t ] u l , t [ u l , t Δ u max , l , t , u l , t + Δ u max , l , t ] t = 1 ,   2 ,   ,   T
where U is the uncertainty set. u is the uncertainty variable. u w , t , u p v , t , and u l , t are the uncertainty variables for wind, PV, and load, respectively. u w , t , u p v , t , and u l , t are the predicted values of wind, PV, and load, respectively. Δ u max , w , t , Δ u max , p v , t , and Δ u max , l , t are the maximum deviation allowed for wind, PV, and load, respectively.
Ω ( x , u ) denotes the feasible range of optimization variable y given a set of ( x , u ) . The formulation is as follows:
Ω ( x , u ) = y | D y d ,   γ K y = 0 ,   λ F x + G y h ,   ν I u y = u ,   π
where γ , λ , ν , and π are the corresponding dual variables for each constraint in the second-stage minimization problem. D, d, K, F, G, and h are the coefficient matrices corresponding to the constraints from Equations (2)–(23), respectively.

4. Solution Methodology

In this paper, the CCG algorithm [25,26] is applied to the solution of the proposed robust optimization problem. Based on the solution process of the CCG algorithm, the original problem is transformed into a two-stage main problem and sub-problems for the iterative solution. The main problem is formulated as follows:
min x α s . t . α c T y l   D y l d   K y l = 0   F x + G y l h   I u y l = u l *   l k
where k is the current number of iterations. y l is the solution of the sub-problem after the lth iteration. u l * is the value of u in the worst case scenario obtained after the lth iteration.
The decomposed sub-problem is formulated as follows:
max u U min y Ω ( x , u ) c T y
Given ( x , u ) , it is known that the sub-problem is linear, and the inner minimization problem is converted to a maximization problem according to the strong dual theory and merged with the outer maximization problem to obtain the dual problem formulation as follows:
max u U , γ , λ , ν , π   d T γ + ( h F x ) T ν + u T π s . t . D T γ + K T λ + G T ν + I u T π c   γ 0 ,   ν 0 ,   π 0
where u T π is a bilinear term; the optimal solution of the dual problem corresponds to a pole of the uncertainty set U, i.e., when the dual problem is maximized, the uncertain variable u takes the value of the boundary value of the range of fluctuations, and thus, the uncertainty set U can be reformulated as follows:
U = u = [ u w , t , u p v , t , u l , t ] T ,   u w , t = u w , t B w , t Δ u max , w , t , t = 1 T B w , t Γ w u p v , t = u p v , t B p v , t Δ u max , p v , t , t = 1 T B p v , t Γ p v u l , t = u l , t B l , t Δ u max , l , t , t = 1 T B l , t Γ l
where B = [ B w , t , B p v , t , B l , t ] T are the binary variables; the value is 1 when the uncertainty variable of the period takes the boundary value of the fluctuation range. Γ w , Γ p v , and Γ l are the uncertainty adjustment parameters of wind power, PV, and load, respectively, and the value range is an integer from 0 to T, which indicates that the total number of renewable energy output and load takes the boundary value during the whole operation duration, and they can be used to regulate the conservatism of the optimal solution.
Substituting uncertain variables into the dual problem and introducing auxiliary variables to linearize the bilinear, the final formulation of the dual problem is obtained as follows:
max B , B , γ , λ , ν , π   d T γ + ( h F x ) T ν + u T π + Δ u T B s . t . D T γ + K T λ + G T ν + I u T π c   0 B π ¯ B   π π ¯ ( 1 B ) B π   t = 1 T B w Γ w ,   t = 1 T B p v Γ p v ,   t = 1 T B l Γ l
where π ¯ is the upper bound on the dual variable, taking a sufficiently large positive real number. Δ u = [ Δ u max , w , t , Δ u max , p v , t , Δ u max , l , t ] T and B = [ B w , t , B p v , t , B l , t ] T are continuous auxiliary variables.
Through the above derivations and transformations, the robust optimization model is finally converted into a two-stage master problem and sub-problems, which are solved by the CCG algorithm in the following steps:
Step 1: Take a set of uncertain variables u as the initial worst case scenario and set the lower bound L B = , the upper bound U B = + , and an iteration number k = 1 on the total operating cost of the system corresponding to the final operating result;
Step 2: Solve the master problem based on the worst case scenario with uncertain variables u 1 * to obtain the optimal solution of the master problem ( x k * , α k * , y 1 * , K , y k * ) , where the objective function value of the master problem is taken as the new lower bound, i.e., L B = α k * ;
Step 3: Substitute the solution x k * of the master problem and solve the sub-problem to obtain the value f k * ( x k * ) of the objective function of the sub-problem and the uncertainty variable u k + 1 * corresponding to the worst case scenario, and update the upper bound U B = min { U B , f k * ( x k * ) } ;
Step 4: Set the convergence value of the algorithm to ε , stop iterating when U B L B ε , and return the optimal solutions x k * and y k * . Otherwise, add y k + 1 to the base variables and the following column constraints:
α c T y k + 1 D y k + 1 d K y k + 1 = 0 F x + G y k + 1 h I u y k + 1 = u k + 1 *
Then, let k = k + 1 and jump to Step 2 until the convergence condition is satisfied.

5. Case Testing Results

The system shown in Figure 1 is used as an example to verify the effectiveness of the two-stage robust operation optimization model and the solution algorithm proposed in this paper. The case study includes the optimal system economic operation strategy, the comparison of the conventional deterministic optimization model and the two-stage robust optimization model, and the performance analysis of different energy storage configuration schemes.

5.1. Case Parameter Settings

In case studies, we set the rated installed power of wind power and PV at 300 MW and 270 MW, respectively. The rated capacity of TES is 400 MWh, and the initial capacity is 46.48 MWh. The rated capacity of HES is 810 MWh, and the initial capacity is 300 MWh. The rated capacity of EES is 454 MWh, and the initial capacity is 80 MWh. The maximum capacity of PHES is 4200 m3, and the initial capacity is 300 m3. The operating parameters of each device in the system are shown in Table 3.
We set the wind power output uncertainty adjustment parameter Γ w = 5 , PV output uncertainty adjustment parameter Γ p v = 5 , and load uncertainty adjustment parameter Γ l = 10 . The fluctuation deviation in wind power output and PV output is 10% of the predicted value, and the fluctuation deviation in the load is 5% of the predicted value. The predicted and actual values of wind power output, PV power, thermal load, and electric load curves on a typical winter day are shown in Figure 2, where the solid line is the actual renewable energy output curve; the dashed line is the predicted renewable energy output curve; and the shaded part is the range of the uncertainty set.

5.2. Economic Operation Strategy of the System

The optimal operation scheduling strategy for each energy device in the system to satisfy the electric load is shown in Figure 3. The electric load is mainly satisfied by wind and PV power output and supplemented by the co-generation of PHES, EES, and STPP during the trough period of wind and PV power output. The positive values in the figure represent charging, and negative values represent discharging.
As shown in Figure 3, during 1:00–3:00, the electric load is small and is satisfied by wind power output. The wind power output is much larger than the load demand, and the remaining green power is firstly supplied to PHES for charging at the maximum rated power and then supplied to EES for charging. The remaining renewable energy output is small after meeting the load demand at 4:00, and all of it is supplied to EES for charging. The electric load increases at 5:00, while the wind power output decreases, and the load shortfall is small, which is satisfied by EES discharges. The electric load continues to increase at 6:00, at which time the PHES generates electricity at its maximum rated power, with shortfalls being supplemented by EES discharges. The PV power output increases from 7:00; the proportion of renewable energy in the whole power generation system increases; and the excess green power is supplied to the EES for charging. During 8:00–15:00, the PV output increases, the PHES is charged at rated power, and the EES is charged at the same time until they are full. During 18:00–22:00, the electric load reaches the peak, while renewable energy generates power, PHES generates power at the maximum rated power, and the EES discharges energy to supplement the insufficient power. During 23:00–24:00, after the renewable energy generation meets the electric load, the remaining power is supplied to the EES for charging. The results show that real-time electricity supply and demand matching of the system can be achieved through the coordination of renewable energy generation and hybrid energy storage.
The optimal operation scheduling strategy for each energy device in the system to satisfy the heat load is shown in Figure 4. The heat load is mainly met by the STPP, the hydrogen fuel cell, and the gas boiler. The positive values in the figure represent charging, and negative values represent discharging.
As shown in Figure 4, the heat load presents higher values during 1:00–3:00, when the STPP is unable to supply heat directly. The hydrogen fuel cell supplies heat at the maximum power to satisfy the heat load. During 4:00–6:00, the hydrogen stored in the HES is gradually depleted, and the gas boiler is used at a high cost to satisfy the heat load, and this is the only scenario where external natural gas is required. During 7:00–19:00, the collectors of the STPP are used to supply heat directly at the maximum power to meet the heat load, and the remaining heat is stored in the TES. During 10:00–17:00, the renewable energy output generates hydrogen through the electrolyzer after both PHES and EES have reached the upper limit. During 21:00–24:00, the hydrogen fuel cell operates at maximum thermal power to meet the thermal load. The results show that by coordinating renewable energy generation and hybrid energy storage, the thermal time-shift characteristics of STPP and HES can be flexibly utilized to achieve real-time thermal energy supply and demand matching of the system and improve the heating flexibility of the system.
The dynamic change process of the storage capacity of the hybrid energy storage system is shown in Figure 5. The hybrid energy storage system works together with renewable energy sources to meet the electrical and thermal demands of the system by coordinating the charging and discharging operations of PHES, EES, STPP, and HES.
As shown in Figure 5, PHES charging and discharging are prioritized higher due to the lower unit O&M cost. EES charging and discharging are flexible and responsive and are thus discharged to satisfy the system electricity demand when the load gap is small. The STPP continues to dissipate the heat at night when the temperature is low and continues to recharge during daytime when the solar radiation is high. For HES, due to the high unit O&M cost of the electrolyzer, the renewable energy output is prioritized to satisfy the PHES and EES, and the remaining power is used for hydrogen generation from water electrolysis and is supplied to the hydrogen fuel cell for use during the peak load period. The results show that the synergistic operation of the hybrid energy storage system can balance the fluctuation in renewable energy by shifting peaks and filling valleys and improve the efficiency of renewable energy consumption and power supply reliability.

5.3. Comparison of Deterministic Optimization Result and Robust Optimization Result

In this sub-section, we compare the conventional deterministic optimization model with the two-stage robust optimization operation model proposed in this paper in terms of the system operation performance and the reasonableness in determining the worst case scenario.
We use the predicted values to represent the values of the uncertain variables, and the deterministic optimization model is formulated as follows:
min x , y c T y s . t . D y d   K y = 0   F x + G y h   I u y = u
where u is the predicted value of the uncertainty variable, which is expressed as follows:
u = [ u w , t ,   u p v , t ,   u l , t ] ,   t = 1 ,   2 ,   ,   T
The above model is a mixed integer programming model, which can be solved directly using a commercial solver.
In this sub-section, we select certain periods in the deterministic optimization model where the uncertain variables are taken to the boundary values of the prediction range (the number of periods is the same as that in the corresponding two-stage robust operation optimization model) and compare the deterministic results with the robust operation results. We set the wind power uncertainty adjustment parameter to 5, the PV power uncertainty adjustment parameter to 5, and the load power uncertainty adjustment parameter to 10 to solve the robust optimization model. By analyzing the results of robust optimization, the worst case scenarios are as follows: wind power output in 4 h, 9–10 h, 18 h, 23 h to obtain the minimum value within the predicted shading range; PV output in 9 h, 11 h, 14 h, 16–17 h to obtain the minimum value within the predicted shading range; load power in 2–3 h, 5 h, 7–8 h, 14 h, 18 h, 20 h, 22–23 h to obtain the minimum value within the predicted shading range; and load power in 2–3 h, 5 h, 7–8 h, 14 h, 18 h, 20 h, 22–23 h. The maximum value within the predicted shading range is obtained in 2–3 h, 5 h, 7–8 h, 14 h, 18 h, 20 h, and 22–23 h; the maximum value within the predicted shading range is obtained in 1 h, 3–5 h, 7 h, 10–11 h, 18 h, and 23–24 h for thermal load. Then, we set the following three scenarios based on the solution results:
  • Scenario 1: The deterministic optimization model has the same periods as the robust optimization model for the worst case scenarios for wind power and PV power; the deterministic optimization model has the same periods as the robust optimization model for the worst case scenarios for the electric load of 6–8 h, 11–14 h, and 18–20 h and the periods for the thermal load of 6–8 h and 18–24 h;
  • Scenario 2: The worst case scenarios in the deterministic optimization model are 6 h and 11–15 h for wind power and 11–15 h for PV power; the worst case scenarios in the deterministic optimization model are the same as in the robust optimization model for electric and thermal load;
  • Scenario 3: The deterministic optimization model has the same periods for the worst case scenarios for wind, PV output, electric load, and thermal load as the robust optimization model.
We solve the system operating costs for each of the above three scenarios, and the results are shown in Table 4.
As shown in Table 4, although the electrical and thermal loads in the deterministic optimization model in Scenario 1 are larger than those in the robust optimization model to reach the upper bound of the predicted shading range, and the wind and PV outputs in the deterministic optimization model in Scenario 2 are smaller than those in the robust optimization model to reach the lower bound of the predicted shading range, the two scenarios are still not the worst case scenarios, and the total operating costs of the system are lower than the robust optimization model. Only in Scenario 3, where the periods are the same, the results of the deterministic optimization model and the robust optimization model are the same. The results show that the optimal operation strategy of the system obtained by solving the two-stage robust operation optimization method proposed in this paper satisfies the system requirements under the worst case scenario and ensures the robustness of the system operation.

5.4. Performance Analysis of Different Energy Storage Configuration Schemes

This sub-section analyzes the impact of different energy storage devices on the renewable energy consumption of the system. We set the load-shedding penalty at 500 RMB/MW and the renewable power abandonment penalty at 200 RMB/MW, and we select the following four cases for analysis:
  • Case 1: The PHES, EES, STPP, and HES are not considered;
  • Case 2: Consider the PHES and STPP, without the EES and HES;
  • Case 3: Consider the EES and HES, without the PHES and STPP;
  • Case 4: Consider the PHES, STPP, EES, and HES, which is the system proposed in this paper.
The amount of discarded renewable power and load cutting for Case 1 are shown in Figure 6. The positive value indicates that the system discards renewable energy power, and the negative value indicates that the system cuts load. As shown in Figure 6, since the electric load is completely satisfied by renewable energy, the system cannot fully consume the renewable energy power when it is high. The remaining renewable energy power is completely discarded after satisfying the load. Moreover, when the renewable energy output is low, the system cannot meet the electric load only with the renewable energy output, and load shedding is needed.
The amount of renewable discarded power and load cutting for Case 2 are shown in Figure 7. As shown in Figure 7, with the incorporation of PHES and STPP, the amount of renewable discarded power and load cutting in the system are reduced compared with Case 1. In Case 2, the remaining output of renewable energy is consumed by PHES operating at maximum rated power. The STPP prioritizes the heat load, and the remaining heat is used to generate electricity to satisfy the electrical load.
The amount of discarded renewable power and load cutting for Case 3 are shown in Figure 8. As shown in Figure 8, with the incorporation of EES and HES, the amount of renewable discarded power and load cutting in the system are reduced compared with Case 1. The output power of renewable energy is prioritized to be consumed by EES charging at the maximum rated power until the power stored in the EES reaches the rated capacity. The remaining green power is consumed by the electrolyzer to generate hydrogen at maximum rated power and stored in the hydrogen storage tank until the tank reaches its rated capacity.
Case 4 is the system proposed in this paper. In Case 4, there is no discarded renewable power or load cutting. All renewable energy outputs are consumed by the coordination and cooperation of PHES, EES, STPP, and HES. Each energy device and energy storage system coordinates to meet the electric and heat load of the system and improve the renewable energy consumption efficiency of the system.
The system operating costs in different cases are shown in Table 5. As shown in Table 5, the total system operating cost of Case 1 is much larger than the other three cases due to the high renewable power abandonment penalty and load-shedding penalty. The reason that the operating cost of Case 2 is lower than Case 3 is that the STPP fully satisfies the heat load during daytime, which can reduce the operating cost of the additional heat sources. The operating cost of Case 4 is the smallest among all cases; the renewable energy generation is fully consumed; and both the electric and heat loads are satisfied. The results show that the system proposed in this paper has better operating economics.

6. Conclusions

This paper focuses on the robust optimization of large-scale wind–solar storage renewable energy systems considering hybrid storage multi-energy synergy for the technological advancement of sustainable energy systems. The problem is formulated as a robust optimization model, which can effectively deal with uncertainties and describe the multi-energy coupling characteristics during the production, storage, conversion, and consumption of multiple energy sources, such as electricity, heat, gas, and renewable energy sources, in the system. The two-stage robust optimization method considering hybrid energy storage and multi-energy synergy is developed, which coordinates the utilization of the time-shifting characteristics of multiple energy storage and the multi-energy complementary of the system, and it achieves real-time supply and demand matching of the system under uncertainties through multi-energy synergy. The CCG algorithm is utilized to solve the problem. The numerical results show that during the peak wind power generation period of 1:00–3:00 and the peak PV power generation period of 8:00–15:00, PHES and EES fully consume the green power by coordinating and cooperating with each other and utilizing their own time-shifting characteristics to realize the real-time electricity supply and demand matching of the system. Meanwhile, the proposed method utilizes the thermal energy time-shifting characteristics of STPP and HES to realize the real-time thermal supply and demand matching of the system. It is also found that the developed method prioritizes the dispatch of PHES with lower O&M cost during the peak renewable energy output period of 8:00–15:00 and EES with high responsiveness during night-time when the load gap is small, in combination with HES and STPP, to jointly meet the system demand. The advantages of different energy storage technologies are fully utilized to achieve efficient system operation through multi-energy synergy. Moreover, the robust optimization results and the deterministic optimization results are compared. In the robust optimization, the worst case operating cost under the combined effect of multiple uncertainties considering wind power output, PV output, electric load, and thermal load is 44.15 × 10⁴ RMB, while the operating costs considering single and partial uncertainties for worst case scenarios are lower than the results of the robust optimization, which indicates that the optimal operating strategy of the system obtained by the developed method meets the worst case system requirement, and the robustness of the system operation is guaranteed. Finally, the performance analysis of the four cases in the numerical tests in this paper shows that the proposed method has no discarded renewable power and load cutting, which improves the renewable energy consumption efficiency of the system. The system operating cost is reduced from 137.47 × 10⁴ RMB without energy storage to 44.15 × 10⁴ RMB, which lowers the system operating cost.
This paper develops the problem formulation from the perspective of system operation; therefore, it is assumed that all components of the system have been configured in accordance with the optimal scheme. In the actual operation process, it is necessary to consider the comprehensive benefits of the system in the whole life cycle, such as planning, procurement, utilization, maintenance, and disposal, to reasonably formulate the selection and sizing program of the system, but this is beyond the scope of this paper. Therefore, it is an interesting avenue for future work to analyze the optimal configuration schemes of renewable energy systems with hybrid energy storage considering the whole life cycle to improve the economics of the system.

Author Contributions

Conceptualization, B.X. and Z.G.; methodology, H.P. and B.X.; writing—original draft preparation, K.C.; writing—review and editing, Y.L.; funding acquisition, B.X. and K.L. All authors have read and agreed to the published version of the manuscript.

Funding

This research is funded by the Power Construction Corporation of China, Ltd. Technology Project (DJ-ZDXM-2021-22) and the Shaanxi Province Postdoctoral Research Project Funding (2023BSHGZZHQYXMZZ18).

Institutional Review Board Statement

Not applicable.

Informed Consent Statement

Not applicable.

Data Availability Statement

The data presented in this study will be made available on request.

Conflicts of Interest

Authors Bin Xiao, Zhenxin Gao, Huaiwu Peng, and Kang Chen are employed by Northwest Engineering Corporation Limited, PowerChina. Authors Bin Xiao, Huaiwu Peng, and Kang Chen receive research grants from Power Construction Corporation of China, Ltd. Technology Project (DJ-ZDXM-2021-22); Author Zhenxin Gao receives research grants from Shaanxi Province Postdoctoral Research Project Funding (2023BSHGZZHQYXMZZ18). The remaining authors declare that the research was conducted in the absence of any commercial or financial relationships, which could be construed as potential conflicts of interest. The funder was not involved in the study design, collection, analysis, interpretation of data, the writing of this article or the decision to submit it for publication.

References

  1. Zhao, X.; Ma, X.; Chen, B.; Shang, Y.; Song, M. Challenges toward Carbon Neutrality in China: Strategies and Countermeasures. Resour. Conserv. Recycl. 2022, 176, 105959. [Google Scholar] [CrossRef]
  2. Sen, S.; Ganguly, S. Opportunities, Barriers and Issues with Renewable Energy Development—A Discussion. Renew. Sustain. Energy Rev. 2017, 69, 1170–1181. [Google Scholar] [CrossRef]
  3. Zhai, Q.; Li, X.; Lei, X.; Guan, X. Transmission Constrained UC with Wind Power: An All-Scenario-Feasible MILP Formulation with Strong Nonanticipativity. IEEE Trans. Power Syst. 2017, 32, 1805–1817. [Google Scholar] [CrossRef]
  4. Zhou, Y.; Zhao, J.; Zhai, Q. 100% Renewable Energy: A Multi-Stage Robust Scheduling Approach for Cascade Hydropower System with Wind and Photovoltaic Power. Appl. Energy 2021, 301, 117441. [Google Scholar] [CrossRef]
  5. Hao, J.; Chen, L.; Zhang, N. A Statistical Review of Considerations on the Implementation Path of China’s “Double Carbon” Goal. Sustainability 2022, 14, 11274. [Google Scholar] [CrossRef]
  6. Vasilkov, O.S.; Dobysh, V.S. Features of Application Hybrid Energy Storage in Power Supply Systems. In Proceedings of the 2019 IEEE Conference of Russian Young Researchers in Electrical and Electronic Engineering (EIConRus), Saint Petersburg and Moscow, Russia, 28–31 January 2019; pp. 728–730. [Google Scholar]
  7. Javed, M.S.; Zhong, D.; Ma, T.; Song, A.; Ahmed, S. Hybrid Pumped Hydro and Battery Storage for Renewable Energy Based Power Supply System. Appl. Energy 2020, 257, 114026. [Google Scholar] [CrossRef]
  8. Lin, X.; Zamora, R. Controls of Hybrid Energy Storage Systems in Microgrids: Critical Review, Case Study and Future Trends. J. Energy Storage 2022, 47, 103884. [Google Scholar] [CrossRef]
  9. Alnaqbi, S.A.; Alasad, S.; Aljaghoub, H.; Alami, A.H.; Abdelkareem, M.A.; Olabi, A.G. Applicability of Hydropower Generation and Pumped Hydro Energy Storage in the Middle East and North Africa. Energies 2022, 15, 2412. [Google Scholar] [CrossRef]
  10. Zhao, Z.; Yuan, Y.; He, M.; Jurasz, J.; Wang, J.; Egusquiza, M.; Egusquiza, E.; Xu, B.; Chen, D. Stability and Efficiency Performance of Pumped Hydro Energy Storage System for Higher Flexibility. Renew. Energy 2022, 199, 1482–1494. [Google Scholar] [CrossRef]
  11. Wang, S.; Sun, W. Capacity Value Assessment for a Combined Power Plant System of New Energy and Energy Storage Based on Robust Scheduling Rules. Sustainability 2023, 15, 15327. [Google Scholar] [CrossRef]
  12. Baindu Gobio-Thomas, L.; Darwish, M.; Stojceska, V. Review on the Economic Impacts of Solar Thermal Power Plants. Therm. Sci. Eng. Prog. 2023, 46, 102224. [Google Scholar] [CrossRef]
  13. Dong, X.; Wu, J.; Xu, Z.; Liu, K.; Guan, X. Optimal Coordination of Hydrogen-Based Integrated Energy Systems with Combination of Hydrogen and Water Storage. Appl. Energy 2022, 308, 118274. [Google Scholar] [CrossRef]
  14. Arsad, A.Z.; Hannan, M.A.; Al-Shetwi, A.Q.; Mansur, M.; Muttaqi, K.M.; Dong, Z.Y.; Blaabjerg, F. Hydrogen Energy Storage Integrated Hybrid Renewable Energy Systems: A Review Analysis for Future Research Directions. Int. J. Hydrogen Energy 2022, 47, 17285–17312. [Google Scholar] [CrossRef]
  15. Worku, M.Y. Recent Advances in Energy Storage Systems for Renewable Source Grid Integration: A Comprehensive Review. Sustainability 2022, 14, 5985. [Google Scholar] [CrossRef]
  16. Zheng, L.; Wen, Z.; Qiu, Z.; Liu, F.; Guo, J.; Luo, S. Low-Carbon Optimized Operation of an Integrated Energy System that Takes into Account Solar Thermal Power Plants and Hydrogen Storage. Electrical Measurement & Instrumentation. 2022, pp. 1–9. Available online: https://kns.cnki.net/kcms/detail/23.1202.TH.20220530.1813.003.html (accessed on 10 November 2023).
  17. Awan, A.B.; Zubair, M.; Sidhu, G.A.S.; Bhatti, A.R.; Abo-Khalil, A.G. Performance Analysis of Various Hybrid Renewable Energy Systems Using Battery, Hydrogen, and Pumped Hydro-Based Storage Units. Int. J. Energy Res. 2019, 43, 6296–6321. [Google Scholar] [CrossRef]
  18. Ma, T.; Yang, H.; Lu, L. Feasibility Study and Economic Analysis of Pumped Hydro Storage and Battery Storage for a Renewable Energy Powered Island. Energy Convers. Manag. 2014, 79, 387–397. [Google Scholar] [CrossRef]
  19. Zhang, W.; Maleki, A.; Rosen, M.A.; Liu, J. Optimization with a Simulated Annealing Algorithm of a Hybrid System for Renewable Energy Including Battery and Hydrogen Storage. Energy 2018, 163, 191–207. [Google Scholar] [CrossRef]
  20. Wang, S.; Wu, X.; Jafarmadar, S.; Singh, P.K.; Khorasani, S.; Marefati, M.; Alizadeh, A. Numerical Assessment of a Hybrid Energy System Based on Solid Oxide Electrolyzer, Solar Energy and Molten Carbonate Fuel Cell for the Generation of Electrical Energy and Hydrogen Fuel with Electricity Storage Option. J. Energy Storage 2022, 54, 105274. [Google Scholar] [CrossRef]
  21. Jiao, Y.; Månsson, D. Greenhouse Gas Emissions from Hybrid Energy Storage Systems in Future 100% Renewable Power Systems—A Swedish Case Based on Consequential Life Cycle Assessment. J. Energy Storage 2023, 57, 106167. [Google Scholar] [CrossRef]
  22. Shen, W.; Zeng, B.; Zeng, M. Multi-Timescale Rolling Optimization Dispatch Method for Integrated Energy System with Hybrid Energy Storage System. Energy 2023, 283, 129006. [Google Scholar] [CrossRef]
  23. Qiu, Y.; Li, Q.; Ai, Y.; Chen, W.; Benbouzid, M.; Liu, S.; Gao, F. Two-Stage Distributionally Robust Optimization-Based Coordinated Scheduling of Integrated Energy System with Electricity-Hydrogen Hybrid Energy Storage. Prot. Control Mod. Power Syst. 2023, 8, 33. [Google Scholar] [CrossRef]
  24. Rasool, M.H.; Taylan, O.; Perwez, U.; Batunlu, C. Comparative Assessment of Multi-Objective Optimization of Hybrid Energy Storage System Considering Grid Balancing. Renew. Energy 2023, 216, 119107. [Google Scholar] [CrossRef]
  25. Zeng, B.; Zhao, L. Solving Two-Stage Robust Optimization Problems Using a Column-and-Constraint Generation Method. Oper. Res. Lett. 2013, 41, 457–461. [Google Scholar] [CrossRef]
  26. Roald, L.A.; Pozo, D.; Papavasiliou, A.; Molzahn, D.K.; Kazempour, J.; Conejo, A. Power Systems Optimization under Uncertainty: A Review of Methods and Applications. Electr. Power Syst. Res. 2023, 214, 108725. [Google Scholar] [CrossRef]
Figure 1. The structure of the proposed system.
Sustainability 16 00243 g001
Figure 2. The predicted and actual values of uncertainty variables: (a) Wind power; (b) Solar PV; (c) Heating demand; (d) Electrical demand.
Sustainability 16 00243 g002
Figure 3. Optimized scheduling strategy to meet the electric load.
Sustainability 16 00243 g003
Figure 4. Optimized scheduling strategy to meet heat load.
Sustainability 16 00243 g004
Figure 5. The dynamic change process of storage capacity of the hybrid energy storage system: (a) PHES; (b) EES; (c) STPP; (d) HES.
Sustainability 16 00243 g005aSustainability 16 00243 g005b
Figure 6. The amount of discarded renewable power and load cutting for Case 1.
Sustainability 16 00243 g006
Figure 7. The amount of discarded renewable power and load cutting for Case 2.
Sustainability 16 00243 g007
Figure 8. The amount of discarded renewable power and load cutting for Case 3.
Sustainability 16 00243 g008
Table 1. Comparison of the above literature review.
ReferenceHybrid Energy StorageUncertaintyMethod
EESHESPHESSTPP
Zheng et al. [16] 1 × 2Mixed integer linear programming
Javed et al. [7] ×Rule-based operation
Awan et al. [17] ×Simulation
Ma et al. [18] ×Real project analysis
Zhang et al. [19] ×Simulated annealing algorithm
Wang et al. [20] ×Numerical simulation
Jiao et al. [21] ×Consequential life cycle assessment
Shen et al. [22] Model predictive control
Qiu et al. [23] CCG
Rasool et al. [24] Genetic algorithm
This paperCCG
1 The study involves corresponding part. 2 The study does not involve corresponding part.
Table 2. The nomenclature used in this paper.
Nomenclature Nomenclature
Abbreviation θ Self-loss coefficient of the TES
CCGColumn constraint generation η t e s , c h a / η t e s , d i s Charging and discharging heat efficiencies of the TES
EESElectrochemical energy storage η h e Thermoelectric conversion efficiency
HESHydrogen energy storage η h f c , e / η h f c , h Electrical/thermal conversion efficiency of hydrogen fuel cells
O&MOperation and maintenance η h 2 , c h a / η h 2 , d i s Efficiency of hydrogen charge/discharge
PHESPumped hydro energy storage η s , c h a / η s , d i s Charging/discharging efficiencies of EES
PVPhotovoltaic η g Heat generation efficiency of the gas boiler
STPPSolar thermal power plantDODMaximum depth of EES discharge
TESThermal energy storageVariables
Parameters E s , t Electricity stored in the EES
D t Direct radiance factor of the solar energy E e c , t Hydrogen power obtained from the electrolyzer
E ¯ s Rated capacity of the EES E h 2 , t Power of hydrogen stored in the hydrogen storage tank
H L , h , t Heat load demand of the system H s t f , t Obtained thermal energy of the PV module in STPP
H ¯ t e s , h l Output upper limit of the TES supplied directly to the heat load H t e s , t Heat stored in the TES
H ¯ h f c , h Upper thermal energy output limit of the hydrogen fuel cell H c h a , t / H d i s , t Charging and discharging heat of the TES
P L , e , t Electrical load demand of the system H c s p , e , t Heat supplied by the collector to the electricity generation unit
P ¯ s Rated charge/discharge power of the EES H l o s s , t Heat discarded in TES
P ¯ h f c , e / P ¯ e c Upper power generation output/input limit of the hydrogen fuel cell/electrolyzer H t e s , e , t Heat supplied by the TES to the electricity generation unit
P ¯ w , t / P ¯ p v , t Predicted output power of wind and PV power generation P h 2 , c h a , t Power of hydrogen charge
P ¯ c s p Output upper limit of the electricity generation unit P e c , t Input power of the electrolyzer
P ¯ p u m p / P ¯ g e n Rated power of the pump and generator of PHES P c s p , t Generating power of STPP
P ¯ p u m p / P ¯ g e n Lower limit of the output of the pump and generator of PHES P s , c h a , t / P s , d i s , t Charging/discharging power of EES
S m Area of the mirror farm P w , t / P p v , t Output power of wind power/PV
V ¯ u r / V ¯ u r Minimum and maximum capacity of the reservoir in PHES P h f c , e , t / H h f c , h , t Electrical and thermal output power of the hydrogen fuel cell
V ¯ g / V ¯ g Minimum/maximum value of natural gas consumed by the gas boiler P p u m p , t / P g e n , t Pumping and generating power of the PHES
c w / c p v / c c s p / c h f c / c e c / c p g / c s / c g Unit operation and maintenance costs of wind power/PV/STPP/hydrogen fuel cell/electrolyzer/PHES/EES/backup heat sources P s , c h , t / P s , d i s , t Charging and discharging power of the EES
ρ Density of water V g , t Consumed natural gas of the gas boiler
g Acceleration of gravity V u r , t Upper reservoir capacity of PHES
h Head of the water in PHES μ h 2 , t State variable of hydrogen charge/discharge
η s h Photothermal conversion efficiency μ p g , t Pumping/generation state variable
σ / λ Allowable deviation in the PHES/EES μ s , t Charging/discharging state variable of EES
Table 3. The operating parameters of each device in the system.
DeviceParameter/UnitValue
Wind power farm c w /(RMB/MW)50
Solar PV farm c p v /(RMB/MW)50
STPP c c s p /(RMB/MW)15
P ¯ c s p /MW144
H ¯ t e s , h l /MWh192
HES c e c /(RMB/MW)18
c h f c /(RMB/MW)20
P ¯ h f c , e /MW125
P ¯ e c /MW220
H ¯ h f c , h /MWh100
EES c s /(RMB/MW)10
DOD0.8
E ¯ s /MWh454
P ¯ s /MW125
PHES c p g /(RMB/MW)5
V ¯ u r /m31500
V ¯ u r /m3300
P ¯ p u m p /MW77
P ¯ g e n /MW58
Gas boiler c g /(RMB/MW)73
Table 4. The system operating costs for different scenarios.
ScenarioSystem Operating Cost/×104 RMB
Scenario 144.13
Scenario 244.09
Scenario 344.15
Robust optimization result44.15
Table 5. The system operating costs in different cases.
CaseSystem Operating Cost/×104 RMB
Case 1137.47
Case 266.80
Case 385.34
Case 444.15
Disclaimer/Publisher’s Note: The statements, opinions and data contained in all publications are solely those of the individual author(s) and contributor(s) and not of MDPI and/or the editor(s). MDPI and/or the editor(s) disclaim responsibility for any injury to people or property resulting from any ideas, methods, instructions or products referred to in the content.

