
Connecting the Dots between Urban Morphology and the Air Quality of Cities under a Changing Climate: A Bibliometric Analysis


Abstract
:1. Introduction
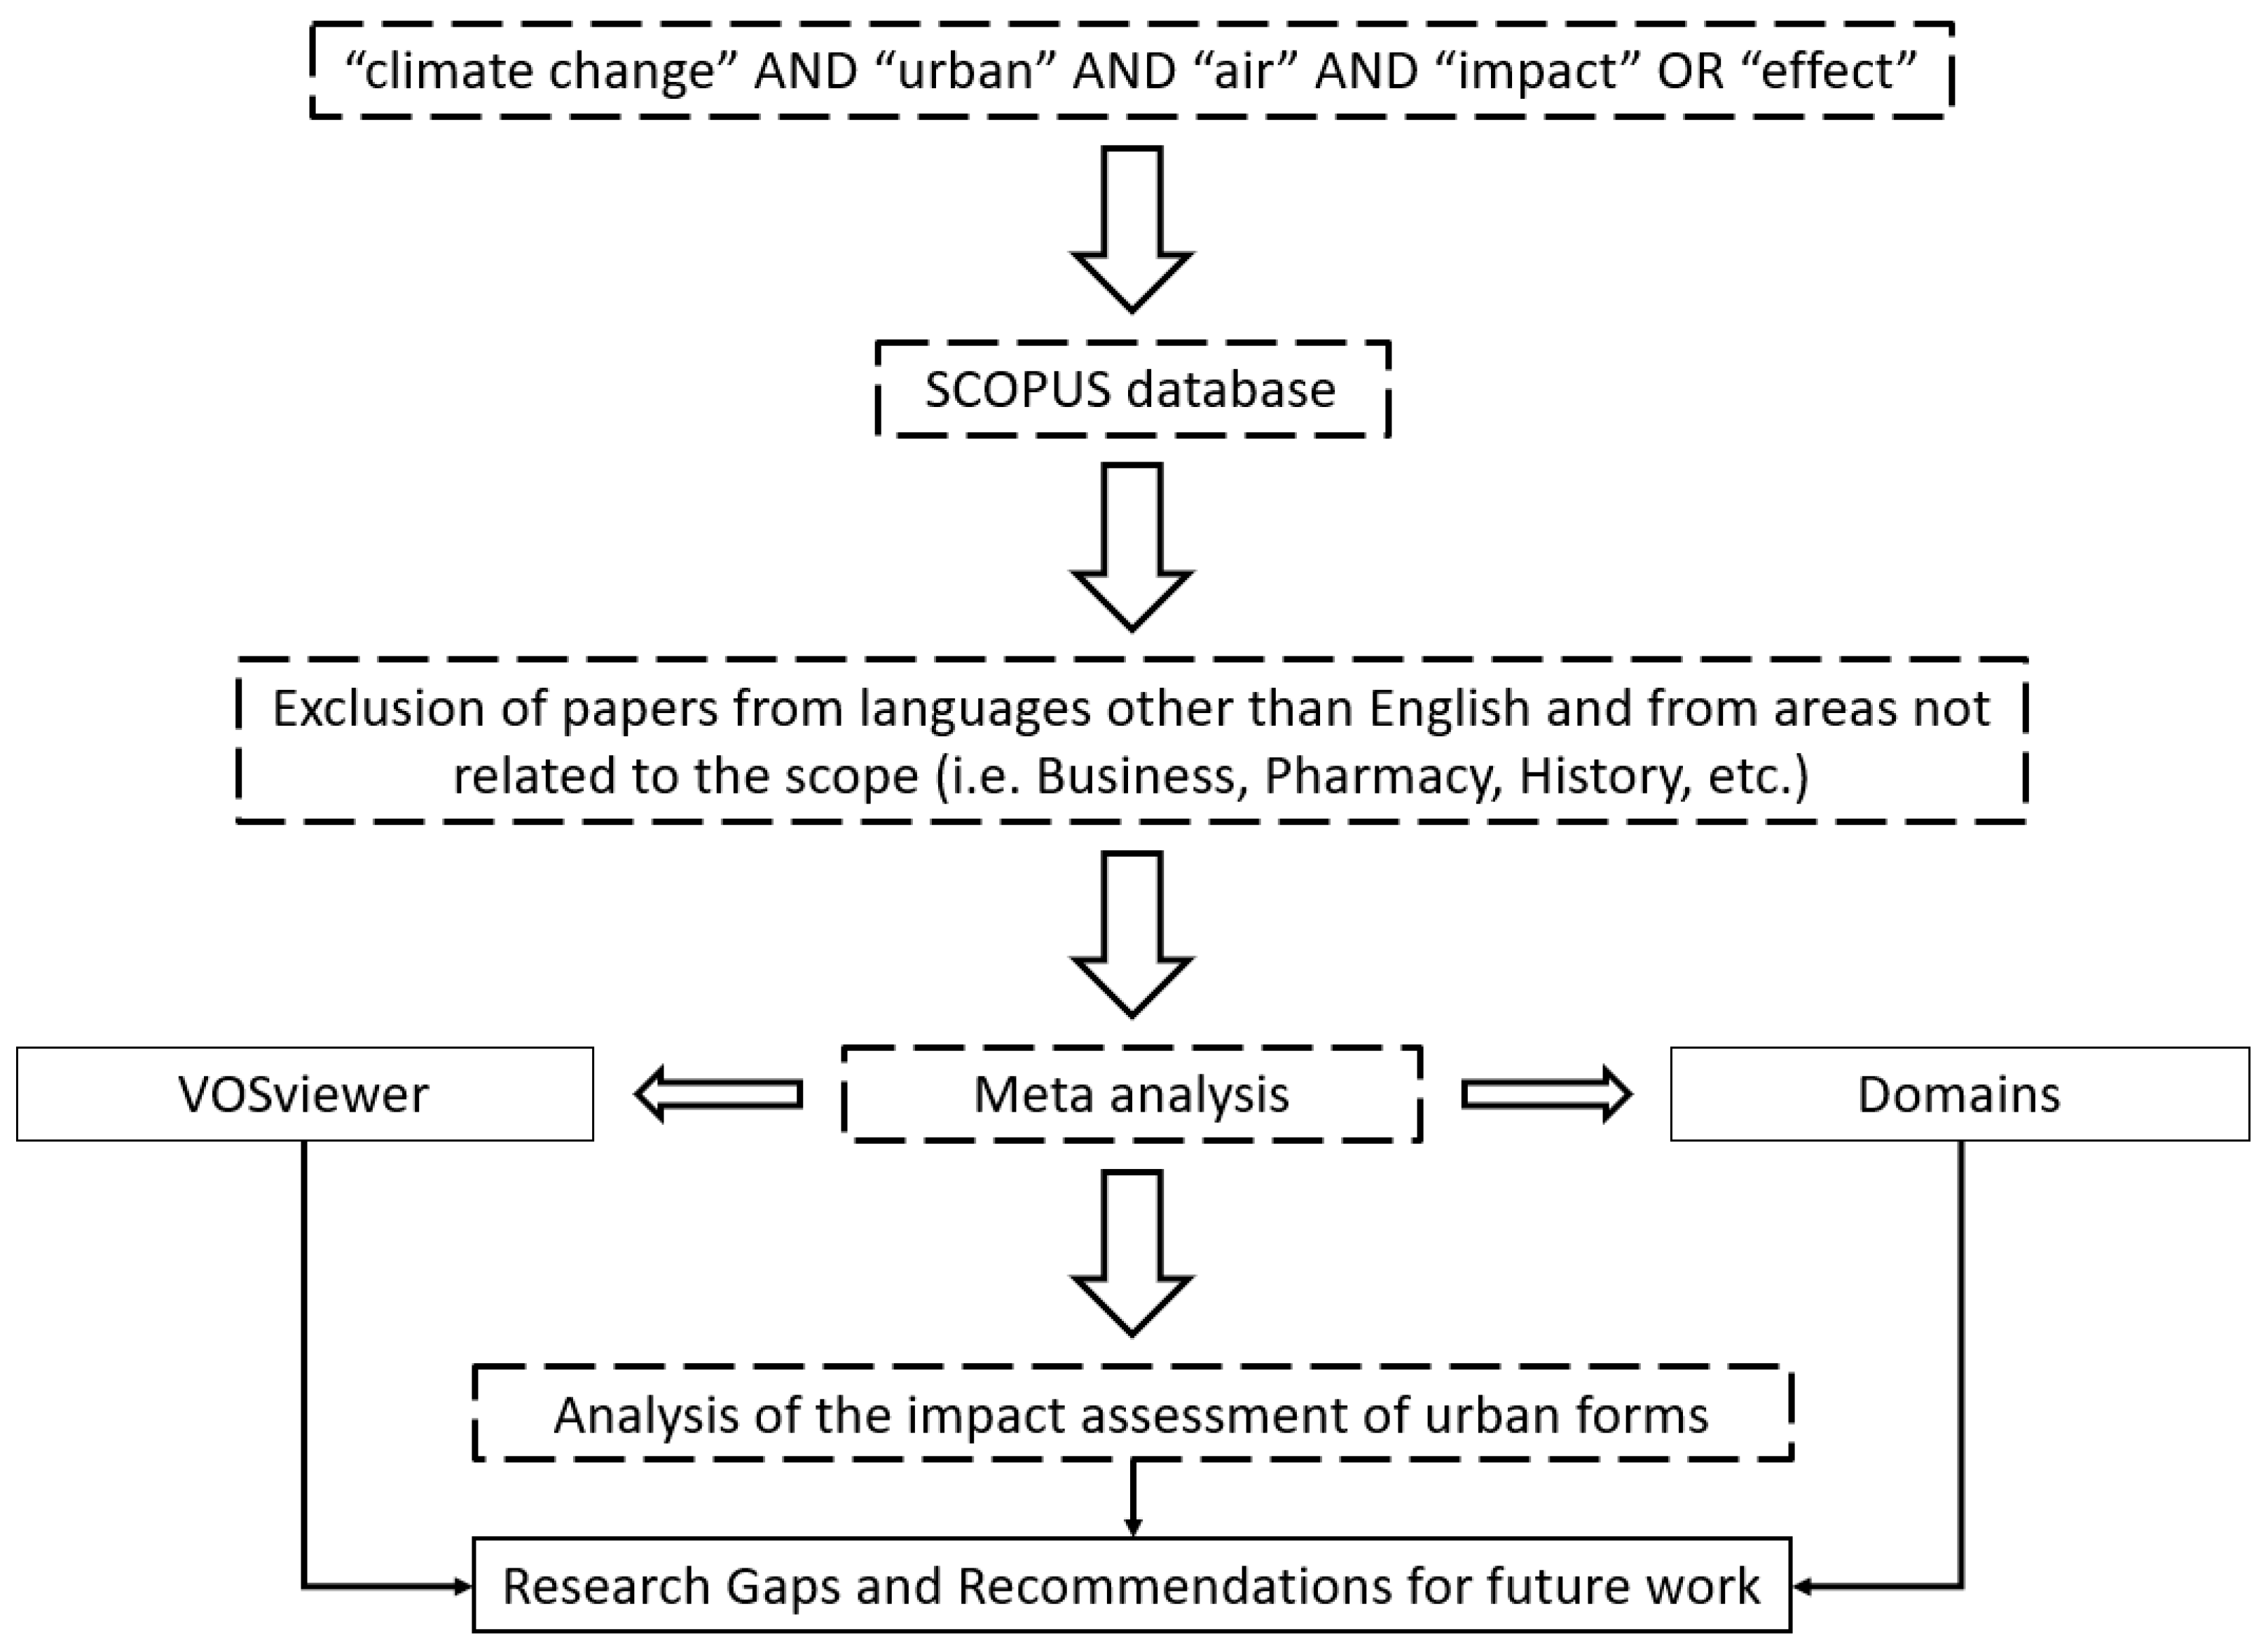
2. Methodology
- “Socioeconomic”, which included cost–benefit studies or any study that considered the cost or other economic parameters;
- “Urban Morphology”, when dealing with urban form, or the effects of urban land use (this excludes papers that focus on changes to, for example, forest areas, or non-urban water bodies); “Urban Climate”, when focused on the urban microclimate, ranging from the urban heat island effect to thermal comfort. This also includes studies wherein precipitation is assessed;
- “Energy”, which included heat fluxes, energy sources, and air conditioning analysis;
- “Air quality”, which included pollutant emissions and concentrations. Even though “air quality” is a search term, there are studies that do not include it as a domain;
- “Mobility”, referring to both pedestrian and land transport;
- “Health”, comprising thermal comfort, allergens, and morbidity, among other factors;
- “Population”, which dealt with population demographics;
- “Urban metabolism”, which comprised ecological footprint studies as well as food supply chains;
- “Water resources”, which included wastewater treatments and water pollutants;
- “Sustainability”, which included nature-based solutions and ecological topics,
- “General”, which included the general effects and impacts of climate change, as well as papers from conferences wherein multiple topics were addressed;
- “Other”, when the scope was too alien for the research interest, resulting from a search engine error.
3. Meta-Analysis
3.1. Relationships between Domains
3.2. Research over Time
4. The Role of Urban Morphology at an Environmental Level
4.1. Systematic Review on the Impact of Urban Morphology
4.2. Research Gaps
5. Conclusions
Author Contributions
Funding
Conflicts of Interest
References
- Kabisch, N.; Frantzeskaki, N.; Pauleit, S.; Artmann, M.; Davis, M.; Haase, D.; Knapp, S.; Korn, H.; Stadler, J.; Zaunberger, K.; et al. Nature-based solutions to climate change mitigation and adaptation in urban areas –perspectives on indicators, knowledge gaps, opportunities and barriers for action. Ecol. Soc. 2016, 21, 39. [Google Scholar] [CrossRef]
- European Environment Agency. Climate Change, Impacts and Vulnerability in Europe 2016-An Indicator-Based Report; European Environment Agency: Copenhagen, Denmark, 2017; Volume 1/2017.
- Rafael, S.; Martins, H.; Sá, E.; Carvalho, D.; Borrego, C.; Lopes, M. Influence of urban resilience measures in the magnitude and behaviour of energy fluxes in the city of Porto (Portugal) under a climate change scenario. Sci. Total Environ. 2016, 566–567, 1500–1510. [Google Scholar] [CrossRef] [PubMed]
- Lindberg, F.; Grimmond, C.S.B.; Yogeswaran, N.; Kotthaus, S.; Allen, L. Impact of city changes and weather on anthropogenic heat flux in Europe 1995–2015. Urban Clim. 2013, 4, 1–15. [Google Scholar] [CrossRef]
- Jacob, D.J.; Winner, D.A. Effect of climate change on air quality. Atmos. Environ. 2009, 43, 51–63. [Google Scholar] [CrossRef]
- Liang, C.J.; Lin, P.Y.; Chen, Y.C.; Liang, J.J. Effects of regional air pollutants on respiratory diseases in the basin metropolitan area of central Taiwan. Sustain. Environ. Res. 2023, 33, 1. [Google Scholar] [CrossRef]
- Qin, Y.M.; Sun, C.Z.; Li, D.; Zhang, H.; Wang, H.Y.; Duan, Y. Does urban air pollution have an impact on public health? Empirical evidence from 288 prefecture-level cities in China. Urban Clim. 2023, 51, 1–13. [Google Scholar] [CrossRef]
- Schneider, A.; Woodcock, C.E. Compact, Dispersed, Fragmented, Extensive? A Comparison of Urban Growth in Twenty-five Global Cities using Remotely Sensed Data, Pattern Metrics and Census Information. Urban Studies. 2008, 45, 659–692. [Google Scholar] [CrossRef]
- Monteiro, A.; Miranda, A.I.; Borrego, C.; Vautard, R. Air quality assessment for Portugal. Sci. Total Environ. 2007, 373, 22–31. [Google Scholar] [CrossRef]
- Borrego, C.; Martins, H.; Tchepel, O.; Salmim, L.; Monteiro, A.; Miranda, A.I. How urban structure can affect city sustainability from an air quality perspective. Environ. Model. Softw. 2006, 21, 461–467. [Google Scholar] [CrossRef]
- Stevenson, M.; Thompson, J.; De Sá, T.H.; Ewing, R.; Mohan, D.; Mcclure, R.; Roberts, I.; Tiwari, G.; Giles-corti, B.; Sun, X.; et al. Urban design, transport, and health 2 Land use, transport, and population health: Estimating the health benefi ts of compact cities. Lancet 2016, 388, 2925–2935. [Google Scholar] [CrossRef]
- Haaland, C.; van den Bosch, C.K. Challenges and strategies for urban green-space planning in cities undergoing densification: A review. Urban For. Urban Green. 2015, 14, 760–771. [Google Scholar] [CrossRef]
- Roebeling, P.; Saraiva, M.; Palla, A.; Gnecco, I.; Teotónio, C.; Fidelis, T.; Martins, F.; Alves, H.; Rocha, J. Assessing the socio-economic impacts of green/blue space, urban residential and road infrastructure projects in the Confluence (Lyon): A hedonic pricing simulation approach. J. Environ. Plan. Manag. 2017, 60, 482–499. [Google Scholar] [CrossRef]
- Augusto, B.; Roebeling, P.; Rafael, S.; Ferreira, J.; Ascenso, A.; Bodilis, C. Short and medium- to long-term impacts of nature-based solutions on urban heat. Sustain. Cities Soc. 2020, 57, 102122. [Google Scholar] [CrossRef]
- Lemonsu, A.; Viguié, V.; Daniel, M.; Masson, V. Urban Climate Vulnerability to heat waves: Impact of urban expansion scenarios on urban heat island and heat stress in Paris (France). Urban Clim. 2015, 14, 586–605. [Google Scholar] [CrossRef]
- Li, J.; Wang, X.; Wang, X.; Ma, W.; Zhang, H. Remote sensing evaluation of urban heat island and its spatial pattern of the Shanghai metropolitan area, China. Ecol. Complex. 2009, 6, 413–420. [Google Scholar] [CrossRef]
- Martins, H. Urban compaction or dispersion ? An air quality modelling study. Atmos. Environ. 2012, 54, 60–72. [Google Scholar] [CrossRef]
- Rafael, S.; Martins, H.; Marta-Almeida, M.; Sá, E.; Coelho, S.; Rocha, A.; Borrego, C.; Lopes, M. Quantification and mapping of urban fluxes under climate change: Application of WRF-SUEWS model to Greater Porto area (Portugal). Environ. Res. 2017, 155, 321–334. [Google Scholar] [CrossRef] [PubMed]
- Rafael, S.; Augusto, B.; Ascenso, A.; Borrego, C.; Miranda, A.I. Re-Naturing Cities: Evaluating the effects on future air quality in the city of Porto. Atmos. Environ. 2020, 222, 117123. [Google Scholar] [CrossRef]
- Roebeling, P.; Saraiva, M.; Gneco, I.; Palla, A.; Alves, H.; Rocha, J.; Martins, F. Sustainable Urbanizing Landscape Development (SULD) Decision Support Tool: Report on Other Aqua Cases. Aqua-Add Project, Aqua-Add Technical Report no.03. 2014, no. December, p. 33. Available online: http://aqua-add.eu/ (accessed on 30 March 2021).
- United Nations, “Transforming Our World: The 2030 Agenda for Sustainable Development,” 2015. Available online: https://sustainabledevelopment.un.org/post2015/transformingourworld/publication (accessed on 26 May 2022).
- van Eck, N.J.; Waltman, L. Software survey: VOSviewer, a computer program for bibliometric mapping. Scientometrics 2010, 84, 523–538. [Google Scholar] [CrossRef]
- Liao, H.; Tang, M.; Luo, L.; Li, C.; Chiclana, F.; Zeng, X.-J. A Bibliometric Analysis and Visualization of Medical Big Data Research. Sustainability 2018, 10, 166. [Google Scholar] [CrossRef]
- Sarkodie, S.A.; Strezov, V. A review on Environmental Kuznets Curve hypothesis using bibliometric and meta-analysis. Sci. Total Environ. 2019, 649, 128–145. [Google Scholar] [CrossRef] [PubMed]
- Nobanee, H.; Al Hamadi, F.Y.; Abdulaziz, F.A.; Abukarsh, L.S.; Alqahtani, A.F.; Alsubaey, S.K.; Alqahtani, S.M.; Almansoori, H.A. A bibliometric analysis of sustainability and risk management. Sustainability 2021, 13, 3277. [Google Scholar] [CrossRef]
- Li, H.; An, H.; Wang, Y.; Huang, J.; Gao, X. Evolutionary features of academic articles co-keyword network and keywords co-occurrence network: Based on two-mode affiliation network. Phys. A Stat. Mech. Its Appl. 2016, 450, 657–669. [Google Scholar] [CrossRef]
- Azizi, P.; Soltani, A.; Bagheri, F.; Sharifi, S.; Mikaeili, M. An Integrated Modelling Approach to Urban Growth and Land Use/Cover Change. Land 2022, 11, 1715. [Google Scholar] [CrossRef]
- European Commission. Proposal for a Directive of the European Parliament and of the Council on Ambient Air Quality and Cleaner Air for Europe; European Commission: Brussels, Belgium, 2022; Volume 5, pp. 248–253.
- Velasco, E.; Retama, A.; Zavala, M.; Guevara, M.; Rappenglück, B.; Molina, L.T. Intensive field campaigns as a means for improving scientific knowledge to address urban air pollution. Atmos. Environ. 2021, 246, 118094. [Google Scholar] [CrossRef]
- United Nations. COP26 The Glasgow Climate Pact. In Proceedings of the UN Climate Change Conference, Glasgow, Scotland, 31 October–12 November 2021. [Google Scholar]
- Zhao, D.; Wu, J. Contribution of urban surface expansion to regional warming in Beijing, China. J. Appl. Meteorol. Climatol. 2017, 56, 1551–1559. [Google Scholar] [CrossRef]
- Kamal, S.; Huang, H.P.; Myint, S.W. The influence of urbanization on the climate of the las vegas metropolitan area: A numerical study. J. Appl. Meteorol. Climatol. 2015, 54, 2157–2177. [Google Scholar] [CrossRef]
- Lo, J.C.F.; Lau, A.K.H.; Chen, F.; Fung, J.C.H.; Leung, K.K.M. Urban modification in a mesoscale model and the effects on the local circulation in the Pearl River Delta Region. J. Appl. Meteorol. Climatol. 2007, 46, 457–476. [Google Scholar] [CrossRef]
- Wang, X.; Liao, J.; Zhang, J.; Shen, C.; Chen, W.; Xia, B.; Wang, T. A numeric study of regional climate change induced by urban expansion in the Pearl River Delta, China. J. Appl. Meteorol. Climatol. 2014, 53, 346–362. [Google Scholar] [CrossRef]
- Feng, J.M.; Wang, Y.L.; Ma, Z.G.; Liu, Y.H. Simulating the regional impacts of urbanization and anthropogenic heat release on climate across China. J. Clim. 2012, 25, 7187–7203. [Google Scholar] [CrossRef]
- Adachi, S.A.; Kimura, F.; Kusaka, H.; Duda, M.G.; Yamagata, Y.; Seya, H.; Nakamichi, K.; Aoyagi, T. Moderation of summertime heat island phenomena via modification of the Urban form in the Tokyo metropolitan area. J. Appl. Meteorol. Climatol. 2014, 53, 1886–1900. [Google Scholar] [CrossRef]
- Oliveira, A.; Lopes, A.; Correia, E.; Niza, S.; Soares, A. An urban climate-based empirical model to predict present and future patterns of the Urban Thermal Signal. Sci. Total Environ. 2021, 790, 147710. [Google Scholar] [CrossRef] [PubMed]
- Berardi, U.; Jandaghian, Z.; Graham, J. Effects of greenery enhancements for the resilience to heat waves: A comparison of analysis performed through mesoscale (WRF) and microscale (Envi-met) modeling. Sci. Total Environ. 2020, 747, 141300. [Google Scholar] [CrossRef] [PubMed]
- Saranko, O.; Fortelius, C.; Jylhä, K.; Ruosteenoja, K.; Brattich, E.; Di Sabatino, S.; Nurmi, V. Impacts of town characteristics on the changing urban climate in Vantaa. Sci. Total Environ. 2020, 727, 138471. [Google Scholar] [CrossRef] [PubMed]
- Li, Z.; Zhou, Y.; Wan, B.; Chen, Q.; Huang, B.; Cui, Y.; Chung, H. The impact of urbanization on air stagnation: Shenzhen as case study. Sci. Total Environ. 2019, 664, 347–362. [Google Scholar] [CrossRef] [PubMed]
- Ren, W.; Geng, Y.; Xue, B.; Fujita, T.; Ma, Z.; Jiang, P. Pursuing co-benefits in China’s old industrial base: A case of Shenyang. Urban Clim. 2012, 1, 55–64. [Google Scholar] [CrossRef]
- Macintyre, H.L.; Heaviside, C. Potential benefits of cool roofs in reducing heat-related mortality during heatwaves in a European city. Environ. Int. 2019, 127, 430–441. [Google Scholar] [CrossRef]
- Liao, J.; Wang, T.; Wang, X.; Xie, M.; Jiang, Z.; Huang, X.; Zhu, J. Impacts of different urban canopy schemes in WRF/Chem on regional climate and air quality in Yangtze River Delta, China. Atmos. Res. 2014, 145–146, 226–243. [Google Scholar] [CrossRef]
- Cao, Q.; Yu, D.; Georgescu, M.; Wu, J.; Wang, W. Impacts of future urban expansion on summer climate and heat-related human health in eastern China. Environ. Int. 2018, 112, 134–146. [Google Scholar] [CrossRef]
- Bell, M.; Ellis, H. Sensitivity analysis of tropospheric ozone to modified biogenic emissions for the Mid-Atlantic region. Atmos. Environ. 2004, 38, 1879–1889. [Google Scholar] [CrossRef]
- Kueppers, L.M.; Snyder, M.A.; Sloan, L.C.; Cayan, D.; Jin, J.; Kanamaru, H.; Kanamitsu, M.; Miller, N.L.; Tyree, M.; Du, H.; et al. Seasonal temperature responses to land-use change in the western United States. Glob. Planet. Chang. 2008, 60, 250–264. [Google Scholar] [CrossRef]
- Civerolo, K.; Hogrefe, C.; Lynn, B.; Rosenthal, J.; Ku, J.Y.; Solecki, W.; Cox, J.; Small, C.; Rosenzweig, C.; Goldberg, R.; et al. Estimating the effects of increased urbanization on surface meteorology and ozone concentrations in the New York City metropolitan region. Atmos. Environ. 2007, 41, 1803–1818. [Google Scholar] [CrossRef]
- Pineda-Martinez, L.F.; Carbajal, N.; Campos-Ramos, A.A.; Noyola-Medrano, C.; Aragón-Piña, A. Numerical research of extreme wind-induced dust transport in a semi-arid human-impacted region of Mexico. Atmos. Environ. 2011, 45, 4652–4660. [Google Scholar] [CrossRef]
- Sá, E.; Martins, H.; Ferreira, J.; Marta-Almeida, M.; Rocha, A.; Carvalho, A.; Freitas, S.; Borrego, C. Climate change and pollutant emissions impacts on air quality in 2050 over Portugal. Atmos. Environ. 2016, 131, 209–224. [Google Scholar] [CrossRef]
- Liao, J.; Wang, T.; Jiang, Z.; Zhuang, B.; Xie, M.; Yin, C.; Wang, X.; Zhu, J.; Fu, Y.; Zhang, Y. WRF/Chem modeling of the impacts of urban expansion on regional climate and air pollutants in Yangtze River Delta, China. Atmos. Environ. 2015, 106, 204–214. [Google Scholar] [CrossRef]
- Huang, K.; Lee, X.; Stone, B.; Knievel, J.; Bell, M.L.; Seto, K.C. Persistent Increases in Nighttime Heat Stress From Urban Expansion Despite Heat Island Mitigation. J. Geophys. Res. Atmos. 2021, 126. [Google Scholar] [CrossRef]
- Chen, J.; Avise, J.; Lamb, B.; Salathé, E.; Mass, C.; Guenther, A.; Wiedinmyer, C.; Lamarque, J.F.; O’Neill, S.; McKenzie, D.; et al. The effects of global changes upon regional ozone pollution in the United States. Atmos. Chem. Phys. 2009, 9, 1125–1141. [Google Scholar] [CrossRef]
- Doan, V.Q.; Kusaka, H. Projections of urban climate in the 2050s in a fast-growing city in Southeast Asia: The greater Ho Chi Minh City metropolitan area, Vietnam. Int. J. Climatol. 2018, 38, 4155–4171. [Google Scholar] [CrossRef]
- Doan, V.Q.; Kusaka, H. Numerical study on regional climate change due to the rapid urbanization of greater Ho Chi Minh City’s metropolitan area over the past 20 years. Int. J. Climatol. 2016, 36, 3633–3650. [Google Scholar] [CrossRef]
- Theeuwes, N.E.; Solcerová, A.; Steeneveld, G.J. Modeling the influence of open water surfaces on the summertime temperature and thermal comfort in the city. J. Geophys. Res. Atmos. 2013, 118, 8881–8896. [Google Scholar] [CrossRef]
- Deng, J.; Xu, H. Nonlinear effect on the East Asian summer monsoon due to two coexisting anthropogenic forcing factors in eastern China: An AGCM study. Clim. Dyn. 2016, 46, 3767–3784. [Google Scholar] [CrossRef]
- Argüeso, D.; Evans, J.P.; Fita, L.; Bormann, K.J. Temperature response to future urbanization and climate change. Clim. Dyn. 2014, 42, 2183–2199. [Google Scholar] [CrossRef]
- Lian, L.; Li, B.; Chen, Y.; Chu, C.; Qin, Y. Quantifying the effects of LUCCs on local temperatures, precipitation, and wind using the WRF model. Environ. Monit. Assess. 2017, 189, 501. [Google Scholar] [CrossRef] [PubMed]
- Richter, M. Urban climate change-related effects on extreme heat events in Rostock, Germany. Urban Ecosyst. 2016, 19, 849–866. [Google Scholar] [CrossRef]
- Thomson, A.M.; Calvin, K.V.; Smith, S.J.; Kyle, G.P.; Volke, A.; Patel, P.; Delgado-Arias, S.; Bond-Lamberty, B.; Wise, M.A.; Clarke, L.E.; et al. RCP4.5: A pathway for stabilization of radiative forcing by 2100. Clim. Chang. 2011, 109, 77–94. [Google Scholar] [CrossRef]


| Domains | No. of Articles |
|---|---|
| Urban Climate | 635 |
| Air Quality | 562 |
| Urban Morphology | 239 |
| Sustainability | 219 |
| Health | 197 |
| Energy | 173 |
| Mobility | 128 |
| Water resources | 87 |
| General | 73 |
| Socioeconomic | 39 |
| Other | 12 |
| Population | 11 |
| Urban Metabolism | 9 |
| Keyword | Total Link Strength |
|---|---|
| Climate change | 389 |
| Air quality | 248 |
| Urban heat island | 159 |
| Temperature | 128 |
| Health | 117 |
| Climate | 104 |
| Urban area | 89 |
| Urban Climate | 67 |
| Adaptation | 50 |
| Thermal Comfort | 46 |
| Domains | Case Study | Models | Multicriteria Analysis (y/n) | Scenarization (y/n) | Reference | |||
|---|---|---|---|---|---|---|---|---|
| City, Country | Resolution | Urban Climate Change | Land Use Change | Emission Change | ||||
| Urban Climate, Urban Morphology | Beijing, China | 3.3 km | WRF | n | n | y | n | [31] |
| Urban Climate, Energy, Urban Morphology | Las Vegas, Nevada, USA | 3 km | WRF | y | n | y | n | [32] |
| Urban Climate, Urban Morphology | Pearl River Delta, China | 1.5 km | MM5 | y | n | y | n | [33] |
| Urban Climate, Urban Morphology | Pearl River Delta, China | 4 km | WRF | y | n | y | n | [34] |
| Urban Climate, Energy, Urban Morphology | Yangtze River Delta, China | 30 km | WRF | y | n | y | n | [35] |
| Urban Climate, Urban Morphology | Tokyo, Japan | 2 km | WRF | y | n | y | y | [36] |
| Urban Climate | Lisbon, Portugal | 100 m | LM/LMM | y | y | n | n | [37] |
| Urban Climate, Health, Sustainability | Toronto, Canada | 0.3 km | WRF/Envi-Met | y | n | n | n | [38] |
| Urban Climate, Urban Morphology | Vantaa, Finland | 500 m | HARMONIE/AROME/SURFEX | y | y | y | n | [39] |
| Air Quality, Urban Climate, Energy, Urban Morphology | Shenzhen, China | 1 km | WRF | y | n | y | n | [40] |
| Air Quality, Urban Morphology | Shenyang, China | - | STIRPAT | y | n | y | y | [41] |
| Urban Climate, Health, Sustainability, Urban Morphology | West Midlands, UK | 1 km | WRF | y | n | y | n | [42] |
| Urban Climate, Air Quality | Yangtze River Delta, China | 9 km | WRF-Chem | n | n | n | n | [43] |
| Urban Climate, Energy, Urban Morphology | China | 20 km | WRF | y | n | y | n | [44] |
| Air Quality, Mobility | Mid-Atlantic | 12 km | MM5 | y | n | n | y | [45] |
| Urban Climate, Urban Morphology | Western USA | 25 km | RSM/RegCM3/MM5-CLM3/DRCM | y | n | y | n | [46] |
| Air Quality, Urban Morphology | New York, USA | 4 km | MM5 | y | y | y | n | [47] |
| Air Quality, Urban Morphology | Zacatecas, Mexico | 12 km | MCCM | n | n | y | n | [48] |
| Air Quality | Porto, Portugal | 9 km | WRF-CAMx | y | y | n | y | [49] |
| Urban Climate, Air Quality, Urban Morphology | Yangtze River Delta, China | 9 km | WRF-Chem | y | n | y | n | [50] |
| Urban Climate, Air Quality, Sustainability, Urban Morphology | Porto, Portugal | 1 km | WRF-CHIMERE | y | y | y | n | [19] |
| Urban Climate, Urban Morphology | Paris, France | 1 km | NEDUM-2D | y | n | y | n | [20] |
| Urban Climate, Sustainability, Urban Morphology | China, India, Nigeria | 25 km | WRF | y | y | y | n | [51] |
| Urban Climate, Air Quality, Urban Morphology | USA | 36 km | PCM/MOZART-2/MM5/CMAQ | y | y | y | y | [52] |
| Urban Climate, Urban Morphology | Ho Chin Minh, Vietnam | 1 km | WRF | y | y | y | n | [53] |
| Urban Climate, Energy, Urban Morphology | Ho Chin Minh, Vietnam | 1 km | WRF | y | y | y | n | [54] |
| Urban Climate, Water, Urban Morphology | Fictional European City | 1 km | WRF | y | n | y | n | [55] |
| Urban Climate, Urban Morphology | China | 22 km | CAM5.1/CLM4 | y | y | y | y | [56] |
| Urban Climate, Urban Morphology | Sydney, Australia | 10 km | WRF | y | y | y | n | [57] |
| Urban Climate, Urban Morphology | Shandong, China | 3 km | WRF | y | n | y | n | [58] |
| Urban Climate, Urban Morphology | Rostock, Germany | 10 km | REMO/WETTREG | y | y | y | n | [59] |
| Energy, Urban Morphology | Eindhoven, Netherlands | 1 km | WRF-SUEWS | y | n | y | n | [14] |
Disclaimer/Publisher’s Note: The statements, opinions and data contained in all publications are solely those of the individual author(s) and contributor(s) and not of MDPI and/or the editor(s). MDPI and/or the editor(s) disclaim responsibility for any injury to people or property resulting from any ideas, methods, instructions or products referred to in the content. |
© 2023 by the authors. Licensee MDPI, Basel, Switzerland. This article is an open access article distributed under the terms and conditions of the Creative Commons Attribution (CC BY) license (https://creativecommons.org/licenses/by/4.0/).
Share and Cite
Augusto, B.; Rafael, S.; Coelho, M.C.; Ferreira, J. Connecting the Dots between Urban Morphology and the Air Quality of Cities under a Changing Climate: A Bibliometric Analysis. Sustainability 2024, 16, 18. https://doi.org/10.3390/su16010018
Augusto B, Rafael S, Coelho MC, Ferreira J. Connecting the Dots between Urban Morphology and the Air Quality of Cities under a Changing Climate: A Bibliometric Analysis. Sustainability. 2024; 16(1):18. https://doi.org/10.3390/su16010018
Chicago/Turabian StyleAugusto, Bruno, Sandra Rafael, Margarida C. Coelho, and Joana Ferreira. 2024. "Connecting the Dots between Urban Morphology and the Air Quality of Cities under a Changing Climate: A Bibliometric Analysis" Sustainability 16, no. 1: 18. https://doi.org/10.3390/su16010018
APA StyleAugusto, B., Rafael, S., Coelho, M. C., & Ferreira, J. (2024). Connecting the Dots between Urban Morphology and the Air Quality of Cities under a Changing Climate: A Bibliometric Analysis. Sustainability, 16(1), 18. https://doi.org/10.3390/su16010018