Article

Modeling Techno-Economic Wood Procurement from Renewable Forests for the Sustainable Energy Supply of a CHP Plant

Faculty of Science and Forestry, University of Eastern Finland, P.O. Box 111, FI-80101 Joensuu, Finland
Sustainability 2024, 16(1), 170; https://doi.org/10.3390/su16010170
Submission received: 19 November 2023 / Revised: 18 December 2023 / Accepted: 21 December 2023 / Published: 23 December 2023

Abstract

:
The importance of the national security of supply has been emphasized in recent years due to the COVID-19 pandemic and changes in operating environments. Thanks to autonomy and resiliency in fuel procurement, organizations with decentralized energy plants may be able to quickly adapt to the changing needs of society. The main aim of this study was to increase the sustainability of these CHP plants’ wood procurement by modeling it and determining the company’s profitable wood procurement region while keeping the forests renewable. The environmental sustainability of wood procurement was assessed by considering the additional costs caused through the EEAP mechanism if the carbon sink of the forest worsened due to wood procurement in the area. The supply chains were compared so that the CHP plant managers could adopt the best energy wood value chains. The results showed that updating the procurement strategy would be necessary. The CHP plant managers should purchase energy wood from a larger procurement area than the current one and focus on roadside purchases of wood. The Techno-Economic Wood Payment Ability Model was a useful part of the DSS in guiding wood buyers toward sustainable wood procurement by increasing the share of renewable forests.

1. Introduction

The Security of Energy Supply

When society faces a crisis like the COVID-19 pandemic and the resulting security of supply risks, the autonomy and resilience of the organizations responsible for the logistics value chains of energy plants help decision makers to organize energy supply and fuel procurement in line with the availability of critical resources. In addition, thanks to self-sufficiency in fuel procurement, energy plants can adapt to the needs of a changing society via their operating environments. This study examines these positive resiliency changes in Industry 4.0 in the post-pandemic period.
Compared to same size of countries, a relatively large amount of energy is needed in Finland [1,2], which increases the challenge of recovering from the pandemic. The reasons for this include the country’s northern location in a cool climate zone, the large transportation distances due to the sparse population, the raw-material-intensive industries, and the high household consumption associated with a high standard of living. Much energy is needed for heating and cooling buildings, transport fuel and industrial power, and household electricity. A considerable part of the fuels used in Finland’s energy processing is imported from abroad [1,2]. For example, fossil fuels cannot be obtained in the country, so they are imported via ships or pipelines, which are vulnerable to sabotage from foreign powers.
Along with the pandemic, climate change and the resulting green transition affect the important functions of society’s energy sector in an unpredictable way (Figure 1). This complicates preparing for crises that need new planning tools. From the perspective of the national security of supply, the key issues related to climate change are the energy crisis, the effects of extreme weather events on the operational reliability of infrastructure, and climate risks for forestry. The Finnish Commerce Committee pays particular attention to the energy crisis caused via the green transition, which affects the security of energy supply [3]. In addition, climate change increases the probability of risks related to sustainable forestry, which are reflected globally as effects that cross national borders [4,5,6]. In this regard, the forest industry and the related energy supply are identified as critical industries [3,7,8].
Sufficient energy supply requires the functionality of critical logistics infrastructure [9,10,11]. Examples of critical infrastructures are combined heat and power (CHP) plants, heat distribution networks, as well as road and rail networks, among others (Figure 2). Securing the related digital transmission and distribution systems as well as transport and storage systems is also important [12]. A significant part of the infrastructure is managed via the integrated material and energy industry (IMEI). Therefore, the Commerce Committee considers it essential that, in a changing operating environment, the infrastructure means are further strengthened through the cooperation of authorities, research institutes, and companies of the CHP and IMEI [3]. During the development of such a management model, the capabilities of regional actors, such as municipalities, should also be considered and utilized [13].
Managing the green transition is a challenging task [15,16,17]. In order to manage the security of the Finnish energy supply, the green transition requires competently utilizing different energy fuels. On the other hand, the green transition helps to break away from Russia’s dependence on imports and, thus, improves the security of supply in the energy sector [1,18]. With the green transition, CHP plants of Finland have the opportunity to become energy self-sufficient. At the same time, the use of domestic wood fuels also creates employment. Overall, the maintenance and development of methods, techniques, and technology that support and utilize the green transition are important in terms of crisis preparedness, like for the COVID-19 pandemic [19,20].
According to the Finance Committee of Finland, investments in the processing, use, and storage of emission-free energy should be made, and innovations that produce new and cost-effective energy solutions should be encouraged [21]. Investments in new cost-effective technologies would strengthen Finland’s competitiveness and, thus, the security of the green energy supply. However, the Finance Committee refers to the Audit Committee’s statement (TrVL 4/2022 vp − VNS 8/2022 vp), stating that reducing the use of fossil fuels as part of the green transition has significant, direct, and negative state financial effects, as energy taxes and the security of supply fees are currently charged mostly from fossil fuels [22]. However, in the green energy transition, the most cost-effective technologies should be identified and invested in as soon as possible [23].

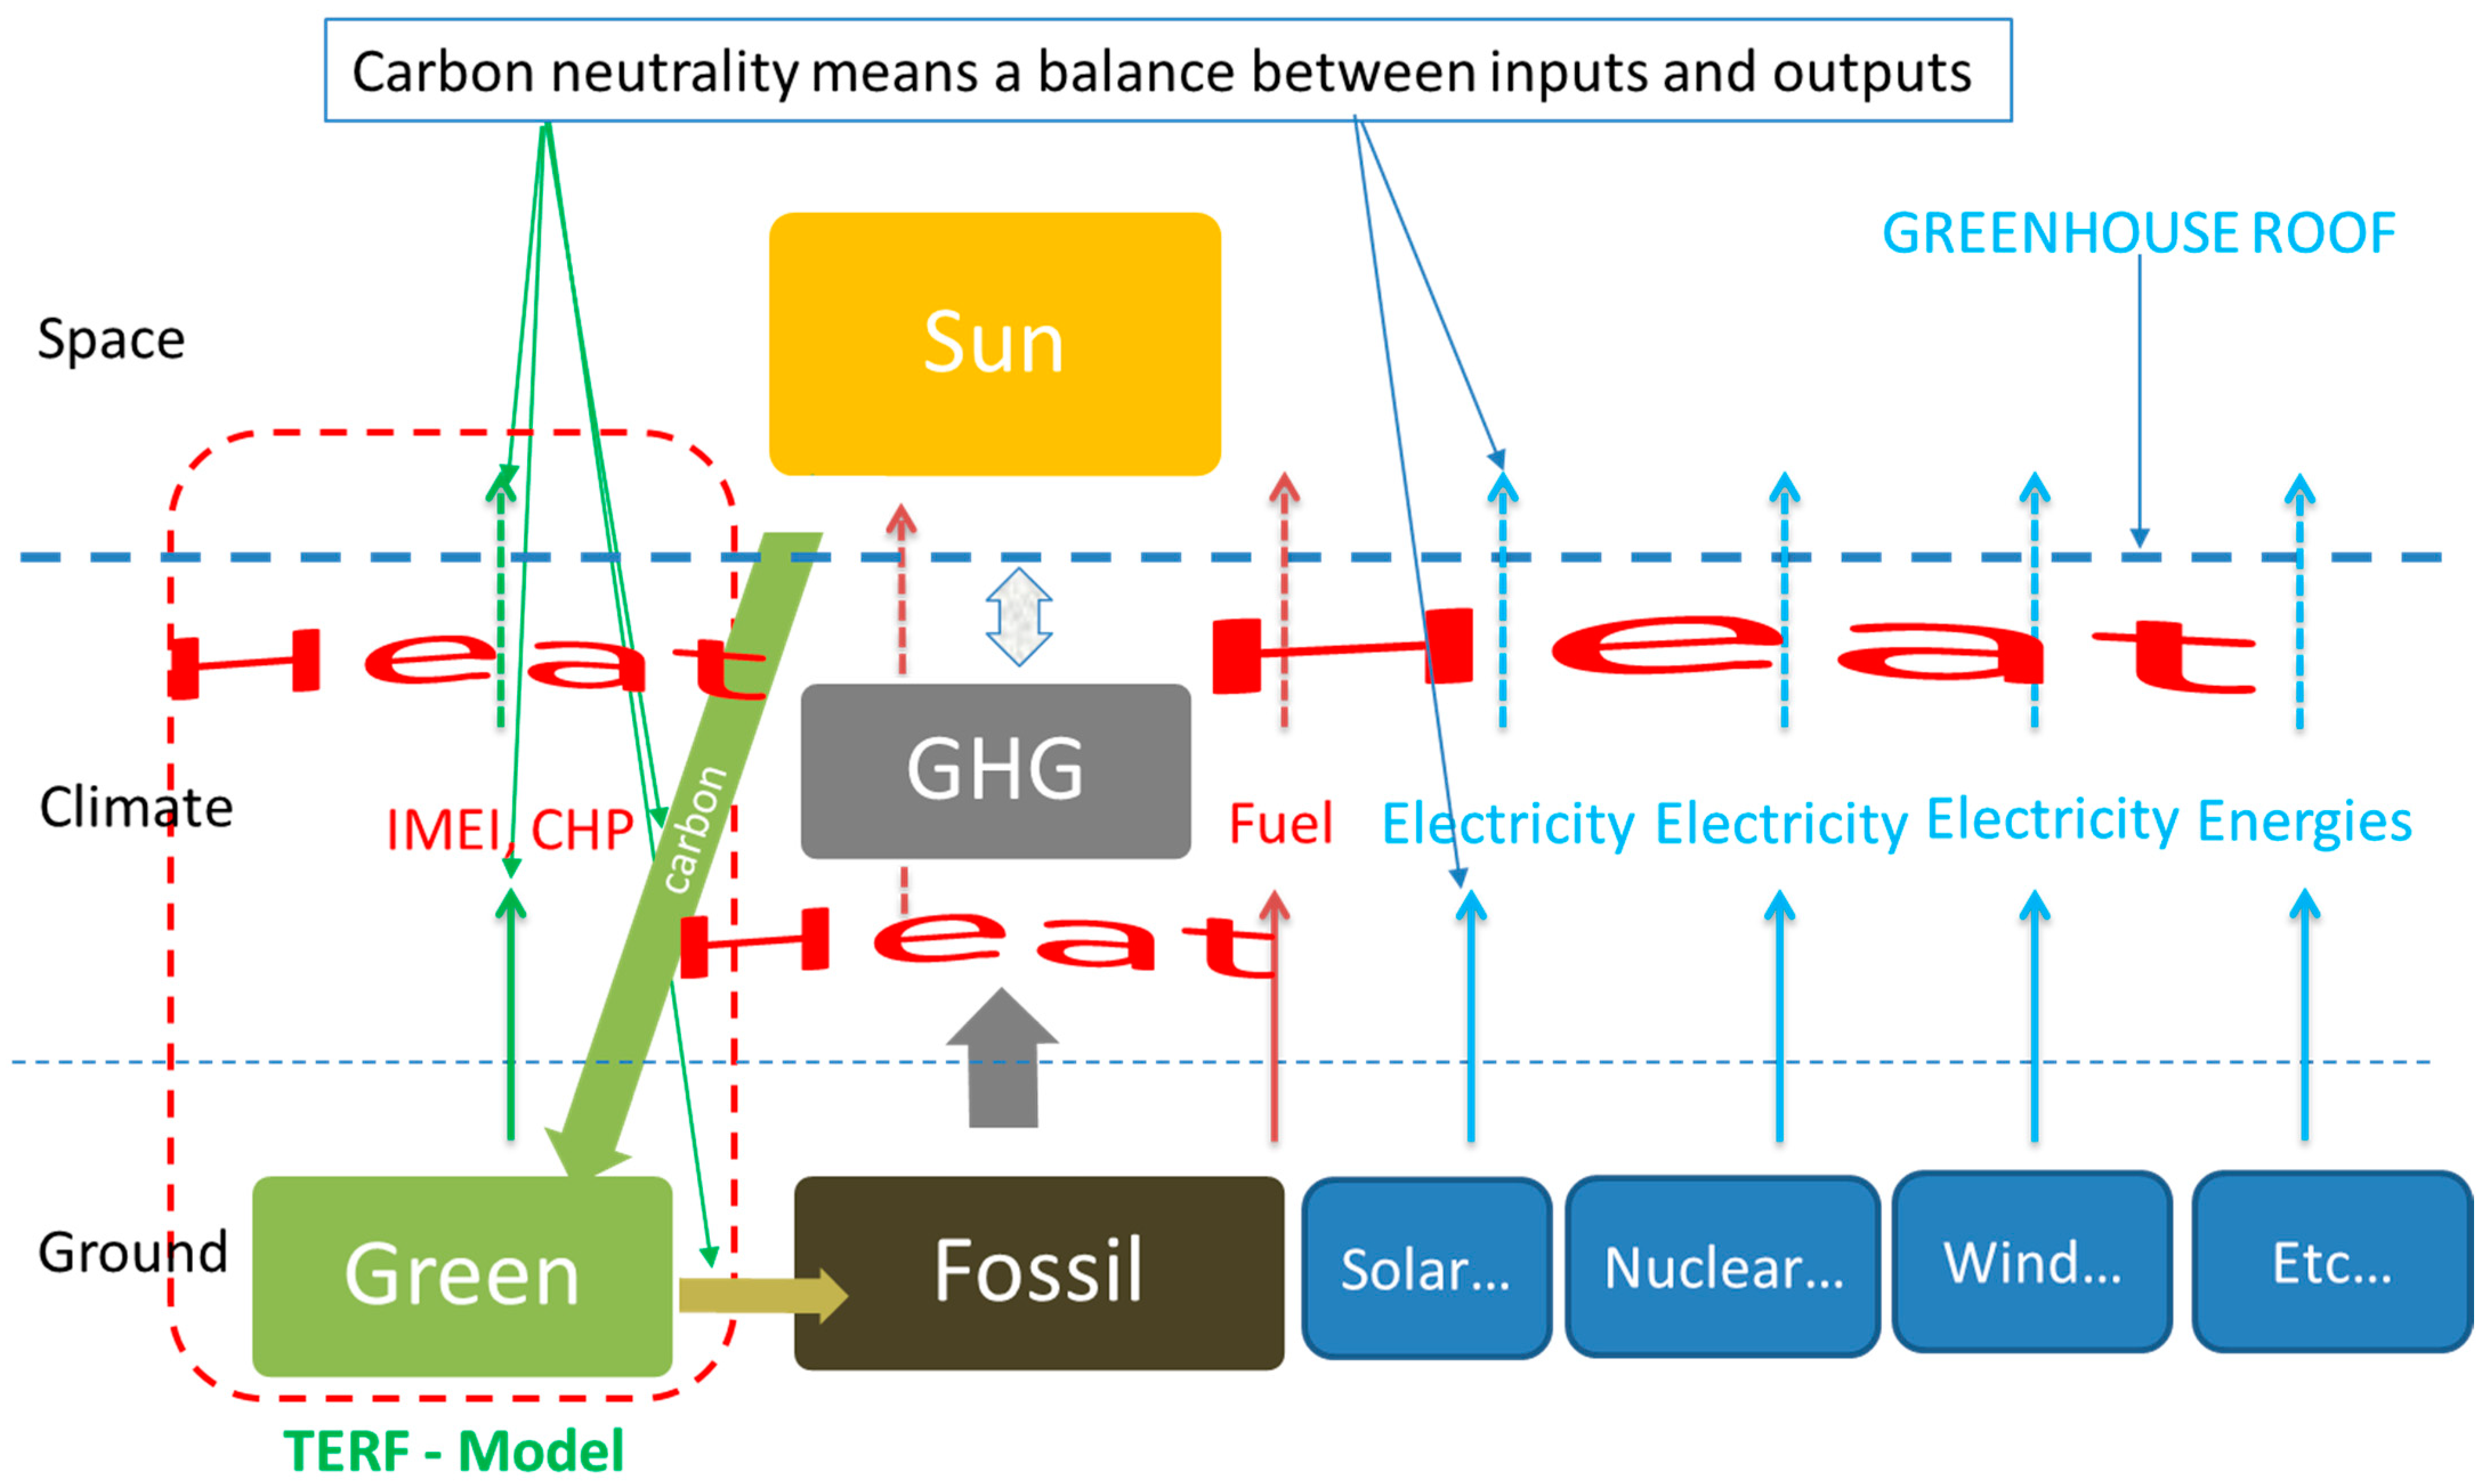
2. Sustainable Energy Supply in the Green Transition

The green transition must center around sustainable energy conversion and, therefore, utilize fuels more efficiently than at present [23,24]. In Finland, the COVID-19 pandemic showed that global fuel supply chains used by the industry are not as balanced as assumed [25]. Moreover, geopolitical conflicts and cyber-attacks simultaneously made access to fossil fuels difficult. Therefore, there is a need for wood fuel procurement processes that are more stable, resilient, and autonomous than the previous ones [26,27].
From the perspective of the sustainable energy conversion of CHP plants, the right strategic fuel procurement decisions are important in the long term. Renewable energy sources include biomass, wind, water, and the sun. In Finland, the most important renewable fuel is wood (Figure 2) [27]. Peat is also renewable, albeit very slowly. Recently, the total volume of secure stocks has been increased by starting a backup storage of energy peat, which, at the same time, expands fuel selection [28]. Special attention has been paid to securing the energy supply of district heating networks. In this regard, the Finance Committee refers to its report, TaVM 33/2022 vp, according to which the goal of the peat reserve is to secure the functionality of heat supply in times of crisis and to manage the transition to a carbon-neutral society, which is a part of the green energy transition [28].
The automation of Finland’s whole energy system has been developed toward a de-centralized infrastructure (Figure 3). In a centralized system, one energy plant operates, while in a decentralized system, instead, a network of many CHP plants operates, which have their own energy wood procurement areas [29,30]. The decentralized system diversifies the use of energy fuels, processing both heat and electricity in numerous small units that form an energy network. At the same time, the utilization of bio, wind, and solar energy can be increased, and rural employment can be provided. Decentralization also introduces flexibility to the energy system, i.e., electricity can be transferred in two directions in the network. In this way, fluctuations in consumption and processing can be smoothed out. The goal is the so-called intelligent network or smart grid [30].
The wood procurement modeling of CHP plants must be based on the law of the conservation of energy (the first law of thermodynamics), which states that the amount of energy is constant, so energy can neither be created nor destroyed (Figure 1). In other words, energy must be changed from one form to another by using balance in dynamics, i.e., refining or converting it (Figure 2) [14,31]. This is how new strategic energy supply chains and their logistics value chains can be formed for the future of the energy transition toward green wood fuels, which can be anticipated with the help of strategic planning models and systems that produce the right information. If planning models are accurate enough, autonomous wood procurement organizations can react to balanced changes in the processing of sustainable energy. In the strategic work of this research, first, a realistic annual plan is made for the procurement of renewable wood fuel while determining the most profitable wood supply chains (WSCs) for practical operations. In addition, a clear operational roadmap is made, which prepares operational wood procurement organizations for the green transition of a sustainable energy supply.
It seems that the elements of sustainable wood procurement in the energy transition of CHP plants must be integrated into the planning systems of the logistics value chain network when wood procurement is digitized and automated (Figure 2). It can also be assumed that the automation of wood procurement sub-processes will increase the capacity of WSCs and, at the same time, make them more cost-effective and resilient [32,33]. Indeed, the operative work of sub-processes has been rapidly mechanized in recent decades, but the related planning and management work only started to be automated in the 2010s with digitalization [33]. Entrepreneurs still select work sites and plan transportation while looking at a computer screen. This type of manual wood procurement management is slow and prone to errors that could be avoided with automation. The automatic planning and control of wood fuel purchases would also increase the resilience of energy conversion organizations.

3. Logistics Value Chains of CHP Plants

The successful supply chain management of logistics is a way to achieve an operational Energy Management System and Environmental System in the IMEI [34,35,36], which is also important for ensuring national energy supply security via CHP plants, for increasing economic competitiveness, as well as for mitigating greenhouse gases. The sustainable development of logistics is in a contradictory situation after the crisis caused by the COVID-19 pandemic. During the pandemic, the state of the environment improved considerably in many places. However, due to its damaging economic effects, such as recessions or reductions in consumer consumption, it is possible that normal logistics emissions are quickly reached and even exceeded, compensating for welfare losses. Still, the operation of logistics is necessary to secure critical operations in many sectors for a successful national climate and energy strategy [37]. Therefore, the Finance Committee states, like the Transport and Communications Committee, that transports must operate throughout the country and emphasizes the importance of being prepared for the energy and fuel supply in all circumstances [38].
In the broad picture, logistics value chains cover, for example, road and rail transport as well as the related material, money, and information flows [39,40,41,42]. During the last decades, the logistics value chains of wood fuels in Finnish companies near the eastern border have become internationalized. Such value chains are often very complex and difficult to trace and automate and, thus, are partly prone to disruptions that are difficult to prepare for or quickly correct. Therefore, the national energy sector has tried to diversify the value chains that are important to operations in the country to avoid dependence on only one foreign supplier of material. In this way, the goal is to increase delivery reliability and even automate deliveries of key wood fuels of HCT plants. In addition to material flow, the Finance Committee draws attention to the fact that the operation of the logistics and transport sector is largely dependent on the operation of private companies [38]. Therefore, the operation must be profitable and competitive so that the operating conditions of these companies are preserved, even during unforeseen changes in the operating environment, such as increases in the price of car fuels or changes in the price of refined energy. Most companies in the wood transport of the forest industry are SMEs [43,44,45]; thus, identifying subcontracting and supply chain entities in the industry and understanding the operating principles are important to maintaining the profitability of CHP plants.
Logistically, it makes sense to refine electricity and, especially, district heating as close as possible to end users. It is particularly energy-efficient to refine electricity and district heating together. The electricity of HCT plants is generated in the thermal power plant’s generators, and the power needed for rotation is obtained via turbines, driven using the pressure of hot steam. The generated heat can be used, for example, as a district heating network [46]. Unnecessary transfers of fossil fuels consume energy, so such thermal power plants should be in the immediate vicinity of import ports [47]. However, in Finland’s distributed energy system (Figure 3), most CHP plants use energy wood as fuel (Figure 2). This study focuses on the development of the logistics value chains of these energy facilities. Recently, electricity pricing has changed in markets that provide cheap electricity at night, e.g., for hydrogen and energy storage technologies [48]. However, this topic is omitted from modeling in this study.
Relevant data collected from the logistics value network of supply chains would enable the automated planning of fuel supply chains that support the wood procurement management of CHP plants [49]. In addition to economic aspects, it must support the social aspects of sustainability [50,51]. Currently, the selection of forest sites and the planning of transportation are repetitive manual tasks. However, the automation of using an Industry 5.0 makes the operation both socially sustainable and even more attractive in the minds of potential employees [52,53]. Automated planning allows employees to focus on autonomous operational development, as the content of work changes from time-consuming, manual, and repetitive tasks to more creative tasks [52,54]. Efficient automated wood procurement planning would also increase ecological sustainability [52,55], as it reduces the environmental footprint of energy processing for the entire value chain. For example, the environmental burden of energy refining can be minimized through a more precise control of emissions from the transport of energy wood [56]. In a broader picture, the autonomous procurement of energy wood through resilient outsourced organizations enables the processing of more environmentally friendly green fuel alternatives than ever before [33,54]. In this context, the term resilience is commonly used, especially in the context of the effects of the COVID-19 pandemic for economies, societies, and industries.
At the heart of future energy wood procurement are cloud-based logistics systems using artificial intelligence, which help companies automate wood harvesting and transport, optimize routes and fleet capacity, determine when and where to take breaks, plan loads, etc. [57,58]. Future systems can already be tested with information modeling, optimization, and simulation [59]. Recently, an internal pricing mechanism using the payment ability of the integrated material and energy industry (IMEI) to pay for WSC costs was introduced for the analysis of logistics value chains [60], which can be used in techno-economic analysis from renewable forests (TERF model). Each automating step toward a more resilient and faster supply of energy wood makes energy utility customers more satisfied. They also help companies involved in the operation develop better sustainability profiles. In this regard, data analytic technologies integrated into data modeling help to include the necessary datasets of energy wood supply chains for the analysis of the entire logistics value chain network (Figure 4). For example, the payment ability parameters may be determined for the environmental cost to retain renewable forests at a local level. Then, a payment ability model may be developed and automated for the optimization of procurement amounts (m3), locations, costs, and profitability (EUR) for decentralized CHP plants.
Forest industry and its management systems have been developed towards sustainable wood procurement [61,62]. In addition to IMEI, managers of decentralized CHP companies also need DSS for wood procurement. Instead of millions of cubic meters, their annual procurement amounts are usually under 100,000 cubic meters. In terms of the sustainable development of energy wood procurement, decentralized energy processing is an innovative solution for the green transition. The goal is to break away from fossil energy sources and start utilizing the sun’s inexhaustible energy (Figure 1). In less than an hour, the sun radiates as much energy to the earth as humanity uses in a year. However, procuring and storing energy wood for its timely use is a major logistics, technical, and economic challenge (Figure 2) [49]. Therefore, a distributed energy system that enables the management of the green energy transition is an important solution for societies located far from densely populated cities [34]. However, during the green transition, the procurement of energy wood increases, and procurement areas partially overlap, causing competition and, possibly, local excessive felling, endangering the annual growth of renewable forests and sustainable carbon sinks in these areas. This increases the amount of information needed in planning systems. Therefore, it is important to automate the procurement of renewable fuel by using the TERF Model to choose the best sustainable logistics value chains for energy processing. Modeling is a critical step in developing understanding that leads to improved supply chain efficiency [63]. Further, testing is necessary. Therefore, the developed TERF Model is tested by using a case study. The objectives of this study are as follows:
(i)
Evaluate the payment ability under alternative WSCs using the general TERF Model;
(ii)
Identify the most sustainable and profitable WSCs near CHP plants;
(iii)
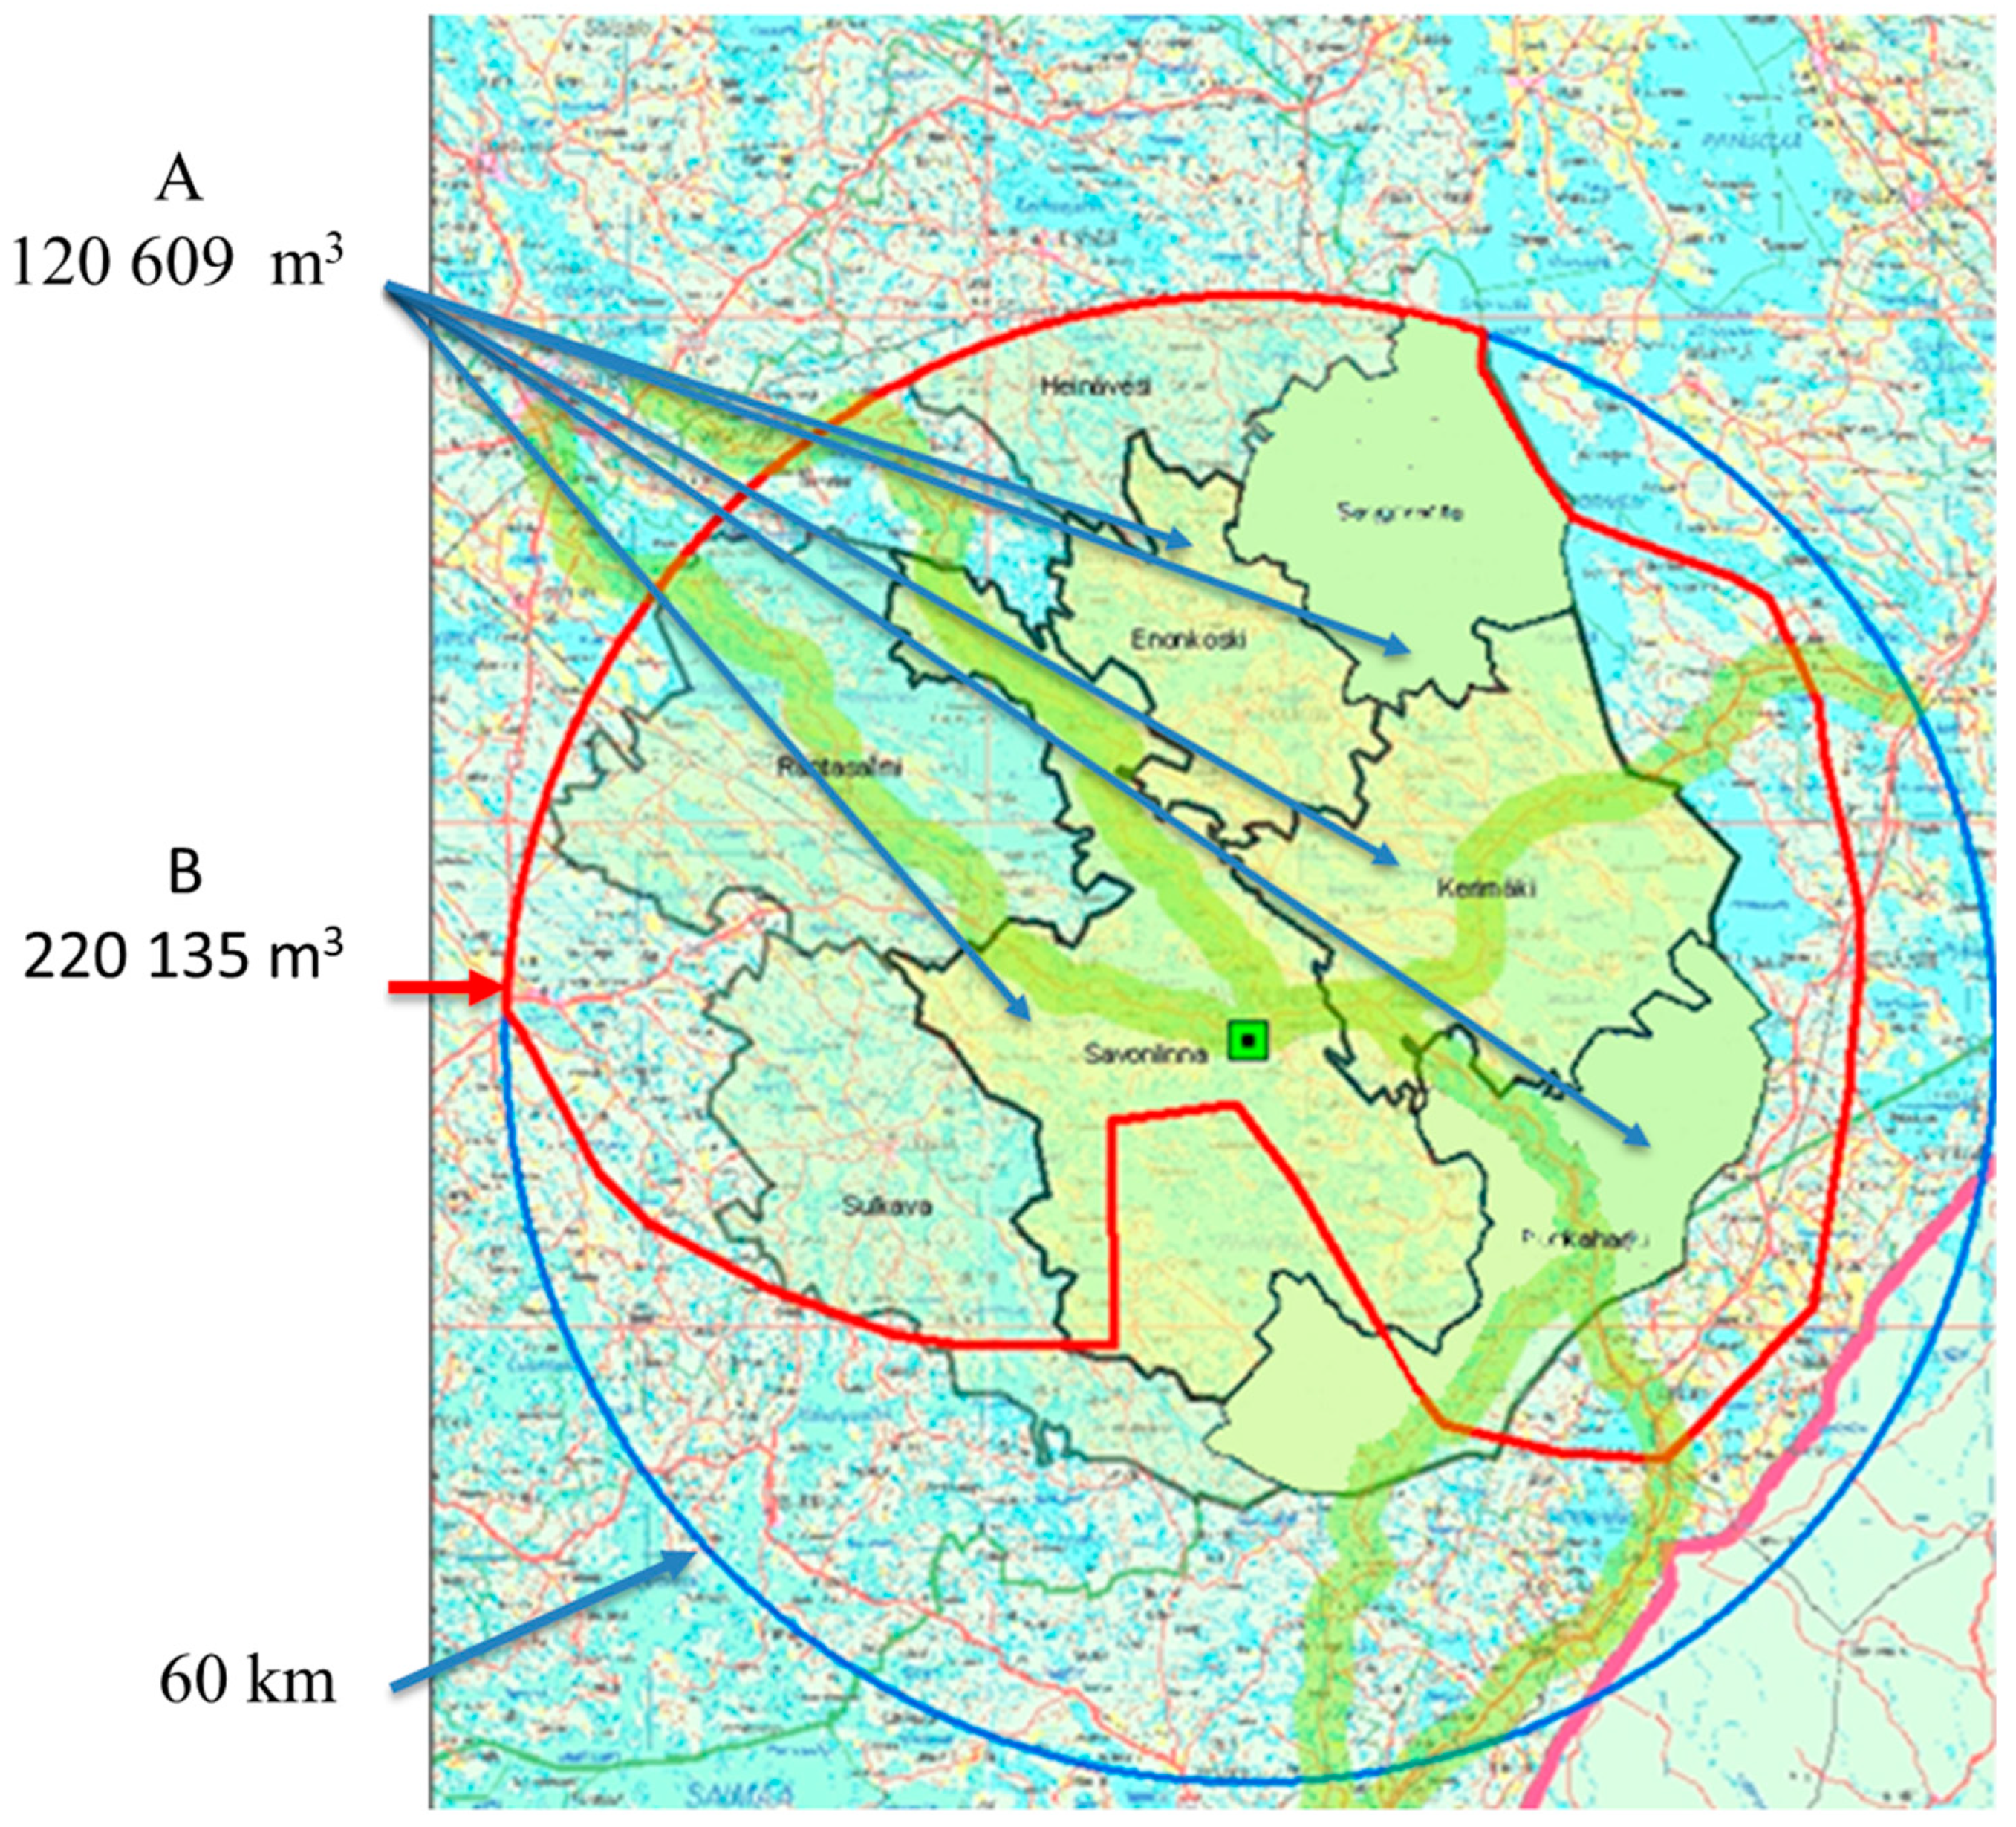
Anticipate an environmentally sustainable region to increase the wood procurement amount from 60,000 m3 to 100,000 m3.

4. Material and Methods

The research material was collected from Eastern Finland, which is located near the Russian border. In this area, the competition between plants of the IMEI that use wood as raw material has increased since the importation of wood from Russia stopped. Even during the pandemic, the share of imported wood was 10–15% of all wood used [2]. Savonlinna is a typical small city with a well-functioning CHP plant and district heating network. The plant also supports electricity supply for several sparsely populated municipalities (Figure 5). In order to ensure the security of energy supply in the area, the procurement of wood fuel must be increased in the municipalities surrounding Savonlinna, taking into account the sustainability of wood procurement. The plant organization’s strategy also aims at autonomous operation and increasing the resiliency of operations. Logistics faces specific challenges in the operating environment, as waterways may prevent direct wood transport from the forest to the CHP plant.
In Finland, inventorying of the country’s forests has been recorded for a long time, from which sufficiently accurate predictions can be obtained for the wood procurement planning of both the wood-processing industry and wood-burning plants. In addition to quantities, predictions are also made for the annual growth of forests [64]. The Natural Research institute of Finland publishes these open statistics based on the municipality and wood assortment (Table 1) [64]. For this study, two forest inventory materials were collected from the municipalities surrounding Savonlinna. Table 1 presents the growth of forests as a percentage of the amount of industrial wood. Table 2 presents the area’s energy wood potential for energy conversion plants. In this study, it is assumed that the growth in Table 1 can be used to calculate annual sustainable wood procurement amounts as well as the wood assortment amounts in Table 2.
Maintaining the carbon sink of a sustainable forest requires, in addition to wood harvesting quantities, knowledge of forest growth, which increases data and calculations in the planning system. Excessive regional wood harvesting can be avoided if the amount of wood procurement is lower than the amount of growth. In this study, calculations are made for municipalities and a period of one year by using the forest growth of Table 1. Table 3 describes the potential energy wood quantities of the reference procurement region, and Table 4 describes the energy wood quantities of the experimental wood procurement region. These amounts are available for all energy plants in the area. In order to choose the best sustainable logistics value chains for energy refining, the municipal market shares of the organization’s wood procurement are also needed for the calculation.

5. Wood Supply Chains

By using the WSC options, CHP plants receive wood fuel to generate energy. Wood fuel is delivered from the forest to the plant in various ways, according to a trade agreement made by the forest owner and the wood buyer. Accordingly, buyers from the CHP plant purchase several wood fuel assortments from forest owners, with the most common ones shown in Figure 6.
Different types of energy wood from wood fuels can be identified and named for the planning and management of WSCs. According to selected technologies, suitable energy wood assortments are used within the limits of the possibilities of the wood procurement operating environment. The following energy wood assortments are used in this study:
P1: The stumpage trade is used to buy energy wood suitable for whole-tree harvesting. The chipping takes place at the roadside.
P2: The stumpage trade is used to buy thinnings, from which small-energy trunks are harvested and chipped at the roadside.
P3: The stumpage trade is used to buy thinnings, from which the energy trunks are harvested, transported to the terminal, and chipped at an appropriate time with efficient equipment.
P4: Whole wood is bought at the roadside, where chipping also takes place.
P5: Energy trunks are bought at the roadside, where chipping also takes place.
P6: Energy trunks are bought at the roadside, transported to the terminal, and chipped at an appropriate time with efficient equipment.
P7: Energy trunks are purchased for factory delivery, transported to the terminal, and chipped at an appropriate time with efficient equipment.

6. The General Payment Ability Model of the IMEI

Alongside the implementation of standards for environmental and energy management, the fostering of renewable energy sources on energy use in the IMEI has happened by using the European Emissions Trading Scheme [65,66]. For renewable forests, the carbon neutrality of wood procurement technology simply means that the relative calculation difference between the largest sustainable and realized wood harvesting amounts (m3/m3) is more than one. In addition to the carbon neutrality of technology, the TERF Model should be used to optimize the profitability of wood procurement by considering all cost and revenue elements (EUR/m3) of WSCs. This can be achieved through payment ability models for pricing mechanisms [60], facilitating profitability management in wood procurement for the IMEI (Model 1).
PEUR/MWh = EEUR/MWh − GHG emission costs − wood supply costs
where PEUR/MWh represents the ability to pay for wood at the given costs and the price of sold energy, EEUR/MWh represents the market value of the energy content of the sold wood energy in euros, GHG emission costs represent the EU’s emission allowance price (EEAP) in euros [62], and wood supply costs represent the costs of wood harvesting and transport operations in euros.

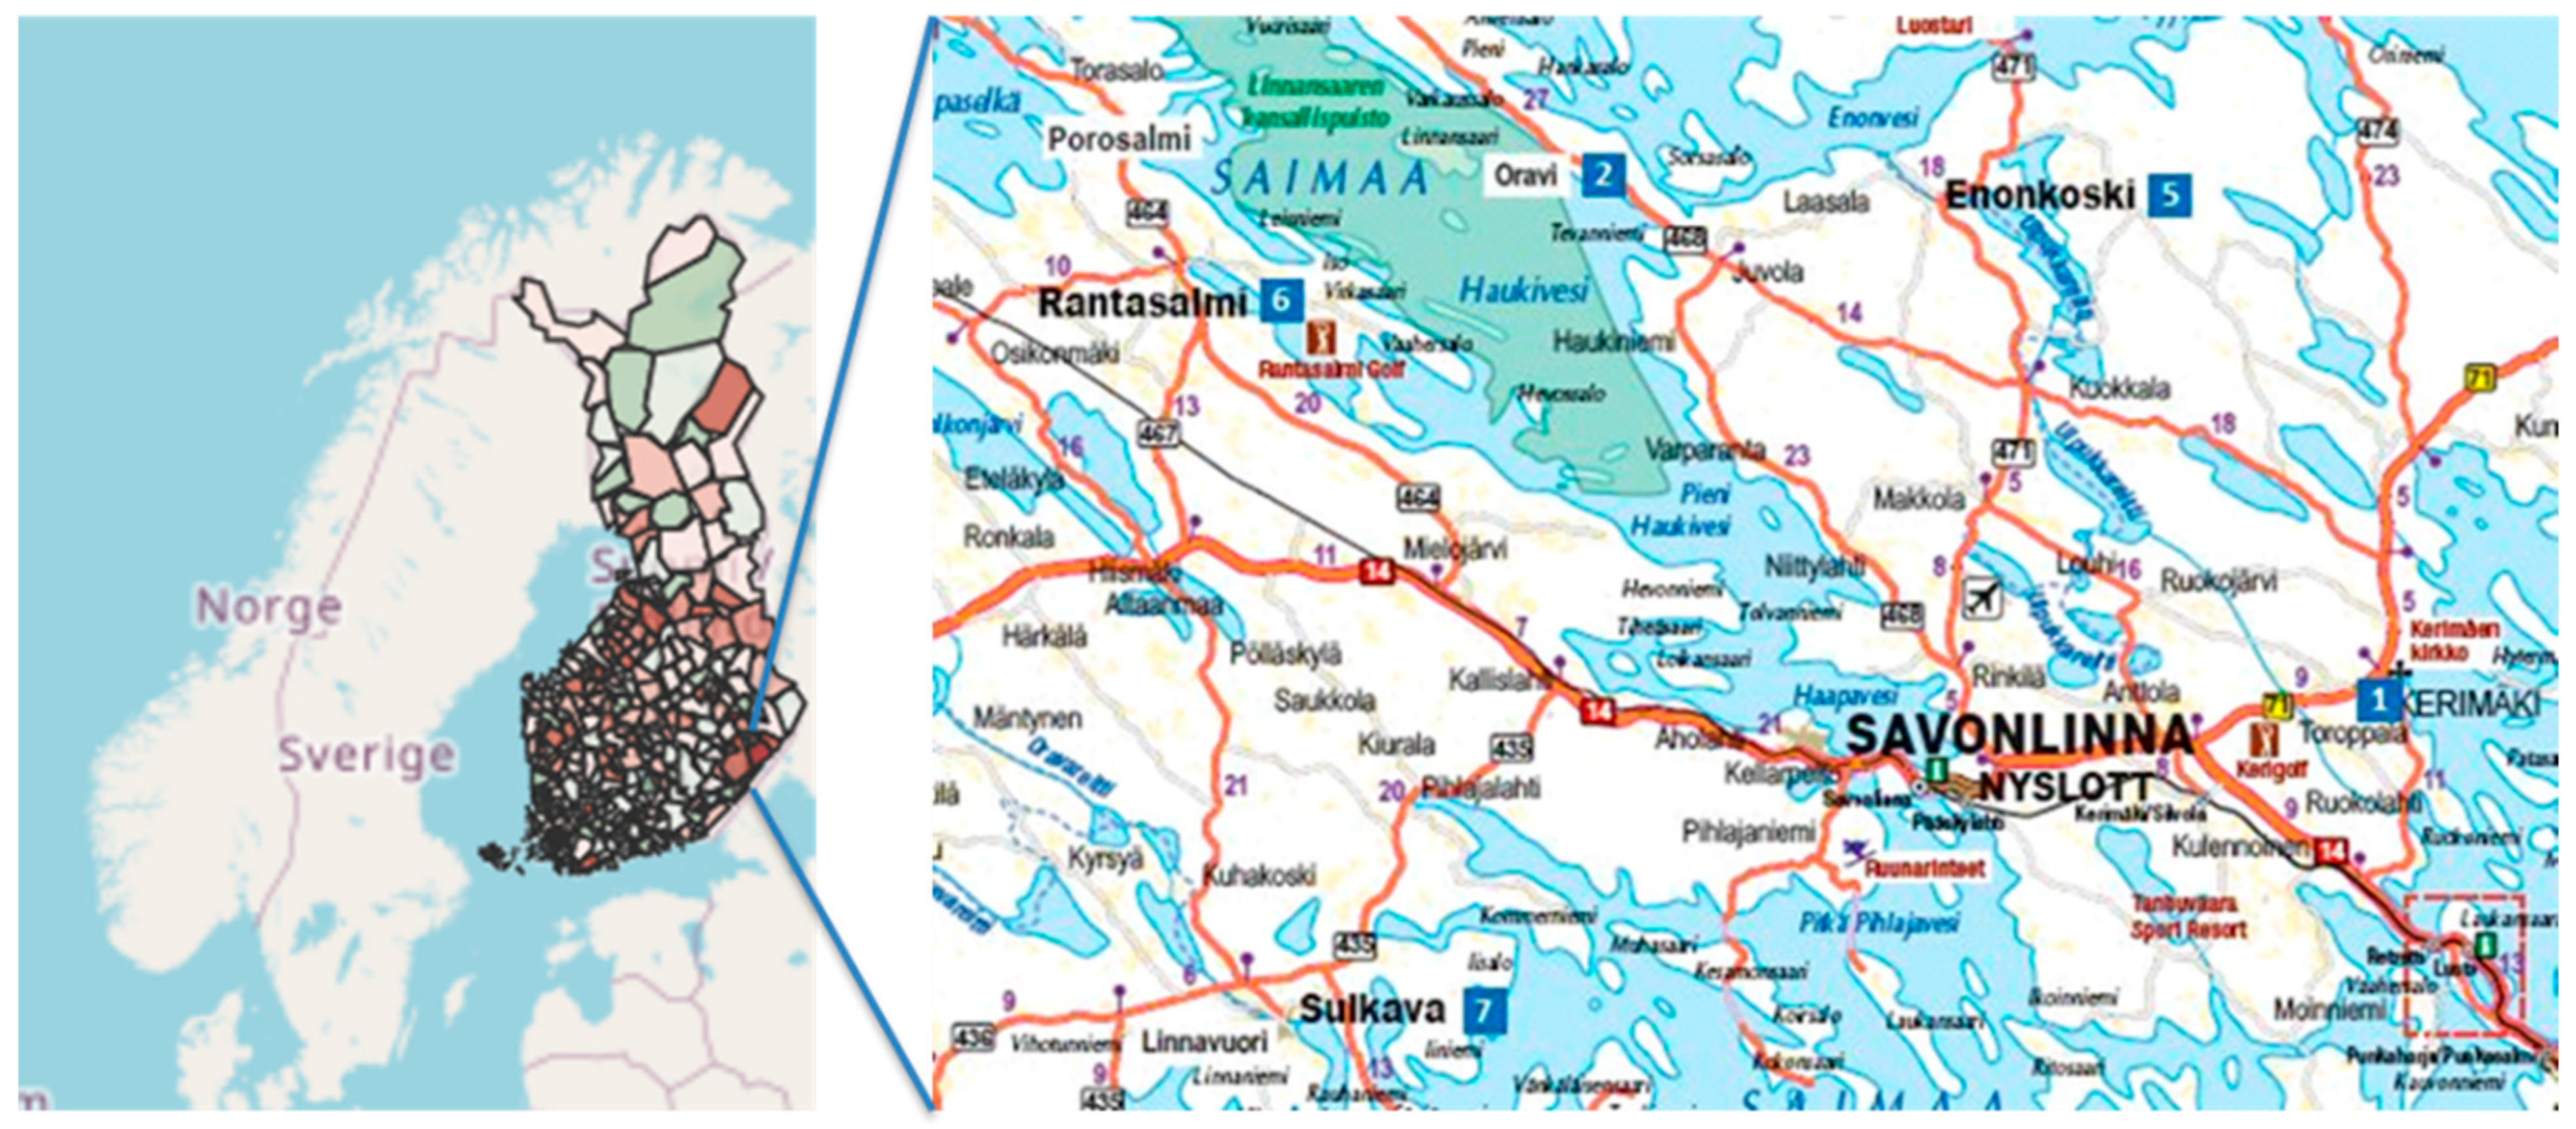
7. The Application of a General Model for the Savonlinna CHP Plant

The wood procurement needs of industrial plants as well as the operating environments are different. Consequently, a general wood payment ability model for CHP plants must be specified separately. Model 2 describes such a model, which applies to the collected material. It takes into account the cost factors of wood procurement and the revenue factors of energy conversion (EUR/m3). The calculation can be performed in Excel, which has the module for the procurement of energy wood with GHG emission costs (EEAP), which is updated by monitoring renewable wood stocks in forests based on the energy wood stock data of municipalities (Table 3 and Table 4) [64].
P = S × E × R − (GHG emission costs + (S × (C1 + C2)) + C3 + C4 + C5 + C6 + C7)
The model parameters are as follows:
P
Payment ability to buy a solid cubic meter of wood, EUR/m3;
S
The ratio of the solid cubic meter to chip cubic meter, m3/c-m3;
E
The energy content of wood chips, MWh/c-m3;
R
The price of the energy content of wood fuel, EUR/MWh;
C1
The costs of transporting or transferring the wood chips, EUR/c-m3;
C2
The chipping cost of wood, EUR/c-m3;
C3
The terminal cost of a solid cubic meter of wood, EUR/m3;
C4
The long-distance transport cost of round wood, EUR/m3;
C5
The cost of wood harvesting from the stump to the roadside, EUR/m3;
C6
The common costs of wood procurement, EUR/m3;
C7
Interest on tied-up capital: euros per solid cubic meter, EUR/m3;
GHG
emission costs are the EU’s emission allowance price (EEAP), EUR/t CO2 eq.

8. Calculation Mechanism Using the Payment Ability Model of the CHP Plant

The procurement data were collected from the ERP system by the wood procurement organization of the CHP plant. The research data contained the amount of energy wood from all WSCs of the CHP plant, which were harvested and transported via entrepreneurs from 1 January to 31 December 2018. In addition, the cost and revenue data of the WSCs were collected from the ERP system. Furthermore, three EEAPs were selected for sensitivity analysis, namely, 70, 85, and 100 EUR/t CO2 eq. The EEAP is often used for investigating the relationship between the prices of fossil fuel and carbon emissions in the European Union Emissions Trading System [67,68]. Carbon emissions trading and pricing mechanisms have also been developed in China’s fossil energy markets [69,70,71]. Instead of fossil fuels, this mechanism uses the mechanism with renewable wood fuels. The mechanism updated old cost values during the calculation process, which used forestry machinery and truck cost indices for operation costs [72]. If cost information was absent, annual averaged wood procurement information and costs were used according to [73]. If revenue data of the WSCs were absent, annual average revenues were used according to [74].
The TERF Model can be used to automate wood procurement planning and calculate the payment ability for alternative WSCs [60]. It was developed during the COVID-19 pandemic to automate wood procurement for the IMEI. In this study, a payment ability model was developed specifically for CHP plants to analyze the sustainability of logistics value chains for energy refining. In addition to environmentally sustainable WSCs, it can be used both to select economically profitable WSCs around the CHP plant and determine wood procurement regions to increase procurement amounts.

9. Results

The results indicate the payment ability of WSCs to determine sustainable wood procurement regions if the procurement amount is increased from 60,000 m3 to 100,000 m3. The TERF Model automatically selects the three most profitable energy wood assortments. Then, managers can choose a suitable strategy for a CHP’s energy wood logistics. This is performed by analyzing the effects of the forest carbon sink (renewable wood share) and EEAP (70, 85, and 100 EUR/t CO2 eq.) on selecting the most environmentally sustainable logistics value chains for energy refining.
The market share of renewable wood was 39.8%, and the transport distance varied from 20 to 40 km during the wood procurement reference year (Table 5). Further, the payment ability solutions of wood procurement area A for 60,000 m3 showed that the renewable wood share (forest carbon sink) would retain over 100% if the market share was over 49.8%. If the market share value was lower, EEAPs affected the CHP’s payment ability to buy energy wood assortments in the wood procurement area. When comparing the strategies of wood procurement, it is useful to compare planning alternatives of the energy wood assortment P5, as it is mainly used in energy conversion, and all operations of the WSC are in the hands of the procurement organization of the CHP plant. Under the current wood procurement conditions, the payment ability of P5 was 27 EUR/m−3. It was calculated with a renewable wood share of 80% when the EEAP was 70 EUR/t CO2 eq.
The managers of the CHP plant considered expanding the procurement area into the territory of several municipalities. This measure was supposed to increase the amount of renewable wood used and, at the same time, reduce emission costs. The payment ability solutions of wood procurement area B for 60,000 m3 show that the renewable wood share was over 100% for all wood procurement alternatives (Table 6). The market share of renewable wood was 27.3%, and the transport distance varied from 30 to 50 km. EEAPs did not affect CHP’s payment ability to buy energy wood assortments for a wood procurement amount of 60,000 m3. When comparing the wood procurement conditions (transport distance, 40 km), the payment ability of P5 would be 37 EUR/m−3.
In addition to expanding the procurement area, the CHP plant’s managers also considered increasing the procurement volume from 60,000 m3 to 100,000 m3. This strategy was supposed to replace fossil fuels and secure the area’s national energy wood supply. At the same time, the impact of the increase in the amount of used non-renewable wood on emission costs was also investigated. Notably, the available stock of energy wood in forests was 120,609 m3 (Figure 7). First, the effect of the increase in the procurement quantity in procurement area A was investigated by comparing the results (Table 5 and Table 7). In this foresight analysis, the wood procurement conditions and the market share of renewable wood remained the same without affecting the ability to pay for wood. Here, the payment ability solutions for 100,000 m3 show that the renewable wood share was between 48 and 60%. It never reached 100% in any strategic alternatives of wood procurement. Further, the EEAPs decreased the payment ability of CHP conversion to buy energy wood assortments. For a wood procurement amount of 100,000 m3, the payment ability of P5 was 10 EUR/m−3. This was calculated for a renewable wood share of 48% when the EEAP was 70 EUR/t CO2 eq.
Table 8 shows the results of the simultaneous effects of both a larger procurement quantity and a larger procurement area on the ability to pay for energy wood, the operating environment, and the transport distance. The payment ability solutions of wood procurement area B for 100,000 m3 show that the renewable wood share was over 100% if the market share was 45.4%. If the market share of renewable wood was 40.9%, the renewable wood share was 90%. Further, the transport distance was 40 km. Notably, the available stock of energy wood was 220,135 m3 (Figure 7). This operating environment can be used to compare the strategy with the results presented in Table 5, Table 6 and Table 7, as it is close to the reference in Table 5, which describes the current operating environment. Although the EEAPs affected the payment ability of CHP conversion to buy energy wood assortments for a procurement amount of 100,000 m3, the payment ability of P5 was 32 EUR/m−3.

10. Discussion

The main aim of this study was to develop and test the general TERF Model of the IMEI to anticipate wood procurement for a more stable and secure energy wood supply of a decentralized CHP plant. This is important because the Finnish government has emphasized the national security of supply in recent years due to changes in operating environments. During the COVID-19 pandemic, the forest industry started to automate wood procurement planning and operations to quickly adapt to the changing needs of society. Recently, climate issues have also challenged the operating environment of organizations. Therefore, to automatize planning in CHP plants, organizations have developed an internal pricing mechanism in DSS [14]. This planning model anticipates the ability to pay for energy wood assortments, for which the income from the sale of energy and the costs incurred from the purchase of wood are required as collected input data (Model 2). As input data, the EEAP is also an important cost factor. After formulating the model, seven WSCs between whole wood (trunks, branches, and tops) and trunk wood were automatically compared. The developed mechanism selected the three most profitable alternatives for manual consideration in this study. However, the number of WSCs may be changed under the different operating environments of CHP plants. In this case, the mechanism operated successfully with three alternatives, allowing the CHP plant managers to choose the most profitable WSC. Given the current market share (39.8%) and strategy (Table 5), the energy trunk assortment (a payment ability of 27 EUR/m−3) was chosen, which is purchased from the roadside, where chipping also occurs.
This study also aimed to decide on a long-term strategy for determining the CHP plant’s wood procurement region while keeping the forest renewable. Table 6 shows how increases in the size of the area and the amount of renewable wood (from 120,609 m3 to 220,135 m3) preserve renewable forests and reduce emission costs, thus increasing the payment ability. However, the use of wood as a source of energy should be environmentally sustainable, even if wood procurement is increased from 60,000 m3 to 100,000 m3. Figure 7 shows how yellow area A was too small for a wood procurement amount of 100,000 m3, while red area B was large enough to secure profitable wood procurement and preserve renewable forests. When considering the available amount of wood fuel based on the regional forest data of municipalities, it can be stated that an increase in the procurement amount was impossible to implement using the current procurement strategy (Table 5 and Table 7), as the total annual procurement amount exceeds the annual forest growth (>20%). Under these circumstances, forests would be non-renewable. In addition, environmentally sustainable wood procurement from a small area with a 10% increase in market share would also increase competition among buyers due to the limited wood supply, thereby increasing prices. It seems that by using the novel mechanism as a DSS, the CHP plant managers can pivot strategies toward more sustainable wood procurement logistics.
Table 8 presents strategy options for future operating environments, one of which is discussed with respect to the current operating environments. Three factors of the organization’s operating environment were compared: the renewable wood share (80%), market share (39.8%), and transport distance (40 km). Autonomous organizations may affect these factors by changing their long-term strategies. In this study, it was assumed that the market share was as stable as possible without increasing competition between wood procurement organizations. This assumption provides constant cost effects and allows for calculating the share of renewable wood and the transport distance by utilizing the forest stock data of municipalities as the initial data of the mechanism. An important sustainability aim was to increase the renewable wood share, which was 90% in the new plausible strategy, indicating this goal was successfully reached (Table 8). This is the first step toward 100% renewable forests, which can be reached later with adjustments to the green strategy (Figure 1). Consequently, EEAPs may have a significant effect on the payment ability of organizations (EUR 5) when purchasing energy wood from renewable forests (Table 8). This is an important issue that will need additional cost analysis in the future. So far, a wood procurement strategy of a renewable forest carbon sink with the EEAP has not been optimized in the IMEI.
The mechanism used the EEAP of model 2 if the carbon sink of the forest worsened due to wood procurement in the area. The calculation was made in Excel, which has a novel so-called forest carbon sink module and is updated by monitoring renewable wood stocks in forests based on regional forest growth data [64]. Given the cost structure used in this study and the renewable forest carbon sinks, it is evident that updating the wood procurement strategy would be necessary. The Techno-Economic Wood Payment Ability Model with the EEAP parameter developed in this study proved to be a useful part of the DSS when guiding wood buyers toward environmentally sustainable wood procurement. So far, these data-driven parts of the TERF Model and the formulation of the optimization model have been automatized; however, the automatization of the DSS tool is ongoing, and its technical aspects and usefulness for managers will be analyzed and reported in a future study.
In the energy refining of the IMEI, a large share of energy wood fuel has been harvested as residual whole wood. It is harvested after industrial wood, which is a practically impossible harvesting method for this single CHP plant. Due to the factors affecting forest carbon sinks, even in the larger wood procurement area, the focus should, at least initially, be mainly on roadside purchases, provided the price ratios for energy sales do not change significantly. In other words, if sellers deliver wood to the roadside, the purchase of both whole wood and trunk wood would be possible at used prices. However, it can be suggested that with the current procurement strategy, it is possible to profitably buy whole wood through the thinning method from forests located near the energy production plant when the buyer conducts wood harvesting in the forest and transports it to the plant. However, wood procurement is unprofitable at harvesting sites where only small trees are felled and large trees are left to grow.
Recent simulation studies have justified that threatening efficiency and resilience losses beyond the roundwood valuation prevailing in practice can be avoided due to the simulation model support of lead time and quality-driven strategies [75]. This valuation process is missing from the optimization models of the DSS [14,60,66]. By combining a simulation, payment ability model and cost minimization optimization [59], simulation applications would benefit from a developed payment ability model. On the other hand, simulations can produce information about the quality value, while the payment ability model could be updated by using the quality value and a developed data-driven approach [75]. After these automatic preprocesses, the cost minimization model could be formulated and solved. This simulation-optimization process would require the development of a quality cost parameter for the use of a payment ability model, which would be a new step for more comprehensive wood procurement management systems. To conclude, mathematical programming has been shown to be most useful for large-scale multiple-objective strategic and tactical management problems, while simulations, sometimes combined with optimization techniques, have been useful for solving smaller operational management problems [39,59,61,76].
There are three flow levels of material, finance, and information in the WSCs with different logistical management problems. These levels refer to upstream, midstream, and downstream [59,61]. This study dealt with the upstream (Figure 2), which has different modelling targets (energy fuels) than, for example, the midstream of WSCs. However, the model structure developed in this study could in principle also be applied to the midstream’s process management. Although the most common use of residual woody biomass is for the energy production in Sweden, Finland, and the EU [76,77], it is also worth considering that the major trend fostered by the EU is the cascading utilization of wood waste materials [78]. The recent European Forest Strategy has been promoting the sustainable use of residues like black liquor of midstream for material uses while postponing the energy conversation [79,80]. The innovative mechanism could compare both alternatives by using EEAP in a developed model of the midstream of WSC. Further, in this kind of modeling production, costs in IMEIs could be increased if the CO2 balance worsened due to energy production.
In this study, data analytic technologies integrated modeling and datasets of energy wood supply chains for the analysis of the entire logistics cost value chain network (Figure 4). In addition to economic aspects, modern sustainable DSS must support the social, ecological, and environmental aspects of sustainability [50,51,52]. If the automation used Industry 5.0 for preparing DSS (cloud-based logistics systems), the automated planning would allow employees to focus on autonomous operational development, as the content of work changes from time-consuming, manual, and repetitive tasks to more creative tasks. In addition, this modeling approach reduces the environmental footprint of energy processing for the entire value chain and helps companies develop better sustainability profiles. In a broader picture, the autonomous procurement of energy wood through resilient outsourced organizations enables the processing of more environmentally friendly green fuel alternatives in crises like the COVID-19 pandemic for economies, societies, and industries.

11. Conclusions

In this study, an internal pricing mechanism was developed for CHP plants. It successfully applied the IMEI’s general TERF Model to manage the carbon sink of renewable forests at the local level around a CHP plant. In addition, the developed model proved to be a useful part of the mechanism. It can be used to guide wood buyers toward more sustainable wood procurement.
In this mechanism, data analytics produced the payment ability parameters that can also be used in optimization models based on CHP data. By updating fuel procurement data, the carbon sink of the forest in the CHP plant’s wood procurement region could be preserved through profit maximization subjected to the EAAP. The results showed that with the current market share the CHP, plant managers should purchase wood from a larger procurement area because it increased the share of renewable forests by 10%. Due to the factors that affect the forest carbon sink, even in the larger procurement area, the focus should, at least initially, be mainly on roadside purchases of energy wood, provided the price ratios for energy sales do not change significantly.
The proposed mechanism can be used to improve wood procurement strategies for autonomous and resilient organizations of decentralized CHP plants. These strategies can secure renewable forests as carbon sinks and local preparedness for the security of the energy supply during crises like the COVID-19 pandemic. With respect to national preparedness, these strategies improve market-based logistics services and functioning infrastructure, which makes preparedness for crises possible through cooperation between the business world, research institutes, and authorities.

Funding

This research was funded by University of Eastern Finland.

Institutional Review Board Statement

Not applicable.

Informed Consent Statement

Not applicable.

Data Availability Statement

The data presented in this study are available on request from the corresponding author. The data are not publicly available due to business issues.

Conflicts of Interest

The author declares no conflict of interest.

Acronyms

CHPCombined Heat and Power
ERPEnterprise Resource Planning
DSSDecision Support System
EEAPEuropean Emission Allowance Price
IMEIIntegrated Material and Energy Industry
GHGGreenhouse Gas
TERFTechno-Economic model of Renewable Forests
SMESmall- and Medium-sized Enterprise
WSCWood Supply Chain
EUREuro
ICPMInternal Carbon Pricing Mechanism

References

  1. Statistics of Finland. The Share of Energy Imported from Russia is 18% of the Total Energy Consumption in 2022—Statistics Finland. 2023. Available online: https://www.stat.fi/julkaisu/clhomy00rtq7g0buvlkdxhfig (accessed on 13 April 2023).
  2. Statistics of Finland. Share of Energy Imported from Russia 34 per Cent of Total Energy Consumption in 2021—Statistics Finland. 2021. Available online: https://www.stat.fi/en/publication/cl1xmekvw1pp80buvn1cznxmy (accessed on 13 April 2023).
  3. Ministry of Economic Affairs and Employment of Finland. Energy Investments of Finland’s Sustainable Growth Program Promote the Green Transition. 2023. Available online: https://tem.fi/en/-/energy-investments-of-finland-s-sustainable-growth-programme-promote-the-green-transition (accessed on 13 April 2023).
  4. Keenan, R.J. Climate change impacts and adaptation in forest management: A review. Ann. For. Sci. 2015, 72, 145–167. [Google Scholar] [CrossRef]
  5. Ince, P.J.; Kramp, A.D.; Skog, K.E.; Yoo, D.I.; Sample, V.A. Modeling future U.S. forest sector market and trade impacts of expansion in wood energy consumption. J. For. Econ. 2011, 17, 142–156. [Google Scholar] [CrossRef]
  6. Kissinger, G.; Herold, M.; De Sy, V. Drivers of Deforestation and Forest Degradation: A Synthesis Report for REDD+ Policymakers. Vancouver: Lexeme Consulting. 2012. Available online: https://www.forestcarbonpartnership.org/sites/fcp/files/DriversOfDeforestation.pdf_N_S.pdf (accessed on 13 December 2023).
  7. Lipiäinen, S.; Sermyagina, E.; Kuparinen, K.; Vakkilainen, E. Future of forest industry in carbon-neutral reality: Finnish and Swedish visions. Energy Rep. 2022, 8, 2588–2600. [Google Scholar] [CrossRef]
  8. Iordan, C.M.; Hu, X.; Arvesen, A.; Kauppi, P.; Cherubini, F. Contribution of forest wood products to negative emissions: Historical comparative analysis from 1960 to 2015 in Norway, Sweden and Finland. Carbon Balance Manag. 2018, 13, 12. [Google Scholar] [CrossRef] [PubMed]
  9. Rehak, D.; Slivkova, S.; Janeckova, H.; Stuberova, D.; Hromada, M. Strengthening Resilience in the Energy Critical Infrastructure: Methodological Overview. Energies 2022, 15, 5276. [Google Scholar] [CrossRef]
  10. Nan, C.; Sansavini, G.A. Quantitative Method for Assessing Resilience of Interdependent Infrastructures. Reliab. Eng. Syst. Saf. 2017, 157, 35–53. [Google Scholar] [CrossRef]
  11. Rehak, D.; Senovsky, P.; Hromada, M.; Lovecek, T. Complex approach to assessing resilience of critical infrastructure elements. Int. J. Crit. Infrastruct. Prot. 2019, 25, 125–138. [Google Scholar] [CrossRef]
  12. Jasiūnas, J.; Lund, P.D.; Mikkola, J. Energy system resilience—A review. Renew. Sustain. Energy Rev. 2021, 150, 111476. [Google Scholar] [CrossRef]
  13. Ministry Economic Affairs and Employment. Carbon Neutral Finland 2035—National Climate and Energy Strategy. 2022. Available online: https://urn.fi/URN:ISBN:978-952-327-843-1 (accessed on 18 December 2023).
  14. Palander, T.; Takkinen, J. The Optimum Wood Procurement Scenario and Its Dynamic Management for Integrated Energy and Material Production in Carbon-Neutral Forest Industry. Energies 2021, 14, 4404. [Google Scholar] [CrossRef]
  15. European Commission. Reform Support, Green Transition. Available online: https://reform-support.ec.europa.eu/what-we-do/green-transition_en (accessed on 18 December 2023).
  16. Kabeyi, M.J.B.; Olanrewaju, O.A. Sustainable Energy Transition for Renewable and Low Carbon Grid Electricity Generation and Supply. Front. Energy Res. 2022, 9, 743114. [Google Scholar] [CrossRef]
  17. Ministry of the Environment of Finland. What Is the Green Transition? 2023. Available online: https://ym.fi/en/what-is-the-green-transition (accessed on 13 April 2023).
  18. National Emergency Supply Agency. Energy Supply. 2023. Available online: https://www.huoltovarmuuskeskus.fi/toimialat/energiahuolto/ (accessed on 12 April 2019).
  19. Dogan, E.; Chishti, M.Z.; Alavijeh, N.K.; Tzeremes, P. The roles of technology and Kyoto Protocol in energy transition towards COP26 targets: Evidence from the novel GMM-PVAR approach for G-7 countries. Technol. Forecast. Soc. Chang. 2022, 181, 121756. [Google Scholar] [CrossRef]
  20. Yogesh, K.; Dwivedi, L.H.; Kar, A.K.; Baabdullah, A.M.; Grover, P.; Abbas, R.; Andreini, D.; Abumoghli, I.; Barlette, Y.; Bunker, D. Climate change and COP26: Are digital technologies and information management part of the problem or the solution? An editorial reflection and call to action. Int. J. Inf. Manag. 2022, 63, 102456. [Google Scholar] [CrossRef]
  21. Ministry of Finance of Finland. Green Transition—Recovery and Resilience Plan. 2023. Available online: https://vm.fi/en/finlands-recovery-and-resilience-plan (accessed on 13 April 2023).
  22. TrVL 4/2022 vp—VNS 8/2022 vp. Valtioneuvoston Huoltovarmuusselonteko. Available online: https://www.eduskunta.fi/FI/vaski/Lausunto/Documents/TrVL_4+2022.pdf (accessed on 13 April 2023).
  23. European Council. Fit for 55—The EU’s Plan for a Green Transition—Consilium. 2023. Available online: https://www.consilium.europa.eu/en/policies/green-deal/fit-for-55-the-eu-plan-for-a-green-transition/ (accessed on 13 April 2023).
  24. Gielen, D.; Boshell, F.; Saygin, D.; Bazilian, M.D.; Wagner, N.; Gorini, R. The role of renewable energy in the global energy transformation. Energy Strategy Rev. 2019, 24, 38–50. [Google Scholar] [CrossRef]
  25. Bank of Finland. Supply Bottlenecks Are Having Wide-Spread Impacts on the Economy. 2022. Available online: https://www.bofbulletin.fi/en/2021/5/supply-bottlenecks-are-having-wide-spread-impacts-on-the-economy/ (accessed on 18 December 2023).
  26. Vakulchuk, R.; Overland, I.; Scholten, D. Renewable energy and geopolitics: A review, Renew. Sustain. Energy Rev. 2020, 122, 109547. [Google Scholar] [CrossRef]
  27. Ministry of Agriculture and Forestry of Finland. Wood Fuels in Energy Generation in Finland. 2023. Available online: https://mmm.fi/en/en/forests/use-of-wood/wood-based-energy (accessed on 13 April 2023).
  28. TaVM 33/2022 vp. Lakialoite Turpeen Energiakäytön Lopettamiseksi. Available online: https://www.eduskunta.fi/FI/vaski/Mietinto/Sivut/TaVM_33+2022.aspx (accessed on 13 April 2023).
  29. Alstone, P.; Gershenson, D.; Kammen, D. Decentralized energy systems for clean electricity access. Nat. Clim. Chang. 2015, 5, 305–314. [Google Scholar] [CrossRef]
  30. Kainiemi, L.; Eloneva, S.; Levänen, J. Transition towards a decentralized energy system: Analyzing prospects for innovation facilitation and regime destabilization in Finland. Technol. Anal. Strateg. Manag. 2019, 31, 1003–1015. [Google Scholar] [CrossRef]
  31. Haddad, W.M. Thermodynamics: The Unique Universal Science. Entropy 2017, 19, 621. [Google Scholar] [CrossRef]
  32. Kogler, C.; Schimpfhuber, S.; Eichberger, C.; Rauch, P. Benchmarking Procurement Cost Saving Strategies for Wood Supply Chains. Forests 2021, 12, 1086. [Google Scholar] [CrossRef]
  33. Palander, T. Outsourcing Issues of Wood Supply Chain Management in the Forest Industry. For. Sci. 2022, 68, 521–532. [Google Scholar] [CrossRef]
  34. Marchi, B.; Zanoni, S. Supply Chain Management for Improved Energy Efficiency: Review and Opportunities. Energies 2017, 10, 1618. [Google Scholar] [CrossRef]
  35. Wehner, J.; Deilami, N.T.N.; Vural, C.A.; Halldórsson, Á. Logistics service providers’ energy efficiency initiatives for environmental sustainability. Int. J. Logist. Manag. 2022, 33, 1–26. [Google Scholar] [CrossRef]
  36. Nilsson, F.R.; Sternberg, H.; Klaas-Wissing, T. Who controls transport emissions and who cares? Investigating the monitoring of environmental sustainability from a logistics service provider’s perspective. Int. J. Logist. Manag. 2017, 28, 798–820. [Google Scholar] [CrossRef]
  37. The Ministry of Economic Affairs and Employment of Finland. Roadmap to Fossil-Free Transport—Government Resolution on Reducing Domestic Transport’s Greenhouse Gas Emissions 2021. Available online: https://julkaisut.valtioneuvosto.fi/bitstream/handle/10024/163260/LVM_2021_19.pdf?sequence=1&isAllowed=y (accessed on 18 December 2023).
  38. VaVM 14/2022 vp—VNS 2/2022, vp. Valtioneuvoston Selonteko Julkisen Talouden Suunnitelmasta Vuosille 2023–2026. Available online: https://www.eduskunta.fi/FI/vaski/Mietinto/Documents/VaVM_14+2022.pdf (accessed on 13 April 2023).
  39. Palander, T. Tactical Models of Wood-Procurement Teams for Geographically Decentralized Group Decision-Making. Ph.D. Thesis, University of Eastern Finland, Joensuu, Finland, 1998. Available online: https://www.researchgate.net/publication/44364975_Tactical_models_of_wood-procurement_teams_for_geographically_decentralized_group_decision-making_Teijo_Palander (accessed on 12 April 2019).
  40. D’Amours, S.; Rönnqvist, M.; Weintraub, A. Using operational research for supply chain planning in the forest products industry. INFOR Inf. Syst. Oper. Res. 2008, 46, 265–281. [Google Scholar] [CrossRef]
  41. Rönnqvist, M. Optimization in forestry. Math Program. 2003, 97, 267–284. [Google Scholar] [CrossRef]
  42. Garay-Rondero, C.L.; Martinez-Flores, J.L.; Smith, N.R.; Caballero Morales, S.O.; Aldrette-Malacara, A. Digital supply chain model in Industry 4.0. J. Manuf. Technol. Manag. 2020, 31, 887–933. [Google Scholar] [CrossRef]
  43. Mäkinen, P. The Profitability of the Timber Transport Business before and after Deregulation. Scand. J. For. Res. 1997, 12, 209–215. [Google Scholar] [CrossRef]
  44. Jernström, E.; Karvonen, V.; Kässi, T.; Kraslawski, A.; Hallikas, J. The main factors affecting the entry of SMEs into bio-based industry. J. Clean. Prod. 2017, 141, 1–10. [Google Scholar] [CrossRef]
  45. D’Amato, D.; Veijonaho, S.; Toppinen, A. Towards sustainability? Forest-based circular bioeconomy business models in Finnish SMEs. For. Policy Econ. 2020, 110, 101848. [Google Scholar] [CrossRef]
  46. Kuosa, M.; Kiviranta, P.; Sarvelainen, H.; Tuliniemi, E.; Korpela, T.; Tallinen, K.; Koponen, H.-K. Optimisation of district heating production by utilising the storage capacity of a district heating network on the basis of weather forecasts. Results Eng. 2022, 3, 100318. [Google Scholar] [CrossRef]
  47. Shiraki, H.; Ashina, S.; Kameyama, Y.; Hashimoto, S.; Fujita, T. Analysis of optimal locations for power stations and their impact on industrial symbiosis planning under transition toward low-carbon power sector in Japan. J. Clean. Prod. 2016, 114, 81–94. [Google Scholar] [CrossRef]
  48. European Commission. Hydrogen. 2023. Available online: https://energy.ec.europa.eu/topics/energy-systems-integration/hydrogen_en (accessed on 13 April 2023).
  49. Palander, T.; Voutilainen, J. A decision support system for optimal storing and supply of wood in a Finnish CHP plant. Renew. Energy 2013, 52, 88–94. [Google Scholar] [CrossRef]
  50. Grybauskas, A.; Stefanini, A.; Ghobakhloo, M. Social sustainability in the age of digitalization: A systematic literature Review on the social implications of industry 4.0. Technol. Soc. 2022, 70, 101997. [Google Scholar] [CrossRef]
  51. El Baz, J.; Tiwari, S.; Akenroye, T.; Cherrafi, A.; Derrouiche, R. A framework of sustainability drivers and externalities for Industry 4.0 technologies using the Best-Worst Method. J. Clean. Prod. 2022, 344, 130909. [Google Scholar] [CrossRef]
  52. Grabowska, S.; Saniuk, S.; Gajdzik, B. Industry 5.0: Improving humanization and sustainability of Industry 4.0. Scientometrics 2022, 127, 3117–3144. [Google Scholar] [CrossRef] [PubMed]
  53. Adel, A. Future of industry 5.0 in society: Human-centric solutions, challenges and prospective research areas. J. Cloud. Comp. 2022, 11, 40. [Google Scholar] [CrossRef] [PubMed]
  54. Gorodetsky, V.; Larukchin, V.; Skobelev, P. Conceptual model of digital platform for enterprises of industry 5.0. In International Symposium on Intelligent and Distributed Computing; Springer: Berlin/Heidelberg, Germany, 2019; pp. 35–40. [Google Scholar]
  55. Bonilla, S.H.; Silva, H.R.O.; Terra, M.; da Silva, R.; Gonçalves, F.; Sacomano, J.B. Industry 4.0 and sustainability implications: A scenario-based analysis of the impacts and challenges. Sustainability 2020, 10, 3740. [Google Scholar] [CrossRef]
  56. Schnorf, V.; Trutnevyte, E.; Bowman, G.; Burg, V. Biomass transport for energy: Cost, energy and CO2 performance of forest wood and manure transport chains in Switzerland. J. Clean. Prod. 2021, 293, 125971. [Google Scholar] [CrossRef]
  57. LogForce. Available online: https://www.logforce.fi/ (accessed on 18 December 2023).
  58. WoodForce. Available online: https://www.woodforce.fi/tuotteen-esittely/ (accessed on 18 December 2023).
  59. Acuna, M.; Sessions, J.; Zamora, R.; Boston, K.; Brown, M.; Ghaffariyan, M.R. Methods to Manage and Optimize Forest Biomass Supply Chains: A Review. Curr. For. Rep. 2019, 5, 124–141. [Google Scholar] [CrossRef]
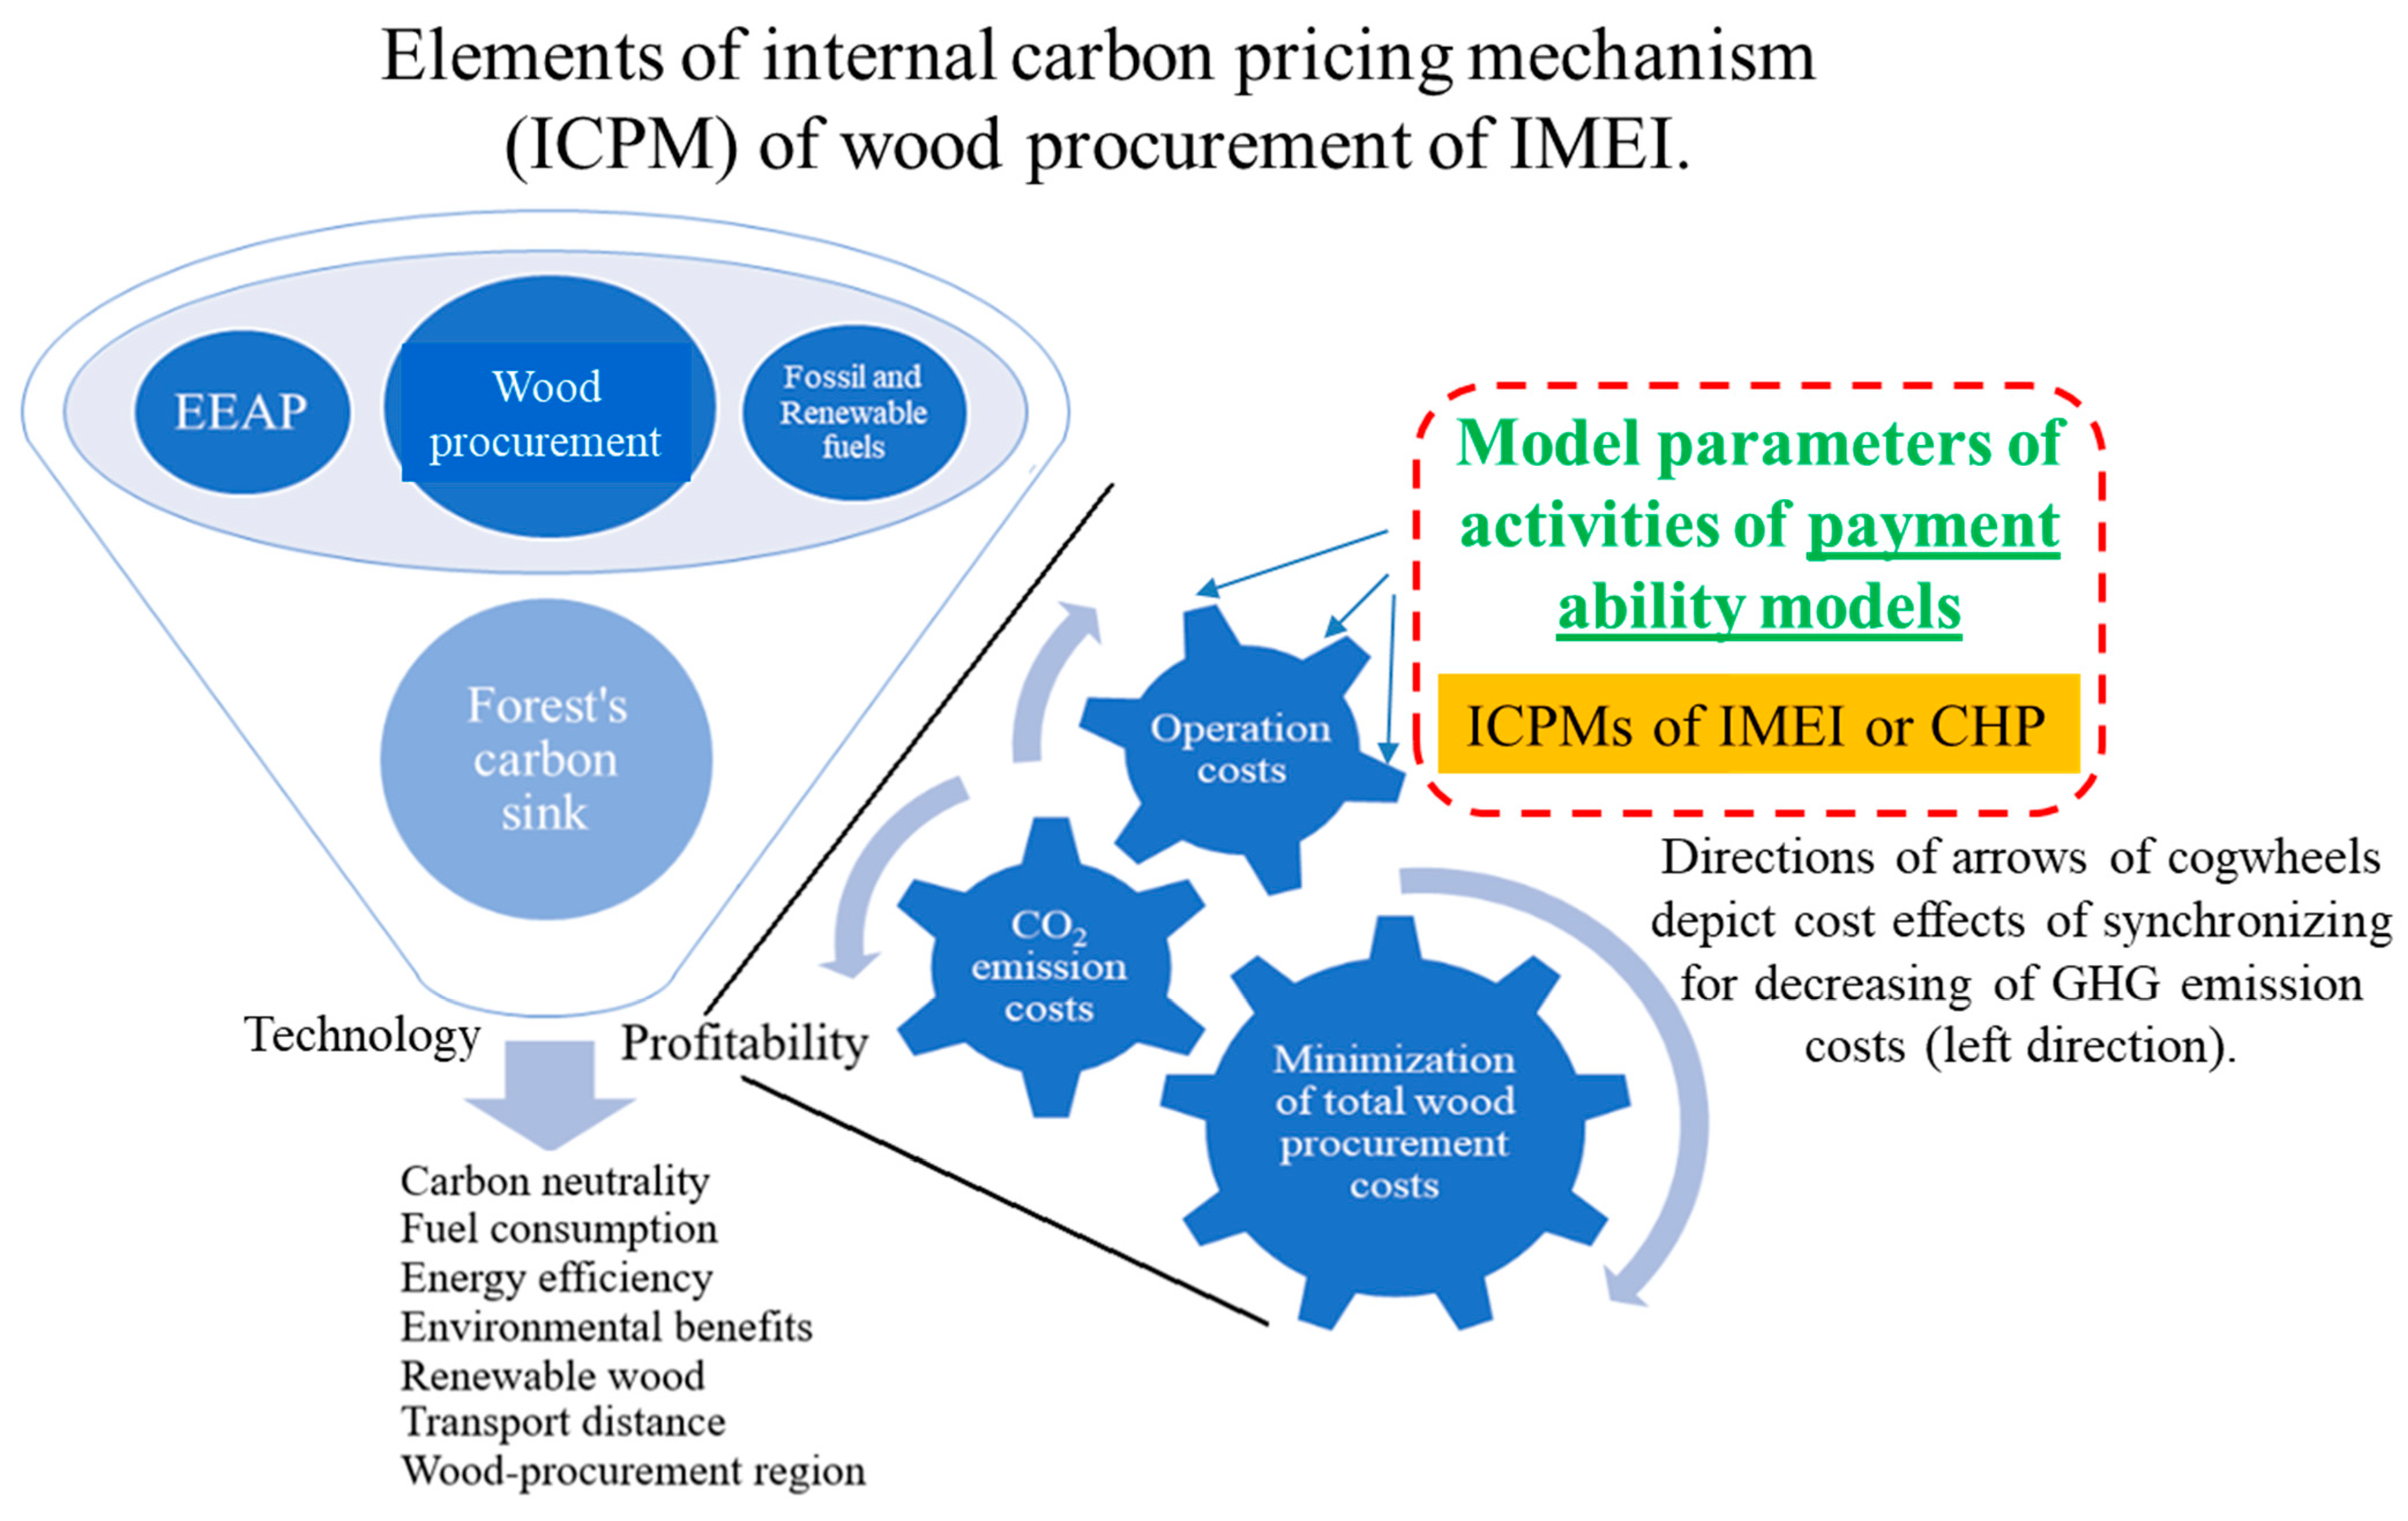
  60. Palander, T. Data-Driven Internal Carbon Pricing Mechanism for Improving Wood Procurement in Integrated Energy and Material Production. Energies 2023, 16, 3473. [Google Scholar] [CrossRef]
  61. Palander, T.; Haavikko, H.; Kärhä, K. Towards sustainable wood procurement in forest industry—The energy efficiency of larger and heavier vehicles in Finland. Renew. Sustain. Energy Rev. 2018, 96, 100–118. [Google Scholar] [CrossRef]
  62. Palander, T.; Haavikko, H.; Kortelainen, E.; Kärhä, K. Comparison of Energy Efficiency Indicators of Road Transportation for Modeling Environmental Sustainability in “Green” Circular Industry. Sustainability 2020, 12, 2740. [Google Scholar] [CrossRef]
  63. Nunes, L.J.R.; Causer, T.P.; Ciolkosz, D. Biomass for energy: A review on supply chain management models. Ren. Sustain. Energy Rev. 2020, 120, 109658. [Google Scholar] [CrossRef]
  64. NFI13. 13th National Forest Inventory of Finland. Natural Resources Institute Finland. 2020. Available online: https://www.luke.fi/en/blogs/nfi-helps-to-develop-sustainable-forest-management (accessed on 13 April 2023).
  65. Uriarte-Romero, R.; Gil-Samaniego, M.; Valenzuela-Mondaca, E.; Ceballos-Corral, J. Methodology for the Successful Integration of an Energy Management System to an Operational Environmental System. Sustainability 2017, 9, 1304. [Google Scholar] [CrossRef]
  66. Palander, T.; Takkinen, J. Data-driven modeling of CO2 emission-allowance compensation for wood-purchasing optimization toward carbon–neutral forest industry. Optim. Eng. 2022, 23, 2091–2110. [Google Scholar] [CrossRef]
  67. Carnero, M.A.; Olmo, J.; Pascual, L. Modelling the Dynamics of Fuel and EU Allowance Prices during Phase 3 of the EU ETS. Energies 2018, 11, 3148. [Google Scholar] [CrossRef]
  68. Lawrence, A.; Thollander, P.; Karlsson, M. Drivers, Barriers, and Success Factors for Improving Energy Management in the Pulp and Paper Industry. Sustainability 2018, 10, 1851. [Google Scholar] [CrossRef]
  69. Yang, X.; Zhang, C.; Yang, Y.; Wu, Y.; Yun, P.; Wagan, Z.A. China’s Carbon Pricing Based on Heterogeneous Tail Distribution. Sustainability 2020, 12, 2754. [Google Scholar] [CrossRef]
  70. Tong, X.; Li, X.; Tong, L.; Jiang, X. Spatial spillover and the influencing factors relating to provincial carbon emissions in China based on the spatial panel data model. Sustainability 2018, 10, 4739. [Google Scholar] [CrossRef]
  71. Liu, Y.; Xiao, H.W.; Zikhali, P.; Lv, Y.K. Carbon Emissions in China: A Spatial Econometric Analysis, at the regional level. Sustainability 2014, 6, 6005–6023. [Google Scholar] [CrossRef]
  72. Statistics of Finland. Forestry Machinery and Truck Cost Index; Statistics Finland: Helsinki, Finland, 2021. Available online: https://www.stat.fi/til/ (accessed on 23 April 2022).
  73. Strandström, M. Timber Harvesting and Long-Distance Transportation of Roundwood in 2018; Result Series; Metsäteho: Helsinki, Finland, 2019; Available online: https://www.metsateho.fi/timber-harvesting-and-long-distance-transportation-of-roundwood-2018/ (accessed on 13 April 2023).
  74. Energiateollisuus. Kaukolämmön Hintatilastot. 2023. Available online: https://energia.fi/tilastot/kaukolammon-hintatilasto/ (accessed on 13 April 2023).
  75. Kogler, C.; Rauch, P. Lead time and quality driven transport strategies for the wood supply chain. Res. Transp. Bus. Manag. 2023, 47, 100946. [Google Scholar] [CrossRef]
  76. Väätäinen, K.; Anttila, P.; Eliasson, L.; Enström, J.; Laitila, J.; Prinz, R.; Routa, J. Roundwood and biomass logistics in Finland and Sweden. Croat. J. For. Eng. 2021, 42, 39–61. [Google Scholar] [CrossRef]
  77. Spinelli, R.; Eliasson, L.; Han, H.-S. A critical review of comminution technology and operational logistics of wood chips. Curr. For. Rep. 2020, 6, 210–219. [Google Scholar] [CrossRef]
  78. Janiszewska-Latterini, D.; Pizzi, A. Application of Liquefied Wood Products for Particleboard Manufacturing: A Meta-analysis Review. Curr. For. Rep. 2023, 9, 291–300. [Google Scholar] [CrossRef]
  79. European Commission; Directorate-General for Internal Market; Entrepreneurship and SMEs; Reichenbach, J.; Mantau, U.; Vis, M.; Essel, R.; Allen, B. CASCADES: Study on the Optimised Cascading Use of Wood; EU Publications: Luxembourg, 2016. [Google Scholar] [CrossRef]
  80. Thonemann, N.; Schumann, M. Environmental impacts of wood-based products under consideration of cascade utilization: A systematic literature review. J. Clean. Prod. 2018, 172, 4181–4188. [Google Scholar] [CrossRef]
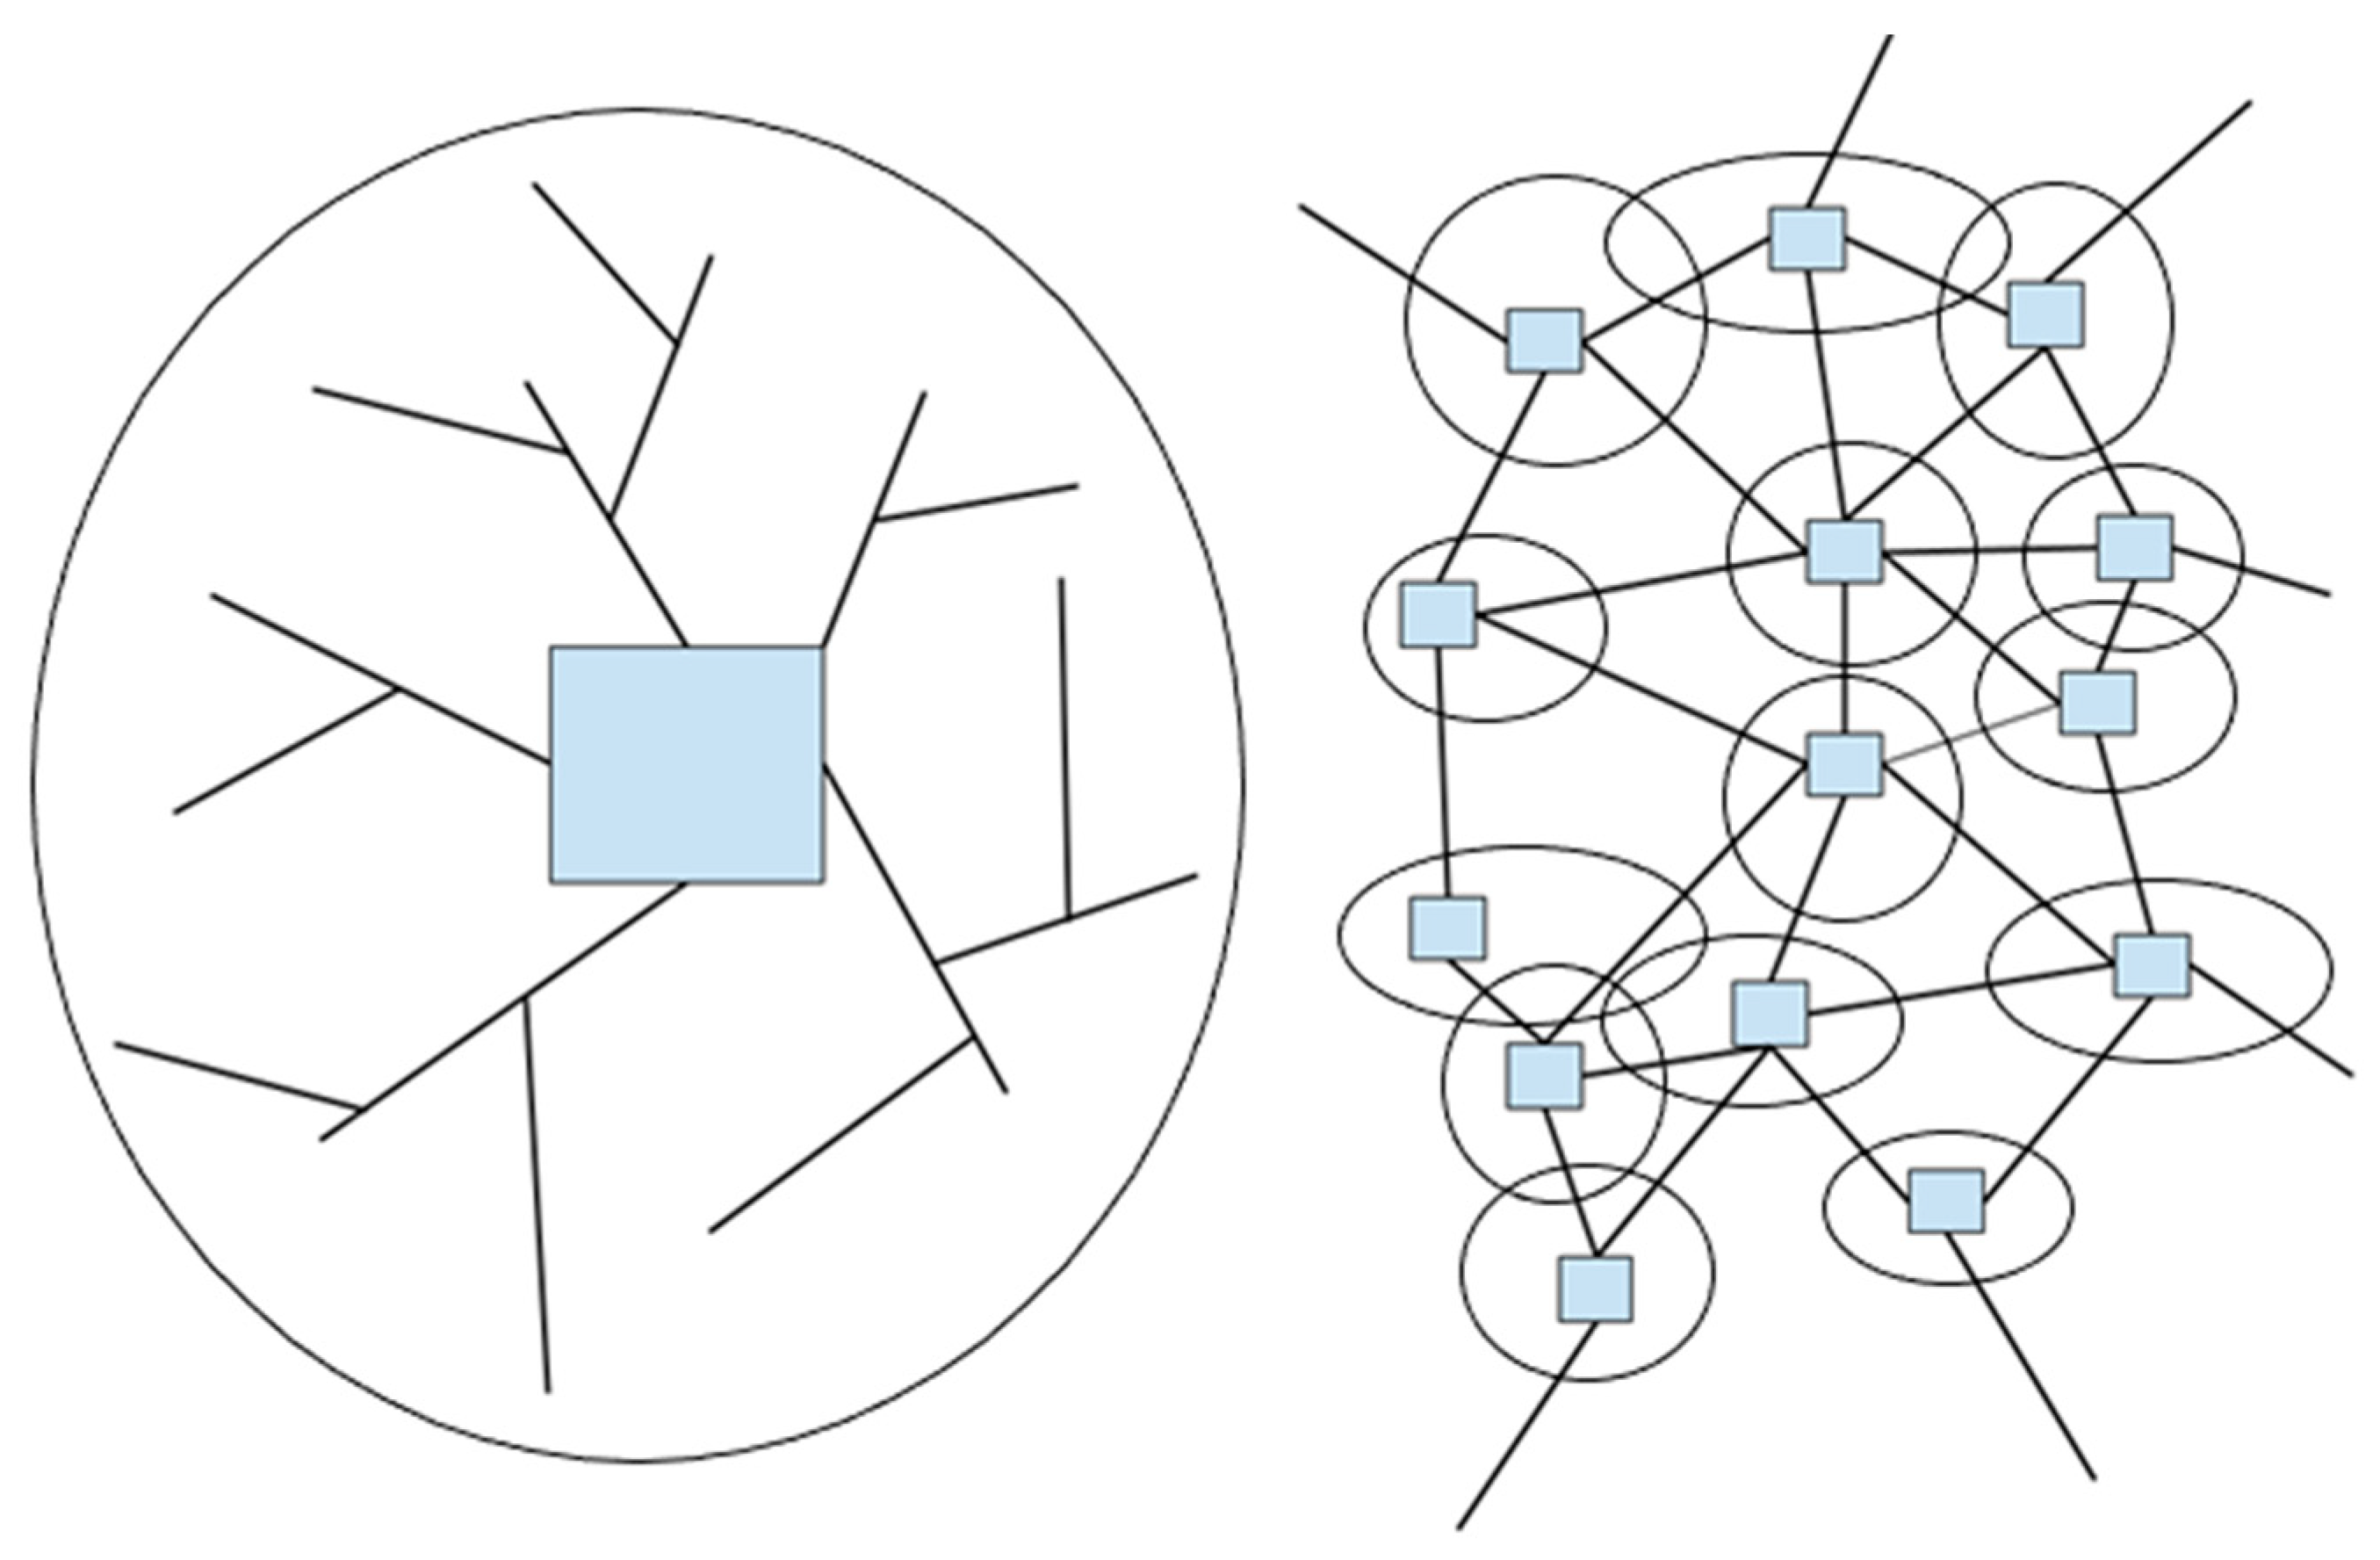
Figure 1. The techno-economic model of renewable forests (TERF) supports the green transition and society’s energy system transition to avoid climate warming. The red dotted line depicts this study. The line arrows are energy inputs and the dotted arrows are energy outputs.
Sustainability 16 00170 g001
Figure 2. The critical infrastructure of forest industry logistics from renewable forests to consumers. The red dotted lines depict this study. Modified for this study from [14].
Sustainability 16 00170 g002
Figure 3. Energy distribution systems and procurement areas of renewable wood fuel. The centralized system is on the left and the decentralized system is on the right. Sustainability 16 00170 i001 = Energy plant, Sustainability 16 00170 i002 = Wood-procurement region, Sustainability 16 00170 i003 = Main supply lines of the energy supply network.
Sustainability 16 00170 g003
Figure 4. Analysis of logistics value chains via the TERF Model by using data analytics of the payment ability of WSCs. The red dotted line depicts this study. Modified for this study from [60].
Sustainability 16 00170 g004
Figure 5. The location of the study area near the CHP plant in Savonlinna, Finland.
Sustainability 16 00170 g005
Figure 6. Energy wood piles in Finnish forests. 1 = Whole wood or wood harvesting residuals, 2 = Small trunk wood, 3 = Stumps, 4 = Sturdy (rotten) trunk wood.
Sustainability 16 00170 g006
Figure 7. Wood procurement areas around the CHP plant: A—the unsustainable region in non-renewable forests (The radius of blue circle is 60 km), B—the sustainable techno-economic region in renewable forests (red).
Sustainability 16 00170 g007
Table 1. Growing stock volume and the average annual growth for tree species and roundwood assortment on forest land available for the wood supply of the IMEI [64]. P—pine, S—spruce, B—birch, OD—other deciduous species, t—total, l—log, p—pulpwood.
MunicipalityGrowthPtPlPpStSlSpBtBlBpODtODlODpAll
%m3/1000
Enonkoski6.61353726584157782465464510846113916793714
Heinävesi6.1510026772280648033052777225032016354304626714,260
Juva6.4683635683055509326312133250736618017084346215,145
Kitee5.9638630933021520526372223314644923554754823815,212
Parikkala6.623691203107623711244101514192411064508562986667
Puumala6.057792959262023641228991162827411923444720910,116
Rääkkylä5.31641826759221211908971159189842223261225235
Rantasalmi7.12304120110332633142710471411239992417372666765
Rautjärvi5.811595635461363584661711100519315241983548
Ruokolahti5.5588429712706377319151616191831113754374925912,012
Savonlinna6.911,58060855107107545837429852728663813125915169228,865
Sulkava6.5337217221531200410038611244190900312231856932
Varkaus6.41759900811213511498611030162748233341445157
Table 2. Growing stock volume for tree species and roundwood assortment on forest land available for the wood supply of energy plants [64]. P—pine, S—spruce, B—broadleaved, A—all tree species, b—branch, foliage, and stem residual, sr—stumps and big roots.
MunicipalityPbPsrSbSsrBbBsrAbAsr
m3/1000
Enonkoski5561104734923208157
Heinävesi17619041631316967761570
Juva212235387259211104810598
Kitee246235343226229110818571
Parikkala74811218710573300241
Puumala18919017312115179513390
Rääkkylä6668141969340300204
Rantasalmi778719113612263390286
Rautjärvi353368416029163103
Ruokolahti19719224117317592613457
Savonlinna42845969450942720815491176
Sulkava11611415510012050391264
Varkaus64731621259044316242
Table 3. The amount of annual growth (1000 m3) for tree species and roundwood assortments in wood procurement region A available for the wood supply of the CHP plant [64]. P—pine, S—spruce, B—broadleaved, A—all tree species, b—branch, foliage, and stem residual.
MunicipalityPbSbBbAb
m3/1000
Enonkoski5510449208
Savonlinna4286944271549
All4837984761757
Total amount of annual growth 120,609
Table 4. The amount of annual growth (1000 m3) for tree species and roundwood assortments in wood procurement region B available for the wood supply of the CHP-plant [64]. P—pine, S—spruce, B—broadleaved, A—all tree species, b—branch, foliage, and stem residual.
MunicipalityPbSbBbAb
m3/1000
Enonkoski5510449208
Heinävesi176416169761
Rantasalmi77191122390
Savonlinna4286944271549
Sulkava116155120391
All85215608873299
Total amount of annual growth 220,135
Table 5. The payment ability of CHP conversion to buy the three most profitable energy wood assortments for a wood procurement amount of 60,000 m3 in the reference region A. P5—Energy trunks are bought at the roadside, where chipping also takes place. P6—Energy trunks are bought at the roadside, transported to the terminal, and chipped at an appropriate time with efficient equipment. P7—Energy trunks are purchased for factory delivery, transported to its terminal, and chipped at an appropriate time with efficient equipment.
Renewable
Wood Share
Market Share of
Renewable Wood
Transport
Distance
EEAPP5P6P7
%%kmEUR/t CO2 eq€ m−3
8039.84070273242
9044.73070334049
10049.82070404955
8039.84085242940
9044.73085323948
10049.82085404955
8039.840100222737
9044.730100313846
10049.820100404955
Table 6. The payment ability of CHP conversion to buy the three most profitable energy wood assortments for a wood procurement amount of 60,000 m3 in the region B. P5—Energy trunks are bought at the roadside, where chipping also takes place. P6—Energy trunks are bought at the roadside, transported to the terminal, and chipped at an appropriate time with efficient equipment. P7—Energy trunks are purchased for factory delivery, transported to its terminal, and chipped at an appropriate time with efficient equipment.
Renewable
Wood Share
Market Share-Aim of
Renewable Wood
Transport
Distance
EEAPP5P6P7
%%kmEUR/t CO2 eq€ m−3
10027.35070353851
10027.34070374252
10027.33070384654
10027.35085353851
10027.34085374252
10027.33085384654
10027.350100353851
10027.340100374252
10027.330100384654
Table 7. The payment ability of CHP conversion to buy the three most profitable energy wood assortments for a wood procurement amount of 100,000 m3 in the reference region A. P5—Energy trunks are bought at the roadside, where chipping also takes place. P6—Energy trunks are bought at the roadside, transported to the terminal, and chipped at an appropriate time with efficient equipment. P7—Energy trunks are purchased for factory delivery, transported to its terminal, and chipped at an appropriate time with efficient equipment.
Renewable
Wood Share
Market Share of
Renewable Wood
Market Share-Aim of
Renewable Wood
Transport
Distance
EEAPP5P6P7
%%%kmEUR/t CO2 eq€ m−3
4839.866.34070101525
5444.774.63070142230
6049.882.92070192834
4839.866.340854919
5444.774.6308591625
6049.882.92085152430
4839.866.340100133−2
5444.774.63010041119
6049.882.920100101926
Table 8. The payment ability of CHP conversion to buy the three most profitable energy wood assortments for a wood procurement amount of 100,000 m3 in the region B. P5—Energy trunks are bought at the roadside, where chipping also takes place. P6—Energy trunks are bought at the roadside, transported to the terminal, and chipped at an appropriate time with efficient equipment. P7—Energy trunks are purchased for factory delivery, transported to its terminal, and chipped at an appropriate time with efficient equipment.
Renewable
Wood Share
Market Share-Aim of
Renewable Wood
Transport
Distance
EEAPP5P6P7
%%kmEUR/t CO2 eq€ m−3
8036.35070283543
9040.94070323747
10045.43070363951
8036.35085263341
9040.94085313646
10045.43085363951
8036.350100233139
9040.940100303545
10045.430100363951
Disclaimer/Publisher’s Note: The statements, opinions and data contained in all publications are solely those of the individual author(s) and contributor(s) and not of MDPI and/or the editor(s). MDPI and/or the editor(s) disclaim responsibility for any injury to people or property resulting from any ideas, methods, instructions or products referred to in the content.

