Abstract
The winds of a typhoon are a significant meteorological hazard with substantial implications for maritime transportation and are of paramount importance. Studying wind field characteristics and establishing effective algorithms for wind correction are of significant practical and societal importance within the realm of cargo transport operations at ports and terminals, thereby guaranteeing the sustainable development of port shipping. This study investigates the influence of typhoon winds on ports in the central to northern areas of the Taiwan Strait, considering different typhoon paths, by utilizing ground automatic station observations and numerical model forecasts. Furthermore, this research examines deviations in wind field forecasts generated by the ECMWF numerical model and the subsequent correction of surface wind patterns. The results indicate that: (1) maximum wind speeds during typhoons following various paths are most notable in the proximity of coastal islands near Putian, Fujian province, predominantly due to the topographical effects of the strait. (2) Wind speeds at individual stations are contingent on the typhoon’s trajectory, while the pressure difference could serve as a reliable indicator of typhoon intensity and onset timing. (3) Following polynomial fitting correction, the forecast deviations are reduced by 37% for the u component and 40% for the v component. The score for the u component increases notably from 41.60 to 63.17 after correction, representing an improvement of 51.85%, while the v component score rises significantly from 29.33 to 48.89, showing an enhancement of 66.70%. This research has implications for future forecasts of typhoon winds that impact ports in the central and northern sections of the Taiwan Strait, meeting the meteorological service needs of cargo ships entering the port and better serving the sustainable development of the local economy and society.
1. Introduction
Typhoon-force winds, a significant meteorological threat in the mid-northern region of the Taiwan Strait, have substantial implications for maritime safety and port operations in the area [1,2]. Accurate wind forecasts are essential for ensuring the safety of navigation and the efficiency of port operations [3,4]. Globally, an average of 80 tropical cyclones form annually, frequently leading to strong winds, heavy rainfall, and storm surges [5,6,7]. The northwest Pacific Ocean is the most active region for tropical cyclones, with about 33% of typhoons being formed there each year [8,9,10]. Statistics show that, on average, 6.9 typhoons make landfall along China’s coastline annually, constituting about 25.5% of the total number of generated typhoons [11,12]. Severe typhoon disasters frequently occur during the peak summer to early autumn period, predominantly impacting the southeastern coastal provinces, with a rising impact [13]. Among the provinces and regions, Guangdong, Taiwan, Hainan, Fujian, and Zhejiang experience the highest frequency of landings [14]. In Fujian, typhoons can be generally categorized into three types: direct landfall, passage through Taiwan into Fujian, and passage through Guangdong into Fujian, with the “passage through Taiwan into Fujian” being the most common [15]. The central mountain range of Taiwan serves as a natural barrier, disrupting the vertical structure of typhoons of the “passage through Taiwan into Fujian” type. The high-level circulation persistently flows over the mountains, causing an increasing disparity between the mid-level and low-level circulations. Consequently, the low-level pressure field becomes filled, leading to a substantial reduction in the typhoon’s intensity. Upon making landfall in Taiwan, irrespective of its initial strength, a typhoon tends to diminish to a tropical storm within approximately 24 h [16].
Deviation in typhoon forecasts may result in decreased shipping efficiency and energy wastage [17,18,19,20,21]. The handover process, including pilot boarding and berthing, is significantly influenced by maritime meteorological conditions, often resulting in port entry failure or personal injury accidents [22]. The entry and berthing of large cargo ships are complex and intricate processes. Any failure in either process can lead to overall failure. Therefore, pilots are held to extremely high time management standards [23]. Ship pilots experience significant impact from powerful winds, particularly in the context of typhoons [24]. The best approach is to avoid unfavorable sea conditions, necessitating sophisticated meteorological services for the shipping channel [25]. In the event of a typhoon or strong winds, the ladder-climbing pilot experiences violent shaking, which poses a significant safety risk. Safety accidents occur annually during boarding operations, and if safety conditions are not met, the operation must be aborted. If the cargo ship is unable to enter the port due to adverse weather conditions, the resulting delay could vary from one to several days. Incoming goods mainly consist of high-value bulk commodities. Any delays would result in substantial economic losses, significantly hindering sustainable development.
Fujian, situated on the southeastern coast of China and adjacent to Taiwan across the sea, serves as the main landfall area for the majority of typhoons heading northwest. Fujian province experiences an average of around 1.6 typhoons annually, although in exceptional years such as 1990 and 2010, this number has escalated to five. These typhoons, known as “Taiwan entry to Fujian” typhoons, usually lead to a decrease in their intensity. Satellite remote sensing studies have revealed that strong winds precede typhoons in the Taiwan Strait [26], and downwind flows develop at the northern and southern ends of the Central Mountain Range, creating what is commonly referred to as “corner flows”. Yang et al. found through numerical simulations that a typhoon passing over Taiwan may cause its eyewall to disintegrate, which could then reconstitute under the influence of convective heating towers [27]. Taiwan’s topography influences the northeast-southwest asymmetry of the typhoon, resulting in a change in its trajectory [28]. Weaker and slower-moving typhoons demonstrate more significant deviations in their trajectory [29]. Some studies use physical constraints, surface meteorological variables, and preliminary estimates as predictors in a multivariate linear regression model to compute wind products. The findings show that the errors in wind speed magnitude and wind direction are both less than 1.5 m/s and 30 degrees, respectively [30]. Some research has emphasized the importance of large-scale variables as vital predictors for forecasting near-surface wind fields [31], while other research has examined the attributes of wind patterns affected by topography [32]. Previous studies have predominantly relied on basic statistical analysis and a single typhoon case, failing to conduct a comprehensive examination of wind field characteristics in the central and northern regions of the Taiwan Strait during typhoon events.
The central and northern regions of the Taiwan Strait are situated between the southeastern coast of the Chinese Mainland and the island of Taiwan [33]. This maritime passage is of significance for connecting the eastern coast of China with the South China Sea islands. The irregular coastline has resulted in the formation of numerous bays and ports [34]. Meizhou Bay Port, situated on the western shores of the Taiwan Strait in Fujian Province, marks the confluence of Putian and Quanzhou cities. It serves as a natural deep-water harbor with multiple berths, a rarity in China and uncommon globally. Pingtan is strategically positioned in the prominent southeastern coastal area of the mainland, and it acts as a crucial intersection for north-south routes in the western Pacific. Historically, it has functioned as a gateway to the East China Sea, South China Sea, and the Northwest Pacific Ocean, providing access to the Indian Ocean. It is widely recognized as the “Maritime Corridor” and plays a crucial role in the “Maritime Silk Road”. The location is commonly considered one of the “Three Eyes”, alongside Nanao in Guangdong Province and Penghu in Taiwan [35]. The establishment of a 10,000-ton passenger and cargo roll-on/roll-off terminal has positioned it as the primary conduit for maritime interactions and communication between the two sides of the Taiwan Strait [36]. Ports in the central and northern regions of the Taiwan Strait are significantly influenced by the near-surface wind patterns, particularly during typhoon occurrences. High winds directly affect the operability of port terminals, subsequently impacting cargo turnover on ships [37]. For this reason, there is a pressing demand for accurate ground wind field forecasts in this area to reduce transportation costs and ensure vessel safety. Hence, conducting a detailed investigation of the characteristics and corrective measures associated with the surface wind field at port terminals in the central and northern sectors of the Taiwan Strait during typhoon events is of significant practical importance and societal value for cargo transport operations at these terminals.
This study focuses on typhoon events and analyzes wind field characteristics in the middle-northern coastal areas of the Taiwan Strait under the influence of typhoons with varying paths. The researchers used polynomial fitting to correct and evaluate the ECMWF wind field data. This study aims to analyze the influence of typhoon-generated winds on port terminals in the central and northern regions of the Taiwan Strait, using data from ground automatic station observations and numerical model forecast products along different trajectories. In addition, this study delves into the attributes of numerical model forecast deviations and their subsequent correction. The objective of this study is to provide precise forecasts of typhoon winds at port terminals in the central and northern regions of the Taiwan Strait during typhoon events. This will offer a scientific basis for making decisions regarding the suspension of port terminal activities affected by typhoon winds.
2. Materials and Methods
2.1. Selection of Observation Stations
This study aims to accurately depict wind conditions in the coastal areas of the central and northern regions of the Taiwan Strait. The following sites were selected for investigation: four sites on Pingtan Island (F1807, F1804, F1801, and F1805), two sites on Nanri Island (58958 and 58959), and one site on Meizhou Island (58925) (see Figure 1). The seven stations are situated in the coastal region of the central northern part of the Taiwan Strait, and their wind intensity is indicative of the wind conditions at the ports and docks in the area.
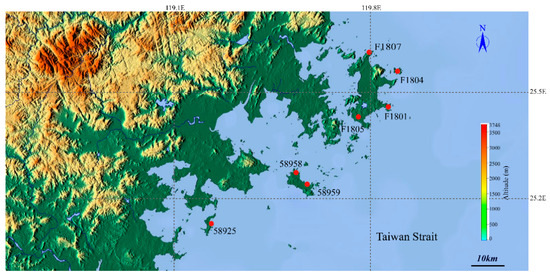
Figure 1.
The topographic map depicts the terrain of Meizhou Island, Nanri Island, and Pingtan Island. The figure displays red dots representing sampling stations, each with its respective station number.
The wind speeds can vary due to the coastal terrain. All selected sites in this study were situated below 70 m in elevation to minimize the influence of elevation on wind. Table 1 displays the precise longitude, latitude, and elevation of each site.

Table 1.
Longitude, latitude, and elevation information of different sites.
2.2. Description of Data and Model
The wind field data collected from meteorological stations undergoes strict quality control and is managed by dedicated personnel to ensure its accuracy and reliability. Hourly wind speed and wind direction data were gathered from surface automatic weather stations for three periods: July 29 to August 8, 2017 during typhoon Nesat (201709) and Haitang (201710); July 11 to July 18, 2018 during typhoon Maria (201808); and August 10 to August 18, 2020 during typhoon Mekkhala (202006).
The 10-m wind field forecast products from the ECMWF model were employed to depict surface wind patterns. The ECMWF predicts the 10-m wind field data by using atmospheric observational data, assimilating diverse observational information, employing internal parameterization schemes within the model, and incorporating the effects of terrain. The 10-m wind field data spans the entire globe, making it a valuable tool for researching and monitoring global meteorological phenomena. Furthermore, it is commonly available at high temporal and spatial resolutions, enabling detailed examinations of local weather conditions. Regarding typhoon Mekkhala (202006), the EC model’s initial fields were at 08:00 and 20:00 on August 10, 2020. For typhoon Maria (201808), the EC model’s initial fields were at 08:00 and 20:00 on July 11, 2018. For typhoons Nesat (201709) and Haitang (201710), the EC model’s initial fields were from July 29 to 31, 2017, and August 1, at 08:00 and 20:00. The forecast data had a duration of 72 h with a time interval of three hours.
The Meteva library is a Python-based library for processing and visualizing meteorological data. It offers powerful tools to read, process, analyze, and visualize meteorological data. Using the Meteva library, the wind speed and direction measurements from surface automatic weather stations were transformed into u- and v-components. Furthermore, a grid-to-station interpolation technique was employed to transform the 10-m wind field of the model onto the respective station locations. Spatial station interpolation and time fusion matching enable achieving a one-to-one correspondence between model forecast data and ground observation data.
2.3. Defining Second Order Polynomial Correction and Evaluation Methods
Numerous studies utilize diverse techniques to rectify the surface wind fields in models [38,39,40,41,42]. This research seeks to devise a wind field correction technique for the central and northern areas of the Taiwan Strait using the ECMWF model. The objective of second-order polynomial fitting is to determine a quadratic function that minimizes the error on given data points, allowing the fitting of observed points within a limited analysis area encompassing multiple analysis grid points, thereby generating an objective analysis field of the observed data. The objective can be accomplished using the method of least squares, which entails minimizing the distance between the data points and the fitted curve in order to ascertain the optimal parameters for the curve fit. This study assessed the corrective efficacy of the second-order polynomial fitting method for forecasting 10 m wind fields using the ECMWF model in the northern region of the Taiwan Strait.
The study employed the absolute difference (∆v) between the predicted 10 m wind field values from the ECMWF model and the observed wind speed at automated ground stations as the scoring criterion (vs). If the change in velocity (∆v) is less than or equal to 0.5 m/s, the corresponding score (vs) is 100 points. If ∆v is greater than 0.5 m/s but less than or equal to 1 m/s, the score is reduced to 80 points. Similarly, for ∆v in the range of 1–1.5 m/s, the score decreases to 60 points, and for 1.5–2 m/s, it becomes 50 points. As ∆v surpasses 2 m/s, the score becomes zero [43]. In order to elucidate the physical interpretation of the wind, separate evaluations were conducted for the u-component and v-component. After the second-order polynomial fitting, the wind field forecast results were subjected to the same evaluation method.
3. Introduction and Tracks of Selected Typhoons
Typhoon Mekkhala (202006) was designated on August 10, 2020 at approximately 11:00 AM in the northeastern area of the South China Sea (see Figure 2). Afterwards, it proceeded northward, consistently gaining in intensity. At approximately 7:30 AM on August 11th, it reached the coast of Zhangpu County in Fujian Province, China, at nearly its maximum intensity. At landfall, the maximum near-center wind speed peaked at 33 m/s, corresponding to a grade 12 storm [44]. Following its landfall, Mekkhala proceeded to drift northward, progressively losing strength. Ultimately, the China Meteorological Administration stopped monitoring Typhoon Mekkhala at 5:00 PM on August 11.
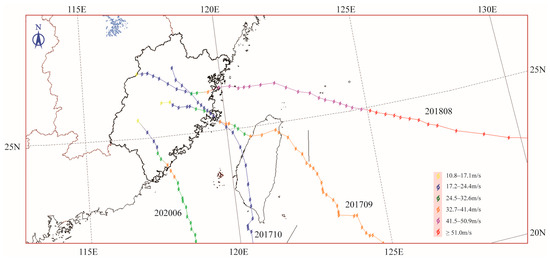
Figure 2.
The track maps of Typhoon Mekkhala (202006), Maria (201808), Nasah (201709), and Haitang (201710) are presented.
Typhoon Maria (201808) formed in the eastern part of the Pacific Ocean, east of Guam, on July 4, 2018 at 20:00. At 21:00, the Japan Meteorological Agency upgraded the weather disturbance to a tropical storm, naming it Maria. This was followed by a similar upgrade by the China Meteorological Administration (see Figure 2). The Joint Typhoon Warning Center upgraded it to a tropical storm at 23:00. At 5:00 on July 8th, Typhoon Maria intensified into a super typhoon in the northwest Pacific Ocean, approximately 1930 km southeast of Yilan County, Taiwan. On July 9 at 10:00, the China Meteorological Administration issued a yellow warning for the typhoon, prompting the National Meteorological Center to initiate a Level III emergency response for significant meteorological disasters caused by the typhoon. On July 10th, at 10:00, the China Meteorological Administration issued a red typhoon warning. Typhoon Maria struck the Huangqi Peninsula in Lian-jiang, Fujian Province at 09:10 on July 11th. Upon landfall, the peak wind speed near the center measured at 42 m/s (grade 14), accompanied by a minimum central pressure of 960 hPa [45]. The China Meteorological Administration officially terminated the tracking of Typhoon Maria on the evening of July 11th.
The precursor disturbance of Typhoon Nesat (201709) originated on the sea surface near Palau on July 21st 2017. It progressed into a tropical depression on July 25th, and subsequently intensified into a tropical storm on July 26th, being named Nesat. Subsequently, Nesat strengthened, transforming into a severe tropical storm on July 27th and escalating into a typhoon on July 28th. It reached its peak intensity as a Category 3 typhoon, with wind speeds of 40 m/s and a central pressure of 960 hPa, before making landfall in the eastern coastal area of Yilan County, Taiwan, around 19:40 on July 29th. Nesat briefly entered Taiwan and then exited near Hsinchu City, moving into the Taiwan Strait, as shown in Figure 2. On July 30th at approximately 6:00, the typhoon made landfall once again in the coastal region of Fuqing City, located in Fujian Province. The typhoon’s intensity was at a lower limit, categorized as a Category 2 with wind speeds of 33 m/s and air pressure of 975 hPa. After making landfall, Nesat started to weaken and eventually weakened into a tropical depression by 14:00 on the same day, with the Central Meteorological Observatory ceasing its numbering of the storm at 20:00, and its remnant circulation eventually merged and moved northward with Typhoon Haitang, which also made landfall shortly afterward on the same day.
Haitang (201710) originated in the central South China Sea on July 26th 2017. It developed into a tropical depression on July 27th and further intensified into a tropical storm on July 28th. On July 31st at 2:50 a.m., it made landfall once more in the coastal region of Fuqing City, Fujian Province [46]. By 23:00, it had weakened to a tropical depression. The next day at 08:00, the Central Meteorological Observatory stopped numbering for Haitang (see Figure 2). At 17:30, Typhoon Haitang made landfall on the coast of Pingtung County, Taiwan. By 22:35, the typhoon had moved into the Taiwan Strait from Taichung City. On July 31st, 02:50, Typhoon Haitang made landfall in the coastal area of Fuqing City, Fujian Province, marking a historic occurrence of two typhoons hitting the same location within 24 h. This happened in conjunction with Typhoon Nesat, the ninth typhoon of that year.
4. Characteristics of Surface Wind Fields for Different Paths of Typhoons
4.1. The Maximum Wind Speed Recorded at Each Station
During the impact period of Typhoons Nasah and Haitang in September 2017, the average wind speed at seven coastal island stations in northern and central Fujian, Taiwan, reached 21.54 m/s, surpassing the speeds recorded during Typhoon Maria in August 2018 (15.9 m/s) and Typhoon Mekkhala in June 2020 (11.56 m/s). The highest wind speeds recorded during the impacts of Typhoons Nasah and Haitang were 24.3 m/s at Station 58958, 20.4 m/s at Station 58925 during Typhoon Maria, and 16.1 m/s at Station 58925 during Typhoon Mekkhala. The wind conditions at the remaining stations are presented in Table 2. The maximum wind speed occurred along the coastal islands of Putian instead of Pingtan due to the canyon effect due to the terrain of the strait, resulting in the maximum wind speed being observed in the central Fujian region. Typhoons entering Fujian from the north have less impact on wind strength in the southern areas. Similarly, this study suggests that typhoons entering from the south have less impact on wind strength in the middle-northern part of the Taiwan Strait.
Table 2.
Maximum wind speeds were recorded at different weather stations during typhoons following different paths.
4.2. The Distribution and Evolution of Surface Wind Fields
Typhoon Mekkhala, identified as 202006, struck Zhangpu County in Fujian Province at approximately 7:30 am on August 11. The typhoon’s maximum wind area shifted as it progressed. Initially, the maximum wind area was located in the southern part of Taiwan (see Figure 3a), and then it shifted into the Taiwan Strait (see Figure 3b). Subsequently, the maximum wind area approached the land (see Figure 3c), leading to decreased wind intensity and a reduction in the wind area’s size (see Figure 3d).
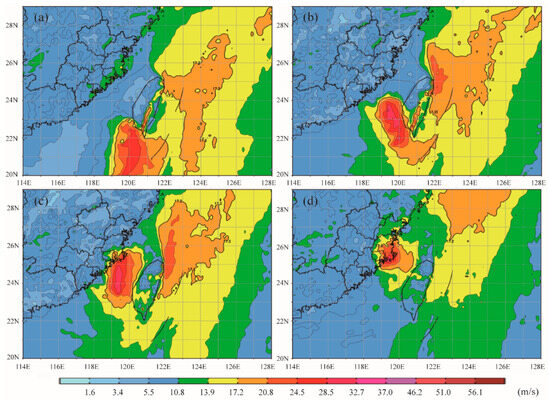
Figure 3.
Evolution of the wind field for Typhoon Mekkhala (202006). Wind gust forecast over the past six hours: (a) at 8:00 PM on August 10th 2020; (b) at 2:00 AM on August 11th 2020; (c) at 8:00 AM on August 11th 2020; (d) at 2:00 PM on August 11th 2020.
Typhoon Maria (201808) struck the Huangqi Peninsula in Lianjiang, Fujian Province, at 9:10 a.m. on July 11. Figure 4 illustrates that the wind area and intensity of Typhoon Maria were considerably stronger than those of Typhoon Mekkhala (202006). Moving from northern Taiwan to northeastern Fujian, the intensity marginally increased (refer to Figure 4b). Nevertheless, post-landfall, the strong wind area was disrupted, resulting in a rapid decrease in wind intensity (see Figure 4d).
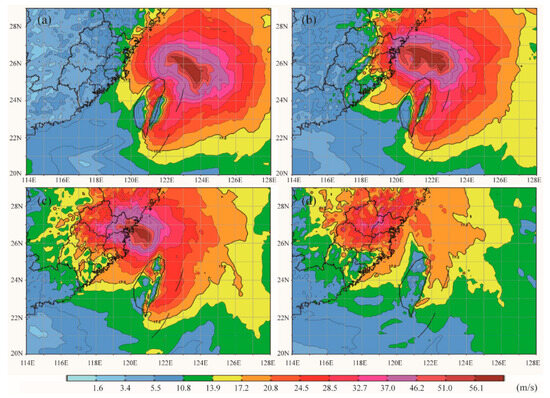
Figure 4.
Evolution of the wind field for Typhoon Maria (201808). Wind gust forecast for the past six hours: (a) at 2:00 AM on July 11th 2018; (b) at 8:00 AM on July 11th 2018; (c) at 2:00 PM on July 11th 2018; (d) at 8:00 PM on July 11th 2018.
According to the evolution map of the near-surface flow field of Typhoon Maria (201808), initially, strong northeast winds dominated the coastal island areas of central Fujian, as shown in Figure 5a. Subsequently, the winds shifted to a northerly direction, as displayed in Figure 5b. Upon landfall, westward and southward airflow converged, depicted in Figure 5c. In the weakening phase, the winds veered southward, as illustrated in Figure 5d.
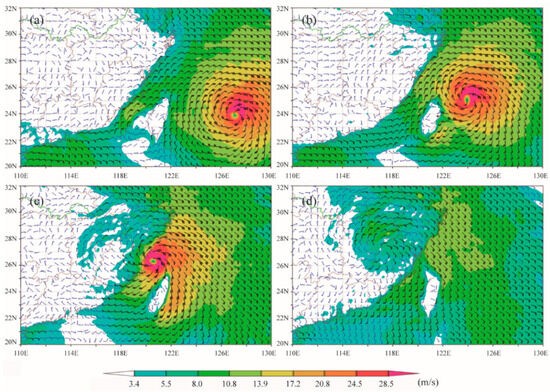
Figure 5.
Evolution of the near-surface wind field for Typhoon Maria (201808) is analyzed. The 10-m wind field forecast is presented for the past 12 h at four time points: (a) 8:00 AM, July 10th 2018; (b) 8:00 PM, July 10th 2018; (c) 8:00 AM, July 11th 2018; and (d) 8:00 PM, July 11th 2018.
Typhoon Nesat (201709) struck Fuqing, Fujian Province, at approximately 06:00 on July 30th. The maximum wind area diminished after traversing Taiwan (see Figure 6a). Upon exiting Taiwan and entering the Taiwan Strait, the wind area contracted (see Figure 6c). It subsequently weakened after landfall (see Figure 6d).
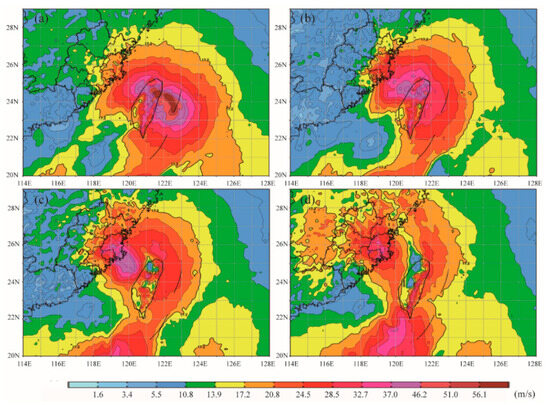
Figure 6.
Evolution of the wind field for Typhoon Nasah (201709). The wind gust forecast for the previous six hours at specific time intervals: (a) 8:00 PM, July 29th 2017; (b) 2:00 AM, July 30th 2017; (c) 8:00 AM, July 30th 2017; and (d) 2:00 PM, July 30th 2017.
Typhoon Haitang, officially designated as 201710, reached landfall in Fuqing, Fujian Province at approximately 2:50 am on July 31. This event occurred shortly after Typhoon Nasah (201709). Initially, it traversed the southern region of Taiwan (refer to Figure 7a), with the maximum wind area subsequently crossing Taiwan Island (refer to Figure 7b). Following a period of weakening, it moved into the Taiwan Strait (refer to Figure 7c), and its intensity further diminished upon making landfall (refer to Figure 7d).
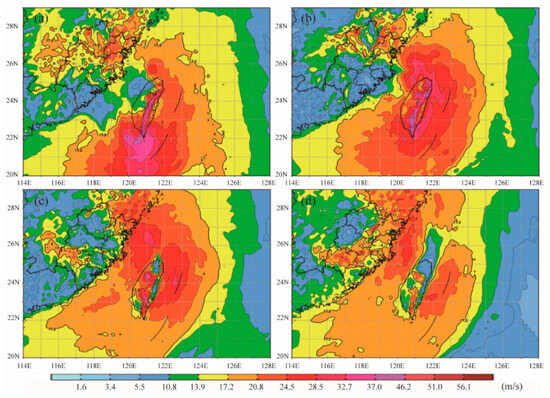
Figure 7.
Evolution of the wind field for Typhoon Haitang (201710). Wind gust forecast for the past six hours: (a) 8:00 PM on July 30th 2017; (b) 2:00 AM on July 31st 2017; (c) 8:00 AM on July 31st 2017; and (d) 2:00 PM on July 31st 2017.
This study integrates and examines the flow patterns of both Typhoon Nasah and Typhoon Haitang. Following the landfall of Typhoon Nasah, the coastal islands in the middle to northern parts of the Taiwan Strait experienced southerly winds (see Figure 8a). Subsequently, easterly and northerly winds converged (see Figure 8b). The continuous impact of southerly winds was then noted (refer to Figure 8c,d).
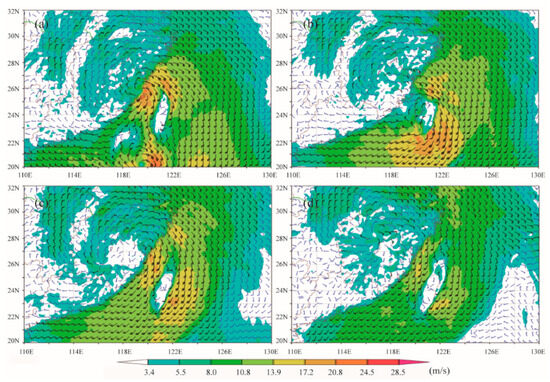
Figure 8.
Evolution of the near-surface flow field for Typhoons Nasah and Haitang (201709 and 201710). The 10 m wind field forecast over the previous 12 h is as follows: (a) at 8:00 AM on July 30th 2017; (b) at 8:00 PM on July 30th 2017; (c) at 8:00 AM on July 31th 2017; (d) at 8:00 PM on July 31th 2017.
Several studies have demonstrated the significant impact of the ground-level atmospheric pressure field on the precursory behavior of typhoon strong winds [47]. This study conducted a detailed analysis of the pressure variations between Hangzhou-Pingtan, Fuding-Dongshan, Pingtan-Shantou, and Ganzhou-Fuzhou. It was observed that both Hangzhou-Pingtan and Ganzhou-Fuzhou experienced two significant instances of pressure differences between July 27th at 20:00 and July 31st at 20:00, as depicted in Figure 9. These instances coincided with the typhoons’ landfall. Furthermore, it was noted that Pingtan-Shantou exhibited two instances of low-pressure differences, indicating the impact of pressure variations on wind intensity. Conversely, the pressure difference between Fuding and Dongshan remained relatively constant, as their location lies between the landfall points. This indirectly highlights the influence of pressure discrepancies on wind intensity.
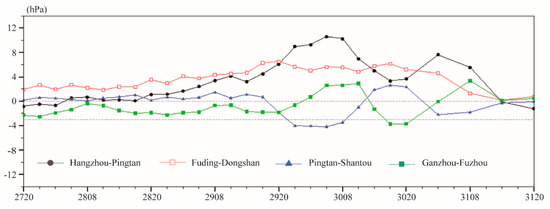
Figure 9.
The pressure differences among Hangzhou−Pingtan (black dot), Fuding−Dongshanz (red hollow square), Pingtan−Shantou (blue triangle), and Ganzhou−Fuzhou (green solid square) were analyzed during the influence of Typhoons Nasah and Haitang.
Some studies suggest that global warming may create more favorable environmental conditions for typhoon activity [48]. This study necessitates a thorough evaluation of the model’s forecasting accuracy to offer valuable references for forecasting future typhoons and provide insights for long-term planning.
5. Examining Forecast Discrepancies and Corrections in Surface Wind Patterns during Typhoons
Several studies have already evaluated the forecasting accuracy of the 10 m wind field in the Bohai Sea and the Yellow Sea [49]. Several studies have used the 10 m wind speed data from the Final Operational Global Analysis (FNL) reanalysis dataset and wind speed data from 23 coastal buoys in China. Findings indicate that as the forecast lead time increases, there is a minor decrease in forecast accuracy. The rates of overestimation and underestimation experience a modest decline of around 2%, and the errors are approximately 1 m/s [50]. As there is insufficient interpretation and application of the ECMWF model wind fields for the coastal areas in the middle-northern part of the Taiwan Strait, a correction and verification analysis of winds at ports and terminals resulting from typhoons with different tracks was performed using second-order polynomial fitting.
5.1. Comparing the Forecasted and Observed 10 m Wind Fields for Typhoon Mekkhala (202006)
Previous research involved the interpolation of surface wind field prediction data from the ECMWF fine grid to representative stations along the Fujian coast [51]. This study aims to analyze the forecast characteristics of wind fields in greater detail, utilizing separate polynomial fitting to correct the u and v components. The correction equation for u is y = −0.0153x2 + 0.1457x + 0.2262, while the correction equation for v is y = 0.0172x2 + 0.1482x + 1.0922.
As shown in Table 3, the forecast deviations of the u and v wind velocities at seven stations have been reduced by over 56%. Among them, the u component errors in F1801 and the v component errors in F1807 have decreased the most, with reductions of 57.6% and 60.3% respectively. Overall, the effect of correction on the v component is slightly superior to that on the u component.
Table 3.
Forecast and correction deviations in wind characteristics at various stations during Typhoon Mekkhala (202006).
As shown in Table 4, the scores of the u and v components at different stations have more than doubled, with the u component at F1801 showing the highest improvement of 128%. Despite F1807 having the largest reduction in v component error, F1805 had the highest increase in v component score, reaching 136%. Both the u and v components showed significant improvements at all five stations, indicating a substantial correction effect.
Table 4.
Characteristics of wind scores at various stations during Typhoon Mekkhala in June 2020.
5.2. Comparing the Forecasted and Observed 10 m Wind Fields for Typhoon Maria (201808)
Several case studies have demonstrated the significant impact of typhoon paths on the dispersion of typhoon winds [52]. Typhoons with different tracks have varying impacts on the wind fields in the coastal areas of the middle-northern part of the Taiwan Strait. This study examines the wind field characteristics of typhoons that make landfall on the northern side of Taiwan. Typhoon 201808 is the most powerful typhoon in this study, with the correction equations of y = 0.0109x2 + 0.4785x − 0.7311 for the u component and y = −0.0135x2 + 0.7759x − 2.5824 for the v component.
After applying the correction equations for the u and v components, the results show that the forecast deviations of u and v wind velocities at seven observation stations were reduced by more than 20% (see Table 5). However, the reduction is less significant compared to the correction effect observed for Typhoon Mekkhala (202006). The average reduction in the u component is 20.1%, while the v component shows an average reduction of 34.4%. Hence, the correction effect on the north-south wind components is better than the east-west components. The seven observation stations are located in the middle to northern parts of the Taiwan Strait, and Typhoon Maria (201808) made landfall in Fujian from the north of Taiwan. As the typhoon was relatively closer to the observation stations, the overall forecast performance of the model for these seven stations was better. Consequently, the spatial correction required was relatively smaller.
Table 5.
Characteristics of forecast and correction deviations at different stations for the winds of Typhoon Maria (201808).
As shown in Table 6, the average score for the u component (51.71) is significantly higher than the v component score (27.64) at the seven stations. Furthermore, the forecast performance remains stable across these stations. After correction, the average score for the u component increases to 61.98, and the average score for the v component increases to 40.52, indicating an improvement of 19.85% for the u component and 46.63% for the v component. Thus, the correction space for the u component is smaller than that for the v component.
Table 6.
Characteristics of scores at different stations for the winds of Typhoon Maria (201808).
5.3. Comparison of Forecasted and Observed 10 m Wind Fields for Typhoons Nasah and Haitang (201709-10)
Studies have demonstrated that the convergence, obstruction, and friction of terrain affect the redistribution of wind fields [53]. The passage of Typhoons Nesats and Haitang across the Central Mountains of Taiwan leads to a more intricate flow pattern.
After applying the correction equations for the u component (y = 0.0064x2 + 0.4498x + 0.3308) and the v component (y = 0.0004x2 + 0.8141x − 0.8935), the differences in forecast deviations for the u and v components at the seven stations are less than 0.01 units (see Table 7). The average deviation for the u component decreases from 2.17 to 1.54 units, while the average deviation for the v component decreases from 2.77 to 2.04 units after correction. Furthermore, differences in forecast deviations for the u and v components at the seven stations, after correction, are also less than 0.01 units, indicating a systematic improvement observed in the correction effect.
Table 7.
Characteristics of forecast and correction deviations at different stations for the winds of Typhoons Nasah and Haitang (201709-10).
As shown in Table 8, the mean score for the u component at seven stations has increased by 37%, and the mean score for the v component has increased by 38.4%. In addition, the similar score improvements for both the u and v components suggest similar correction effects for both components.
Table 8.
Characteristics of scores at different stations for the winds of Typhoons Nasah and Haitang (201709-10).
Considering the different paths and stations, the EC model forecasts a deviation of 2.10 for the u component and 3.12 for the v component. As shown in Table 9, the forecast performance of the EC model for the u component is superior to that for the v component along the coastal ports and islands in the northern parts of the Taiwan Strait. Following polynomial fitting correction, the forecast deviation reduces to 1.33 for the u component and 1.87 for the v component, representing a 37% reduction for the u component and a 40% reduction for the v component. The forecast performance for the u component in the coastal ports and islands in the northern parts of the Taiwan Strait is already good and is further improved after correction. Although the forecast performance for the v component in the same areas is relatively poorer, polynomial fitting has the ability to correct it. As the model demonstrates good forecast performance for the u component, its forecast score is higher. Following correction, the score increases from 41.60 to 63.17, marking a 51.85% increase. In the case of Typhoon Mekkhala (202006), the score increases from 31.74 to 70.77. For the v component, the score increases from 29.33 to 48.89, representing a 66.70% increase.
Table 9.
Average forecast deviation and score of winds for five coastal stations along different paths.
6. Limitations and Future Work
The scarcity of actual field observation data and limitations in obtaining forecast field data have restricted the sample space of this study, potentially limiting the generalizability of conclusions. The site selection process aimed to minimize differences in elevation among observation sites. However, some variations in elevation among sites still exist, potentially resulting in differences in wind forces. Localized, small environmental differences may also transiently affect wind forces, and these effects were not disregarded during the modeling and correction processes.
Future research should aim to identify the key factors influencing wind patterns at 10 m above ground level in ports situated in the middle-northern part of the Taiwan Strait. Improving the study’s accuracy would involve increasing the number of training samples and optimizing fitting algorithms. Additionally, the accuracy of wind field forecasts for coastal ports and terminals can be enhanced through the development of correction algorithms that consider their physical relevance.
7. Conclusions
Coastal islands near Putian experience higher maximum wind speeds during typhoon events compared to those near Pingtan. This is due to the topographic influence of the strait, leading to higher wind speeds in the central Fujian region. When typhoons impact the islands in the middle to northern parts of the Taiwan Strait, the initial wind direction is northeast, followed by the convergence of two airflows, resulting in a southerly wind pattern. The wind strength and direction at each station are determined by the typhoon’s path. Pressure difference can be a reliable indicator of the magnitude and timing of typhoon winds.
After applying polynomial fitting corrections, the u component experiences a reduction in forecast deviation to 1.33, and the v component to 1.87. This represents a 37% reduction in forecast deviation for the u component and 40% for the v component. Due to the model’s strong performance in forecasting the u component, its forecast score increases from 41.60 to 63.17, marking a 51.85% increase. Similarly, the v component’s score rises from 29.33 to 48.89, reflecting a 66.70% increase. Thus, polynomial fitting is demonstrated to be an effective corrective measure for the 10 m wind field products of the EC model.
The applicability and correction of ECMWF wind field data is beneficial for accurately forecasting the wind field in the central-northern part of the Taiwan Strait. During the revision of the ground-level 10 m wind field, the study considered the physical significance of the relationship between typhoon paths and Taiwan’s position, which is significant for statistical research methods considering physical significance. This methodology is more refined and precise in comparison to purely statistical corrections, lacking consideration of the physical implications. Targeted automatic observation facilities can be deployed to produce meteorological services for safety in ports, in order to ensure the sustainable development of port shipping.
This study can provide references for management authorities to appropriately determine navigation restrictions, maritime operations to efficiently unload cargo in ports, and make well-informed decisions. Furthermore, improving the accuracy of typhoon wind speed forecasts will help facilitate sustainable shipping, avoiding energy wastage and contributing to achieving carbon peaking and carbon neutrality.
Author Contributions
Conceptualization, Q.L.; methodology, Q.L.; software Q.L.; validation, Q.L. and S.D.; writing—original draft preparation Q.L.; writing—review and editing, S.D.; visualization, Q.L. All authors have read and agreed to the published version of the manuscript.
Funding
This research was funded by the Fujian Provincial Meteorological Bureau Graduate Research Foundation, grant number 2022G03, and the Putian Municipal Meteorological Bureau Research Project, grant number ptkt202206.
Institutional Review Board Statement
Not applicable.
Informed Consent Statement
Not applicable.
Data Availability Statement
The data in this study are available from the corresponding author upon request.
Acknowledgments
The authors are grateful to the China Meteorological Administration for providing typhoon track data, and to the Fujian Provincial Meteorological Bureau for providing observational data.
Conflicts of Interest
The authors declare no conflicts of interest. The funders had no role in the design of the study, in the collection, analysis, or interpretation of data, in the writing of the manuscript, or in the decision to publish the results.
References
- Cao, S.; Tamura, Y.; Kikuchi, N.; Saito, M.; Nakayama, I.; Matsuzaki, Y. A case study of gust factor of a strong typhoon. J. Wind Eng. Ind. Aerodyn. 2015, 138, 52–60. [Google Scholar] [CrossRef]
- Hong, X.; Li, J. Typhoon wind hazard analysis using the decoupling approach. Wind Struct. 2022, 35, 287–296. [Google Scholar]
- Song, L.; Chen, W.; Wang, B.; Zhi, S.; Liu, A. Characteristics of wind profiles in the landfalling typhoon boundary layer. J. Wind Eng. Ind. Aerodyn. 2016, 149, 77–88. [Google Scholar] [CrossRef]
- Huang, W.; Zhou, H. A hybrid numerical simulation method for typhoon wind field over complex terrain. Wind Struct. 2014, 18, 549–566. [Google Scholar] [CrossRef]
- Wang, H.; Ke, S.T.; Wang, T.G.; Kareem, A.; Hu, L.; Ge, Y. Multi-stage typhoon-induced wind effects on offshore wind turbines using a data-driven wind speed field model. Renew. Energy 2022, 188, 765–777. [Google Scholar] [CrossRef]
- Ma, Z.; Li, W.; Ren, N.; Ou, J. The typhoon effect on the aerodynamic performance of a floating offshore wind turbine. J. Ocean Eng. Sci. 2017, 2, 279–287. [Google Scholar] [CrossRef]
- Wang, J.; Quan, Y.; Gu, M. Assessment of the directional extreme wind speeds of typhoons via the Copula function and Monte Carlo simulation. Wind Struct. 2020, 30, 141–153. [Google Scholar]
- Li, Z.Z.; Wu, L.G.; Liu, Q.G. Variation trend of typhoon activity influencing China during the past 20 years. J. Meteorol. Sci. 2016, 36, 752–759. (In Chinese) [Google Scholar]
- Wu, R.; Cao, X.; Chen, W. Surface Wind Speed-SST Relationship During the Passage of Typhoons Over the South China Sea. IEEE Geosci. Remote Sens. Lett. 2012, 9, 933–937. [Google Scholar]
- Garciano, L.E.O.; Koike, T. New Reference Wind Speed for Wind Turbines in Typhoon-Prone Areas in the Philippines. J. Struct. Eng. 2010, 136, 463–467. [Google Scholar] [CrossRef]
- Ku, H.; Maeng, J.H.; Cho, K. Climate change impact on typhoon-induced surges and wind field in coastal region of South Korea. J. Wind Eng. Ind. Aerodyn. 2019, 190, 112–118. [Google Scholar] [CrossRef]
- Zhao, Z.K.; Liu, C.X.; Li, Q.; Dai, G.; Song, Q.; Lv, W. Typhoon air-sea drag coefficient in coastal regions. J. Geophys. Res.-Ocean. 2015, 120, 716–727. [Google Scholar] [CrossRef]
- Lin, L.; Chen, K.; Xia, D.; Wang, H.; Hu, H.; He, F. Analysis on the wind characteristics under typhoon climate at the southeast coast of China. J. Wind Eng. Ind. Aerodyn. 2018, 182, 37–48. [Google Scholar] [CrossRef]
- Chen, J.; Yang, X.; Tang, Z.P. The intensity and path characteristics analysis of the typhoons landing in Guangdong. J. Meteorol. Res. Appl. 2018, 39, 35–37, 56. (In Chinese) [Google Scholar]
- Zhang, R.G.; Wu, B.; Song, D.Z. Fundamental climatic features of tropical cyclone affectiving Fujian. J. Oceanogr. Taiwan Strait 2000, 19, 65–69. (In Chinese) [Google Scholar]
- Xing, R.; Xu, J.; Lin, H. Statistical analysis of track and intensity variations of tropical cyclone landing mainland after passing through Taiwan. Meteorol. Mon. 2020, 46, 517–527. (In Chinese) [Google Scholar]
- Al Masud, M.M.; Moni, N.N.; Azadi, H.; Wan Passel, S. Sustainability impacts of tidal river management: Towards a conceptual framework. Ecol. Indic. 2018, 85, 451–467. [Google Scholar] [CrossRef]
- Yao, C.; Zhu, H. Emergy Analysis and Assessment of Sustainability on the Eco-economic System of Fujian Province. J. Fujian Norm. Univ. Nat. Sci. 2007, 23, 92–97. [Google Scholar]
- Al-Shalash, O.; Barakat, N. Sustainability assessment of wind turbines using fuzzy logic. Heat Transf. 2021, 50, 1156–1170. [Google Scholar] [CrossRef]
- Ma, S.; Xi, Z.; Ma, L.; Li, X.; Chen, S.; Wang, Q.; Zhang, S. Test and Comparison of Sustainable Suitability of Meteorological Indicators for Rice Cold Damages in the North of China. Meteorol. Mon. 2015, 41, 778–785. [Google Scholar]
- Zhang, J.; Wang, J.H.; Gu, X.H.; Luo, J.H.; Huang, W.J.; Wang, K. An ecological based sustainability assessing system for cropping system. Math. Comput. Model. 2011, 54, 1160–1166. [Google Scholar] [CrossRef]
- Yang, Q.; Chen, G.Q.; Liao, S.; Zhao, Y.H.; Peng, H.W.; Chen, H.P. Environmental sustainability of wind power: An emergy analysis of a Chinese wind farm. Renew. Sustain. Energy Rev. 2013, 25, 229–239. [Google Scholar] [CrossRef]
- Rajabifard, A.; Thompson, R.G.; Chen, Y. An intelligent disaster decision support system for increasing the sustainability of transport networks. Nat. Resour. Forum 2015, 39, 83–96. [Google Scholar] [CrossRef]
- Valizadeh, N.; Haji, L.; Bijani, M.; Haghighi, N.F.; Fatemi, M.; Viira, A.H.; Parra-Acosta, Y.K.; Kurban, A.; Azadi, H. Development of a Scale to Remove Farmers’ Sustainability Barriers to Meteorological Information in Iran. Sustainability 2021, 13, 12617. [Google Scholar] [CrossRef]
- Wang, H.; Ying, G.; Tan, X. Study on Sustainability Evaluation and Analysis for Offshore Wind Power Projects Oriented Low-Carbon. Pol. J. Environ. Stud. 2023, 32, 853–864. [Google Scholar] [CrossRef] [PubMed]
- Lee, S.W.; Nam, S.H.; Kim, D.J. Estimation of marine winds in and around typhoons using multi-platform satellite observations: Application to Typhoon Soulik (2018). Front. Earth Sci. 2022, 16, 175–189. [Google Scholar] [CrossRef]
- Yang, M.J.; Wu, Y.C.; Liou, Y.C. The study of inland eyewall reformation of Tythoon Fanapi (2010) using numerical experiments and vorticity budget analysis. J. Geophys. Res. Atmos. 2018, 123, 9604–9623. [Google Scholar] [CrossRef]
- Huang, Y.H.; Wu, C.C.; Wang, Y.Q. The influence of island topography on typhoon track deflection. Mon. Weather Rev. 2011, 139, 1708–1727. [Google Scholar] [CrossRef]
- Yeh, T.C.; Elsberry, R.L. Interaction of typhoons with the Taiwan orography. Part Ⅰ: Upstream track deflections. Mon. Weather Rev. 1993, 121, 3193–3212. [Google Scholar] [CrossRef]
- Huang, H.Y.; Capps, S.B.; Huang, S.C.; Hall, A. Downscaling near-surface wind over complex terrain using a physically-based statistical modeling approach. Clim. Dyn. 2015, 44, 529–542. [Google Scholar] [CrossRef]
- Kirchmeier, M.C.; Lorenz, D.J.; Vimont, D.J. Statistical downscaling of daily wind speed variations. J. Appl. Meteorol. Clim. 2014, 53, 660–675. [Google Scholar] [CrossRef]
- Wagenbrenner, N.S.; Forthofer, J.M.; Lamb, B.K.; Shannon, K.S.; Butler, B.W. Downscaling surface wind predictions from numerical weather prediction models in complex terrain with WindNinja. Atmos. Chem. Phys. 2016, 16, 5229–5241. [Google Scholar] [CrossRef]
- Zeng, J.Y.; Han, M.; Wu, X.M.; Lin, Q.; Liao, K. Test and application of WRF, EC and T639 Models in strong wind forecasting in Fujian Coast in winter half year. Mar. Sci. 2015, 39, 75–85. (In Chinese) [Google Scholar]
- Liu, M.L.; Chen, P. Significance of phylogenetic diversity and phylogenetic structure in conservation of island plant communities with case study on 19 island along the coast of Fujian Province. J. Appl. Oceanogr. 2022, 41, 275–285. (In Chinese) [Google Scholar]
- Wu, B.; You, L.J.; Bai, L. Relationships of different lasting time-averaged wind speeds in strong wind condition over Fujian coast. J. Nat. Disasters 2014, 23, 225–230. (In Chinese) [Google Scholar]
- Kuang, F.F.; Zhang, Y.Q.; Zhang, J.P.; Jia, C. Comparison and evaluation of three sea surface wind products in Taiwan Strait. Acta Oceanol. Sin. 2015, 37, 44–53. (In Chinese) [Google Scholar]
- Hu, H.C.; Huang, B.; Wei, X.L. Objective correction method of ensemble forecast of 10 m winds on Chinese offshore. Meteorol. Mon. 2017, 43, 856–862. (In Chinese) [Google Scholar]
- Wang, X.; Yao, C.; Gao, G.; Jiang, H.; Xu, D.; Chen, G.; Zhang, Z. Simulating tropical cyclone waves in the East China Sea with an event-based, parametric-adjusted model. J. Oceanogr. 2020, 76, 439–457. [Google Scholar] [CrossRef]
- Wei, K.; Shen, Z.; Ti, Z.; Qin, S. Trivariate joint probability model of typhoon-induced wind, wave and their time lag based on the numerical simulation of historical typhoons. Stoch. Environ. Res. Risk Assess. 2021, 35, 325–344. [Google Scholar] [CrossRef]
- Fang, G.; Zhao, L.; Cao, S.; Ge, Y.; Pang, W. A novel analytical model for wind field simulation under typhoon boundary layer considering multi-field correlation and height-dependency. J. Wind Eng. Ind. Aerodyn. 2018, 175, 77–89. [Google Scholar] [CrossRef]
- Quan, Y.; Fu, G.Q.; Huang, Z.F.; Gu, M. Comparative analysis of the wind characteristics of three landfall typhoons based on stationary and nonstationary wind models. Wind Struct. 2020, 31, 269–285. [Google Scholar]
- Huang, W.F.; Xu, Y.L. A Refined Model for Typhoon Wind Field Simulation in Boundary Layer. Adv. Struct. Eng. 2012, 15, 77–89. [Google Scholar] [CrossRef]
- Chen, D.H.; Liu, M.; Su, W.D.; Xia, L.H.; Shi, S.J. Interpretation and Application of BP Artificial Neural Network in MM5 Model Forecasting Gale for Coastal Regions of Fujian Province. Torrential Rain Disasters 2010, 29, 263–267. [Google Scholar]
- Chen, J.P.; Huang, Y.D.; Cheng, J.J.; Lin, H.; Zhuang, Y. Analysis on the causes of rapid intensification of typhoon “Mekkhala” (2006) in nearshore waters. Mar. Forecast. 2022, 39, 47–55. (In Chinese) [Google Scholar]
- Jian, H.; Shuai, Y.; Yuanfa, G.; Gu, J.; Liu, H. Characteristics of the convective bursts and their relationship with the rapid intensification of Super Typhoon Maria (2018). Atmos. Ocean. Sci. Lett. 2020, 13, 146–154. [Google Scholar]
- Dong, L.; Xu, Y.L.; Lv, X.Y.; Gao, S.Z. Analysis of forecast focuses of binary typhoons Nesat and Haitang. Meteorol. Mon. 2020, 46, 29–36. (In Chinese) [Google Scholar]
- Zhi, J.L.; Huang, X.X. Comparion and Cause Analysis of High Wind Processes in NO. 1713 Typhoon Hato and NO. 1822 Typhoon Mangkhut. Mid-Low Latit. Moutain Meteorol. 2020, 44, 54–60. (In Chinese) [Google Scholar]
- Zhang, Y.; Wang, H.J. A projection of future climate change over the western North Pacific related to Typhoon activities. Acta Meteorol. Sin. 2010, 68, 539–549. [Google Scholar]
- Lian, X.; Liu, G.; Gao, S.; Wang, B.; Bai, Z. Evaluation of the ECMWF forecast skills for the 10 m wind field in the Bohai Sea and the Yellow Sea. Mar. Forecast. 2020, 37, 74–82. [Google Scholar]
- Zhang, C.; Cai, J.Z.; Wu, L.Y.; Song, X.J.; Liu, K.; Chen, Y. Validation of gridded sea surface wind forecasts in 2019. Mar. Forecast. 2023, 40, 56–63. [Google Scholar]
- Zeng, J.; Lin, J.; Yu, Y.; Chen, Q.; Yin, S. An analysis on the track and intensity characteristics and forecast deviation of typhoon 2109 “Lupit”. Mar. Forecast. 2022, 39, 10–24. [Google Scholar]
- Yana, G.U.O. Path and Strength of Saomei Typhoon. Sci. Technol. Rev. 2011, 29, 70–73. [Google Scholar]
- Qiu, W.Z.H.; Zhang, L.W. Analysis of the impacts and formation cause of coastal wind field in Zhejiang by 1917 typhoon Tapah. J. Appl. Oceanogr. 2021, 40, 332–341. (In Chinese) [Google Scholar]
Disclaimer/Publisher’s Note: The statements, opinions and data contained in all publications are solely those of the individual author(s) and contributor(s) and not of MDPI and/or the editor(s). MDPI and/or the editor(s) disclaim responsibility for any injury to people or property resulting from any ideas, methods, instructions or products referred to in the content. |
© 2023 by the authors. Licensee MDPI, Basel, Switzerland. This article is an open access article distributed under the terms and conditions of the Creative Commons Attribution (CC BY) license (https://creativecommons.org/licenses/by/4.0/).