Abstract
Thailand has formulated its climate change policy and updated the relevant plans and policies to align with the goal of achieving carbon neutrality and net-zero greenhouse gas (GHG) emissions. This study investigated the optimal level of GHG mitigation in Thailand by taking into account the marginal abatement cost (MAC) and social cost of carbon (SCC). The research also evaluated how energy efficiency and renewable energy technologies could influence GHG reduction in the power and industrial sectors and illustrate policy recommendations that could be aligned with the 2020–2050 policy and plan period. The findings indicated that there could be instances where GHG mitigation potential would be insufficient to reach the national milestone. In such cases, it would become imperative to leverage all technologies within the marginal abatement cost curve (MACC) and also utilize the SCC for policy decision-making and meeting the desired goals. In certain scenarios, the adoption of additional technologies or measures would be necessary, such as flexible power generation and deploying carbon capture and storage or hydrogen, which are high-cost technologies. Furthermore, preparations should be made for multiple levels of climate change policies and plans beyond 2030.
1. Introduction
The current climate change situation poses severe repercussions for global ecosystems and is projected to exacerbate in the future. Thailand, as a nation, is not exempt from the impacts of climate change due to its consistent exposure to climate fluctuations, such as floods and droughts, which have inflicted significant harm on its economy and ecosystems. Despite these daunting challenges, Thailand has acknowledged its responsibility as a signatory to the United Nations Framework Convention on Climate Change (UNFCCC) and as a participant in the Paris Agreement. To commence, the country’s commitment to its nationally appropriate mitigation actions (NAMA) in 2014 pledged voluntary efforts to reduce greenhouse gas (GHG) emissions in the energy and transportation sectors by 7–20% below business-as-usual (BAU) levels by 2020. In 2020, Thailand reported a NAMA performance of 56.54 million tons of carbon dioxide equivalent (MtCO2eq), constituting approximately 15.40% [1]. Subsequently, the country submitted its nationally determined contribution (NDC) to the UNFCCC in 2015, aiming for a 20% reduction in GHG emissions from the BAU level by 2030, with the potential to increase this target to 25% contingent on various forms of international support. This NDC has evolved into the roadmap and then action plan for the period of 2021–2030, anchored with 2015 as the baseline year by focusing predominantly on mitigation actions within the energy and transport sectors with a target of reductions to 113 MtCO2eq emissions by 2030 [2]. In 2021, during the 26th Conference of the Parties (COP) on Climate Change, Thailand displayed an unwavering commitment to advancing climate change solutions. The country’s aspirations encompassed achieving carbon neutrality by 2050, attaining net-zero GHG emissions by 2065 and elevating its NDC target to reduce GHG emissions by 30–40% by 2030, surpassing its previous aim of 20–25% from the usual GHG emissions [3]. In addition to these endeavors, Thailand introduced the Long-term Low-Greenhouse-Gas-Emission Development Strategy (LT-LEDS) as a guiding framework for its long-term national GHG mitigation efforts. This strategy provides clear objectives and guidelines for GHG reduction in the long run [4].
Beyond setting GHG mitigation targets, policies, roadmaps, and action plans for GHG mitigation guidelines, another crucial aspect to contemplate involves the decision-making process for selecting effective policies or measures capable of significantly curbing energy consumption, which would affect GHG emissions. Policymakers would require access to comprehensive mitigation technology–economic data to inform their deliberations. Furthermore, it has been widely realized that policy decisions in the context of climate change would rely on two key tools: the marginal abatement cost (MAC) and social cost of carbon (SCC). The MAC would be considered in terms of GHG mitigation by utilizing the MAC results that would provide basic data to prioritize low-carbon technologies or measures required to mitigate GHG emissions, which are usually measured in tons of carbon dioxide equivalent. On the other hand, the SCC would be considered as the cost of damages inflicted by rising increments by tons of carbon dioxide equivalent that would contribute to the long-term impacts of climate change. The combined consideration of the MAC and SCC would reveal the optimal degree of GHG mitigation required for implementation. Hence, the results could serve as support for decision-making regarding technology investments or measures that would influence GHG mitigation, along with shaping policies and other financial–economic guidelines. Additionally, both sectors would potentially support the consideration of the establishment of investment or pricing guidelines, such as carbon taxes or carbon credit trading, including international emission trading in the future to advocate effective policies for achieving GHG mitigation targets across the short, medium, and long term. As a result, the aim of this study was to find and forecast the MAC of energy technologies and the SCC, which could be aligned with the national climate change policy and plan, and to analyze the optimal degree of abatement when implementing a GHG reduction policy that would impact the MAC and SCC in Thailand. The data were acquired from individuals possessing pertinent information as well as from public reports, websites, and research documents distributed by government agencies and the private sector.
This paper offers new insights into the MAC associated with GHG mitigation technology in Thailand’s industrial and power sector. It also provides forecasts for the future MAC and prioritizes the technologies to assist in establishing short-, medium-, and long-term climate change policies and plans. Additionally, it includes an analysis of the optimal degree of GHG reduction by covering the energy and climate change context of Thailand.
The organization of this paper comprises six sections: (i) Introduction, (ii) Thailand’s energy and climate policy and plan, (iii) Materials and Methods, (iv) Results, and (v) Conclusion and Policy Recommendations covering both policy and technology implementation.
2. Thailand’s Energy and Climate Plan and Policy
Thailand has developed strategic plans and policies relevant to energy and GHG to support all sectors of its economy with a particular emphasis on the industrial and power sectors.
2.1. Energy Policy
The Ministry of Energy has established the Thailand Integrated Energy Blueprint (TIEB) [5], which constitutes the nation’s comprehensive long-term energy strategy. It comprises five subsidiary plans that include: (i) The Power Development Plan (PDP), (ii) Energy Efficiency Plan (EEP), (iii) Alternative Energy Development Plan (AEDP), (iv) Gas Plan, and (v) Oil Plan. Notably, the key important energy plans and policies with relevance to GHG mitigation policies in Thailand are the PDP, EEP, and AEDP. The details of the relevant plans are described in Table 1.
In 2021, Thailand’s energy consumption amounted to 72,161 kilotons of oil equivalent (ktoe), a 6.7% decrease from the previous year. Of this total, petroleum products accounted for 48.60% of the final energy consumption, while electricity accounted for 23.70%, renewable energy contributed 11.80%, coal constituted 8.80%, and natural gas accounted for 7.10% [6]. The forecast final energy consumption in the BAU scenario would increase to 245.6 Mtoe in 2050, with petroleum products being 50.56% of the total final energy consumption, followed by electricity at 20.42%, renewable energy at 15.52%, coal accounting for 8.45%, and natural gas at 5.05% [7].

Table 1.
Details of the energy plan in Thailand.
Table 1.
Details of the energy plan in Thailand.
| Energy Plan | Objectives | Targets |
|---|---|---|
| PDP2018 (2018–2037) is a national long-term electricity generation and supply [8]. | The net amount of power generation at the end of 2037 would be 77,211 MW. | |
| EEP2018 (2018–2037) is used for driving energy conservation and supporting future energy technology change [9]. | To reduce energy intensity by 30% in 2037 when compared with 2010. | The commercial energy consumption would be reduced to 49,064 ktoe of the total final energy consumption in 2037. |
| AEDP2018 (2018–2037) is a national renewable and alternative energy supply and consumption plan [10]. | To increase the proportion of renewable energy consumption in the forms of electricity, heat, and biofuels at 30% of the final energy consumption in 2037. | The consumption of renewable energy would be 38,284 ktoe.
|
2.2. Climate Policy
The climate policies and plan target the energy and climate change issues with a particular emphasis on the industrial and power sectors. This is Thailand’s NDC and the Net-Zero GHG Roadmap. The details of the relevant plans are described in Table 2.

Table 2.
Details of the climate plan in Thailand.
Figure 1a depicts the GHG mitigation target for the energy and transport sectors in 2030, with a goal of 169.5 MtCO2eq. The GHG mitigation target for the industry sector is 64.5 MtCO2eq, transportation is 61.5 MtCO2eq, power generation is 36 MtCO2eq, households are 6 MtCO2eq, and buildings are 1.5 MtCO2eq. Moreover, the GHG mitigation measures relating to the industry sector include (i) increasing the industrial energy efficiency by 16.5 MtCO2eq and (ii) using renewable energy in industry at 48 MtCO2eq. In the power sector, the measures comprise (i) improving power generation efficiency, leading to a 9 MtCO2eq mitigation, and (ii) power generation from renewable energy, which would account for 27 MtCO2eq. The GHG mitigation achievements during 2013–2020 that were reported to the UNFCCC are illustrated in Figure 1b. The GHG reduction was an increasing trend from the implementation of the NAMA measures in the energy and transport sectors.
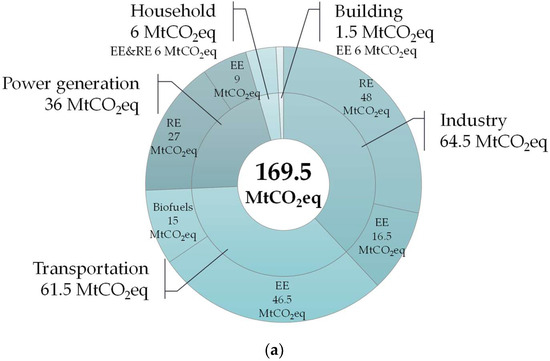
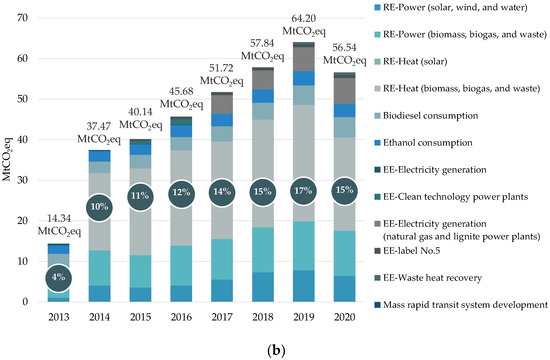
Figure 1.
Thailand at a glance: (a) GHG mitigation target in energy and transport sector; (b) GHG mitigation achievement 2013–2020.
Studies relating to the energy and climate policy in Thailand’s industrial and power sectors included an analysis of the energy demand in the manufacturing sector by Songwut et al. [13] and energy reduction performance tracking from having Thailand’s eight-step energy management system (EnMS) in designated facilities by Wongkot [14]. In addition, monitoring past energy consumption reductions that had a direct effect on GHG, as well as forecasting future energy and GHG emissions, was analyzed by Wongkot et al. [15] using the integrated model for augur from the country’s long-term low-carbon energy efficiency and renewable energy plan in the industrial and power sectors.
3. Materials and Methods
The conceptual framework of this research was divided into three sections: (i) the MAC, (ii) the SCC, and (iii) the optimal degrees of abatement. The details are as follows.
3.1. Model Framework
In the analysis of the optimal level of emissions, economists apply the concepts of the marginal damage cost (MDC) and MAC according to the principle of the benefit–cost analysis (BCA). If there were a lot of GHG emissions, the MDC would be high, but the MAC would be low. On the other hand, if the level of GHG emissions was low, the MDC would be low, but the MAC would be high. The optimal GHG emissions level is point E, which would make the MAC equal to the MDC; in this case, it was the SCC. The conceptual overview of the optimal carbon emissions is expressed in Figure 2.
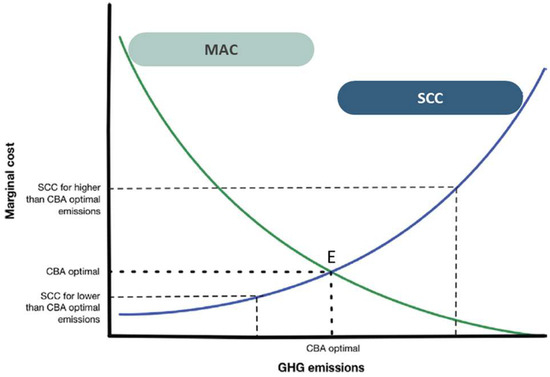
Figure 2.
The conceptual overview of optimal carbon emissions policy. Source: John Weyant (2014) [16].
3.2. Marginal Abatement Cost
The MAC is a crucial tool for evaluating expenses, thus encompassing both the investment and operation and maintenance (O&M) costs of energy projects or measures. This tool can aid policymakers in making economically sound decisions for formulating national-level subsidization schemes and implementing projects. This significance arises because many developing countries face budgetary constraints when supporting climate mitigation projects, thereby necessitating a prioritization balance between the costs and emissions reduction goals. To achieve the GHG reduction targets, it would be imperative to prioritize the measures by representing the outcomes through MACCs by utilizing financial and economic data [17,18,19]. These MACCs can illustrate the relative significance of the measures in the relationship between the GHG emission reduction and their associated costs or price, which would mean the marginal cost of reducing one additional unit of carbon dioxide [20]. Furthermore, policymakers could utilize this prioritization of measures and policies to design and implement appropriate GHG reduction policies guided by the MACC, which would offer users insights into the dimensions or outcomes of the MAC and GHG mitigation potential.
There are several studies related to the MAC on energy efficiency and renewable energy technologies in multitudinous economic sectors and countries. For instance, McKinsey et al. [21], Wachter [22], de Souza et al. [23], Xiufeng Yue et al. [24], and Ibrahim et al. [25] studied the MAC of low-carbon technology in energy efficiency and renewable energy. Promjiraprawat et al. [26], Peng et al. [27], Jiakui Chen et al. [28], Xi Yang et al. [29] Likewise, and Bei Gao et al. [30] calculated the MAC in energy efficiency technologies. Additionally, He Xiao et al. [31], Timilsina et al. [32], Abrell et al. [33], and Muangjai et al. [34,35,36] assessed the MAC of renewable energy technologies. The equation for the MAC is expressed as follows:
where MAC represents the marginal abatement costs (THB/tCO2eq), CPS represents the total cost of the GHG mitigation technology in policy scenarios (THB/energy unit), CBS represents the total cost of the baseline technology (THB/energy unit), EPS represents the total amount of GHG in the mitigation technology in the policy scenarios (tCO2eq/unit), and EBS represents the amount of GHG emissions in the baseline technology or scenario (tCO2eq/unit).
where ICPS and ICBS represent the investment cost of the technology in the policy and baseline scenarios, respectively (THB), OMCPS and OMCBS represent the operation and maintenance costs of the technology in the policy and baseline scenarios, respectively (THB), FCPS and FCBS represent the fuel costs of the technology in the policy and baseline scenarios, respectively (THB), and A represents the amount of energy in MJ for heat generation and kWh for electricity generation. For the case of energy efficiency improvement, this refers to the amount of energy that could be conserved through the implementation of the new energy efficiency technology (kWh or MJ). The investment cost for heat generation includes the cost of waste-to-energy technology and heat generation, while the cost of electricity generation encompasses building construction, land, machinery and equipment, engineering design with a consultant, and survey costs. The investment cost for increasing the energy efficiency is related to the cost of the technology (machines or equipment).
Economic Data and Key Assumptions
The data on the total cost comprised two components: the investment cost and the O&M cost over the technology’s lifetime. The methodology for collecting the cost data involved two main approaches: (i) conducting interviews and distributing questionnaires to people with relevant data and (ii) gathering pertinent information from public reports, websites, and research documents disseminated by government agencies and the private sector. The collected data solely pertained to the investment costs. Consequently, hypotheses were formulated regarding the percentage of the O&M cost and other related factors to estimate the overall costs over the technology’s lifetime. Detailed assumptions are provided in Appendix A. The total cost data were converted into monetary values and adjusted by using the reference NDC 2015 base year of the Bank of Thailand’s consumer price index (CPI) [37]. The key technology list is expressed in Figure 3.
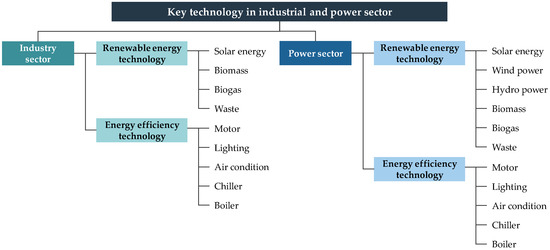
Figure 3.
Key technology list in industrial and power sector in this study.
3.3. Social Cost of Carbon
The SCC is a tool for measuring the value of broad economic harm caused by climate change resulting from prolonged carbon dioxide emissions. The economic damage values stem from the release of GHG into the atmosphere and the subsequent alterations in GHG concentrations, thus leading to shifts in global average temperatures. Notably, the value of the SCC will escalate over time, as the persistence of GHGs will continue increasing in the atmosphere, causing more damage. As a consequence, this assessment considered the cost per unit of carbon dioxide emissions or its equivalent (if other GHGs were covertly considered). This could provide policymakers with insights into the economic impact of their decisions when crafting GHG reduction policies or action plans. Typically, the valuation of the SCC is widely reflected in the carbon price, such as carbon taxes and emissions trading. The SCC equation is presented in Equation (4) [38].
where SCC represents the social cost of carbon (USD/tCO2eq), S* represents the stock of carbon dioxide in the atmosphere (tCO2eq), D′(S*) represents the flow of the marginal damages at each point in time, r represents a discount rate (%), and “φ” represents the decay rate of the stock of carbon dioxide in the atmosphere (%).
Howarth et al. [39], van den Bergh et al. [40], and Pu Yang et al. [41] conducted reviews of the SCC and estimated it using various models. Additionally, Khastar et al. [42], Malladi et al. [43], and Achariyaviriya et al. [44] scrutinized the implications of the SCC in emissions reduction and other related issues. In this study, the SCC values derived from prior research were employed with consideration given to adapting the data to align with the nation’s climate change policy and plan. This research revealed a significant variability in the SCC values stemming from estimations based on different commonly used discount rates that were 5%, 3%, and 2.5%, respectively.
3.4. Optimal Degrees of Abatement
The optimal level of abatement when implementing a GHG reduction policy in Thailand would require the consideration of two key facets: the MAC and SCC. Additionally, this would necessitate thoughtful deliberation regarding the GHG emission targets.
The aim of this study regarding the assessment of the GHG emissions target and projected GHG emissions in the industrial and power sectors encompassed emissions under the BAU and net-zero targets, leading to the projection of emission mitigation targets during 2020–2050. The GHG emissions forecast for Thailand under the BAU scenario during this period of time in this study was based on historical GHG emissions data for the period of 2000–2018. These were sourced from the Office of Natural Resources and Environmental Policy and Planning (ONEP) [45,46,47,48] and comprised four distinct scenarios, as outlined below in Table 3. The decision tree for analyzing the optimal level of abatement is expressed in Figure 4, and MACC for other years are illustrated in Supplementary Materials.

Table 3.
Scenario and assumptions in this study.
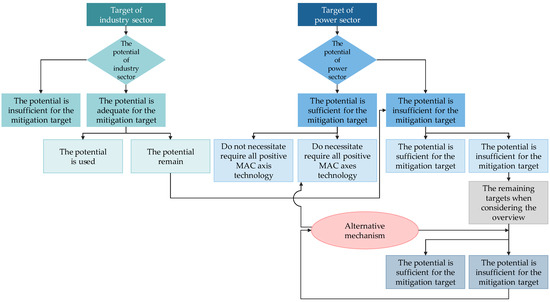
Figure 4.
Decision tree for analyzing the optimal level of abatement.
4. Results
4.1. Marginal Abatement Cost and Mitigation Potential
The results of the MAC and mitigation potential assessments of energy efficiency improvement and renewable energy technologies within the power and industrial sectors were elucidated as follows.
4.1.1. Industry Sector
For the industrial sector, the MAC results encompassing heat generation from renewable energy and energy efficiency improvement technologies in electricity and thermal energy, spanning from 2020 to 2050, are presented in Table 4. The MAC for solar energy was positioned on the negative axis, thus indicating that the MAC for heat generation from solar technologies would be lower than from electricity. Biomass and waste technologies also fell within the negative axis, signifying that in terms of heat generation cost, biomass and waste would be more cost-effective options compared to coal. In the context of GHG mitigation, this implies that biomass and waste-to-heat energy generation technology investment would entail minimal or no incremental costs for these technologies. Consequently, this suggests that the utilization of bio-based renewable energy, particularly biomass, would hold significant potential for reducing GHG emissions. However, in the case of heat generation from biogas, the MAC indicated a positive value, meaning that the MAC from using biogas was high compared to coal. The mitigation potential for heat generation from renewable energy technologies tended to increase by an average of 4.69% from the year 2020 to 2050. Heat generation from biogas technologies would contribute to the progress of GHG mitigation but would be associated with a higher MAC, thereby implying that substantial investment would be necessary to implement these GHG mitigation measures. Nevertheless, if policymakers believed in the high efficiency of this technology, the investment could be justified. The MACC of GHG technology in industry sector in 2030 is illustrated in Figure 5, and MACC for other years are illustrated in Supplementary Materials.

Table 4.
Marginal abatement cost of the technology for industry sector.
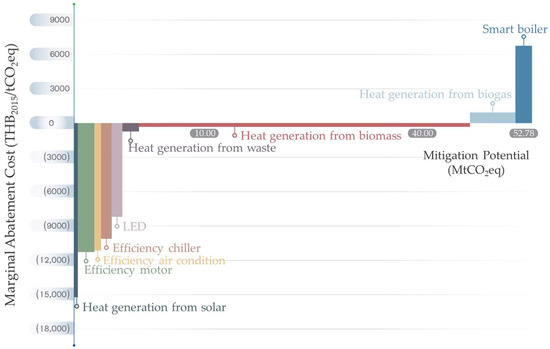
Figure 5.
Marginal abatement cost curve of GHG technology in industry sector in 2030.
Furthermore, high-efficiency technologies in electricity exhibited a MAC positioned on the negative axis, implying that high-efficiency measures/technologies would incur lower costs compared to the base cases. This suggests that industries could implement these technologies on their own with limited support or intervention from public agencies. On average, the GHG mitigation potential tended to increase by 6.01%. However, it is worth noting that the MAC for utilizing a smart boiler system instead of a standard boiler had a positive value due to its high initial cost. Nevertheless, this technology would still lead to a GHG mitigation potential increase averaging 5.87%.
4.1.2. Power Sector
Regarding the power sector, the technologies under consideration were electricity generation from renewable sources and high-efficiency technologies in electricity and heat. The MAC results from 2020 to 2050 are presented in Table 5. The MAC values of hydro energy, biomass, biogas, and waste were negative, thus indicating that their costs would be lower compared to the base case. However, solar energy and solar floating technologies exhibited positive MAC values, which later turned negative as time progressed due to technological advancements and market mechanisms. In contrast, technologies, i.e., smart boilers, CCS, and BECCS, maintained consistently positive and relatively high MAC values. Hence, if public agencies or stakeholders anticipated the implementation of technologies with positive MAC values before self-transitioning, this would be crucial to utilize the SCC to establish and consider appropriate mechanisms. Moreover, the MAC for electricity generation from renewable energy could vary significantly, as it is influenced by factors such as plant factors, electricity generation costs, technology, geographical location, and scale (economies of scale). On average, the GHG mitigation potential from electricity generation using renewable energy sources between 2020 to 2050 displayed a trend to increase by 8.91%. The MACC of GHG technology in power sector in 2030 is illustrated in Figure 6.

Table 5.
Marginal abatement cost of the technology for power sector.
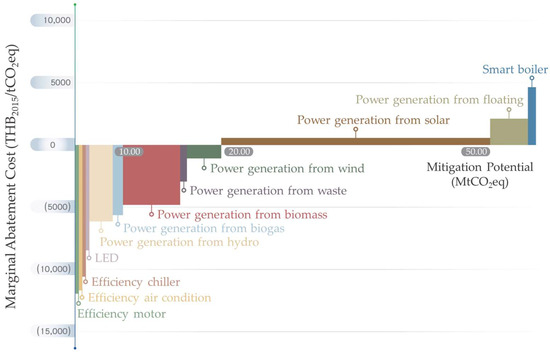
Figure 6.
Marginal abatement cost curve of GHG technology in power sector in 2030.
The MAC for high-efficiency technologies in electricity and heat within the power sector was also similar to the industrial sector. However, the GHG mitigation potential from increasing the energy consumption efficiency of these technologies differed from the industrial sector, where the GHG mitigation potential of high-efficiency technologies in electricity and heat tended to increase by 5.93% and 6.08% on average, respectively.
When comparing the MAC results of this research with the literature-reviewed research, it was found that the technology positions in the MACC results were similar. This MACC could be divided into three sections as follows: (i) command and control policies with the technology position on the negative axis, (ii) market-based policies with the technology position on the positive axis and with a low MAC value, and (iii) research development and deployment policies with the technology position on the positive axis and with a high MAC value. This could be explained by the types of technology as follows:
- The MAC of energy-efficiency-improvement technologies in electricity and thermal energy would be in section (i). In this case, this would be a GHG reduction technology with a lower cost than the base technology. These technologies could be operated on their own without receiving support for the implementation of the technology.
- The MAC values of heat generation from renewables would be in sections (i) and (ii). In section (ii), this would be a GHG reduction technology with a slightly higher cost than the base technology if these technologies received little support or use of the price mechanism to drive the use of technology.
- The MAC values of electricity generation from renewables would be in sections (i) and (ii).
- The MAC values of CCS would be in section (iii). This is a technology that has a very high GHG reduction cost or a technology that is currently being researched.
4.2. Social Cost of Carbon
In this study, we applied the SCC values from previous research and considered using these data to suit the nation’s climate change policy and plan. Most research studies related to the SCC rely on integrated assessment models (IAMs) with commonly used models including DICE, PAGE, and FUND. Upon obtaining the gathered SCC values, it became evident that these values varied significantly and exhibited great diversity. This variation in values could be explained by the different discount rates of 5%, 3%, and 2.5%, respectively. The discount rates played a crucial role in the SCC estimation, as they enabled the conversion of the estimates of future climate change damages into present values. They also reflected the importance of present and future consequences. The assumptions of differences in the discount rate with high discount rates had an insignificant effect on future consequences compared to the present, while low discount rates determined that the future effect that would closely resemble the current one [51]. Because the damages from GHG emissions have global repercussions rather than being limited to a specific area or country, it would be essential to select a global SCC for Thailand in this study. The SCC values employed in this study were sourced from the Interagency Working Group on the Social Cost of Greenhouse Gases [52]. These values were initially estimated in USD in the year 2007 but were adjusted to the 2017 USD values. Subsequently, these values were converted from USD to THB based on the average exchange rate provided by the Bank of Thailand [53] in 2017, which was 33.94 THB/USD. These values were adjusted with time at the base year of 2015, where the headline consumer price index from the Bank of Thailand was applied as a reference for these adjustments [37]. The SCC values in THB/tCO2eq units from 2020 to 2050 are detailed in Table 6. It is important to note that these values tend to increase over time as GHG emissions accumulate continuously. Consequently, as time progresses, the anticipated damages from climate change would be expected to be larger in the future.

Table 6.
Social cost of carbon (THB2015/tCO2eq) between 2020 to 2050.
4.3. Optimal Degrees of Greenhouse Gas Mitigation
The results of the optimal degrees of GHG mitigation consisted of two sections: (i) the GHG emission mitigation target and (ii) the optimal degrees of abatement. The details are as follows.
4.3.1. Emission Mitigation Target
The estimation of the GHG emission mitigation targets for the industry and power sectors from 2020 to 2050 was calculated from the differences between the forecasted GHG emissions in a BAU scenario and a net-zero emission scenario within each sector. The average growth rates for the emission mitigation targets in each sector are summarized as follows: In Scenario 1, the power sector had a 3.38% growth rate, while the industry sector had a 3.07% growth rate. In Scenario 2, the power sector had a 3.46% growth rate with the industry sector having a 3.12% growth rate. In Scenario 3, the power sector had a 3.55% growth rate, whereas the industry sector had a 2.97% growth rate. Lastly, in Scenario 4, the power sector had a 3.86% growth rate, and the industry sector had a 2.21% growth rate. The GHG mitigation target was estimated as shown in Table 7.

Table 7.
Greenhouse gas mitigation targets and potential covering from 2020 to 2050.
4.3.2. Optimal Degrees of Abatement
The results concerning the GHG mitigation targets and potential for each scenario within both the power and industrial sectors, including a comparison of the mitigation targets and potentials under implemented technologies or policies are shown in Table 7. In Scenario 1, the GHG mitigation potential of the power sector from 2020 to 2025 was achieved for the target. However, from 2030 to 2045, the GHG mitigation potential was lower than the target, but in 2050 it was sufficient for the target. For the industrial sector, the GHG mitigation potential remained sufficient for the 2020–2050 target. Based on the analysis of both sectors in Scenario 1, it would appear that the GHG mitigation potential was adequate for the mitigation target. In Scenario 2, it became evident that the mitigation potential of both the power and industrial sectors was sufficient for the mitigation target every year. In the overview of the two sectors, the GHG mitigation potential was sufficient to meet the mitigation target. In Scenario 3, the GHG mitigation potential of both the power and industrial sectors remained sufficient to meet the mitigation target. Finally, in Scenario 4, the GHG mitigation potential of the two sectors was sufficient to meet the mitigation target. When examining the results from all the scenarios in both sectors, the analysis yielded two cases:
- Case 1: The GHG mitigation potential surpassed or would be sufficient to meet the GHG mitigation target. In this situation, the prioritization of the GHG mitigation could arrange technologies that could be applied based on the MACC. Consequently, there would be no need to utilize all the technologies or their full potential to achieve the GHG mitigation.
- Case 2: The GHG mitigation potential would be below the mitigation target. In this situation, the GHG mitigation efforts would encompass the utilization of all available technologies. Additionally, it would become necessary to introduce supplementary technologies or measures accompanied by the consideration of setting alternative mechanisms in various forms, including the utilization of the SCC in the decision-making processes aimed at attaining the mitigation target.
If the GHG mitigation potential was insufficient for the mitigation target, as observed in Scenario 1 (2030–2045) for the power sector, the utilization of all technologies in the MACC would become necessary. Furthermore, the implementation of additional technologies or measures would be required to achieve the GHG mitigation target. Additionally, it would be essential to consider other mechanisms in various forms using the SCC for adopting the specific policy, such as emissions trading systems or carbon taxes to drive the investment decisions in the GHG mitigation technologies to be in alignment with the MACC.
Figure 7, Figure 8 and Figure 9 illustrate the optimal degrees of abatement technology deployment in the power sector. It is evident that in 2030, certain technologies will exhibit positive MAC values, including electricity generation from solar PV and farms, floating solar, and smart boiler. Between 2035–2040, electricity generation from floating solar and smart boiler will maintain positive MAC values, while in 2045, smart boilers, CCS, and BECCS will also have positive MAC values. In the power sector, the MAC values of some technologies initially in the positive range will gradually transition to negative values over time due to technological advancements and market mechanisms. For example, wind power will follow this trend, except for smart boilers, CCS, and BECCS, which will remain on the positive axis due to their higher costs. If policymakers intend to implement these technologies before they reach the break-even point through market mechanisms, they should also take the SCC into account as a crucial factor.
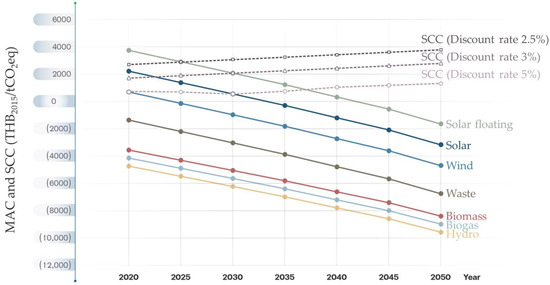
Figure 7.
Optimal degrees of renewable energy in power sector between MAC and SCC.
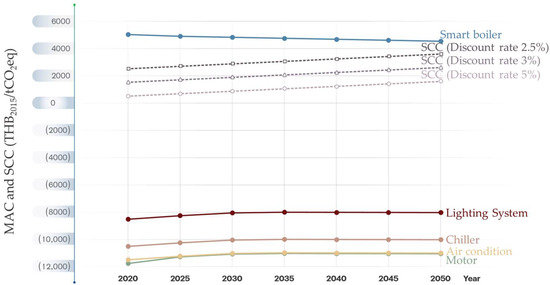
Figure 8.
Optimal degrees of energy efficiency improvement in power sector between MAC and SCC.
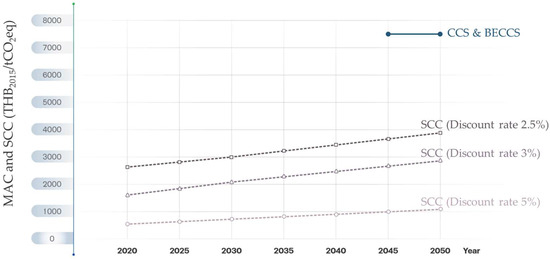
Figure 9.
Optimal degrees of CCS and BECCS in power sector between MAC and SCC.
For electricity generation from solar energy, the point at which the investment would break even with the cost of climate change damage would occur in 2023. This would signify that delaying investment beyond this year would result in more severe climate-change-related damage. Hence, it should set a value at an appropriate SCC of approximately 1882 THB2015/tCO2eq (3% discount rate). Regarding electricity generation from floating solar, the optimal time for implementation would be around 2025, at which point the SCC value should be set at approximately 2806 THB2015/tCO2eq (2.5% discount rate).
When considering smart boilers, CCS, and BECCS, the SCC should surpass the MAC value for all three technologies with an approximate value of 5000 THB2015/tCO2eq for smart boilers and 7500 THB2015/tCO2eq for CCS and BECCS. Alternatively, supplementary mechanisms could be required, apart from the SCC, tailored to specific sectors or subsectors.
While the SCC mechanism would be effective in driving investment in certain GHG-reducing technologies to meet the country’s emissions targets, the power sector would still face challenges in reducing GHG emissions. To address this, the power sector would need to take further actions, such as transitioning from fossil fuel power generation to natural gas or renewable energy sources as soon as possible. Additionally, there would be a need for grid-flexible power generation and an increased focus on generating electricity from renewable sources beyond the country’s current plan. Alternatively, if the energy type for electricity generation remained unchanged, implementing CCS and BECCS, despite their high investment costs, would become necessary to achieve the national emissions targets. This might also include considering the adoption of hydrogen technology after 2030.
In contrast, the industrial sector has sufficient GHG mitigation potential to meet its targets, and some technologies may not need to be fully implemented as initially estimated. However, in certain power sector scenarios, the GHG mitigation potential would be insufficient for the target. To compensate for this, industrial sector technologies not originally chosen could be considered, particularly those in the positive axis of the MACC, such as heat generation from biogas and smart boilers, which represented around 7.81% and 2.58% of all implementable technologies in the industrial sector, respectively. These could help compensate for the missing ones in the power sector.
Figure 10 depicts the optimal degrees of renewable energy technology in the industrial sector, while energy efficiency technology, including CCS and BECCS, can be seen in Figure 8 and Figure 9. Likewise with the power sector, if the industrial sector intends to implement technologies from the positive axis of the MACC, the SCC should be taken into account. For instance, the optimal degrees of abatement for heat generation from biogas technology are projected to occur around 2027, with an SCC value set at approximately 650 THB2015/tCO2eq (5% discount rate). However, the initiation implementation of smart boiler technologies would require an SCC higher than the MAC of smart boilers of around 5000 THB2015/tCO2eq, and approximately 7500 THB2015/tCO2eq for CCS and BECCS, or use alternative mechanisms beyond the SCC for specific sectors or subsectors.
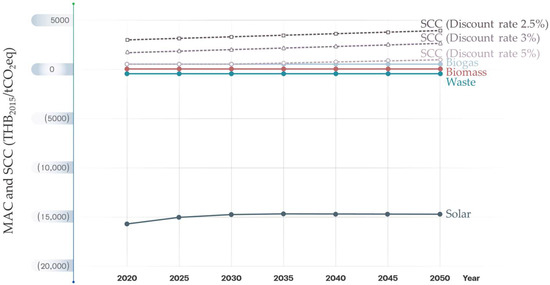
Figure 10.
Optimal degrees of renewable energy in industry sector.
5. Conclusions and Policy Recommendation
This research aimed to find Thailand’s optimal degree of GHG mitigation by taking into consideration both the associated MAC and the SCC. This evaluated the energy efficiency and renewable energy technologies in the industrial and power sectors and provided policy recommendations aligned with national policies and plans for the period from 2020 to 2050. Furthermore, the results of this research could inform the identification of appropriate policies and measures by considering both the technological potential for GHG mitigation and the economic aspects for shaping plans, policies, roadmaps, and action plans. These insights could serve as valuable guidelines to effectively facilitate the achievement of the nation’s GHG mitigation target in the short, medium, and long term.
Despite employing the SCC mechanism to incentivize investments in potential technologies capable of GHG reduction to meet national mitigation targets, the power sector still contends with challenges in curbing and mitigating GHG emissions. Further addressing this issue would necessitate a transition to grid-flexible power generation and an intensified focus on generating electricity from renewable sources more than the current country’s national plan has specified. Alternatively, if electricity generation remains unchanged, the installation of CCS and BECCS would become imperative. Despite their substantial initial investment costs, such measures would be essential to achieve the country’s mitigation targets and could even involve the operating of hydrogen technology post-2030.
The industrial sector has sufficient GHG mitigation potential to meet its target. However, in Scenario 1 of the power sector, there were some years with GHG mitigation potentials below the target. To compensate for this deficit and ensure the country’s overall target is met, additional measures would be necessary for implementation from the industry sector. This would entail considering the SCC mechanism to incentivize investments in the required technologies or implementing other energy-in-transition technologies like CCS, BECCS, and hydrogen. The policy recommendations are as follows:
5.1. Policy and Plan
- Thailand still lacks an internalization of the externality cost into the energy price or tariffs. This makes the current price too low, which reflects the implementation of energy efficiency equipment or renewable energy technologies. The environmental cost should also be considered in major energy types, i.e., electricity tariffs and the price petroleum products. This would change the MAC curve pattern in low-carbon technologies and would shift the optimal point in a positive way.
- The climate-related institutional framework should be uplifted from the division level to the department level by restructuring ministerial administrative agencies associated with climate change under ONEP. This would have a positive effect on all climate activities both in mitigation and adaptation, including the adoption of legislation.
- Short-term: Monitoring and control agencies should be encouraged to expand structures from division-based to department-based while remaining under the Ministry of Natural Resources and Environment (MONRE). Additionally, it would be essential to grant legal authority to these departments, thus enabling them to access relevant data from other related agencies.
- Long-term: the Department of Climate Change and Environment (DCCE) should be transferred to be under the Prime Minister’s Office for accessing GHG data from various agencies as well as for the agility of the implementation.
- The current climate target policy should be adjusted by considering the MAC and SCC, and the regulations related to the mitigation and adaptation actions should be immediately adopted.
- Short-term by policy: The new mitigation target in the industry and power sectors should be improved and adopted to be balanced between the mitigation target and the potential from the current MAC. Other sectors, e.g., the service sector, should be reconsidered in this circumstance.
- Long-term by regulation: a fundamental mandatory driver for GHG mitigation could be established through the enactment of a Climate Change Act, which would specify sector-specific targets with a particular emphasis on the industry and power sectors, which are the sectors with high emissions and mitigation potential.
- Knowledge should be disseminated among agencies to align ministerial policies and plans with national climate change policies and strategies, thus ensuring that agencies not only prioritize cost-effectiveness but also comprehend and emphasize investment considerations.
5.2. Technology and Implementation
- A specific technology roadmap should be developed, which would lead Thailand into meeting its NDC and net-zero target, i.e., hydrogen and ammonia or CCUS.
- A platform that could help factories to access the latest technology data and costs with user-friendly investment decisions should be developed. This would accelerate the investment of low-carbon technology in the industrial sector.
- Additional financial support mechanisms should be set, e.g., carbon tax collection or carbon credit for important technologies, such as smart boilers, CCS, and hydrogen.
- MAC and SCC data should be updated frequently, and Thailand should estimate its own SCC for a more precise evaluation.
- Technology selection should be based on the MAC by focusing on the mitigation potential and urgency to drive the country toward carbon neutrality and net-zero GHG emissions.
Supplementary Materials
The following supporting information can be downloaded at: https://www.mdpi.com/article/10.3390/su16010160/s1, Figure S1: Marginal abatement cost curve of GHG technology in industry sector in 2020; Figure S2: Marginal abatement cost curve of GHG technology in industry sector in 2025; Figure S3: Marginal abatement cost curve of GHG technology in industry sector in 2030; Figure S4: Marginal abatement cost curve of GHG technology in industry sector in 2035; Figure S5: Marginal abatement cost curve of GHG technology in industry sector in 2040; Figure S6: Marginal abatement cost curve of GHG technology in industry sector in 2045; Figure S7: Marginal abatement cost curve of GHG technology in industry sector in 2050; Figure S8: Marginal abatement cost curve of GHG technology in power sector in 2020; Figure S9: Marginal abatement cost curve of GHG technology in power sector in 2025; Figure S10: Marginal abatement cost curve of GHG technology in power sector in 2030; Figure S11: Marginal abatement cost curve of GHG technology in power sector in 2035; Figure S12: Marginal abatement cost curve of GHG technology in power sector in 2040; Figure S13: Marginal abatement cost curve of GHG technology in power sector in 2045; Figure S14: Marginal abatement cost curve of GHG technology in power sector in 2050.
Author Contributions
Conceptualization, P.M. and W.W.; methodology, P.M. and W.W.; software, P.M.; validation, P.M., W.W., T.J. and C.R.; formal analysis, P.M.; investigation, P.M.; resources, P.M., S.D. and W.T.; data curation, P.M.; writing—original draft preparation, P.M.; writing—review and editing, P.M. and W.W.; visualization, P.M.; supervision, W.W; project administration, P.M. All authors have read and agreed to the published version of the manuscript.
Funding
This research received no external funding.
Institutional Review Board Statement
Not applicable.
Informed Consent Statement
Not applicable.
Data Availability Statement
The data used to support the findings of this study are included within the article.
Acknowledgments
The authors would like to thank all relevant agencies for information. We remain culpable for any remaining errors. This research work was partially supported by Chiang Mai University.
Conflicts of Interest
The authors declare no conflict of interest.
Appendix A

Table A1.
The relevant assumptions.
Table A1.
The relevant assumptions.
| Sector | Measures Type | Type | Baseline Scenario (BS) | Policy Scenario (PS) | Plant Factor (PF) (%) [54] | Working Hours (Hours per Year) | Discount Rate (%) [55] | Data Year/ Source (Annual) | ||||
|---|---|---|---|---|---|---|---|---|---|---|---|---|
| Baseline | O&M (%) 1 | Technology Lifetime (Years) | Policy | O&M (%) 1 | Technology Lifetime (Years) | |||||||
| Industry | Renewable energy | Solar energy | Electricity | 10% | 15 | Solar energy | 5% | 15 | N/A | 2555 | 4% | 2012–2015 [56] |
| Biomass | Coal | 10% | 15 | Biomass | 10% | 15 | N/A | 8760 | 4% | 2013–2017 [57] | ||
| Biogas | 10% | 15 | Biogas | 10% | 15 | N/A | 8760 | 4% | 2009–2017 [57] | |||
| Waste | 10% | 15 | Waste (RDF) | 10% | 15 | N/A | 2920 | 4% | 2008–2017 [58,59] | |||
| Energy efficiency | Motor | Standard efficiency motor available on the market (IE1) | 5% | 4.5 | High efficiency motor | 5% | 8 | N/A | 8760 | 5% | 2019–2022 | |
| Lighting | Fluorescent | 5% | 1.5 | Light emitting diode (LED) | 5% | 5 | N/A | 8760 | 5% | 2015–2022 | ||
| Incandescent bulb | 5% | 1 | 5% | 2 | N/A | 8760 | 5% | |||||
| Mercury-vapor lamp | 5% | 1 | 5% | 1.5 | N/A | 8760 | 5% | |||||
| Compact fluorescent bulb (CFL) | 5% | 1 | 5% | 2 | N/A | 8760 | 5% | |||||
| High intensity discharge bulb | 5% | 1 | 5% | 1.5 | N/A | 8760 | 5% | |||||
| Tungsten halogen Lamp | 5% | 0.5 | 5% | 2 | N/A | 8760 | 5% | |||||
| Air condition | Minimum efficiency air conditioner available on the market (No.5) | 5% | 10 | High efficiency air conditioner (No.5 - one star or more) | 5% | 10 | N/A | 8760 | 5% | 2018–2022 | ||
| Chiller | Minimum efficiency chiller available on the market | 5% | 20 | High efficiency chiller | 5% | 20 | N/A | 8760 | 5% | 2022 | ||
| Boiler | Boiler available on the market | 10% | 15 | Smart boiler 2 | 10% | 15 | N/A | 8760 | 5% | 2013 | ||
| Power | Electricity generation from renewable energy | Solar energy | Natural gas and coal | 0.59–2% | 25 | Solar energy | 0.59–2% | 25 | 15–16 | 8760 | 4.5% | 2012–2015 [60] |
| Wind power | 2% | 25 | Wind power (All scale) | 2% | 20 | 18 | 8760 | 4.5% | 2012–2013 [60] | |||
| Hydro energy | 4% | 25 | Hydro energy (Installed capacity ≤ 200 kW) | 4% | 20 | 44 | 8760 | 4.5% | 1981–2007 [61,62,63,64] | |||
| Biomass | 6–7.5% | 25 | Biomass (Installed capacity ≤ 1/1 to 3/> 3 MW) | 6–7.5% | 20 | 70 | 8760 | 4.5% | 2007–2014 [60,64] | |||
| Biogas | 5% | 25 | Biogas (Wastewater/Waste/Energy crop) | 5% | 20 | 70–78 | 8760 | 4.5% | 2008–2016 [60,64] | |||
| Waste | 1.5–12.5% | 25 | Waste (Installed capacity ≤ 1/1 to 3/> 3 MW) | 1.5–12.5% | 20 | 70 | 8760 | 4.5% | 2012–2014 [60] | |||
| Energy efficiency | The assumption is similar to that of the industry sector. | |||||||||||
1 Operation and maintenance costs were estimated as a percentage of investment cost. 2 Smart boilers, in this study, are also known as central heating boilers with smart controls and smart heating controls, which give factories precise control over the boiler operation, e.g., temperature, pressure, and mass flow rate of steam.
References
- The Office of Natural Resources and Environmental Policy and Planning (ONEP), Ministry of Natural Resources and Environment. Thailand Fourth National Communication (NC4); The Office of Natural Resources and Environmental Policy and Planning (ONEP), Ministry of Natural Resources and Environment: Bangkok, Thailand, 2022. [Google Scholar]
- The Office of Natural Resources and Environmental Policy and Planning (ONEP), Ministry of Natural Resources and Environment. Thailand’s Nationally Determined Contribution Roadmap on Mitigation (NDC Roadmap); The Office of Natural Resources and Environmental Policy and Planning (ONEP), Ministry of Natural Resources and Environment: Bangkok, Thailand, 2017. [Google Scholar]
- Thailand’s 2nd Updated Nationally Determined Contribution. Thailand Greenhouse Gas Management Organization (Public Organization) (TGO). Available online: https://shorturl.asia/wFBfT (accessed on 2 December 2022).
- The Office of Natural Resources and Environmental Policy and Planning (ONEP), Ministry of Natural Resources and Environment, Thailand’s Long-term Low Greenhouse Gas Emission Development Strategy. Available online: https://unfccc.int/sites/default/files/resource/Thailand%20LT-LEDS%20%28Revised%20Version%29_08Nov2022.pdf (accessed on 30 September 2022).
- Energy Policy and Planning Office (EPPO), Ministry of Energy, Thailand Integrated Energy Blueprint (TIEB). Available online: https://www.eppo.go.th/index.php/en/component/k2/item/11449-faq1 (accessed on 30 September 2022).
- Department of Alternative Energy Development and Efficiency (DEDE), Ministry of Energy. Energy Balance of Thailand 2021; Department of Alternative Energy Development and Efficiency (DEDE), Ministry of Energy: Bangkok, Thailand, 2021.
- Tassawan, J. Sustainability Index Evaluation of Thai Energy System with Alternative Energy Measures. Ph.D. Thesis, Chiang Mai University, Chang Wat Chiang Mai, Thailand, July 2022. [Google Scholar]
- Energy Policy and Planning Office (EPPO), Ministry of Energy. Power Development Plan 2018–2037 (PDP2018); Energy Policy and Planning Office (EPPO), Ministry of Energy: Bangkok, Thailand, 2020.
- Department of Alternative Energy Development and Efficiency (DEDE), Ministry of Energy. Energy Efficiency Plan 2018–2037 (EEP2018); Department of Alternative Energy Development and Efficiency (DEDE), Ministry of Energy: Bangkok, Thailand, 2020.
- Department of Alternative Energy Development and Efficiency (DEDE), Ministry of Energy. Alternative Energy Development Plan 2018–2037 (AEDP2018); Department of Alternative Energy Development and Efficiency (DEDE), Ministry of Energy: Bangkok, Thailand, 2020.
- Department of National Park Wildlife and Plant Conservation, Paris Agreement. Available online: http://reddplus.dnp.go.th/?p=2239 (accessed on 29 October 2020).
- Thailand Greenhouse Gas Management Organization (Public Organization) (TGO). Nationally Appropriate Mitigation Action (NAMA); Thailand Greenhouse Gas Management Organization (Public Organization) (TGO): Bangkok, Thailand, 2015.
- Songwut, P.; Wongkot, W. The demand for energy in the manufacturing sector of Thailand. In Proceedings of the Technology and Innovation for Sustainable Development Conference, Khon Kaen, Thailand, 28–29 January 2008. [Google Scholar]
- Wongkot, W. Performance Tracking of Thailand’s Energy Management System under Energy Conservation Promotion Act. Energy Procedia 2016, 100, 448–451. [Google Scholar]
- Wongkot, W.; Chaichan, R.; Jakapong, P. Integrated model for energy and CO2 emissions analysis from Thailand’s long-term low carbon energy efficiency and renewable energy plan. Energy Procedia 2016, 100, 492–495. [Google Scholar]
- John, W. Integrated assessment of climate change: State of the literature. J. Benefit Cost Anal. 2014, 5, 377–409. [Google Scholar]
- Moran, D.; MacLeod, M.; Wall, E.; Eory, V.; Pajot, G.; Matthews, R.; McVittie, A.; Barnes, A.P.; Rees, R.M.; Moxey, A.P.; et al. UK Marginal Abatement Cost Curves for the Agriculture and Land Use, Land-Use Change and Forestry Sectors out to 2022, with Qualitative Analysis of Options to 2050; Scottish Agricultural College Commercial: Edinburgh, UK, 2008. [Google Scholar]
- Jose, L.P.-T.; Andrea, V.P.-H.; Alejandro, S.-B. The problem of ranking CO2 abatement measures: A methodological proposal. Sustain. Cities Soc. 2016, 26, 306–317. [Google Scholar]
- Isacs, L.; Finnveden, G.; Dahllöf, L.; Hakansson, C.; Petersson, L.; Steen, B.; Swanström, L.; Wikström, A. Choosing a monetary value of greenhouse gases in assessment tools. J. Clean. Prod. 2016, 127, 37–48. [Google Scholar] [CrossRef]
- Fei, T.; Xin, W.; Xunzhang, P.; Xi, Y. Understanding marginal abatement cost curves in energy-intensive industries in China: Insights from comparison of different models. Energy Procedia 2014, 61, 318–322. [Google Scholar]
- McKinsey&Company. Pathways to a Low Carbon Economy Version 2 of the Global Greenhouse Gas Abatement Cost Curve; McKinsey&Company: Chicago, IL, USA, 2007. [Google Scholar]
- Petra, W. The Usefulness of Marginal CO2-e Abatement Cost Curves in Austria. Energy Policy 2013, 61, 1116–1126. [Google Scholar]
- De Souza, J.F.T.; De Oliveira, B.P.; Ferrer, J.T.V.; Pacca, S.A. Industrial low carbon futures: A regional marginal abatement cost curve for Sao Paulo, Brazil. J. Clean. Prod. 2018, 200, 680–686. [Google Scholar] [CrossRef]
- Yue, X.; Deane, J.P.; O’Gallachoir, B.; Rogan, F. Identifying decarbonisation opportunities using marginal abatement cost curves and energy system scenario ensembles. Appl. Energy 2020, 276, 115456. [Google Scholar] [CrossRef]
- Nadine, I.; Christopher, K. A Methodology for Constructing Marginal Abatement Cost Curves for Climate Action in Cities. Energies 2016, 9, 227. [Google Scholar]
- Kamphol, P.; Pornphimol, W.; Bundit, L.; Toshihiko, M.; Tatsuya, H.; Yuzuru, M. CO2 mitigation potential and marginal abatement costs in Thai residential and building sectors. Energy Build. 2014, 80, 631–639. [Google Scholar]
- Juan, P.; Bi-Ying, Y.; Hua, L.; Yi-Ming, W. Marginal abatement costs of CO2 emissions in the thermal power sector: A regional empirical analysis from China. J. Clean. Prod. 2018, 171, 163–174. [Google Scholar]
- Jiakui, C.; Dong, X. Carbon efficiency and carbon abatement costs of coal-fired power enterprises: A case of Shanghai, China. J. Clean. Prod. 2019, 206, 452–459. [Google Scholar]
- Xi, Y.; Xiaoqian, X.; Shan, G.; Wanqi, L.; Xiangzhao, F. Carbon Mitigation Pathway Evaluation and Environmental Benefit Analysis of Mitigation Technologies in China’s Petrochemical and Chemical Industry. Energies 2018, 11, 3331. [Google Scholar]
- Bei, G.; Zuoren, S. Marginal CO2 and SO2 Abatement Costs and Determinants of Coal-Fired Power Plants in China: Considering a Two-Stage Production System with Different Emission Reduction Approaches. Energies 2023, 16, 3488. [Google Scholar]
- He, X.; Qingpeng, W.; Hailin, W. Marginal abatement cost and carbon reduction potential outlook of key energy efficiency technologies in China’s building sector to 2030. Energy Policy 2014, 69, 92–105. [Google Scholar]
- Govinda, R.T.; Anna, S.; Eduard, K.; Suren, S. Development of marginal abatement cost curves for the building sector in Armenia and Georgia. Energy Policy 2017, 108, 29–43. [Google Scholar]
- Jan, A.; Mirjam, K.; Sebastian, R. Carbon abatement with renewable: Evaluating wind and solar subsidies in Germany and Spain. J. Public Econ. 2019, 169, 172–202. [Google Scholar]
- Phitsinee, M.; Wongkot, W.; Rongphet, B.; Neeracha, T.; Det, D.; Chaichan, R. Marginal Abatement Cost of Electricity Generation from Renewable Energy in Thailand. Energy Rep. 2020, 6, 767–773. [Google Scholar]
- Phitsinee, M.; Wongkot, W.; Rongphet, B.; Neeracha, T.; Chaichan, R.; Det, D. Assessment of Carbon Reduction Costs in Renewable Energy Technologies for Heat Generation in Thailand. Energy Rep. 2021, 7, 366–373. [Google Scholar]
- Phitsinee, M.; Wongkot, W.; Rongphet, B.; Neeracha, T.; Chaichan, R.; Det, D.; Ornvara, B. Estimation of Marginal Abatement Subsidization Cost of Renewable Energy for Power Generation in Thailand. Energy Rep. 2022, 8, 528–535. [Google Scholar]
- Bank of Thailand (BOT), Headline Consumer Price Index. Available online: https://www.bot.or.th/App/BTWS_STAT/statistics/BOTWEBSTAT.aspx?reportID=409&language=ENG (accessed on 28 September 2022).
- The Social Cost of Carbon. Available online: https://www.oecd-ilibrary.org/sites/9789264085169-17-en/index.html?itemId=/content/component/9789264085169-17-en#fig14.1 (accessed on 28 September 2022).
- Howarth, R.B.; Gerst, M.D.; Borsuk, M.E. Risk mitigation and the social cost of carbon. Glob. Environ. Chang. 2014, 24, 123–131. [Google Scholar] [CrossRef]
- Van den Bergh, J.C.; Botzen, W.J.W. Monetary valuation of the social cost of CO2 emissions: A critical survey. Ecol. Econ. 2015, 114, 33–46. [Google Scholar] [CrossRef]
- Yang, P.; Yao, Y.-F.; Mi, Z.; Cao, Y.-F.; Liao, H.; Yu, B.-Y.; Liang, Q.-M.; Coffman, M.; Wei, Y.-M. Social cost of carbon under shared socioeconomic pathways. Glob. Environ. Chang. 2018, 53, 225–232. [Google Scholar] [CrossRef]
- Khastar, M.; Aslani, A.; Nejati, M. How does carbon tax affect social welfare and emission reduction in Finland? Energy Rep. 2020, 6, 736–744. [Google Scholar] [CrossRef]
- Krishna, T.M.; Sowlati, T. Impact of carbon pricing policies on the cost and emission of the biomass supply chain: Optimization models and a case study. Appl. Energy 2020, 267, 115069. [Google Scholar]
- Witsarut, A.; Pana, S.; Thongchai, F.; Yuttana, M.; Sarunnoud, P.; Korrakot, Y.T. The social cost of different automotive powertrains: A comparative case study of Thailand. Energy Rep. 2023, 9, 1144–1151. [Google Scholar]
- The Office of Natural Resources and Environmental Policy and Planning (ONEP), Ministry of Natural Resources and Environment. Thailand’s Third Biennial Update Report (BUR); The Office of Natural Resources and Environmental Policy and Planning (ONEP), Ministry of Natural Resources and Environment: Bangkok, Thailand, 2020. [Google Scholar]
- The Office of Natural Resources and Environmental Policy and Planning (ONEP), Ministry of Natural Resources and Environment. Thailand’s First Biennial Update Report (BUR); The Office of Natural Resources and Environmental Policy and Planning (ONEP), Ministry of Natural Resources and Environment: Bangkok, Thailand, 2015. [Google Scholar]
- The Office of Natural Resources and Environmental Policy and Planning (ONEP), Ministry of Natural Resources and Environment. Thailand’s Second Biennial Update Report (BUR); The Office of Natural Resources and Environmental Policy and Planning (ONEP), Ministry of Natural Resources and Environment: Bangkok, Thailand, 2018. [Google Scholar]
- The Office of Natural Resources and Environmental Policy and Planning (ONEP), Ministry of Natural Resources and Environment. Thailand’s Forth Biennial Update Report (BUR); The Office of Natural Resources and Environmental Policy and Planning (ONEP), Ministry of Natural Resources and Environment: Bangkok, Thailand, 2022. [Google Scholar]
- The Office of Natural Resources and Environmental Policy and Planning (ONEP), Greenhouse Gas Reduction. Available online: https://climate.onep.go.th/th/topic/database/migation-measures/ (accessed on 30 September 2022).
- The Intergovernmental Panel on Climate Change, the Sixth Assessment Report (AR6). Available online: https://www.ipcc.ch/meeting-doc/ipcc-wgiii-14-and-ipcc-56/ (accessed on 16 December 2022).
- Resources for the Future, Social Cost of Carbon 101. Available online: https://www.rff.org/publications/explainers/social-cost-carbon-101/ (accessed on 2 November 2022).
- Interagency Working Group on Social Cost of Carbon, United States Government. Technical Support Document: Social Cost of Carbon for Regulatory Impact Analysis; Interagency Working Group on Social Cost of Carbon, United States Government: Washington, DC, USA, 2010.
- Bank of Thailand (BOT), Rates of Exchange. Available online: https://www.bot.or.th/App/BTWS_STAT/statistics/ReportPage.aspx?reportID=123&language=eng (accessed on 28 September 2022).
- Energy Policy and Planning Office (EPPO), Ministry of Energy. Power Development Plan 2015–2036 (PDP2015); Energy Policy and Planning Office (EPPO), Ministry of Energy: Bangkok, Thailand, 2015.
- Thailand Greenhouse Gas Management Organization (Public Organization) (TGO). A Project to Study the Appropriate Discount Rate Determination for Assessing the GHG Reduction Potential at the Measure Level; Thailand Greenhouse Gas Management Organization (Public Organization) (TGO): Bangkok, Thailand, 2020.
- Electricity Generating Authority of Thailand (EGAT). Available online: http://www4.egat.co.th/re/egat_business/egat_heater/heater_price.htm (accessed on 30 September 2020).
- Department of Alternative Energy Development and Efficiency (DEDE), Ministry of Energy. Study Project of Renewable Heat Incentive (RHI) to Promote the Use of Renewable Energy; Department of Alternative Energy Development and Efficiency (DEDE), Ministry of Energy: Bangkok, Thailand, 2013.
- Department of Alternative Energy Development and Efficiency (DEDE), Ministry of Energy. Research Project and Development on Refuse Derived Fuel (RDF); Department of Alternative Energy Development and Efficiency (DEDE), Ministry of Energy: Bangkok, Thailand, 2008.
- Thailand Greenhouse Gas Management Organization (Public Organization) (TGO). A Project to Study the Estimation of Marginal Abatement Cost for Greenhouse Gas Mitigation from National Policy and Measure Project (Phase III); Thailand Greenhouse Gas Management Organization (Public Organization) (TGO): Bangkok, Thailand, 2020.
- Energy Policy and Planning Office (EPPO), Ministry of Energy. Final Report in the Project Support for The Review of the Cost of Electricity Purchase in the Form of Feed-in Tariff; Energy Policy and Planning Office (EPPO), Ministry of Energy: Bangkok, Thailand, 2015.
- Clean Development Mechanism (CDM), UNFCCC. Available online: https://cdm.unfccc.int/Projects/DB/RWTUV1355821731.47/view (accessed on 30 September 2022).
- Clean Development Mechanism (CDM), UNFCCC. Available online: https://cdm.unfccc.int/Projects/DB/RWTUV1359566248.84/view (accessed on 30 September 2022).
- Clean Development Mechanism (CDM), UNFCCC. Available online: https://cdm.unfccc.int/Projects/DB/RWTUV1359567174.34/view (accessed on 30 September 2022).
- Thailand Greenhouse Gas Management Organization (Public Organization) (TGO). A Project to Study the Estimation of Marginal Abatement Cost for Greenhouse Gas Mitigation from National Policy and Measure Project (Phase II); Thailand Greenhouse Gas Management Organization (Public Organization) (TGO): Bangkok, Thailand, 2019.
Disclaimer/Publisher’s Note: The statements, opinions and data contained in all publications are solely those of the individual author(s) and contributor(s) and not of MDPI and/or the editor(s). MDPI and/or the editor(s) disclaim responsibility for any injury to people or property resulting from any ideas, methods, instructions or products referred to in the content. |
© 2023 by the authors. Licensee MDPI, Basel, Switzerland. This article is an open access article distributed under the terms and conditions of the Creative Commons Attribution (CC BY) license (https://creativecommons.org/licenses/by/4.0/).