Article

Requirement on the Capacity of Energy Storage to Meet the 2 °C Goal

1
Shanghai Key Laboratory of Atmospheric Particle Pollution and Prevention (LAP3), Department of Environmental Science and Engineering, Fudan University, Shanghai 200438, China
2
Sciences Laboratory of Climate and the Environment (LSCE), Atomic Energy and Alternative Energies Commission (CEA)/French National Centre for Scientific Research (CNRS)/University of Versailles Saint-Quentin-en-Yvelines (UVSQ), Paris-Saclay University, 91190 Gif-sur-Yvette, France
3
Climate and Atmosphere Research Center (CARE-C), The Cyprus Institute, Nicosia 2121, Cyprus
4
IRDR International Center of Excellence on Risk Interconnectivity and Governance on Weather/Climate Extremes Impact and Public Health, Fudan University, Shanghai 200438, China
5
Institute of Atmospheric Sciences, Fudan University, Shanghai 200438, China
6
Shanghai Frontiers Science Center of Atmosphere-Ocean Interaction, Shanghai 200438, China
7
MOE Laboratory for National Development and Intelligent Governance, Fudan University, Shanghai 200438, China
8
Institute of Eco-Chongming (IEC), Shanghai 200062, China
*
Author to whom correspondence should be addressed.
Sustainability 2024, 16(9), 3753; https://doi.org/10.3390/su16093753
Submission received: 20 March 2024 / Revised: 16 April 2024 / Accepted: 26 April 2024 / Published: 30 April 2024

Abstract

:
The inherent power fluctuations of wind, photovoltaic (PV) and bioenergy with carbon capture and storage (BECCS) create a temporal mismatch between energy supply and demand. This mismatch could lead to a potential resurgence of fossil fuels, offsetting the effects of decarbonization and affecting the realization of the Paris target by limiting global warming to below 2 °C in the 21st century. While application of energy storage is widely recommended to address this limitation, there is a research gap to quantify the impacts of energy storage limitation on global warming. Here, we analyzed the hourly variation of global wind and PV power during the period 1981–2020 and the monthly capacity of biomass production in 2019, and thus quantified the impact of decreasing the capacity of energy storage on global warming using a state-of-the-art Earth system model. We found that global warming by 2100 in the SSP1-2.6 scenario would increase by about 20% and exceed 2 °C without deploying energy storage facilities. Achieving the 2 °C target requires reducing power losses of wind and PV by at least 30% through energy storage. This requirement delivers to a cumulative storage capacity of 16.46 TWh using batteries during the period 2021–2100, leading to the international trade of cobalt and manganese across countries due to deficits of minerals at a country level. In the context of energy security, we highlight the importance of considering the limitations of energy storage and mineral shortage in the forthcoming policies of decarbonization.

1. Introduction

Greenhouse gas (GHG) emissions have led to global warming and climate change at an unprecedented rate in recorded history [1]. The Paris Agreement, aimed at coping with climate change, establishes a target of limiting global warming to below 2 °C within the 21st century [2]. GHGs, primarily carbon dioxide (CO2) emitted from the combustion of fossil fuels, contribute to global warming by reducing the amount of outgoing longwave radiation to space [3]. Phasing down fossil fuels at the global scale is essential to reducing CO2 emissions to limit global warming [4]. To achieve this target, numerous countries have accelerated the transition from fossil fuels to renewable energy [5,6,7]. Wind and photovoltaic (PV) technologies are considered to be cost-effective among various renewable energy sources [8,9], while bioenergy with carbon capture and storage (BECCS) is essential to achieve a high probability of limiting global warming to below 2 °C [10]. However, the temporal power fluctuations of wind, PV, and BECCS form significant challenges to achieve the planned target of CO2 emission reduction by threatening energy security [11,12,13]. Wind turbines harness energy from turbulent wind, which varies in both speed and direction [14]. PV panels convert sunlight into electricity, but the power generation depends on solar radiation that can be received by the panels [15]. Power generation of bioenergy relies on the feedstocks of biomass, where the season of harvest varies by crop and region [16]. To address the problem of power fluctuations, facilities of energy storage (e.g., hydro pump or batteries) are always developed to help provide a reliable supply of wind and PV power [17,18], while biomass can be stored by direct stockpiling [19]. Although the limited capacities of energy storage when deploying renewable energy to reduce CO2 emissions have been recognized in the literature [20,21], the limitation on meeting the climate targets due to a shortage of energy storage remains underexplored due to an absence of consideration of the temporal power fluctuations of renewable energy in Earth system models.
To bridge this gap, we predicted the effects of reducing the consumption of fossil fuels on global warming by considering the temporal fluctuations of both the power supply by wind, PV, and bioenergy and the power demand at the end-use sectors in a compact Earth system model OSCAR v3.1 [22,23,24]. This study aims to provide insights on the requirement of energy storage for achieving various climate targets by quantitatively assessing the impact of decreasing the capacity of energy storage on climate change. To perform this, the hourly fluctuations of wind and PV power for 192 countries and regions were estimated based on the geospatially explicit data of wind speed [25] and solar radiation [26] from 1981 to 2020. The monthly fluctuations of biomass feedstocks in 192 countries and regions were estimated based on national data of cropland areas [27] and the harvest seasons for different crops [28]. The analysis accounted for the change in the demand for total energy across three Shared Socioeconomic Pathway (SSP) scenarios [29,30]. We ultimately determined the demand for capacities of energy storage, with a focus on the usage of batteries and the consumption of minerals by considering the impact of the cycle life of batteries and the reserves of mineral resources at a country level. The results reinforce the importance of considering the limitations of energy storage and potential mineral shortage when striving to achieve ambitious climate targets by elucidating the relationship between the capacities of energy storage and the effects of decarbonizing the energy system on global warming.

2. Materials and Methods

2.1. The Compact Earth System Model

We used an open-source Earth system model, OSCAR 3.1, to simulate climate change driven by emissions of greenhouse gas from human activities. OSCAR can be described as a non-linear box model with a large number of boxes, and is a parametric model, which has been calibrated on CMIP5, CMIP6, and other complex models. The formulations and calibration of the model are fully detailed in the literature [22,23,24]. Anthropogenic emissions of various gases are the main drivers of the model, and the carbon cycle in OSCAR is divided into ocean carbon cycle and land carbon cycle. OSCAR has limitations in accurately simulating the comprehensive spatial distribution and seasonal variation of resource systems, as the energy budget of its climate module is only calculated on a global scale and the time step of analysis is a year. Gasser et al. have run a number of simulations covering historical periods to evaluate the performance of OSCAR, and the simulations of carbon dioxide, methane, nitrous oxide, halogenated compounds, ozone, aerosols, radiative forcing, and climate are in good agreement with other studies [31]. To consider uncertainties in the physical parameters of the OSCAR model, we also ran Monte Carlo simulations 1000 times and used the intermediate scenario to carry out this study. The global warming changes from 2020 to 2100 simulated by the model were consistent with IPCC projection [10]. We further considered the effects of deploying wind, PV, and BECCS on reducing CO2 emissions by replacing fossil fuels in energy production. The change in atmospheric CO2 concentration can be predicted based on the balance of carbon sources and sinks:
  α d d t A = F S ε s v s η s x = 1 4 N x + f x M x F N + F L U C + F e p f + F o c e a n + F l a n d
where α is the atmospheric conversion factor for CO2 [22], t is a year, ΔA is the change of atmospheric CO2 concentration, FS is total CO2 emissions from fossil fuels and cement production, εs is the average emission factor of fossil fuel [32], vs is the average energy content of fossil fuel [33], ηs is the efficiency of power generation in fossil fuel power plants [34], x is a type of low-carbon energy (x = 1–4 for onshore wind, offshore wind, PV, and bioenergy, respectively, in this equation), Nx is the production of low-carbon energy without deploying energy storage, fx is the fraction of energy storage requirement that has been fulfilled, Mx is the production of low-carbon energy that requires energy storage, FN is the amount of CO2 captured in the BECCS power plants, ∆FLUC is CO2 emissions from land use change, ∆Fepf is the permafrost emissions (e.g., CO2 emissions from direct permafrost thaw and oxidation of permafrost-induced CH4) [23], ∆Focean is oceanic carbon sink, and ∆Fland is terrestrial carbon sink. The impacts of increasing fx from 0 (i.e., without deploying energy storage) to 1 (i.e., fulfilling the demand for energy storage) were examined by deploying energy storage in our study. The annual global total power demand; energy production by geothermal, hydro, and nuclear; CO2 emissions from land use change and radiative forcing for non-CO2 GHGs in 192 countries and regions under the SSP1-1.9, SSP1-2.6, and SSP2-4.5 scenarios were adopted from the International Institute for Applied Systems Analysis (IIASA) datasets [30].

2.2. Hourly Power Supply by Wind and Photovoltaics

The hourly power generation potential of onshore wind, offshore wind, and PV power in 1981–2020 were calculated based on the global geospatial data at a spatial resolution of 0.5° × 0.625°. When building wind and photovoltaic power plants in all suitable lands, we estimated the maximal power supply by wind and photovoltaics (Ex):
  E x = a h e x , a , h
where x is a type of energy (x = 1–3 for onshore wind, offshore wind, and PV power, respectively, in this equation), a is a pixel suitable for power plants construction in a country or region, h is an hour in the year, and ex,a,h is the historical hourly power generation in a suitable pixel. We estimated ex,a,h for onshore wind, offshore wind, and PV power using a method in the literature [35]. We considered that onshore wind power plants adopted the General Electric wind turbine with a maximum capacity of 2.5 MW, where the height of the hub was 100 meters above the ground, while offshore wind power plants adopted the Vestas wind turbine with a maximum capacity of 8 MW, where the height of the hub was also 100 meters above the sea level. The wind power potential was calculated based on the historical wind speed at the height of wind turbine. The hourly friction velocity of wind speed and the surface roughness was compiled from the MERRA-2 dataset at a spatial resolution of 0.5° × 0.625° [25]. The PV power generation was calculated based on the historical solar radiation, the effective area of photovoltaic panels, and the efficiency of energy conversion [15], where the hourly solar direct (Rdirect), diffuse (Rdiff), and total (Rtotal) radiation were compiled from the NASA’s GEOS-5 FP database with a resolution of 0.25° × 0.31° [26]. The suitability of pixels for installing wind turbines and PV panels was determined based on the geospatial data of land cover at a resolution of 0.005° × 0.005° [36], ground slope at a resolution of 0.001° × 0.001° [37], topography at a resolution of 1 km [38], ground air temperature at a resolution of 0.25° × 0.31° [26], water depth at a resolution of 0.001° × 0.001° [37], masks of nature reserve at a resolution of 0.001° × 0.001° [39], shipping routes [25], and the abundance of wind or solar energy resources. The thresholds adopted to screen the pixels suitable for installing wind turbines and PV panels are listed in Table S1.

2.3. Capacity of Power Supply and Negative Emissions by BECCS

When equipping carbon capture and storage in biomass-fired power plants, we estimated the annual mean maximum power generation by bioenergy (EB) and the negative emissions from BECCS when capturing 90% of CO2 emissions in power plants (FN):
E B = i e i v i η b = N B + M B
F N = i e i c i × 90 %
  e i = Y i A i μ i 1 I i I i
where i is a type of crop (i = 1–5 for wheat, rice, maize, soybean and others, respectively), ei is the weight of dry biomass, vi is the heat content of dry biomass [40], ηb is the efficiency of power generation in BECCS power plants [34], NB is the production of bioenergy without deploying energy storage, MB is the production of bioenergy that requires energy storage, ci is the carbon concentration in dry biomass [32], Yi is crop yield, Ai is the area of cropland, μi is the fraction of dry biomass [32], and Ii is the harvest index (i.e., the ratio of the mass of the harvested yield to total above-ground biomass) [32]. The area of cropland (Ai) for five types of crops in each country and region for 2019 was compiled from the Food and Agriculture Organization global agricultural dataset [27]. The crop yield (Yi) was predicted as a function of atmospheric CO2 concentration, average temperature during the growing season, the cropland intensity of nitrogenous fertilization, and the average precipitation in the OSCAR 3.1 model using an empirical function in the literature [32]. The feedback of climate change to crop yields was considered by predicting the average growing-season temperature in cropland of North America, South and Central America, Europe, the Middle East and North Africa, tropical Africa, the former Soviet Union, China, South and Southeast Asia, and the developed Pacific region [41].

2.4. Capacity of Energy Storage for Wind, PV, and BECCS

The hourly power demand by country was compiled from the PLEXOS-World database [42]. We estimated the hourly power demand (D) for wind, PV, and bioenergy in a country or region:
D x , h = Y x · R h h R h
where x is a type of energy (x = 1–4 for onshore wind, offshore wind, PV, and bioenergy, respectively, in this equation), Yx is the total power demand, h is an hour, and Rh is the hourly power demand in the country or region [42]. When the power supply exceeds the demand, the energy storage systems could be used to store surplus energy, where the total energy storage cannot exceed its storage capacity [43]. We considered that energy storage for wind and PV power was achieved through batteries, hydro pump, compressed air energy storage system, and others [44], while the storage of biomass could be realized by stockpiling crops [19].
We estimated the hourly charging capacity (Hx) and the hourly discharging capacity (Ix) of the energy storage system:
  H x = min S x D x , Q x T x , i f   S x > D x   ( c h a r g i n g )
  I x = min D x S x , T x , i f   S x D x   ( d i s c h a r g i n g )
where x is a type of energy (x = 1–3 for onshore wind, offshore wind, and PV, respectively), Sx is the hourly power supply, Dx is the hourly power demand, Qx is the total power capacity of energy storage, and Tx is the energy that has been stored. The annual global total power demand and the power demand for onshore wind, offshore wind, PV, and bioenergy in the SSP1-1.9, SSP1-2.6, and SSP2-4.5 scenarios were compiled from the IIASA dataset [30,45]. The hourly power supply potential by bioenergy in each country and region was calculated by allocating the production of a crop to each month in the harvest season if there was no measure of biomass storage. The real-time energy storage was estimated as the total energy that has been stored minus the energy that has been utilized to meet the hourly power demand. Without deploying energy storage systems, the surplus of power generation by onshore wind, offshore wind, PV, and bioenergy will be discarded, which reduces the effects in CO2 emission reductions by using fossil fuels to meet the power demand.

2.5. Consumption of Minerals in Batteries for Energy Storage

We considered that 10% of the demand for energy storage by wind, PV, and bioenergy would be satisfied by using batteries, while the remaining energy will be stored using hydro pump, compressed air energy storage systems, and others [46]. The consumption of minerals was estimated in the manufacture of lithium-ion batteries (LiNi0.5Co0.2Mn0.3O2), which is widely used in current markets [47]. The production of one Gigawatt hours (GWh) of ternary lithium batteries was estimated to consume 107.65 tons of lithium (Li), 455.76 tons of nickel (Ni), 183.08 tons of cobalt (Co), and 256.01 tons of manganese (Mn) [48,49]. Considering the reduction in the capacity of batteries after multiple runs of charging and discharging, we examined the sensitivity of our results by assuming that the life cycle of batteries is 1000 [50], 2000 [51], and 3000 [52], respectively. The data of mineral reserves for Li, Ni, Co, and Mn by country and region were compiled from USGS [53] to determine the maximal capacity of battery production by consuming Li, Ni, Co, and Mn.

3. Results and Discussion

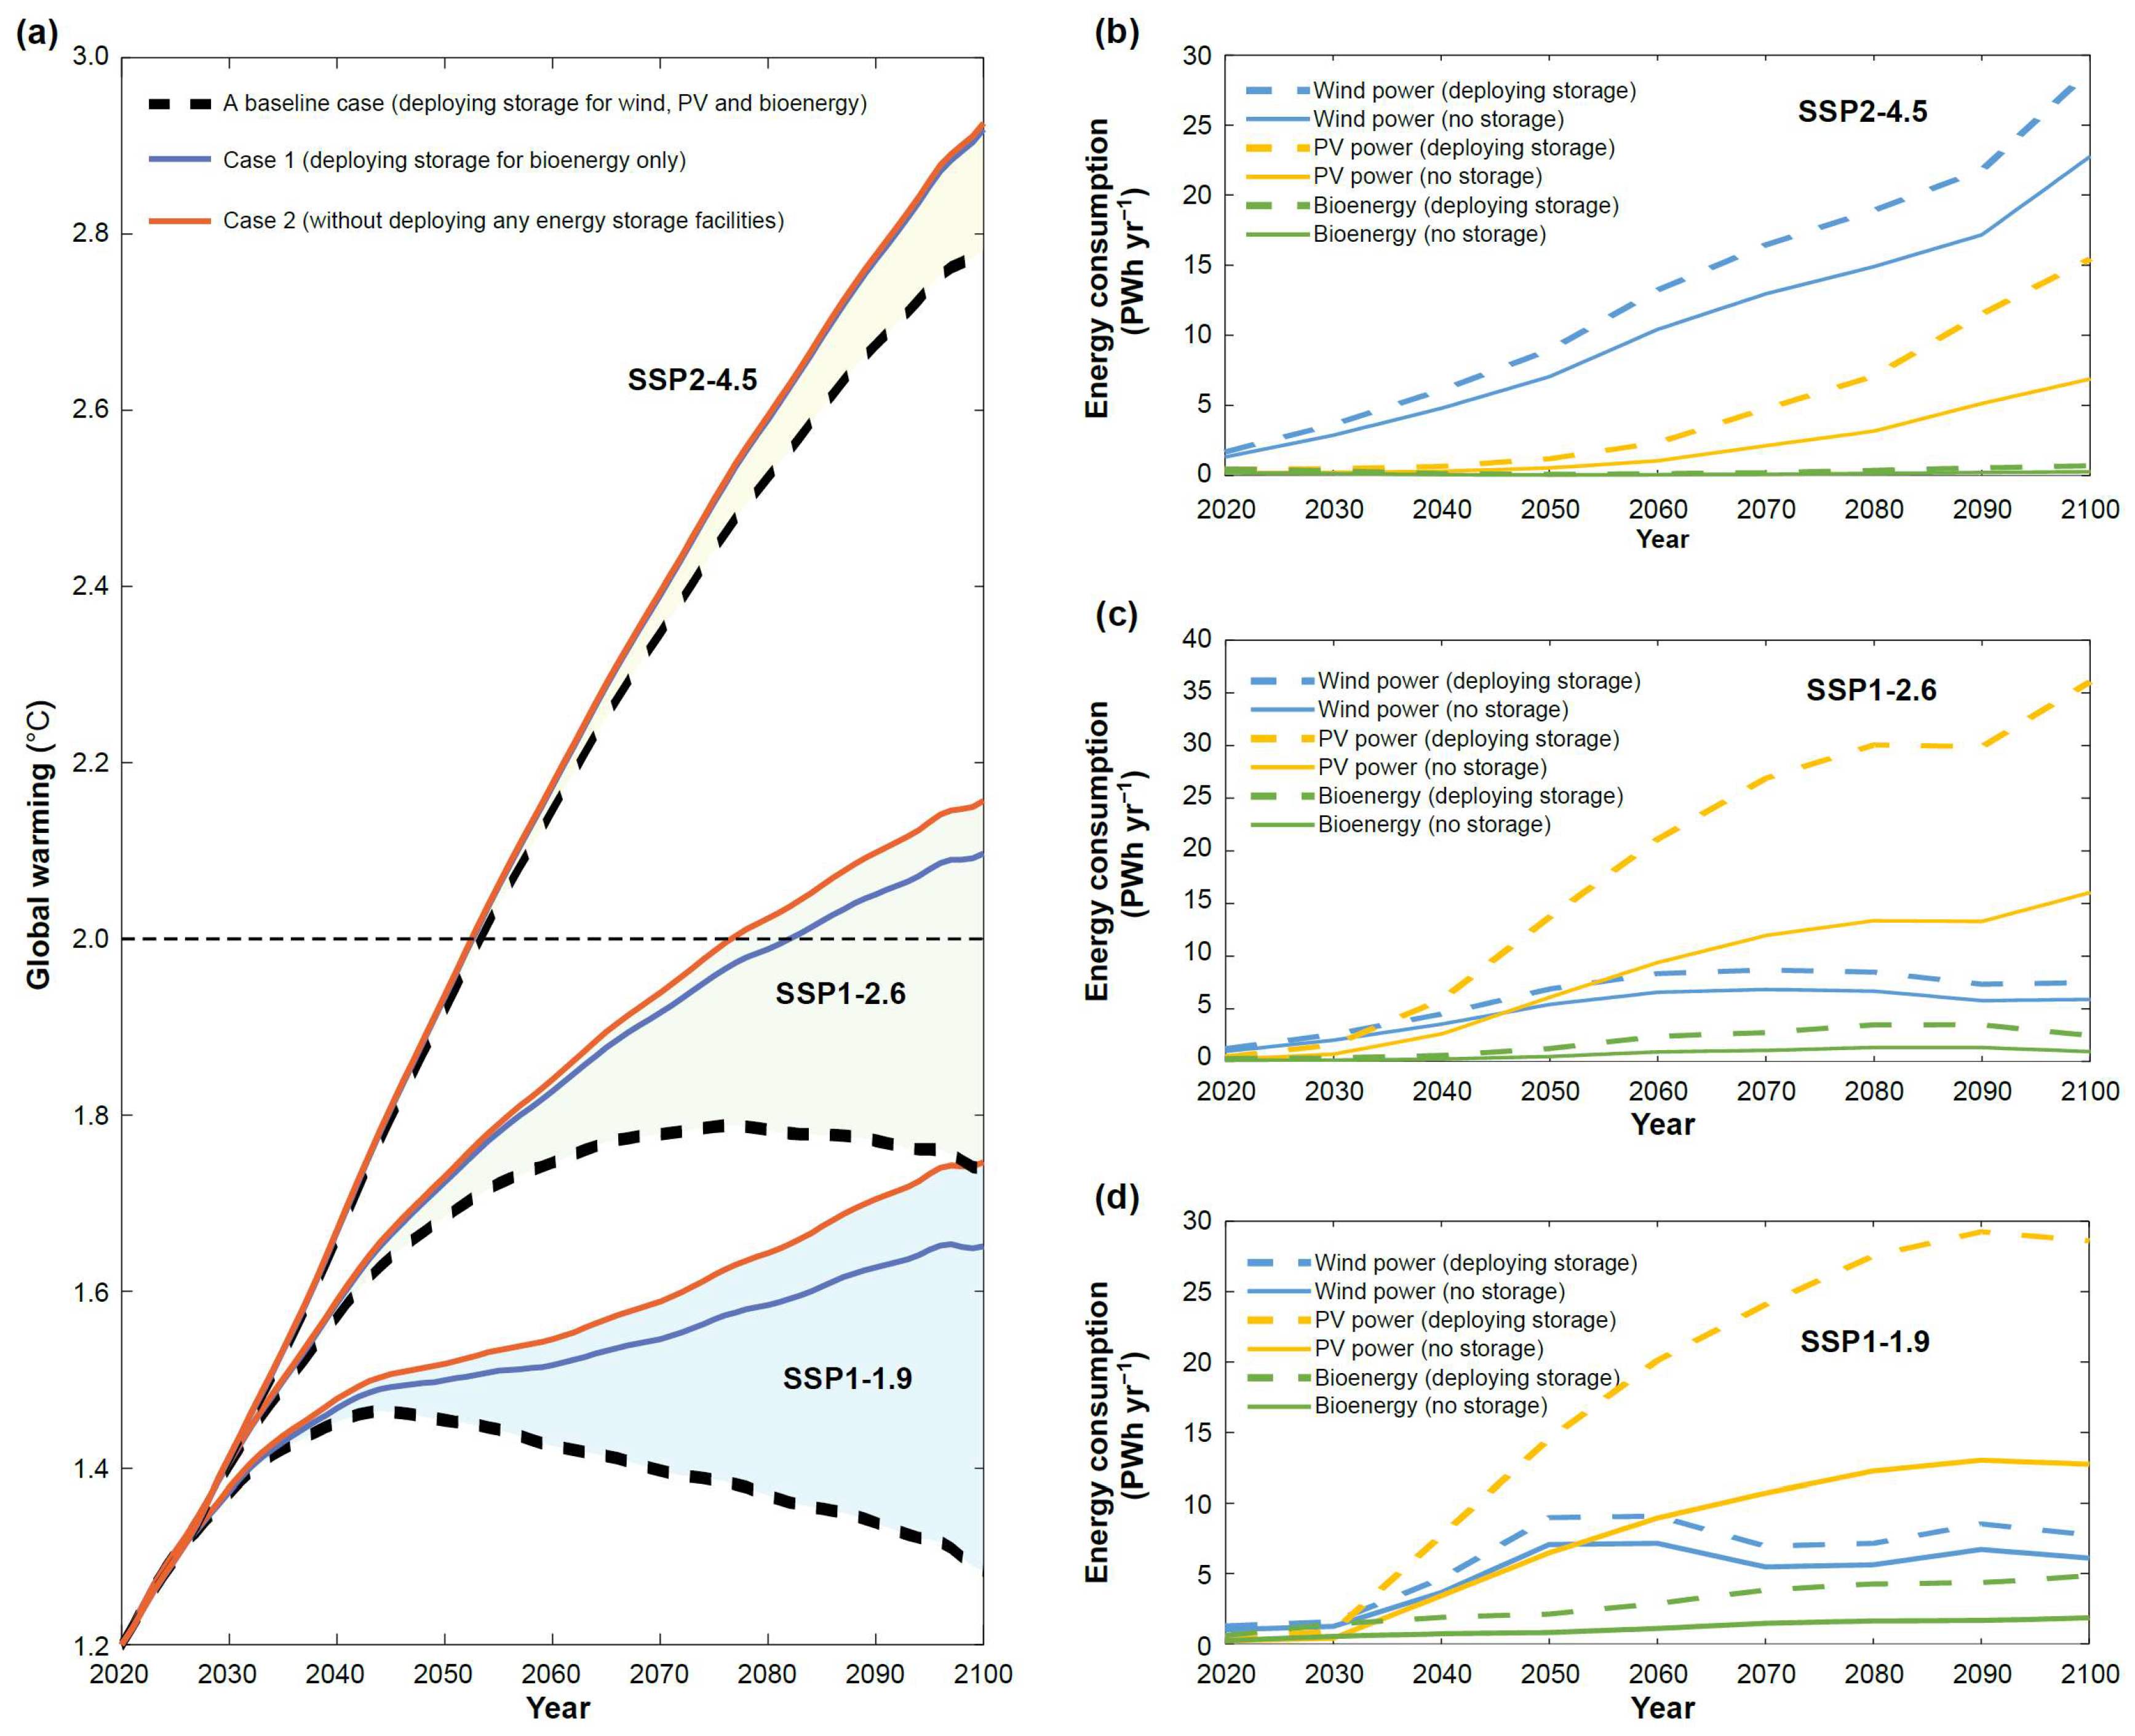
3.1. Impacts of Deploying Energy Storage on Global Warming

We analyzed the impacts of deploying energy storage on global warming in the scenarios of SSP1-1.9, SSP1-2.6, and SSP2-4.5 [29] (Figure 1). These scenarios represent a diverse range of assumptions on economic growth, technological improvements, land use changes, and energy production (Figure S1). SSP1 stands for the green path of sustainable development, with central features of increasing social environmental awareness and a shift toward less resource-intensive lifestyles, while SSP2 represents the intermediate path, which is consistent with typical patterns observed in the past century [54]. SSP1-1.9 and SSP1-2.6 correspond to scenarios that limit radiative forcing to 1.9 and 2.6 watts per square meter by the end of the century, respectively, with a high probability of achieving the 2 °C target [10]. By conducting Monte Carlo simulations 1,000 times using the OSCAR model to account for uncertainties in physical parameters, we projected a reduction in global warming when transitioning the scenario from SSP2-4.5 to SSP1-1.9 by decreasing CO2 emissions from fossil fuels and land use change (Figure S2). We introduced the fraction of energy storage requirement that had been met (fx) to assess the impact of deploying energy storage. In a baseline case fulfilling the demand for energy storage by holding fx = 1, global warming in 2100 would fall from 2.78 °C to 1.74 °C when shifting the scenario from SSP2-4.5 to SSP1-2.6 to align with the Paris target [2]. Global warming would peak at 1.46 °C in 2044 in the SSP1-1.9 scenario and 1.79 °C in 2077 in the SSP1-2.6 scenario, and then would decline as the CO2 emissions from fossil fuels are offset by negative emissions from carbon capture and storage following the deployment of BECCS (Figure S3). In contrast, global warming continued to rise in the SSP2-4.5 scenario due to CO2 emissions from fossil fuels exceeding the negative emissions even with BECCS deployment. The amount of CO2 captured by BECCS in 2100 was predicted to be 0.82 petagrams of carbon (Pg C) and 0.42 Pg C in the scenarios of SSP1-1.9 and SSP1-2.6, respectively, surpassing the amount of CO2 captured by BECCS (0.12 Pg C) in the SSP2-4.5 scenario (Figure S3). The difference in the capacity of BECCS reflects the combined effects of the lower utilization of biomass in the SSP2-4.5 scenario than SSP1-1.9 and SSP1-2.6 [29] and the negative feedback of global warming to crop yields [32], which are both considered in our model.
We next compared the projected global warming and the global total renewable energy consumption in the baseline case with a sensitivity case (Case 1), where only bioenergy was stored through direct biomass stockpiling (Figure 1). Without deploying energy storage facilities to enhance the fraction of PV and wind energy production available for consumption, more fossil fuels would be consumed to meet the power demand, thereby increasing CO2 emissions in the energy sectors. For example, global warming in Case 1 for 2100 would increase to 1.65 °C, 2.10 °C, and 2.92 °C in the scenarios of SSP1-1.9, SSP1-2.6, and SSP2-4.5, respectively, which is equivalent to an increase in global warming by 29%, 21%, and 4.9% relative to the baseline case, respectively. In this case, the Paris target would no longer be met in the scenarios of SSP1-2.6 and SSP2-4.5, where global warming would surpass 2 °C by 2083 and 2053, respectively. Because of the mismatch between production and consumption of renewable energy, the final consumption of global wind and PV power would decrease by 21% and 55% in the scenarios of SSP1-2.6 and SSP2-4.5, respectively. For instance, in the SSP2-4.5 scenario, the final consumption of wind power would decline from 29 PWh yr−1 to 23 PWh yr−1 for 2100, resulting in an increase in global CO2 emissions by 1.41 Pg C yr−1 when using fossil fuels to satisfy the power demand. Similarly, in the SSP1-2.6 scenario, there was a decline of PV power from 36 PWh yr−1 to 16 PWh yr−1 for 2100, leading to additional global CO2 emissions by 4.59 Pg C yr−1. Lastly, in contrast to Case 1, we further considered a sensitivity case by excluding the usage of direct biomass stockpiling to eliminate energy storage facilities for wind, PV, and bioenergy (Case 2). Consequently, global warming in 2100 would reach 1.75 °C, 2.16 °C, and 2.93 °C, representing an increase of 5.8%, 2.8%, and 0.3% relative to Case 1 in the scenarios of SSP1-1.9, SSP1-2.6, and SSP2-4.5, respectively, by reducing the effectiveness of BECCS in abating CO2 emissions [29]. For example, global total CO2 emissions abated by BECCS for 2100 would decrease from 1.79, 0.90, and 0.25 Pg C yr−1 in Case 1 to 0.57, 0.28, and 0.08 Pg C yr−1 in Case 2 if we removed the direct stockpiling of biomass in the scenarios of SSP1-1.9, SSP1-2.6, and SSP2-4.5, respectively.

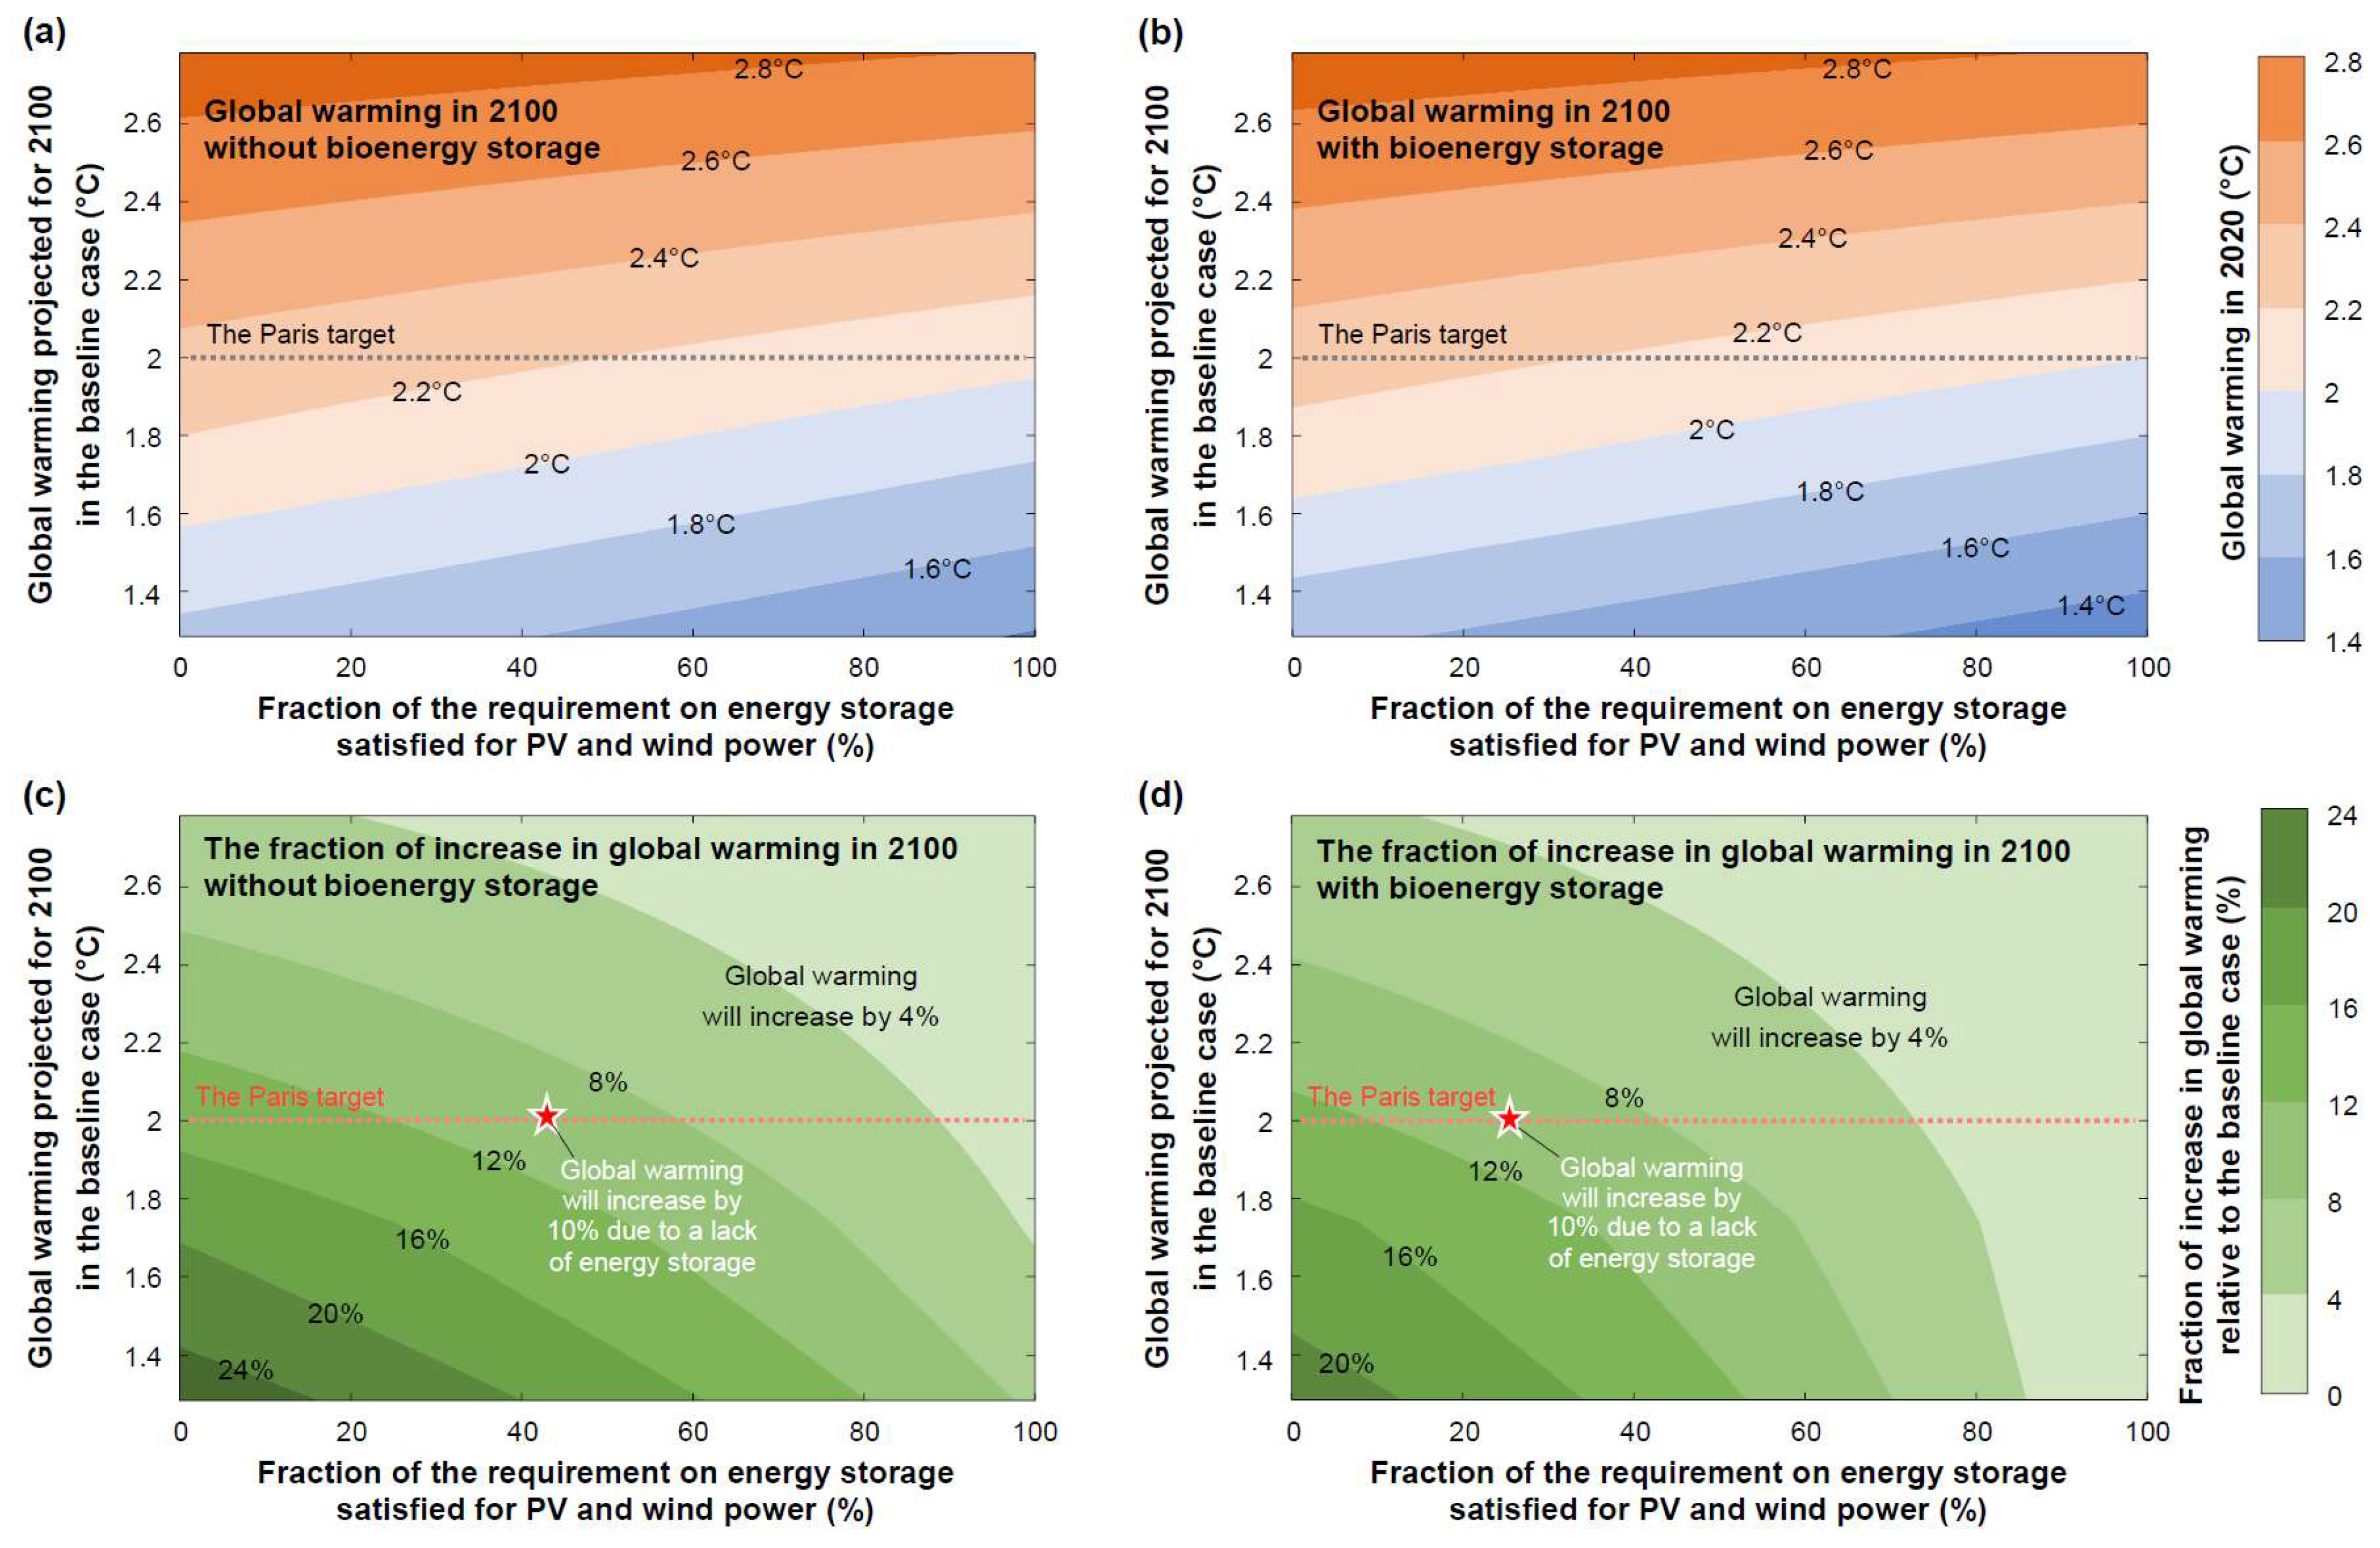
3.2. Dependence of the Effects of Mitigation on Energy Storage

We next explored the dependence of the effects of mitigation by deploying renewable energy on the capacity of energy storage (Figure 2). To do this, we systematically decreased the fraction of the energy storage requirement that had been satisfied (fx) for wind and PV power from 1 to 0, while we simultaneously increased the contribution of wind, PV, and bioenergy to the total power generation by transitioning from SSP2-4.5 to SSP1-2.6 and SSP1-1.9 using a linear interpolation between adjacent scenarios (Figure S4). We estimated global warming in 2100 in the baseline case by holding fx = 1 (ΔTbaseline) without considering the limitation by the capacity of energy storage [1]. We subsequently estimated the deviation of global warming in 2100 to ΔTbaseline when fx decreased from 1 to 0 for wind and PV power to denote the effects of reducing energy storage. Without adequate capacities of energy storage for both wind and PV power, there is a considerable impact to offset the effects of phasing out fossil fuels on global warming, thereby intensifying the demand for renewable energy to meet ambitious climate targets (Figure 2a,b). For example, in order to meet the 2 °C target without direct biomass stockpiling, we observed that deploying facilities of energy storage to increase fx from 0, 20%, 40%, 60%, and 80% to 100% for wind and PV power would produce the effects to reduce the global warming for 2100 by 0.37, 0.28, 0.21, 0.15, and 0.10 °C, respectively.
The impact of deploying energy storage on global warming exhibits higher sensitivity to fx under a lower ΔTbaseline as the demand for energy storage will increase when meeting a more stringent climate target (Figure 2c,d). For example, when rising fx from 20% to 80% for wind and PV power without storing biomass, the fraction of increase in global warming due to insufficient energy storage would decrease from 7% to 3% for ΔTbaseline = 2.4 °C, compared to a reduction from 20% to 10% for ΔTbaseline = 1.5 °C. The storage of biomass through direct stockpiling reduces the requirement on energy storage for wind and PV power. For instance, in order to control the fraction of increase in global warming within 10% when meeting the 2 °C target, it would be necessary to satisfy 42% of the demand for energy storage without bioenergy storage, compared to 26% if the surplus of biomass in the harvest season can be stored for usage during the non-harvest season. Our results confirm that the development of energy storage facilities at a large scale will be imperative to meet ambitious climate targets by enhancing the efficiency of using renewable energy, especially if the deployment of renewable energy cannot be accelerated to reach the exceedingly high levels due to physical and technological constraints [55]. It is indicated that countries around the world need to make trade-offs between energy development pathways and the construction of storage facilities to meet the 2 °C target, which can provide valuable insights for policymakers when deciding on the optimal allocation of energy sources and storage systems in the context of global warming. However, large costs and potential environmental impacts due to installation, operation, and maintenance of energy storage facilities deserve attention [35].

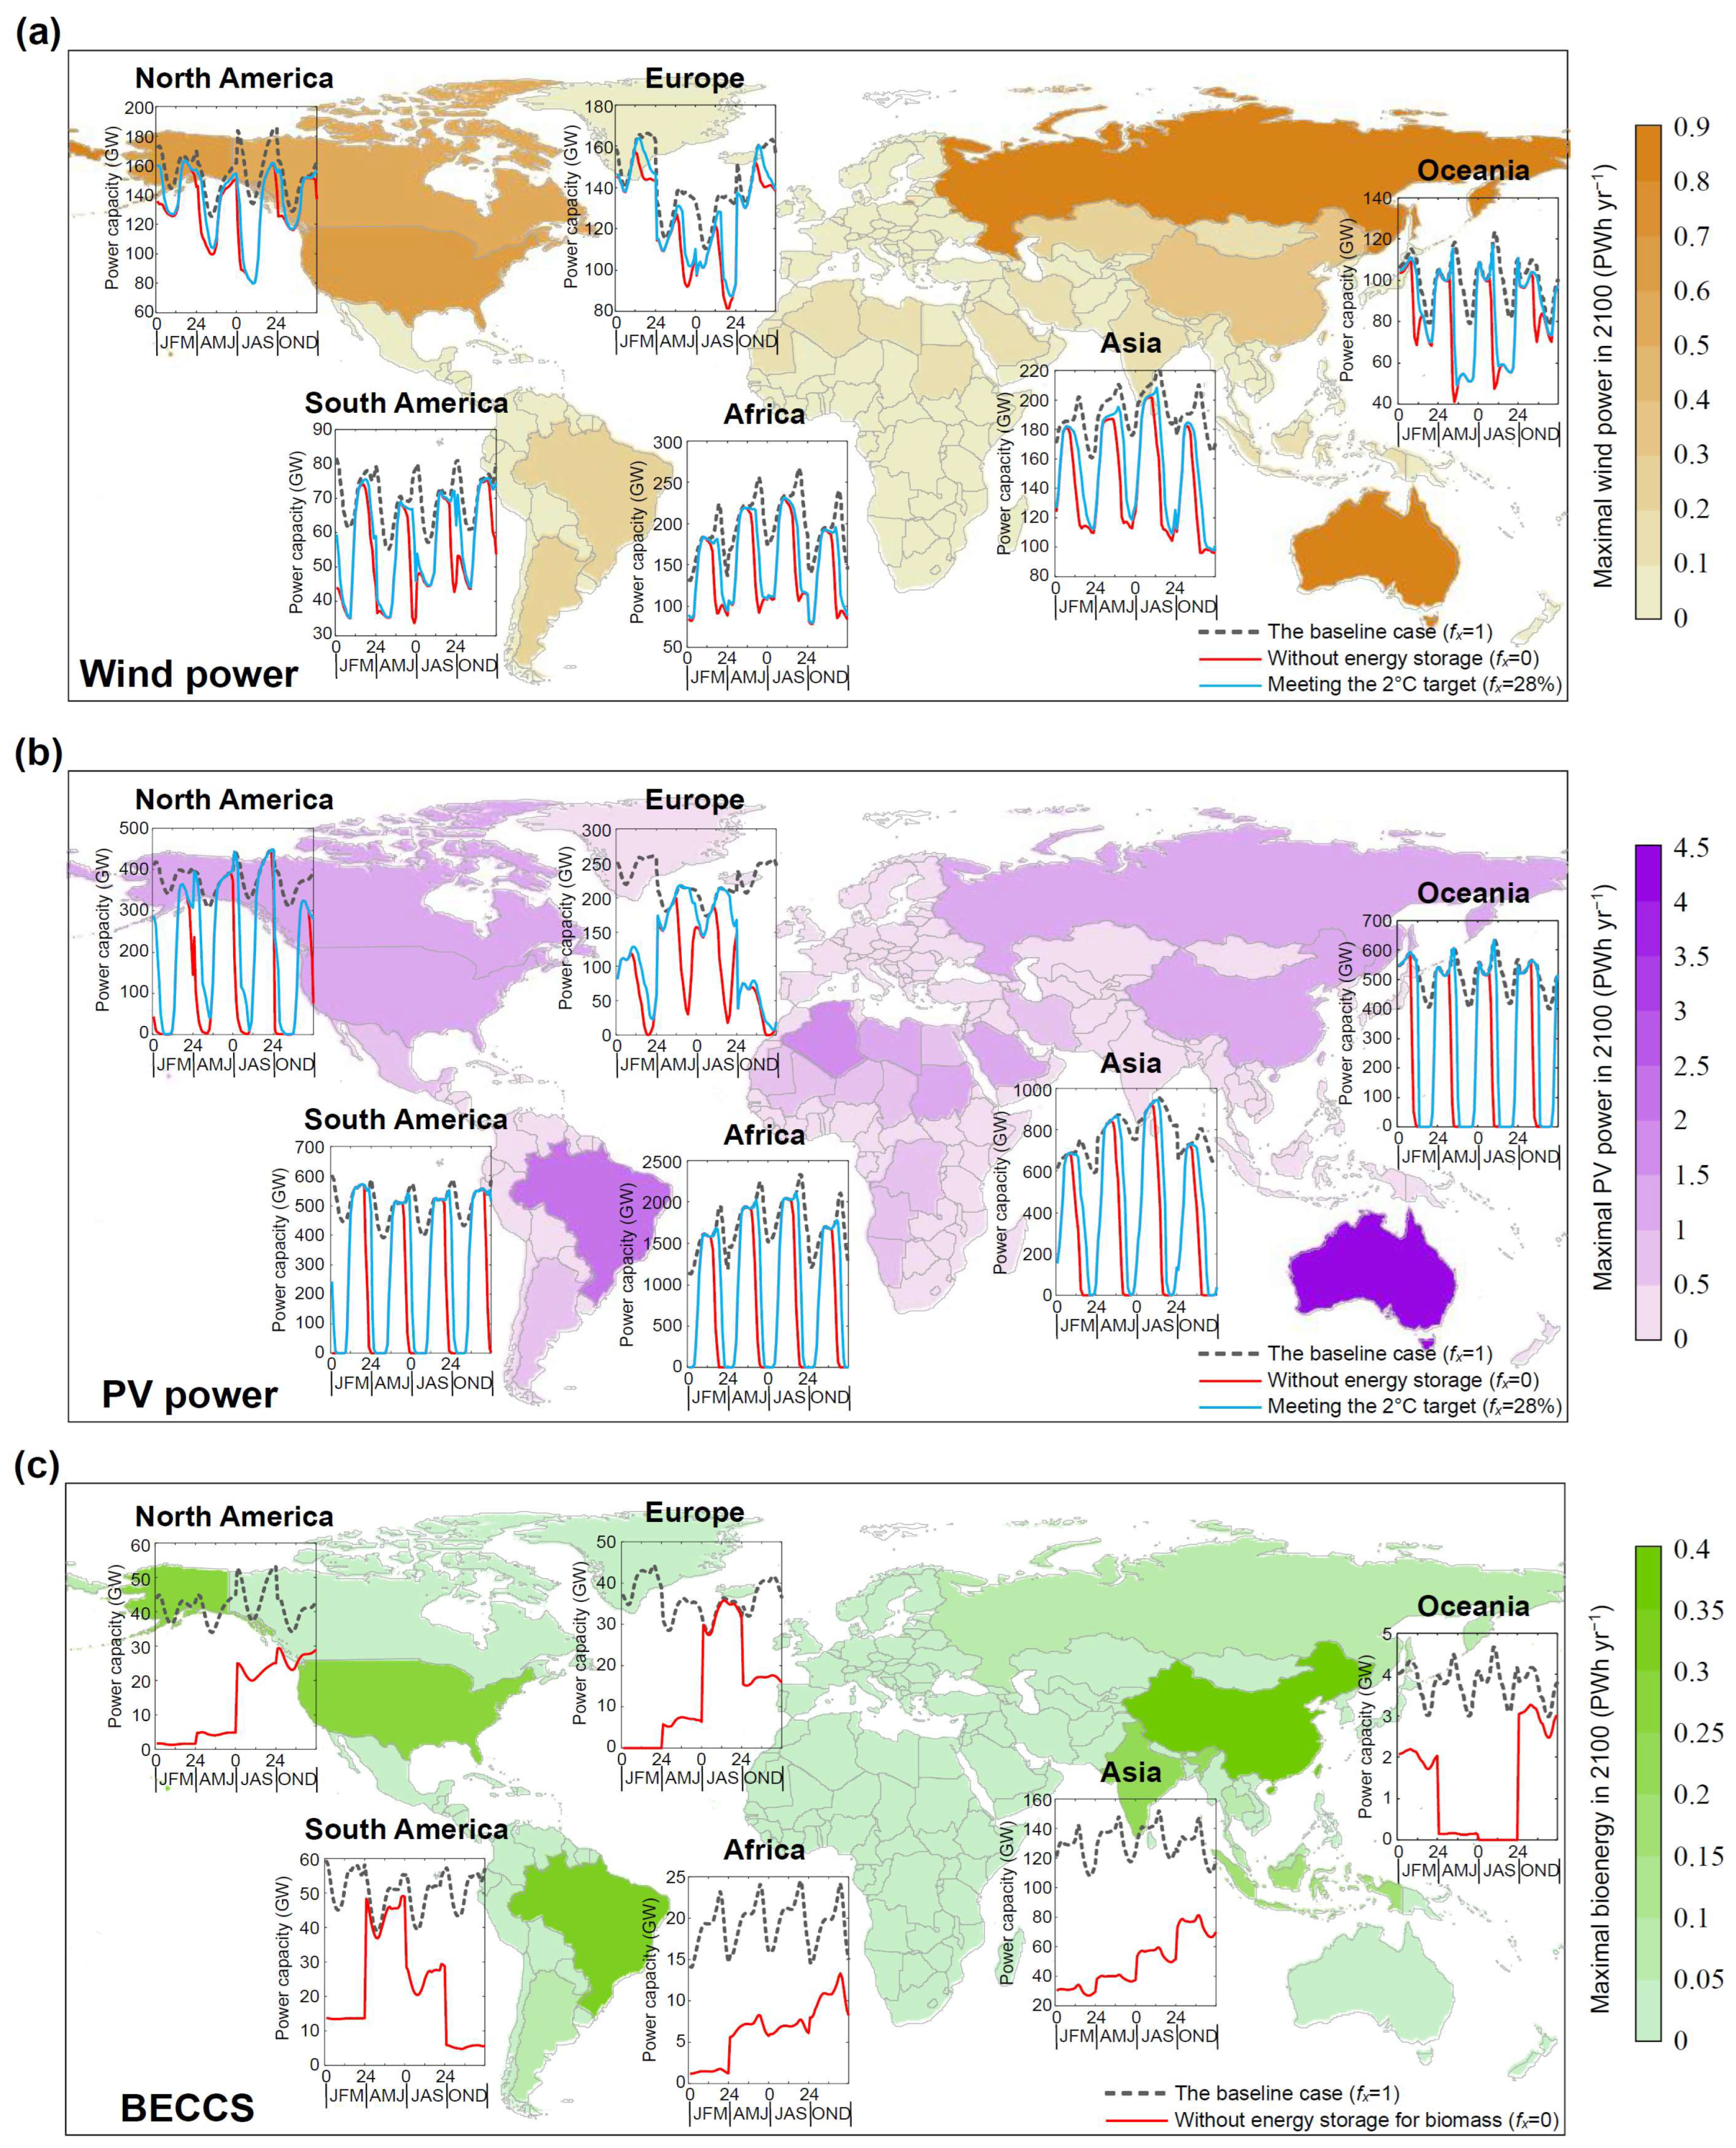
3.3. Spatial Distribution of Wind, PV, and Bioenergy Production

Based on the hourly fluctuations of the power supply of wind, PV, and bioenergy, as well as the power demand in the SSP1-2.6 scenario [29], we compared the useful power generation for wind, PV, and bioenergy in 2100 in a baseline case fulfilling the requirement on energy storage (fx = 1) with that in a case without deploying energy storage facilities (fx = 0) (Figure 3). The spatial distribution of power capacity for wind and PV was predicted based on the global distribution of wind speed and solar radiation (Figure S5). While global warming would exceed 2 °C by 2100 in the SSP1-2.6 scenario without energy storage, we considered a 2 °C case to align with the Paris target with direct stockpiling of biomass for storage by satisfying 28% of the requirement on energy storage facilities for wind and PV power. In the baseline case, the maximal wind power is primarily concentrated in Russia, Australia, the United States, Canada, and China, which contributes to 12% (868 TWh yr−1), 11% (850 TWh yr−1), 8.8% (660 TWh yr−1), 6.8% (512 TWh yr−1), and 4.9% (360 TWh yr−1) of the global total wind power generation, respectively. The PV power generation is mainly concentrated in Australia, Brazil, Algeria, China, and Saudi Arabia, contributing to 12% (4481 TWh yr−1), 6.3% (2276 TWh yr−1), 5.4% (1962 TWh yr−1), 4.0% (1454 TWh yr−1), and 4.0% (1448 TWh yr−1) of the global total PV power generation, respectively. Bioenergy is primarily distributed in China, Brazil, the United States, India, and Indonesia due the abundance of agricultural residues from crop production [56]. After deploying energy storage, wind, PV, and bioenergy power will be generated to meet the power demand, which is generally lower in both early morning and midnight than the daytime [57]. In the absence of energy storage, wind power generation in the baseline case is projected to decrease by 25%, 28%, 12%, 16%, 23%, and 19% in Asia, Africa, Europe, North America, South America, and Oceania, respectively, compared to a reduction of 56%, 55%, 59%, 55%, 56%, and 55% for PV power generation due to a greater variability of PV compared to wind power [58]. In contrast, if the harvested biomass is not stored for usage during the non-harvest seasons, BECCS power plants would only be used for power generation in the harvest seasons, reducing the power capacity of bioenergy in Asia, Africa, Europe, North America, South America, and Oceania by 62%, 67%, 61%, 67%, 56%, and 66%, respectively. The efficiency of batteries in reducing power loss of wind and PV displays seasonal variations. Specifically, in the Asian region, the seasonal average fx of wind energy storage is projected to be 30%, 33%, 27%, and 21% in JFM, AMJ, JAS, and OND, respectively, while maintaining an annual average of 28%. The availability of wind and PV to provide surplus energy for storage systems is subject to continuous fluctuations, resulting in varying levels of stored energy at different time intervals, and ultimately impacting the ability of storage systems to release energy when required, thereby influencing the performance of energy storage systems in different time periods. Corresponding to specific fx under a specific scenario, the total storage capacity requirements for wind and PV generation of each country and region can be obtained, which helps policymakers to make informed decisions regarding the scale and type of energy storage technologies to deploy [59,60] and optimize their investment strategy [35].

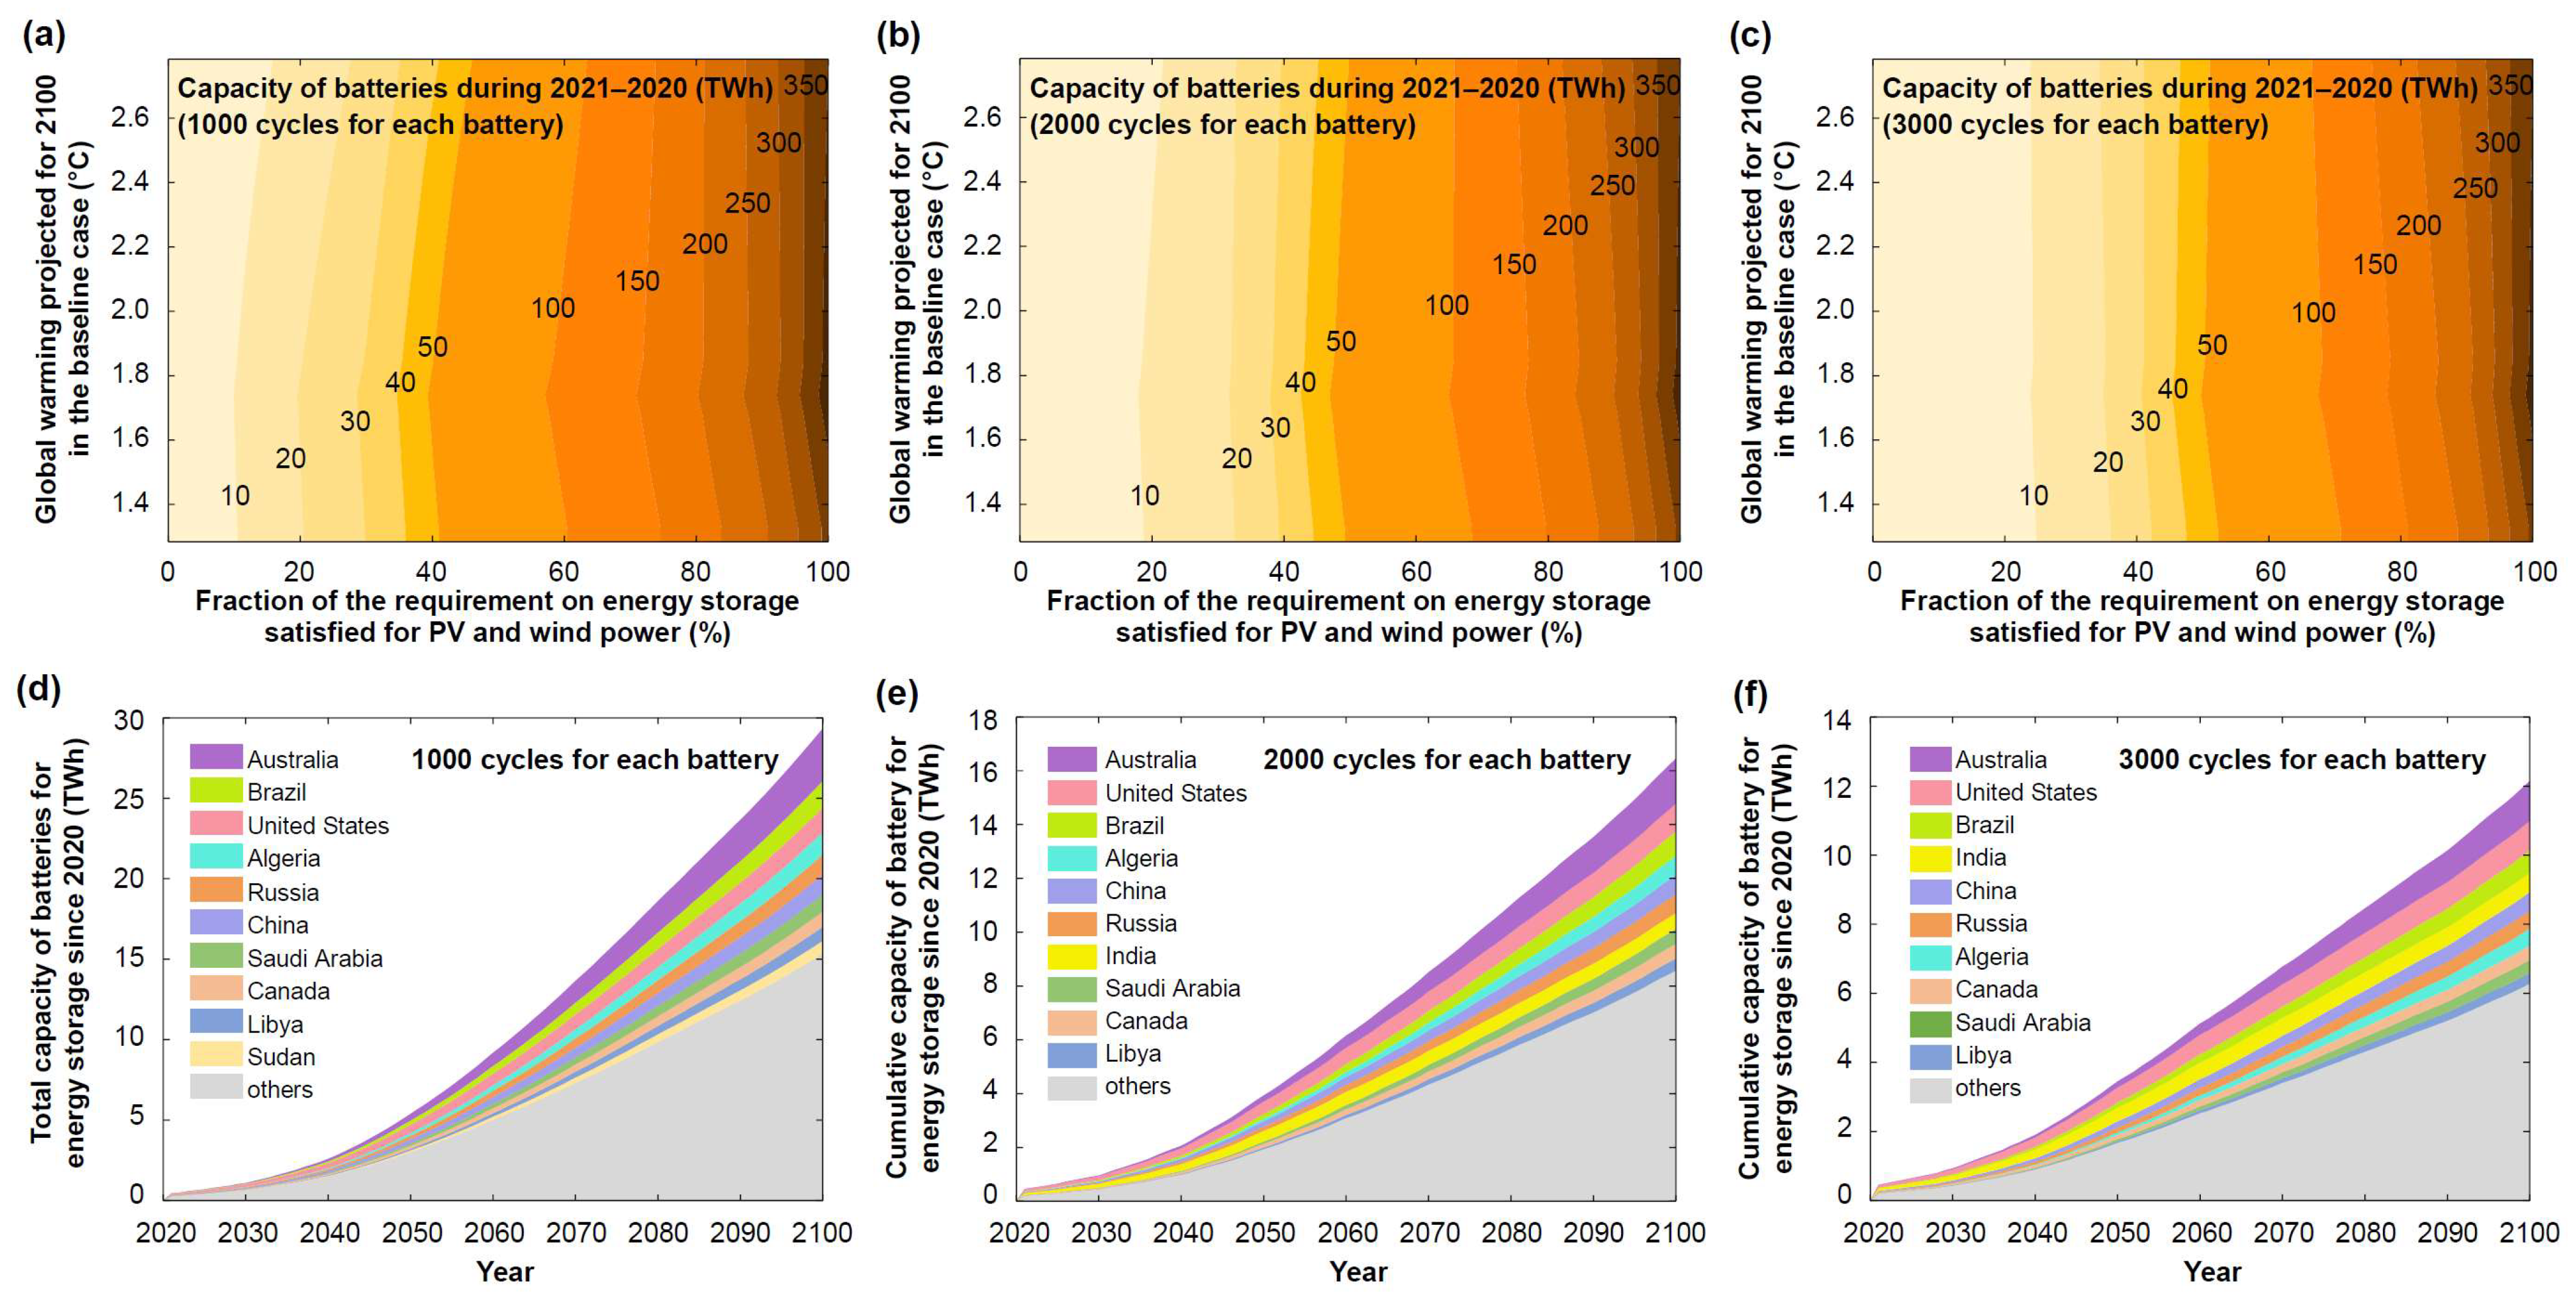
3.4. Global Demand for the Capacity of Energy Storage Using Batteries

We next considered that lithium-ion batteries would contribute to 10% of total capacity of energy storage, while hydro pumps, compressed air energy storage systems, and other technologies could be adopted to fulfill the remaining demand for energy storage [46]. We assumed that NCM523 (LiNi0.5Co0.2Mn0.3O2) would be used to store energy for wind and PV power, which has a high energy density [47]. As the consumption of batteries largely depends on the cycle life, we performed three sensitivity experiments by adopting a cycle life of 1000 cycles [50], 2000 cycles [51], and 3000 cycles [52] for NCM523, respectively. To demonstrate the impact of deploying energy storage, we increased the fraction of the energy storage requirement that had been satisfied (fx) from 0 to 100%, which expanded the demand for the capacity of energy storage using batteries during the period 2021–2100 (Figure 4a–c). When the battery cycle life was 1000 cycles, the cumulative capacity of energy storage by lithium-ion batteries consumed in 2021–2100 would reach 21, 52, 106, 199, and 429 TWh to increase fx from 0 to 20%, 40%, 60%, 80%, and 100% in the SSP1-2.6 scenario, respectively. For comparison, the total capacity of lithium-ion batteries would decrease to 11, 34, 85, 172, and 424 TWh if the cycle life was 2000 cycles, or 8.2, 29, 79, 163, and 424 TWh if the cycle life further increased to 3000 cycles.
The total annual capacity of lithium-ion batteries produced by all countries and regions is projected to increase from 1.57 TWh for 2022 to 6.79 TWh for 2030 [61]. Therefore, we predicted that the production of lithium-ion batteries would keep growing to meet the escalating demand for energy storage when deploying wind and PV power to meet the 2 °C target in the SSP1-2.6 scenario (Figure 4d–f). When the cycle life of batteries was 1000 cycles, 2000 cycles, and 3000 cycles, the total capacities of lithium-ion batteries consumed during the period 2021–2100 to limit global warming to below 2 °C in the SSP1-2.6 scenario would reach 29, 16, and 12 TWh, respectively. When the cycle life of batteries was 2000 cycles, the top ten consumers of lithium-ion batteries were Australia, the United States, Brazil, Algeria, China, Russia, India, Saudi Arabia, Canada, and Libya, where the total capacities of lithium-ion batteries consumed in 2021–2100 were estimated to be 1.7, 1.0, 0.91, 0.71, 0.71, 0.70, 0.59, 0.56, 0.55, and 0.45 TWh, respectively. As the largest producers of lithium-ion batteries, the total capacities of production in China, the United States, Hungary, Poland, and South Korea were approximately 0.56, 0.044, 0.028, 0.022, and 0.018 TWh in 2021, respectively [62]. There is a disparity between lithium-ion battery production and consumption across countries. Market dynamics, including supply chain constraints, manufacturing capabilities, and investment priorities, can significantly affect battery production [63]. Therefore, it is crucial to consider strategic planning, investment, and international cooperation to ensure a secure supply of batteries and meet the growing demand for energy storage. By engaging in international trade of lithium-ion batteries, countries can optimize the resource allocation to bridge this gap [64].

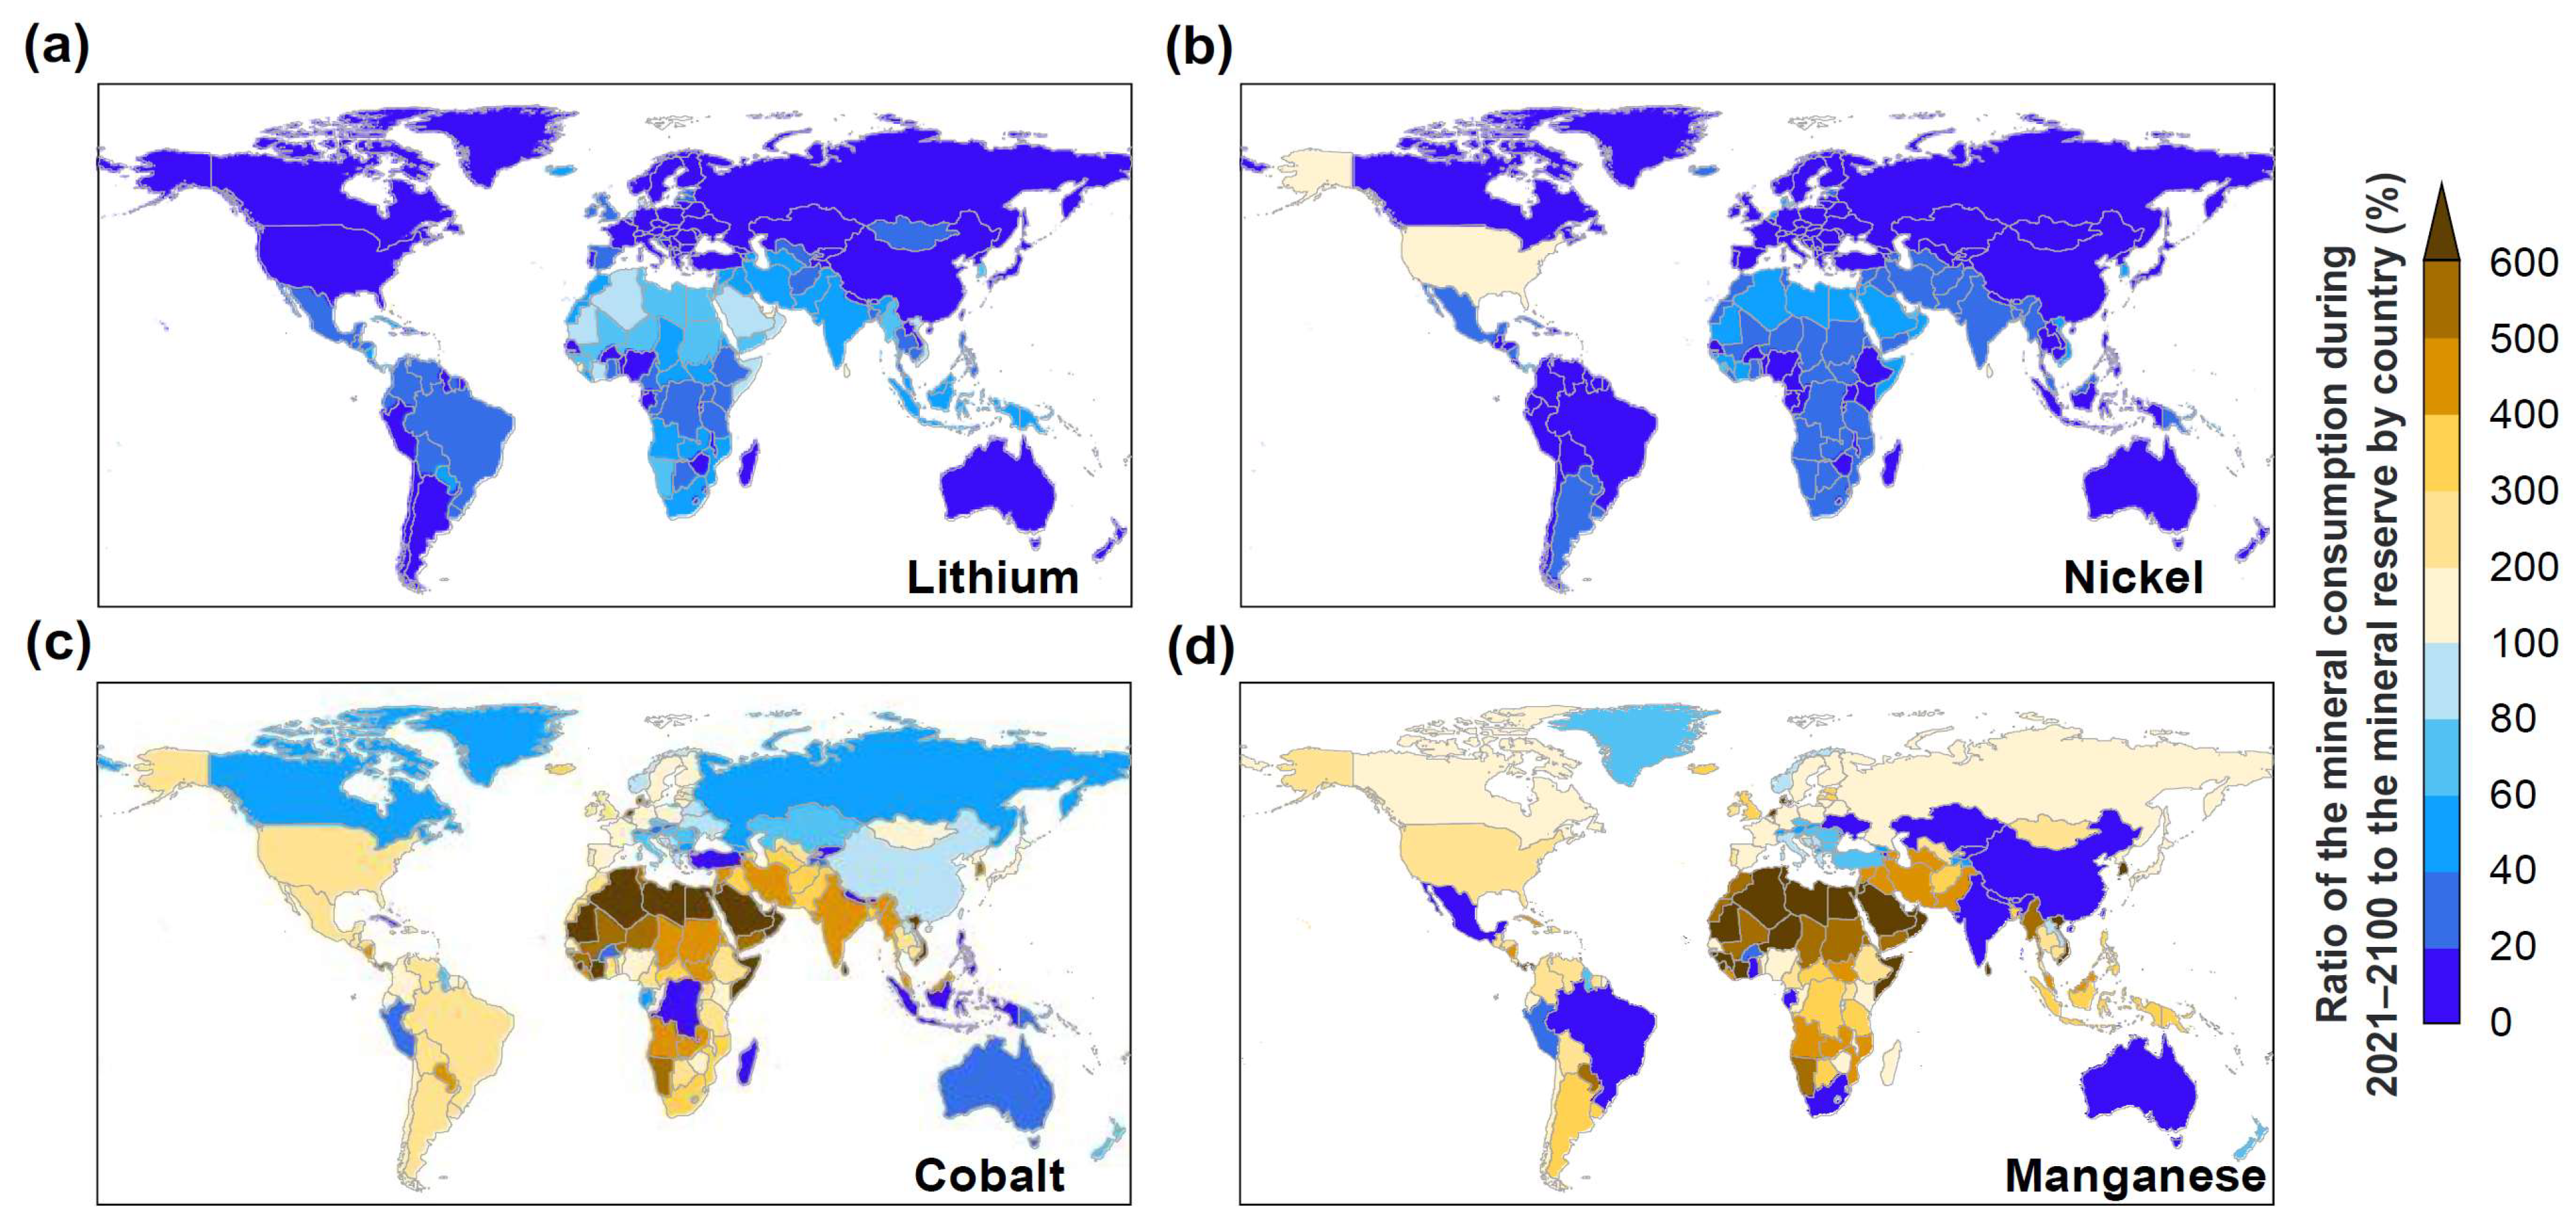
3.5. Limitation to Energy Storage by Mineral Reserves

Under the assumption of significant battery consumption in the forecast, the demand for minerals is projected to skyrocket. We next explored how much the demand for minerals, including lithium, nickel, cobalt, and manganese in 2021–2100, in the manufacture of NCM523 batteries could be met by the reserves of minerals across countries, when energy storage batteries satisfy 10% of the demand for energy storage of wind and PV. It is worth noting that the distribution of the reserves of these minerals is uneven worldwide [65]. For example, the reserves of manganese are primarily concentrated in South Africa, China, Australia, and Brazil, accounting for 38%, 16%, 16%, and 16% of global manganese reserves, respectively, while Australia, Indonesia, and Brazil contribute to 21%, 21%, and 16% of global total reserves of nickel [53]. We estimated the ratio of the total demand for minerals in the manufacture of NCM523 batteries to the reserve in each country and region for a 2 °C case in the SSP1-2.6 scenario when the cycle life of batteries was2000 cycles (Figure 5). In this case, the global manufacture of NCM523 batteries in 2021–2100 would consume 1.77 Mt of lithium, 7.50 Mt of nickel, 3.01 Mt of cobalt, and 4.21 Mt of manganese, which would be 6.8%, 7.3%, 36%, and 0.24% of global reserves, respectively. Meanwhile, the domestic reserves of lithium and nickel could meet the demand in the majority of countries and regions, but the demand for cobalt and manganese in more than 50% of countries would require import from other countries. While 14 and 11 of 192 countries and regions require import of lithium and nickel from other countries, there are 135 and 140 countries and regions requiring import of cobalt and manganese in the manufacture of NCM523 batteries. The predicted consumption of cobalt in 2021–2100 would be 187, 167, 131, 108, and 65 kt in the United States, Brazil, Algeria, India, and Argentina, while only 69, 70, 19, 26, and 23 kt of cobalt could be produced in these five countries, respectively. The analysis of mineral resource consumption caused by manufacturing energy storage batteries provides practical insights into the sustainability and resource implications of adopting battery storage systems and may support strategic resource management. To align with the 2 °C target in the SSP1-2.6 scenario, either the international trade of minerals or the global supply chain of batteries is needed to satisfy the requirement of energy storage [65]. In addition, by further considering the extraction, processing, and transportation of raw materials, it can contribute to the broader evaluation of the environmental footprint associated with battery manufacturing [66].
We compared the demand for energy storage batteries and minerals under specific warming targets in the SSP1-1.9 and SSP1-2.6 scenarios with biomass storage. To meet a more stringent target on global warming, the demand for both energy storage batteries and minerals rises significantly, which increases the fraction of minerals that need to be traded across countries (Table 1). To align with the 2 °C target, we predicted that 0.7%, 1.7%, 51.3%, and 49.6% of lithium, nickel, cobalt, and manganese consumed in the manufacture of NCM523 batteries in 2021–2100 need to be imported from other countries and regions in the SSP1-2.6 scenario. Regarding cobalt and manganese, we identified the ten largest flow routes from countries with the highest spare reserves to countries with the largest consumption minus reserves (Figure S6). For example, the United States, Algeria, Saudi Arabia, Libya, Sudan, Mauritania, Niger, Iran, Mali, and Argentina are ten countries with the largest manganese deficit, which are projected to deplete their reserves by the middle of this century and subsequently require import of manganese from South Africa. Mineral shortages could have a significant impact on the energy security, domestic industry, and economic stability in many countries [67]. Deficit countries should be aware of the importance of diversifying their sources of mineral imports to mitigate the potential risks associated with the heavy dependence on a single supplier, such as price volatility, supply disruptions, and vulnerabilities to geopolitical factors [68]. Ensuring a safe and sustainable supply of mineral resources will involve strategic planning, international cooperation, and forming trade partnerships. In addition, our results also reinforce the necessity of improving global mineral recycling if a large fraction of minerals were consumed to meet the demand for energy storage when meeting the Paris target [65].
The environmental impacts of mining cannot be ignored when obtaining mineral resources, such as water contamination, soil destruction, air pollution, greenhouse gas emissions, and biodiversity loss [69,70,71]. The reclamation of mining areas could destroy the structure of soil, leading to deforestation and exacerbation of ecosystem functioning [71]. As a consequence, this could result in habitat loss and species migration [70]. In addition, the environment of working conditions in mining should be improved by reducing the exposure of harmful chemicals and the risk of fires, cave-ins, and explosions [72]. Further, the effectiveness of renewable power generation could be improved through environmental education [73], energy efficiency improvements [74], and the optimization of industrial production processes. Energy transition towards renewable power by adopting appropriate energy storage technologies are crucial steps to slowing down the rate of global warming, where environmental, social, and geopolitical issues should be considered in actions.

4. Conclusions

We evaluate the impact of temporal fluctuations in the power supply of wind, PV, and bioenergy on global warming, which elucidates the emerging demand for energy storage when meeting the Paris target to limit global warming below 2 °C at the end of this century. In the absence of energy storage, the global power generation of wind, PV, and BECCS would be reduced by approximately 20%, 55%, and 60%, respectively, resulting in an increase of more than 20% in global warming by 2100 in the SSP1-2.6 scenario and a failure to achieve the 2 °C target. Development of large-scale energy storage systems is crucial to enhance the stability and security of energy systems when using renewable energy to phase-down fossil fuels. By considering the demand for energy storage in the Earth system model, we clarify the relationship between the capacity of energy storage and the effects of deploying renewable energy in reducing global warming. We demonstrate the demand for the capacity of energy storage using batteries, as well as the consumption of minerals (i.e., lithium, nickel, cobalt, and manganese) in the manufacture of NCM523 batteries, which both depend on the cycle life of batteries. Achieving the 2 °C target almost requires satisfying 30% of the demand for energy storage for wind and PV power in the SSP1-2.6 scenario, which delivers a total battery storage capacity of 16.46 TWh during the period 2021–2100, corresponding to the consumption of 1.77 Mt of lithium, 7.50 Mt of nickel, 3.01 Mt of cobalt, and 4.21 Mt of manganese in the battery manufacturing process. We consequently identify the gap between demand and reserves of cobalt and manganese for a large number of countries, highlighting the necessity of developing the international trade of minerals or establishing a global supply chain of batteries to meet the demand for energy storage when fossil fuels have been largely phased down. We provide practical insights into the sustainability and resource implications of adopting battery storage systems [75] and may help estimate the economic opportunities associated with battery manufacturing and maintenance [76]. The 28th United Nations Climate Change Conference (COP28) aims at shifting the first global stocktake to the increased ambition of climate change mitigation by accelerating inclusive and just actions [77]. Therefore, the potential shortage of energy storage facilities should be fully taken into account when designing polices to meet ambitious climate targets, which could motivate investments in developing efficient technologies for energy storage.

Supplementary Materials

The following supporting information can be downloaded at: https://www.mdpi.com/article/10.3390/su16093753/s1, Figure S1: Projection of energy production in three Shared Socioeconomic Pathway (SSP) scenarios; Figure S2: Projection of global warming in three Shared Socioeconomic Pathway (SSP) scenarios; Figure S3: Projection of atmospheric CO2 concentration and CO2 emissions in three Shared Socioeconomic Pathway (SSP) scenarios; Figure S4: Interpolation of wind, PV, and bioenergy between any two neighboring Shared Socioeconomic Pathway (SSP) scenarios; Figure S5: Global distribution of wind and solar resources; Figure S6: International trade of cobalt and manganese in the 2 °C case under the SSP1-2.6 scenario; Table S1: Thresholds of screening pixels that are suitable for installing wind turbines and PV panels.

Author Contributions

Conceptualization, Y.D. and R.W.; methodology, Y.D. and R.W.; software, Y.D., Y.W. and S.X.; formal analysis, Y.D.; investigation, Y.W., X.X., Y.X. and S.X.; writing—original draft preparation, Y.D. and R.W.; writing—review and editing, Y.W., X.X., Y.X. and S.X.; visualization, Y.D.; supervision, R.W. All authors have read and agreed to the published version of the manuscript.

Funding

This research was funded by the National Natural Science Foundation of China (grant number: 41877506; 42341205; 42307128), the National Key R&D Program of China (grant number: 2022YFF0802504), and the Cultivation Project of Science and Technology Innovation Action Plan in Shanghai 2023 (Yangfan: 23YF1401500).

Institutional Review Board Statement

Not applicable.

Informed Consent Statement

Not applicable.

Data Availability Statement

The code for the Earth system model is available at: https://iiasa.ac.at/models-tools-data/oscar (accessed on 15 January 2022 ). The data for global power demand, energy production by geothermal, hydro and nuclear, CO2 emissions from land use change, and radiative forcing for non-CO2 GHGs during the period 2020–2100 are available at: https://tntcat.iiasa.ac.at/SspDb/dsd?Action=htmlpage&page=welcome (accessed on 15 January 2022).

Conflicts of Interest

The authors declare no conflicts of interest.

References

  1. Intergovernmental Panel on Climate Change (IPCC). In Climate Change 2021: The Physical Science Basis. Contribution of Working Group I to the Sixth Assessment Report of the Intergovernmental Panel on Climate Change. 2021. Available online: https://www.ipcc.ch/assessment-report/ar6/ (accessed on 21 April 2022).
  2. United Nations Framework Convention on Climate Change (UNFCCC). Paris Agreement—Status of Ratification. 2021. Available online: https://unfccc.int/process/the-paris-agreement/status-of-ratification (accessed on 4 April 2022).
  3. Dai, H.J. Roles of Surface Albedo, Surface Temperature and Carbon Dioxide in the Seasonal Variation of Arctic Amplification. Geophys. Res. Lett. 2021, 48, e2020GL090301. [Google Scholar] [CrossRef]
  4. De la Peña, L.; Guo, R.; Cao, X.J.; Ni, X.J.; Zhang, W. Accelerating the energy transition to achieve carbon neutrality. Resour. Conserv. Recycl. 2022, 177, 105957. [Google Scholar] [CrossRef]
  5. Ma, Q.; Tariq, M.; Mahmood, H.; Khan, Z. The nexus between digital economy and carbon dioxide emissions in China: The moderating role of investments in research and development. Technol. Soc. 2022, 68, 101910. [Google Scholar] [CrossRef]
  6. Arent, D.J.; Green, P.; Abdullah, Z.; Barnes, T.; Bauer, S.; Bernstein, A.; Berry, D.; Berry, J.; Burrell, T.; Carpenter, B.; et al. Challenges and opportunities in decarbonizing the US energy system. Renew. Sust. Energ. Rev. 2022, 169, 112939. [Google Scholar] [CrossRef]
  7. Nakicenovic, N.; Lund, P.D. Could Europe become the first climate-neutral continent? Nature 2021, 596, 486. [Google Scholar] [CrossRef]
  8. Kim, J.K.; Park, H.; Kim, S.J.; Lee, J.; Song, Y.; Yi, S.C. Optimization models for the cost-effective design and operation of renewable-integrated energy systems. Renew. Sust. Energ. Rev. 2023, 183, 113429. [Google Scholar] [CrossRef]
  9. Azarinfar, H.; Khosravi, M.; Sabzevari, K.; Dzikuc, M. Stochastic Economic-Resilience Management of Combined Cooling, Heat, and Power-Based Microgrids in a Multi-Objective Approach. Sustainability 2024, 16, 1212. [Google Scholar] [CrossRef]
  10. Intergovernmental Panel on Climate Change (IPCC). In Climate Change 2022: Mitigation of Climate Change. Working Group III Contribution to the IPCC Sixth Assessment Report. 2022. Available online: https://www.ipcc.ch/report/sixth-assessment-report-working-group-3/ (accessed on 25 April 2024).
  11. Ma, Y.H.; Xie, K.G.; Zhao, Y.A.; Yang, H.J.; Zhang, D.B. Bi-objective Layout Optimization for Multiple Wind Farms Considering Sequential Fluctuation of Wind Power Using Uniform Design. CSEE J. Power Energy Syst. 2022, 8, 1623–1635. [Google Scholar] [CrossRef]
  12. Xia, W.Y.; Ren, Z.Y.; Li, H.; Hu, B. A power fluctuation evaluation method of PV plants based on RankBoost ranking. Prot. Control Mod. Power Syst. 2021, 6, 27. [Google Scholar] [CrossRef]
  13. Poblete, I.B.S.; Araujo, O.D.F.; de Medeiros, J.L. Dynamic analysis of sustainable biogas-combined-cycle plant: Time-varying demand and bioenergy with carbon capture and storage. Renew. Sust. Energ. Rev. 2020, 131, 109997. [Google Scholar] [CrossRef]
  14. Yang, M.; Wang, D.; Xu, C.Y.; Dai, B.Z.; Ma, M.M.; Su, X. Power transfer characteristics in fluctuation partition algorithm for wind speed and its application to wind power forecasting. Renew. Energy 2023, 211, 582–594. [Google Scholar] [CrossRef]
  15. Chen, S.; Lu, X.; Miao, Y.F.; Deng, Y.; Nielsen, C.P.; Elbot, N.; Wang, Y.C.; Logan, K.G.; McElroy, M.B.; Hao, J.M. The Potential of Photovoltaics to Power the Belt and Road Initiative. Joule 2019, 3, 1895–1912. [Google Scholar] [CrossRef]
  16. Waha, K.; Dietrich, J.P.; Portmann, F.T.; Siebert, S.; Thornton, P.K.; Bondeau, A.; Herrero, M. Multiple cropping systems of the world and the potential for increasing cropping intensity. Glob. Environ. Chang.-Hum. Policy Dimens. 2020, 64, 102131. [Google Scholar] [CrossRef] [PubMed]
  17. Li, J.D.; Chen, S.J.; Wu, Y.Q.; Wang, Q.H.; Liu, X.; Qi, L.J.; Lu, X.Y.; Gao, L. How to make better use of intermittent and variable energy? A review of wind and photovoltaic power consumption in China. Renew. Sust. Energ. Rev. 2021, 137, 110626. [Google Scholar] [CrossRef]
  18. Jafari, M.; Botterud, A.; Sakti, A. Decarbonizing power systems: A critical review of the role of energy storage. Renew. Sust. Energ. Rev. 2022, 158, 112077. [Google Scholar] [CrossRef]
  19. Peng, W.; Sadaghiani, O.K. An Analytical Review on the Utilization of Machine Learning in the Biomass Raw Materials, Their Evaluation, Storage, and Transportation. Arch. Comput. Method Eng. 2023, 30, 4711–4732. [Google Scholar] [CrossRef]
  20. Li, Q.; Li, Z.; Zhang, Z.; Tao, Y.; Bian, R. Energy storage capacity optimization strategy for combined wind storage system. Energy Rep. 2022, 8, 247–252. [Google Scholar] [CrossRef]
  21. Tejero-Gómez, J.A.; Bayod-Rujula, A.A. Analysis of Photovoltaic Plants with Battery Energy Storage Systems (PV-BESS) for Monthly Constant Power Operation. Energies 2023, 16, 4909. [Google Scholar] [CrossRef]
  22. Gasser, T.; Crepin, L.; Quilcaille, Y.; Houghton, R.A.; Ciais, P.; Obersteiner, M. Historical CO2 emissions from land use and land cover change and their uncertainty. Biogeosciences 2020, 17, 4075–4101. [Google Scholar] [CrossRef]
  23. Gasser, T.; Kechiar, M.; Ciais, P.; Burke, E.J.; Kleinen, T.; Zhu, D.; Huang, Y.; Ekici, A.; Obersteiner, M. Path-dependent reductions in CO2 emission budgets caused by permafrost carbon release. Nat. Geosci. 2018, 11, 830–835. [Google Scholar] [CrossRef]
  24. Quilcaille, Y.; Gasser, T.; Ciais, P.; Boucher, O. CMIP6 simulations with the compact Earth system model OSCAR v3.1. Geosci. Model Dev. 2023, 16, 1129–1161. [Google Scholar] [CrossRef]
  25. Gelaro, R.; McCarty, W.; Suárez, M.J.; Todling, R.; Molod, A.; Takacs, L.; Randles, C.A.; Darmenov, A.; Bosilovich, M.G.; Reichle, R.; et al. The Modern-Era Retrospective Analysis for Research and Applications, Version 2 (MERRA-2). J. Clim. 2017, 30, 5419–5454. [Google Scholar] [CrossRef]
  26. Global Modeling and Assimilation Office (GMAO). GEOS Atmospheric Assimilation Products. 2021. Available online: https://gmao.gsfc.nasa.gov/GMAO_products/NRT_products.php (accessed on 2 September 2022).
  27. Food and Agriculture Organization of the United Nations (FAO). FAOSTAT. 2019. Available online: https://www.fao.org/faostat/en/#data (accessed on 30 June 2021).
  28. U.S. Department of Agriculture Foreign Agricultural Service (FAS). Country Summary. 2023. Available online: https://ipad.fas.usda.gov/countrysummary/?id=US (accessed on 20 May 2023).
  29. Bauer, N.; Calvin, K.; Emmerling, J.; Fricko, O.; Fujimori, S.; Hilaire, J.; Eom, J.; Krey, V.; Kriegler, E.; Mouratiadou, I.; et al. Shared Socio-Economic Pathways of the Energy Sector—Quantifying the Narratives. Glob. Environ. Chang.-Hum. Policy Dimens. 2017, 42, 316–330. [Google Scholar] [CrossRef]
  30. International Institute for Applied Systems Analysis (IIASA). SSP Database (Shared Socioeconomic Pathways)—Version 2.0. 2018. Available online: https://tntcat.iiasa.ac.at/SspDb/dsd?Action=htmlpage&page=welcome (accessed on 15 January 2022).
  31. Gasser, T.; Ciais, P.; Boucher, O.; Quilcaille, Y.; Tortora, M.; Bopp, L.; Hauglustaine, D. The compact Earth system model OSCAR v2.2: Description and first results. Geosci. Model Dev. 2017, 10, 271–319. [Google Scholar] [CrossRef]
  32. Xu, S.Q.; Wang, R.; Gasser, T.; Ciais, P.; Penuelas, J.; Balkanski, Y.; Boucher, O.; Janssens, I.A.; Sardans, J.; Clark, J.H.; et al. Delayed use of bioenergy crops might threaten climate and food security. Nature 2022, 609, 299–306. [Google Scholar] [CrossRef]
  33. Ghugare, S.B.; Tambe, S.S. Genetic programming based high performing correlations for prediction of higher heating value of coals of different ranks and from diverse geographies. J. Energy Inst. 2017, 90, 476–484. [Google Scholar] [CrossRef]
  34. Schakel, W.; Meerman, H.; Talaei, A.; Ramírez, A.; Faaij, A. Comparative life cycle assessment of biomass co-firing plants with carbon capture and storage. Appl. Energy 2014, 131, 441–467. [Google Scholar] [CrossRef]
  35. Wang, Y.; Wang, R.; Tanaka, K.; Ciais, P.; Penuelas, J.; Balkanski, Y.; Sardans, J.; Hauglustaine, D.; Liu, W.; Xing, X.; et al. Accelerating the energy transition towards photovoltaic and wind in China. Nature 2023, 619, 761–767. [Google Scholar] [CrossRef]
  36. U.S. Geological-Survey (USGS). Land Cover Type Yearly L3 Global 500 m SIN Grid. 2014. Available online: https://lpdaac.usgs.gov/products/mcd12q1v006/ (accessed on 12 December 2021).
  37. U.S. Geological-Survey (USGS). Shuttle Radar Topography Mission (SRTM). 2015. Available online: https://earthexplorer.usgs.gov/ (accessed on 13 December 2021).
  38. Amatulli, G.; Domisch, S.; Tuanmu, M.N.; Parmentier, B.; Ranipeta, A.; Malczyk, J.; Jetz, W. A suite of global, cross-scale topographic variables for environmental and biodiversity modeling. Sci. Data 2018, 5, 1–15. [Google Scholar] [CrossRef]
  39. Resource and Environment Science and Data Center. Environmental Protection Areas. 2020. Available online: https://www.resdc.cn/data.aspx?DATAID=137 (accessed on 11 December 2021).
  40. Kumar, A.; Cameron, J.B.; Flynn, P.C. Biomass power cost and optimum plant size in western Canada. Biomass Bioenerg. 2003, 24, 445–464. [Google Scholar] [CrossRef]
  41. Friedlingstein, P.; O’Sullivan, M.; Jones, M.W.; Andrew, R.M.; Hauck, J.; Olsen, A.; Peters, G.P.; Peters, W.; Pongratz, J.; Sitch, S.; et al. Global Carbon Budget 2020. Earth Syst. Sci. Data 2020, 12, 3269–3340. [Google Scholar] [CrossRef]
  42. Harvard Dataverse. PLEXOS-World. 2020. Available online: https://dataverse.harvard.edu/dataverse/PLEXOS-World (accessed on 21 February 2023).
  43. Watil, A.; El Magri, A.; Lajouad, R.; Raihani, A.; Giri, F. Multi-mode control strategy for a stand-alone wind energy conversion system with battery energy storage. J. Energy Storage 2022, 51, 104481. [Google Scholar] [CrossRef]
  44. Zhu, Z.X.; Jiang, T.L.; Ali, M.; Meng, Y.H.; Jin, Y.; Cui, Y.; Chen, W. Rechargeable Batteries for Grid Scale Energy Storage. Chem. Rev. 2022, 122, 16610–16751. [Google Scholar] [CrossRef]
  45. International Energy Agency (IEA). Net Zero by 2050. 2021. Available online: https://www.iea.org/reports/net-zero-by-2050 (accessed on 11 December 2022).
  46. Energy Storage Application Branch of China Industrial Association of Power Sources (CESA). 2022 Energy Storage Industry Application Research Report. 2022. Available online: https://www.ciaps.org.cn/ (accessed on 4 February 2023).
  47. Sha, W.X.; Guo, Y.Q.; Cheng, D.P.; Han, Q.G.; Lou, P.; Guan, M.Y.; Tang, S.; Zhang, X.F.; Lu, S.F.; Cheng, S.J.; et al. Degradation mechanism analysis of LiNi0.5Co0.2Mn0.3O2 single crystal cathode materials through machine learning. NPJ Comput. Mater. 2022, 8, 223. [Google Scholar] [CrossRef]
  48. Xu, C.J.; Dai, Q.; Gaines, L.; Hu, M.M.; Tukker, A.; Steubing, B. Future material demand for automotive lithium-based batteries. Commun. Mater. 2020, 1, 99. [Google Scholar] [CrossRef]
  49. International Energy Agency (IEA). Global Supply Chains of EV Batteries 2022. Available online: https://www.iea.org/reports/global-supply-chains-of-ev-batteries (accessed on 5 February 2023).
  50. Fan, X.M.; Hu, G.R.; Zhang, B.; Ou, X.; Zhang, J.F.; Zhao, W.G.; Jia, H.P.; Zou, L.F.; Li, P.; Yang, Y. Crack-free single-crystalline Ni-rich layered NCM cathode enable superior cycling performance of lithium-ion batteries. Nano Energy 2020, 70, 104450. [Google Scholar] [CrossRef]
  51. Li, W.D.; Liu, X.M.; Celio, H.; Smith, P.; Dolocan, A.; Chi, M.F.; Manthiram, A. Mn versus Al in Layered Oxide Cathodes in Lithium-Ion Batteries: A Comprehensive Evaluation on Long-Term Cyclability. Adv. Energy Mater. 2018, 8, 1703154. [Google Scholar] [CrossRef]
  52. Liu, S.; Xiong, L.; He, C. Long cycle life lithium ion battery with lithium nickel cobalt manganese oxide (NCM) cathode. J. Power Sources 2014, 261, 285–291. [Google Scholar] [CrossRef]
  53. U.S. Geological-Survey (USGS). Commodity Statistics and Information by National Minerals Information Center. 2022. Available online: https://www.usgs.gov/centers/national-minerals-information-center/commodity-statistics-and-information (accessed on 7 December 2021).
  54. O’Neill, B.C.; Kriegler, E.; Ebi, K.L.; Kemp-Benedict, E.; Riahi, K.; Rothman, D.S.; van Ruijven, B.J.; van Vuuren, D.P.; Birkmann, J.; Kok, K.; et al. The roads ahead: Narratives for shared socioeconomic pathways describing world futures in the 21st century. Glob. Environ. Chang.-Hum. Policy Dimens. 2017, 42, 169–180. [Google Scholar] [CrossRef]
  55. Cherp, A.; Vinichenko, V.; Tosun, J.; Gordon, J.A.; Jewell, J. National growth dynamics of wind and solar power compared to the growth required for global climate targets. Nat. Energy 2021, 6, 742–754. [Google Scholar] [CrossRef]
  56. Hu, Q.; Xiang, M.T.; Chen, D.; Zhou, J.; Wu, W.B.; Song, Q. Global cropland intensification surpassed expansion between 2000 and 2010: A spatio-temporal analysis based on GlobeLand30. Sci. Total Environ. 2020, 746, 141035. [Google Scholar] [CrossRef]
  57. Mearns, E.; Sornette, D. Are 2050 energy transition plans viable? A detailed analysis of projected Swiss electricity supply and demand in 2050. Energy Policy 2023, 175, 113347. [Google Scholar] [CrossRef]
  58. Abbassi, A.; Dami, M.A.; Jemli, M. A statistical approach for hybrid energy storage system sizing based on capacity distributions in an autonomous PV/Wind power generation system. Renew. Energy 2017, 103, 81–93. [Google Scholar] [CrossRef]
  59. Amir, M.; Deshmukh, R.G.; Khalid, H.M.; Said, Z.; Raza, A.; Muyeen, S.; Nizami, A.-S.; Elavarasan, R.M.; Saidur, R.; Sopian, K. Energy storage technologies: An integrated survey of developments, global economical/environmental effects, optimal scheduling model, and sustainable adaption policies. J. Energy Storage 2023, 72, 108694. [Google Scholar] [CrossRef]
  60. He, Y.; Guo, S.; Zhou, J.X.; Wu, F.; Huang, J.; Pei, H.J. The quantitative techno-economic comparisons and multi-objective capacity optimization of wind-photovoltaic hybrid power system considering different energy storage technologies. Energy Conv. Manag. 2021, 229, 113779. [Google Scholar] [CrossRef]
  61. International Energy Agency (IEA). Lithium-Ion Battery Manufacturing Capacity, 2022–2030. 2023. Available online: https://www.iea.org/data-and-statistics/charts/lithium-ion-battery-manufacturing-capacity-2022-2030 (accessed on 4 April 2023).
  62. S&P Global Market Intelligence. Top Electric Vehicle Markets Dominate Lithium-Ion Battery Capacity Growth. 2021. Available online: https://www.spglobal.com/marketintelligence/en/news-insights/blog/top-electric-vehicle-markets-dominate-lithium-ion-battery-capacity-growth (accessed on 20 April 2023).
  63. Jajja, M.S.S.; Hassan, S.Z.; Asif, M.; Searcy, C. Manufacturing value chain for battery electric vehicles in Pakistan: An assessment of capabilities and transition pathways. J. Clean Prod. 2021, 328, 129512. [Google Scholar] [CrossRef]
  64. Sun, X.; Liu, Z.W.; Zhao, F.Q.; Hao, H. Global Competition in the Lithium-Ion Battery Supply Chain: A Novel Perspective for Criticality Analysis. Environ. Sci. Technol. 2021, 55, 12180–12190. [Google Scholar] [CrossRef] [PubMed]
  65. Zeng, A.Q.; Chen, W.; Rasmussen, K.D.; Zhu, X.H.; Lundhaug, M.; Muller, D.B.; Tan, J.; Keiding, J.K.; Liu, L.T.; Dai, T.; et al. Battery technology and recycling alone will not save the electric mobility transition from future cobalt shortages. Nat. Commun. 2022, 13, 1341. [Google Scholar] [CrossRef]
  66. Peters, J.F.; Baumann, M.; Zimmermann, B.; Braun, J.; Weil, M. The environmental impact of Li-Ion batteries and the role of key parameters–A review. Renew. Sustain. Energy Rev. 2017, 67, 491–506. [Google Scholar] [CrossRef]
  67. Calderon, J.L.; Bazilian, M.; Sovacool, B.; Hund, K.; Jowitt, S.M.; Nguyen, T.P.; Månberger, A.; Kah, M.; Greene, S.; Galeazzi, C.; et al. Reviewing the material and metal security of low-carbon energy transitions. Renew. Sust. Energ. Rev. 2020, 124, 109789. [Google Scholar] [CrossRef]
  68. Althaf, S.; Babbitt, C.W. Disruption risks to material supply chains in the electronics sector. Resour. Conserv. Recycl. 2021, 167, 105248. [Google Scholar] [CrossRef]
  69. Gao, J.-Q.; Yu, Y.; Wang, D.-H.; Wang, W.; Wang, C.-H.; Dai, H.-Z.; Hao, X.-F.; Cen, K. Effects of lithium resource exploitation on surface water at Jiajika mine, China. Environ. Monit. Assess. 2021, 193, 1–16. [Google Scholar] [CrossRef] [PubMed]
  70. Parker, S.S.; Clifford, M.J.; Cohen, B.S. Potential impacts of proposed lithium extraction on biodiversity and conservation in the contiguous United States. Sci. Total Environ. 2024, 911, 168639. [Google Scholar] [CrossRef] [PubMed]
  71. Worlanyo, A.S.; Jiangfeng, L. Evaluating the environmental and economic impact of mining for post-mined land restoration and land-use: A review. J. Environ. Manag. 2021, 279, 111623. [Google Scholar] [CrossRef] [PubMed]
  72. Li, K.K.; Wang, Y.M.; Zhang, Y.C.; Wang, S.S.; Zou, X.Y. Multi-Risk Assessment of Mine Lithium Battery Fire Based on Quantitative Factor Characterization. Int. J. Environ. Res. Public Health 2023, 20, 456. [Google Scholar] [CrossRef]
  73. Shutaleva, A.; Nikonova, Z.; Savchenko, I.; Martyushev, N. Environmental education for sustainable development in Russia. Sustainability 2020, 12, 7742. [Google Scholar] [CrossRef]
  74. Tan, L.; Yang, Z.; Irfan, M.; Ding, C.J.; Hu, M.; Hu, J. Toward low-carbon sustainable development: Exploring the impact of digital economy development and industrial restructuring. Bus. Strategy Environ. 2024, 33, 2159–2172. [Google Scholar] [CrossRef]
  75. Fan, E.; Li, L.; Wang, Z.; Lin, J.; Huang, Y.; Yao, Y.; Chen, R.; Wu, F. Sustainable recycling technology for Li-ion batteries and beyond: Challenges and future prospects. Chem. Rev. 2020, 120, 7020–7063. [Google Scholar] [CrossRef]
  76. Orangi, S.; Strømman, A.H. A techno-economic model for benchmarking the production cost of lithium-ion battery cells. Batteries 2022, 8, 83. [Google Scholar] [CrossRef]
  77. COP28 Presidency Summary. Energy and Industry, Just Transition, Indigenous Peoples. 2023. Available online: https://www.cop28.com/ (accessed on 10 January 2024).
Figure 1. Impacts of deploying energy storage on global warming and renewable energy in 2020–2100. (a) The projected global warming in the scenarios of SSP1-1.9, SSP1-2.6, and SSP2-4.5 with or without deploying energy storage. (bd) Consumption of wind, PV, and bioenergy in the scenarios of SSP2-4.5 (b), SSP1-2.6 (c), and SSP1-1.9 (d) with or without deploying energy storage.
Sustainability 16 03753 g001
Figure 2. Requirement on the deployment of energy storage to achieve the Paris target of global warming. (a,b) Reduction in global warming projected for 2100 when decreasing the fraction of energy storage requirement that has been satisfied without (a) or with (b) storing bioenergy by direct stockpiling of biomass. (c,d) Prediction of the fraction of increase in global warming in 2100 when decreasing the fraction of energy storage requirement that has been satisfied for wind and PV power without (c) or with (d) storing bioenergy by direct stockpiling of biomass. The dotted line denotes the Paris target by limiting global warming just below 2 °C.
Sustainability 16 03753 g002
Figure 3. Projection of the spatial distributions of wind (a), PV (b), and bioenergy (c) power generation for 192 countries and regions by 2100 in a baseline case of the SSP1-2.6 scenario by fulfilling the energy storage requirement (fx = 100%). Inserts compare the hourly power capacity of wind, PV, and bioenergy in January to March (JFM), April to June (AMJ), July to September (JAS), and October to December (OND) in the baseline case (dotted black line) with the projection in a case without energy storage by holding fx = 0 (red line). In addition, we consider a 2 °C case in the SSP1-2.6 scenario by holding fx = 28% (blue line).
Sustainability 16 03753 g003
Figure 4. (ac) Projection of global demand for the capacity of lithium-ion batteries in 2021–2100 to meet the requirement on energy storage for wind and PV power in the 2 °C case under the SSP1-2.6 scenario, when each battery can be used for 1000 cycles (a), 2000 cycles (b), and 3000 cycles (c). (df) Cumulative capacity of lithium-ion batteries needed since 2020 to meet the requirement on energy storage for wind and PV power in the 2 °C case under the SSP1-2.6 scenario, when each battery is used for 1000 cycles (d), 2000 cycles (e), and 3000 cycles (f).
Sustainability 16 03753 g004
Figure 5. The ratio of the predicted total consumption of lithium (a), nickel (b), cobalt (c), and manganese (d) in 2021–2100 in the manufacture of NCM523 (LiNi0.5Co0.2Mn0.3O2) batteries to the national reserve of each mineral in the 2 °C case under the SSP1-2.6 scenario.
Sustainability 16 03753 g005
Table 1. Consumption of batteries and minerals to meet the demand for energy storage under specific warming targets. The demand for energy storage by batteries during 2021–2100 is calculated when the cycle life of batteries is 2000 cycles under different warming targets in the SSP1-1.9 and SSP1-2.6 scenarios with direct stockpiling of biomass. The total consumption of lithium, nickel, cobalt, and manganese in the manufacture of batteries in 2021–2100 is calculated when meeting the demand for energy storage. The fraction of lithium, nickel, cobalt, and manganese consumed in all countries and regions that needed to be imported from other countries and regions due to the mineral shortage in each country or region is given in parentheses.
Global WarmingEnergy Storage by Batteries in 2021–2020 (TWh)Power Generation in
2021–2100 (PWh yr−1)
Consumption of Minerals in
2021–2100 (Million Tons)
WindPVBioenergyFossil FuelLithiumNickelCobaltManganese
SSP
1-2.6
2.0 °C16.465.4011.061.9221.311.77
(0.7%)
7.50
(1.7%)
3.01
(51.3%)
4.21
(49.6%)
1.9 °C73.385.7813.921.9318.057.90
(39.0%)
33.44
(23.2%)
13.43
(82.5%)
18.79
(79.3%)
1.8 °C199.216.1616.791.9414.8021.45
(61.9%)
90.79
(57.8%)
36.47
(90.5%)
51.00
(80.4%)
SSP
1-1.9
1.6 °C7.895.259.142.9116.160.85
(0.3%)
3.60
(0.3%)
1.44
(31.4%)
2.02
(34.3%)
1.5 °C37.205.6311.822.9113.084.01
(14.1%)
16.96
(3.1%)
6.81
(70.4%)
9.52
(69.2%)
1.4 °C105.395.9914.422.9210.1111.35
(50.8%)
48.03
(35.9%)
19.29
(85.9%)
26.98
(80.9%)
Disclaimer/Publisher’s Note: The statements, opinions and data contained in all publications are solely those of the individual author(s) and contributor(s) and not of MDPI and/or the editor(s). MDPI and/or the editor(s) disclaim responsibility for any injury to people or property resulting from any ideas, methods, instructions or products referred to in the content.

