
Analysis of the Ongoing Effects of Disasters in Urbanization Process and Climate Change: China’s Floods and Droughts


 , and
, and
Abstract
:1. Introduction
2. Data and Method
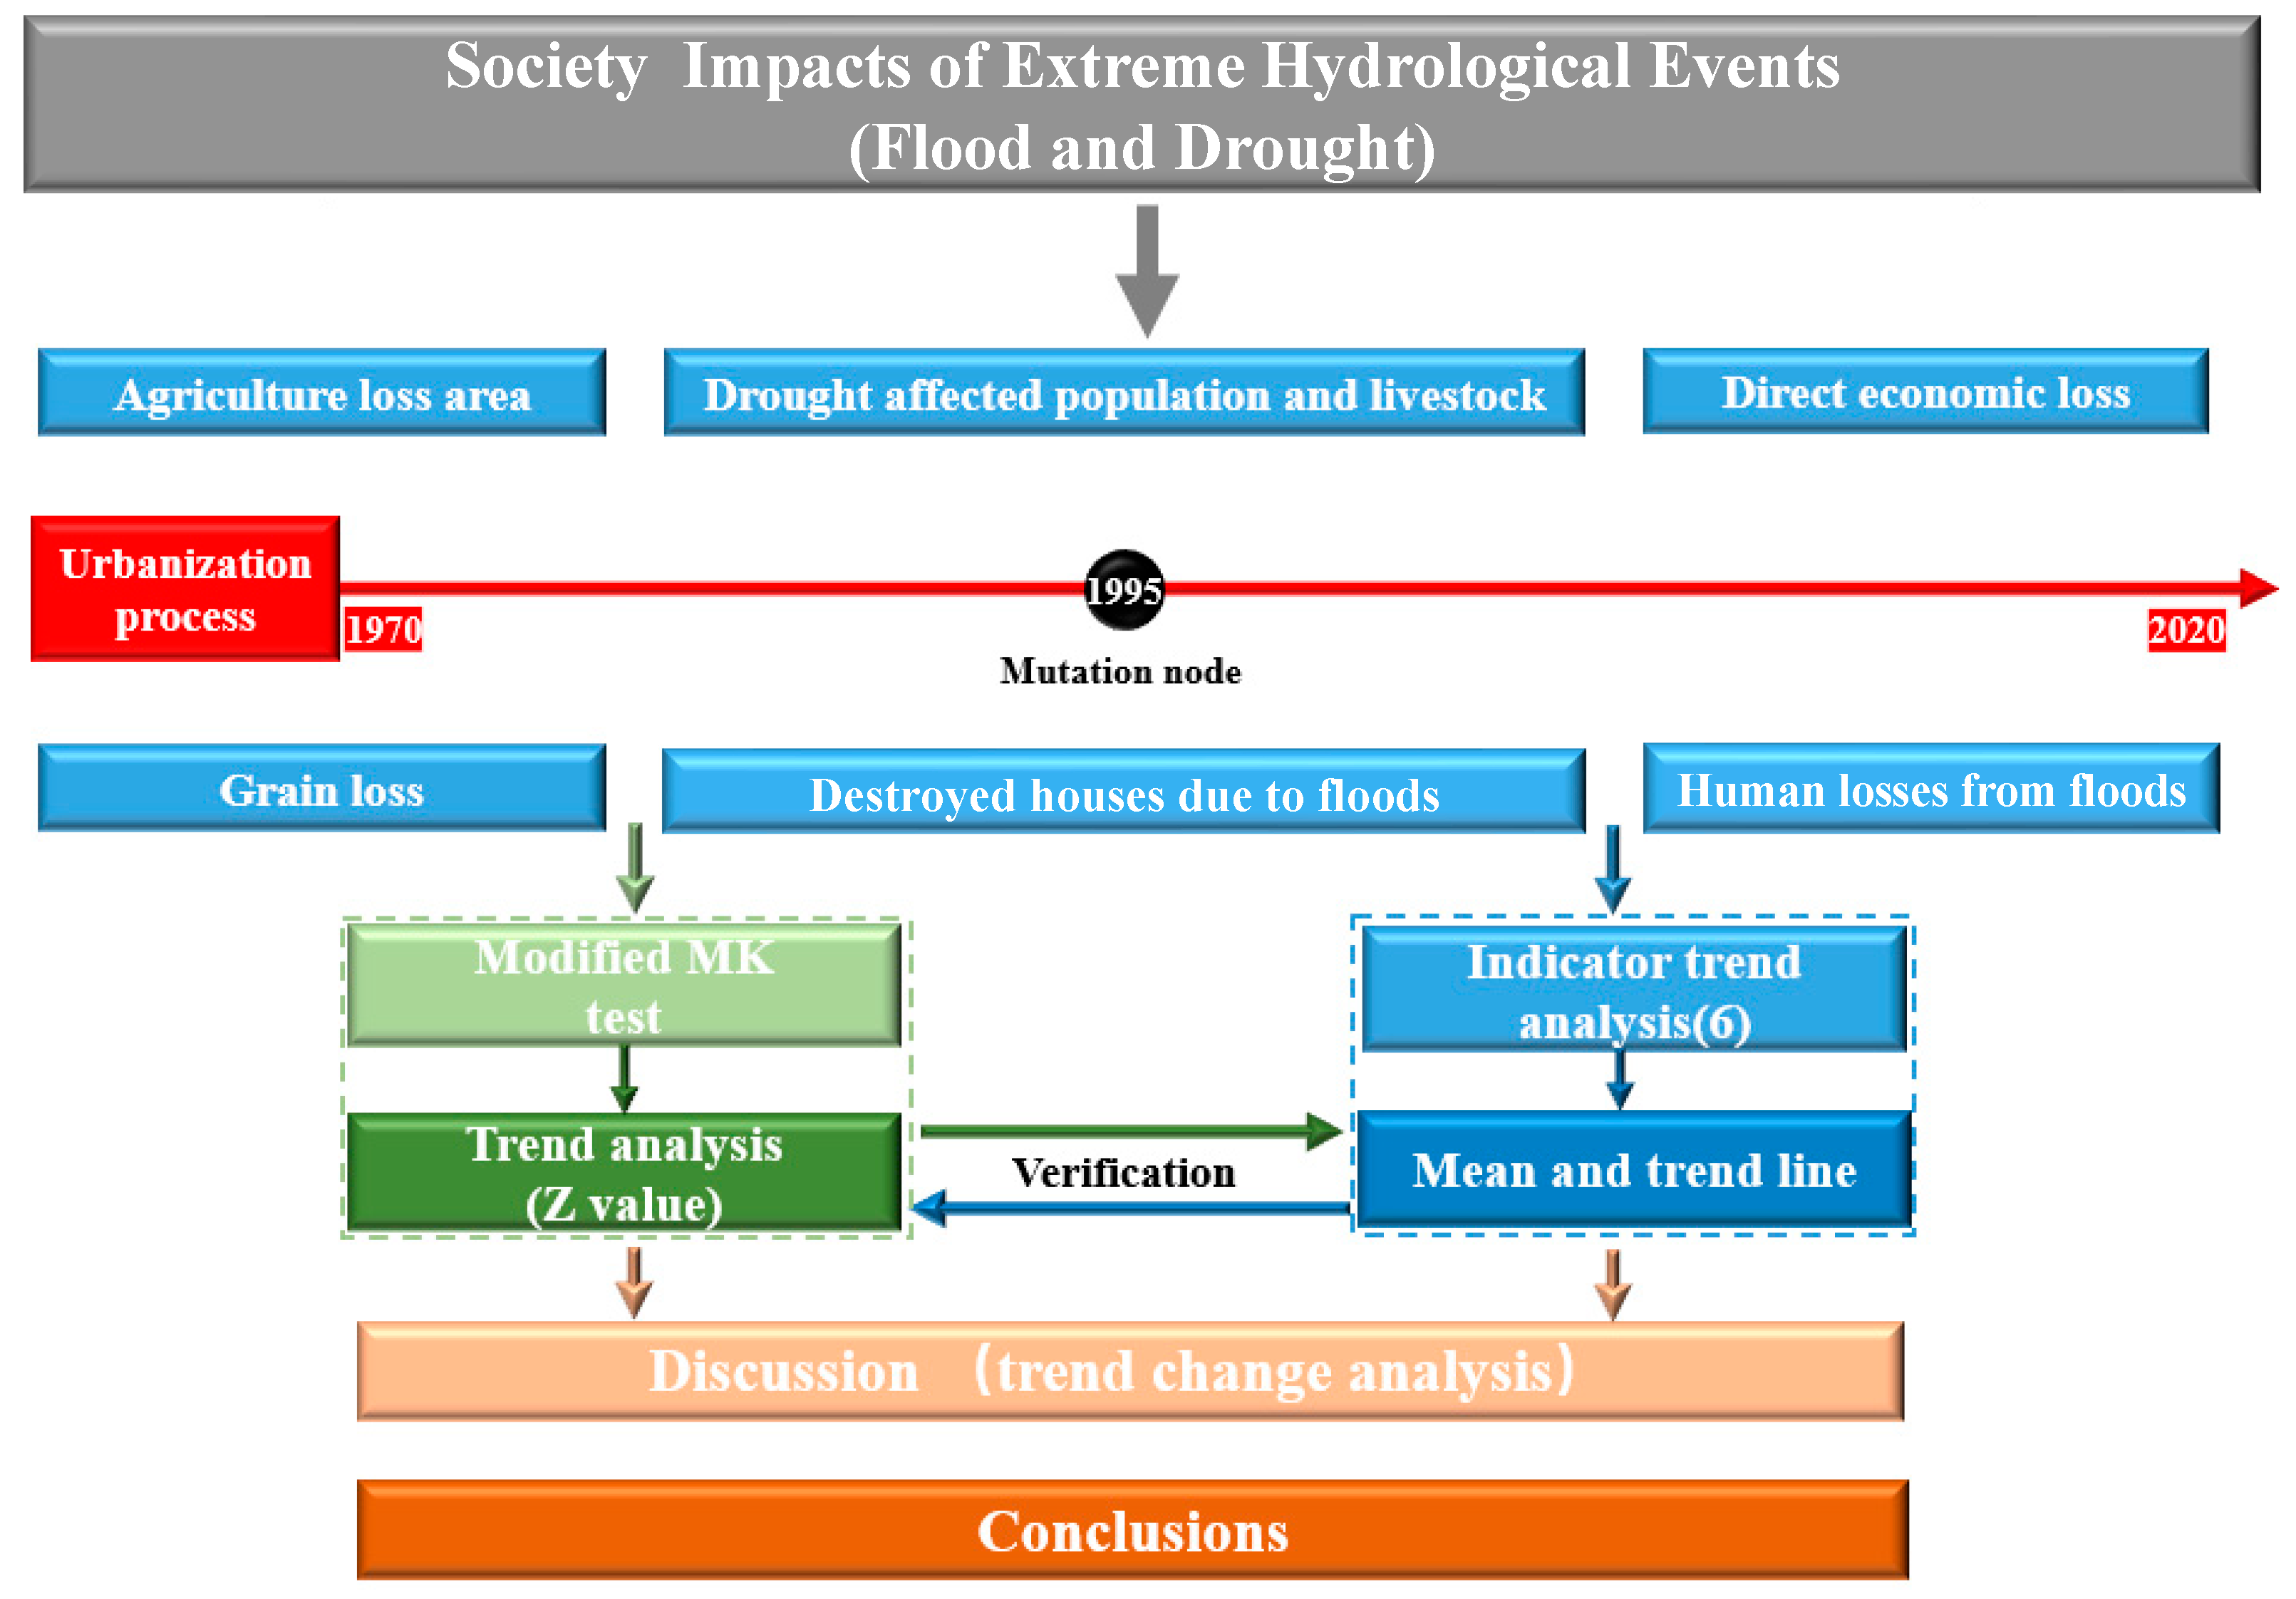
2.1. Frame
2.2. Data Sources
2.3. Methods
3. Result
3.1. Modified Mann–Kendall Test
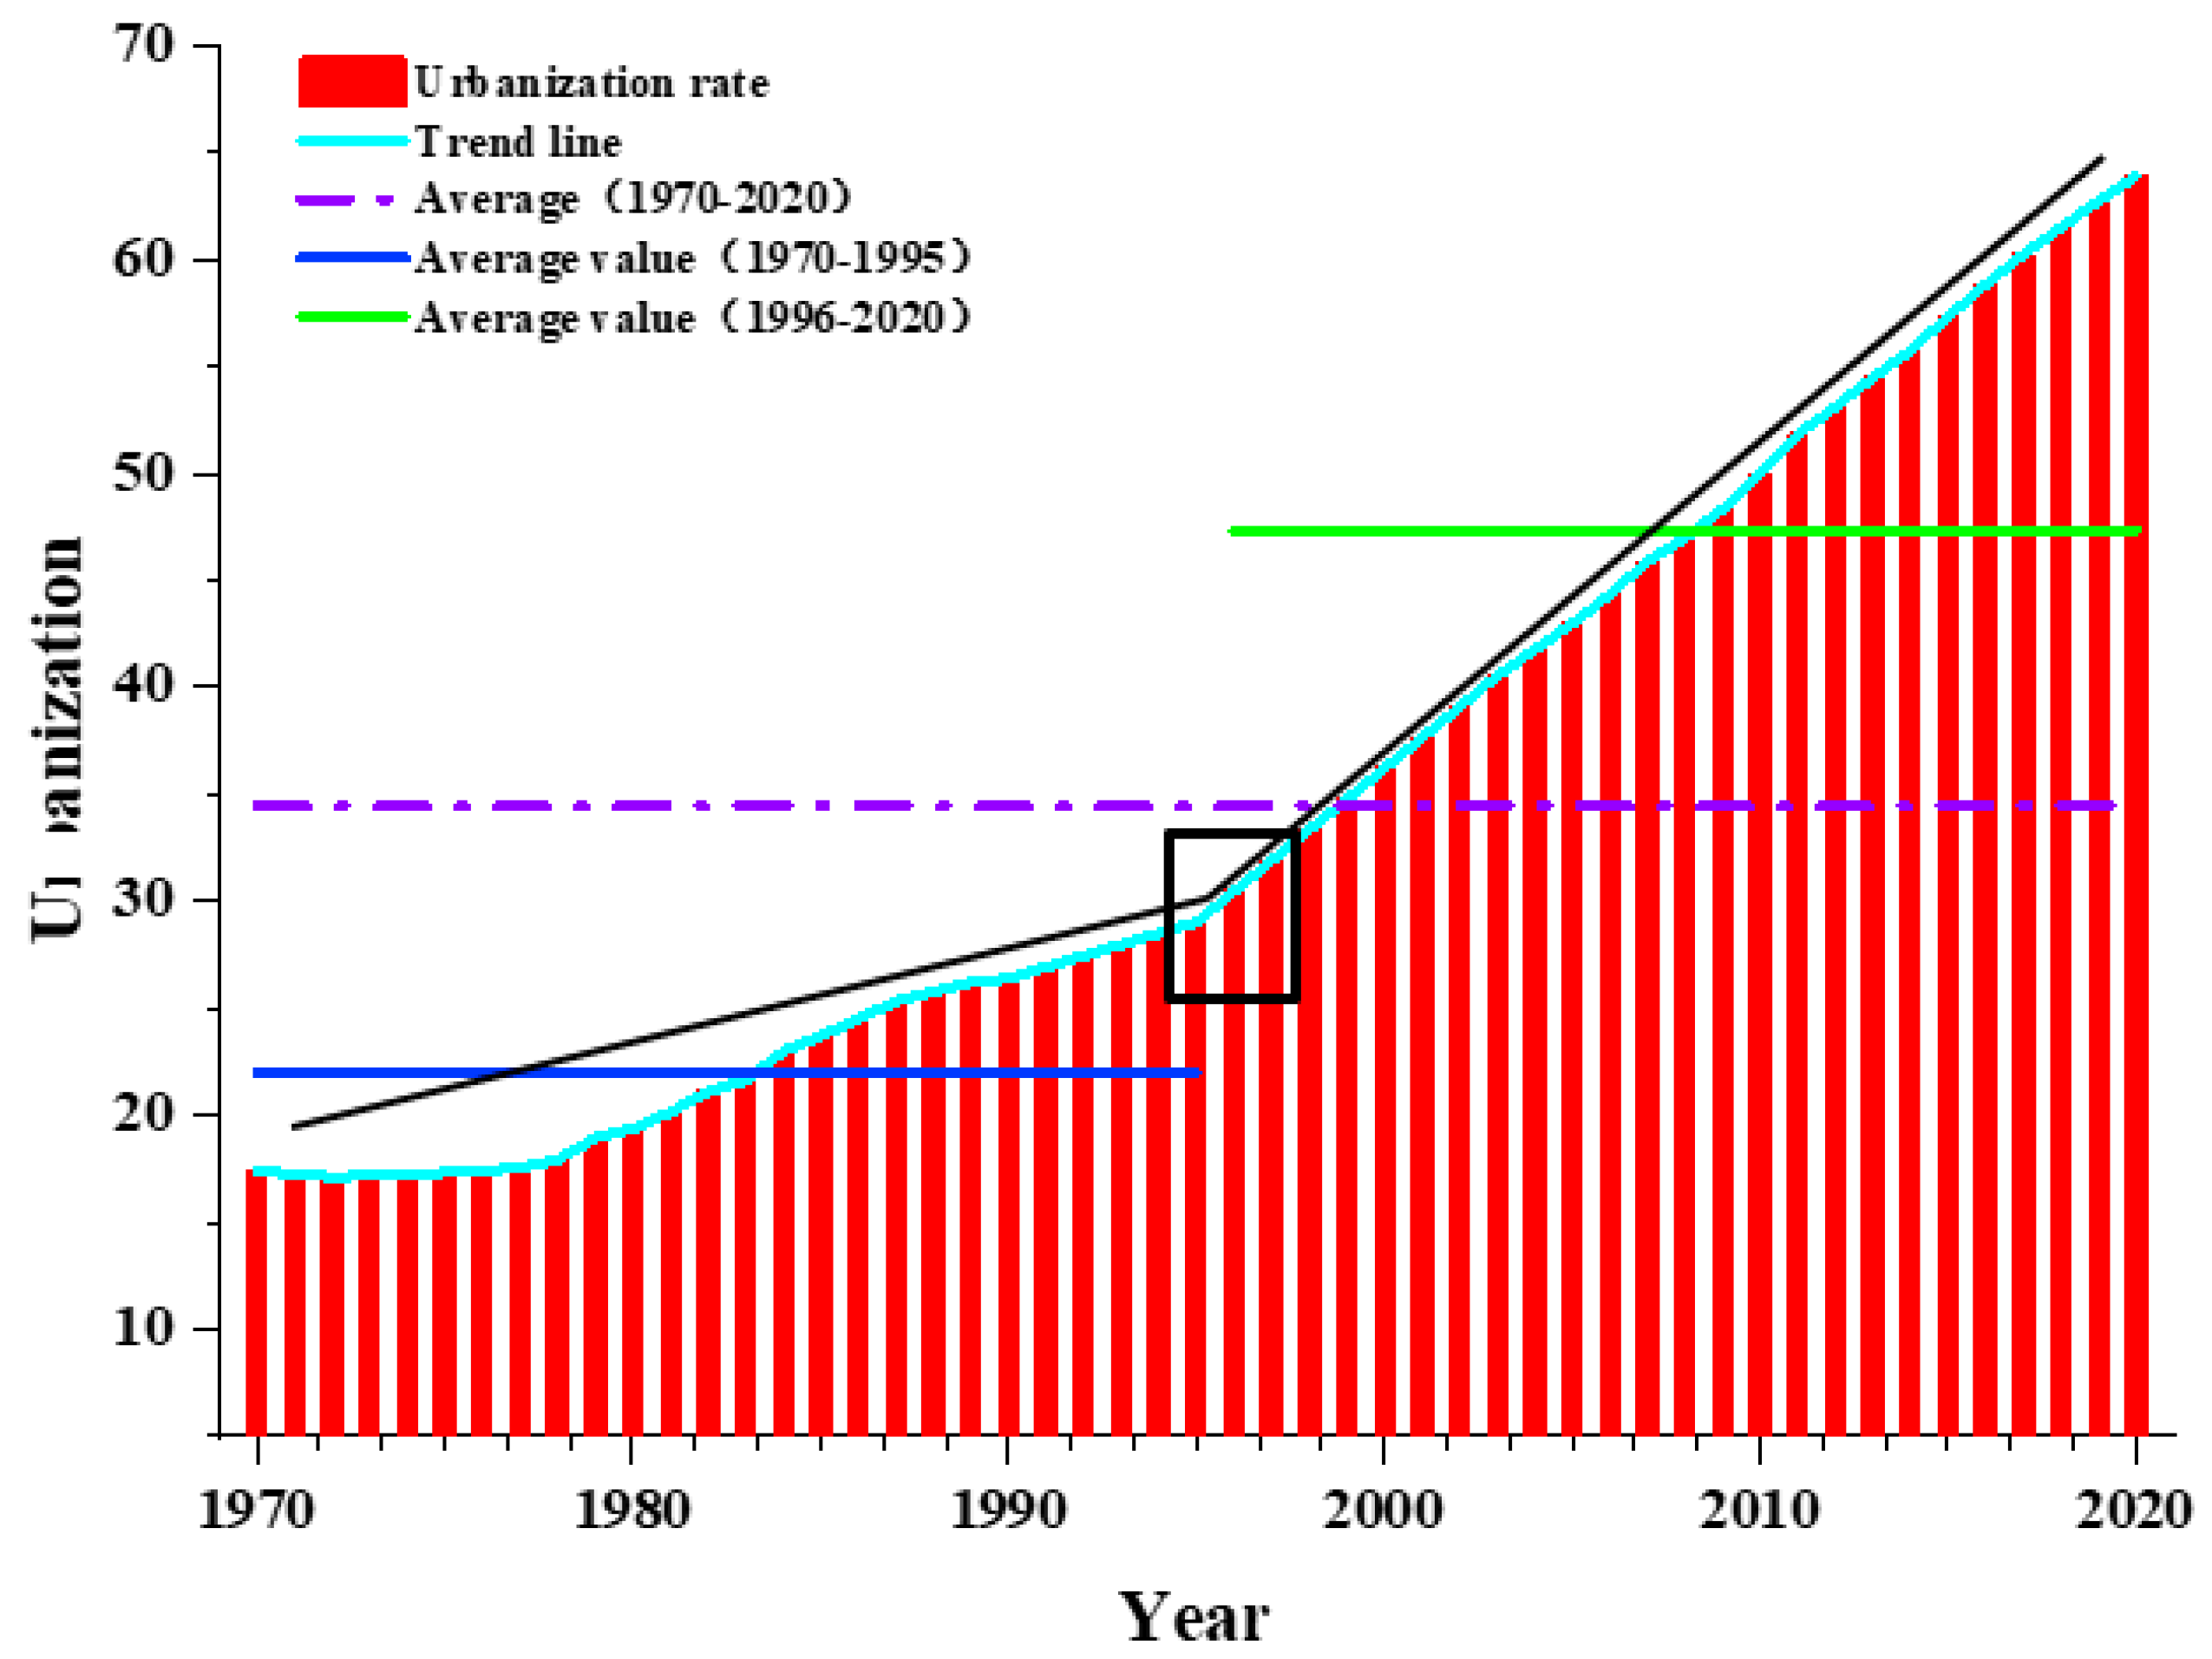
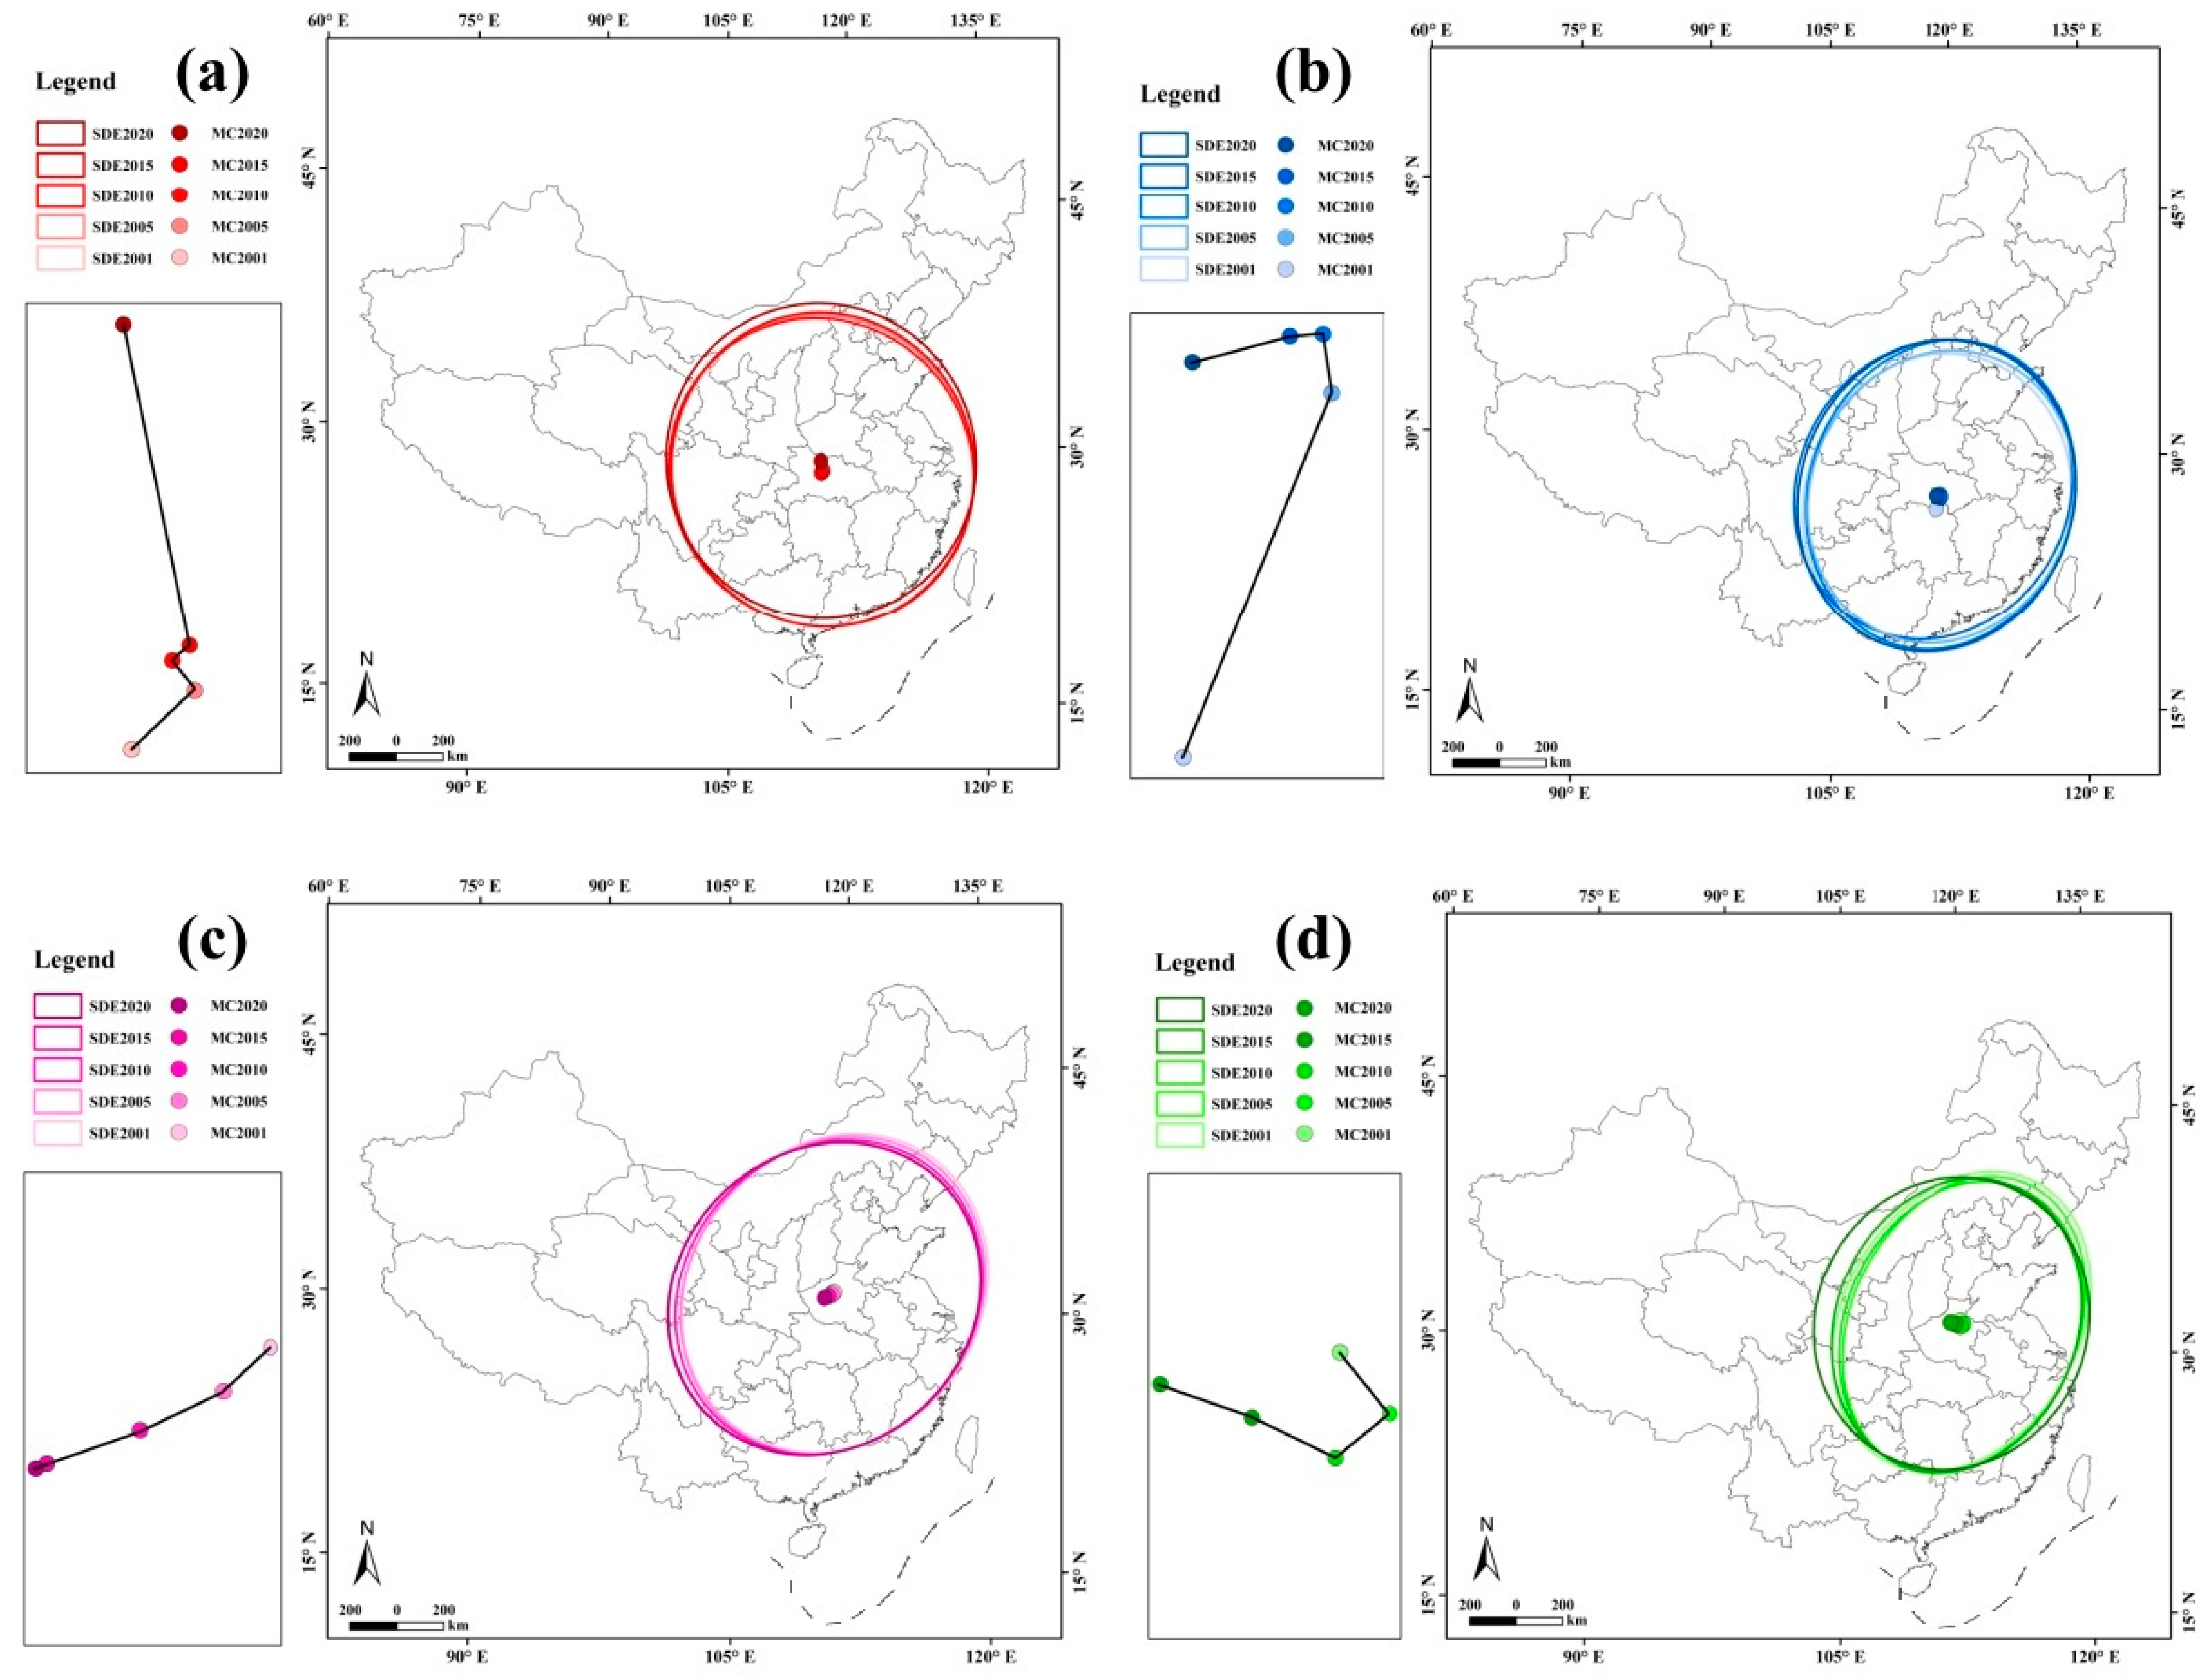
3.2. Urbanization Process Analysis
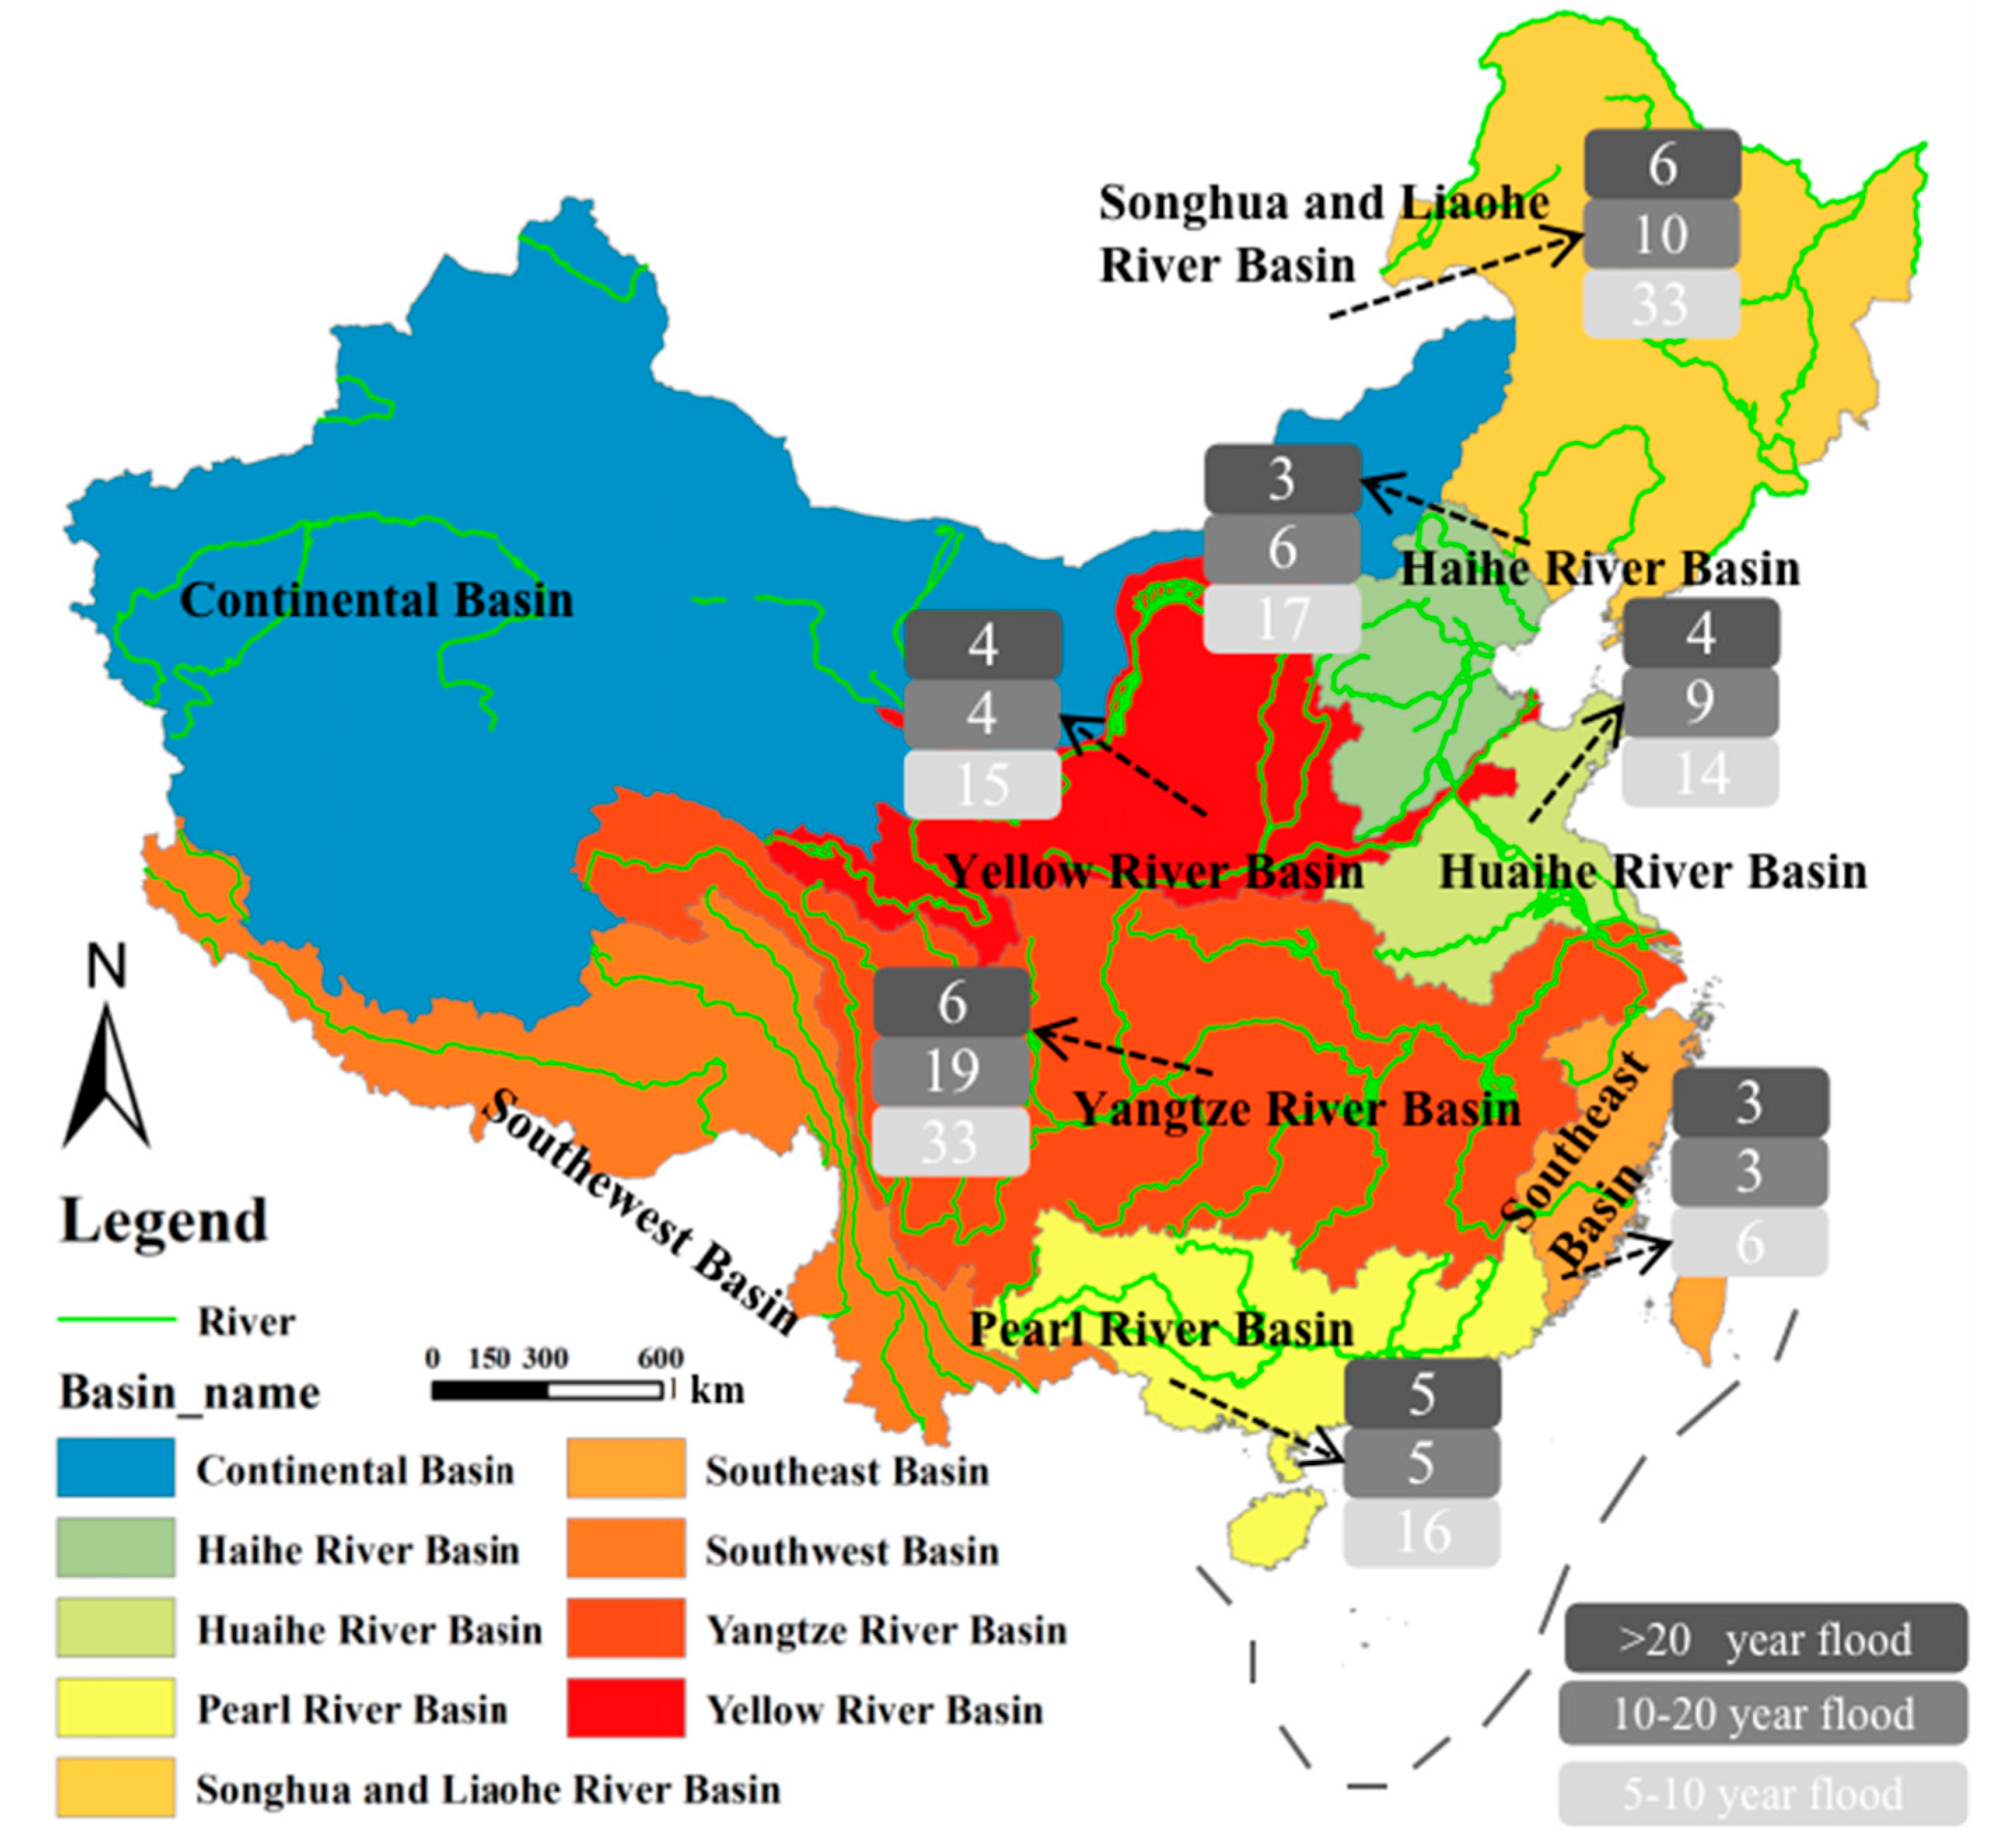
3.3. Spatial and Temporal Distribution of Flood
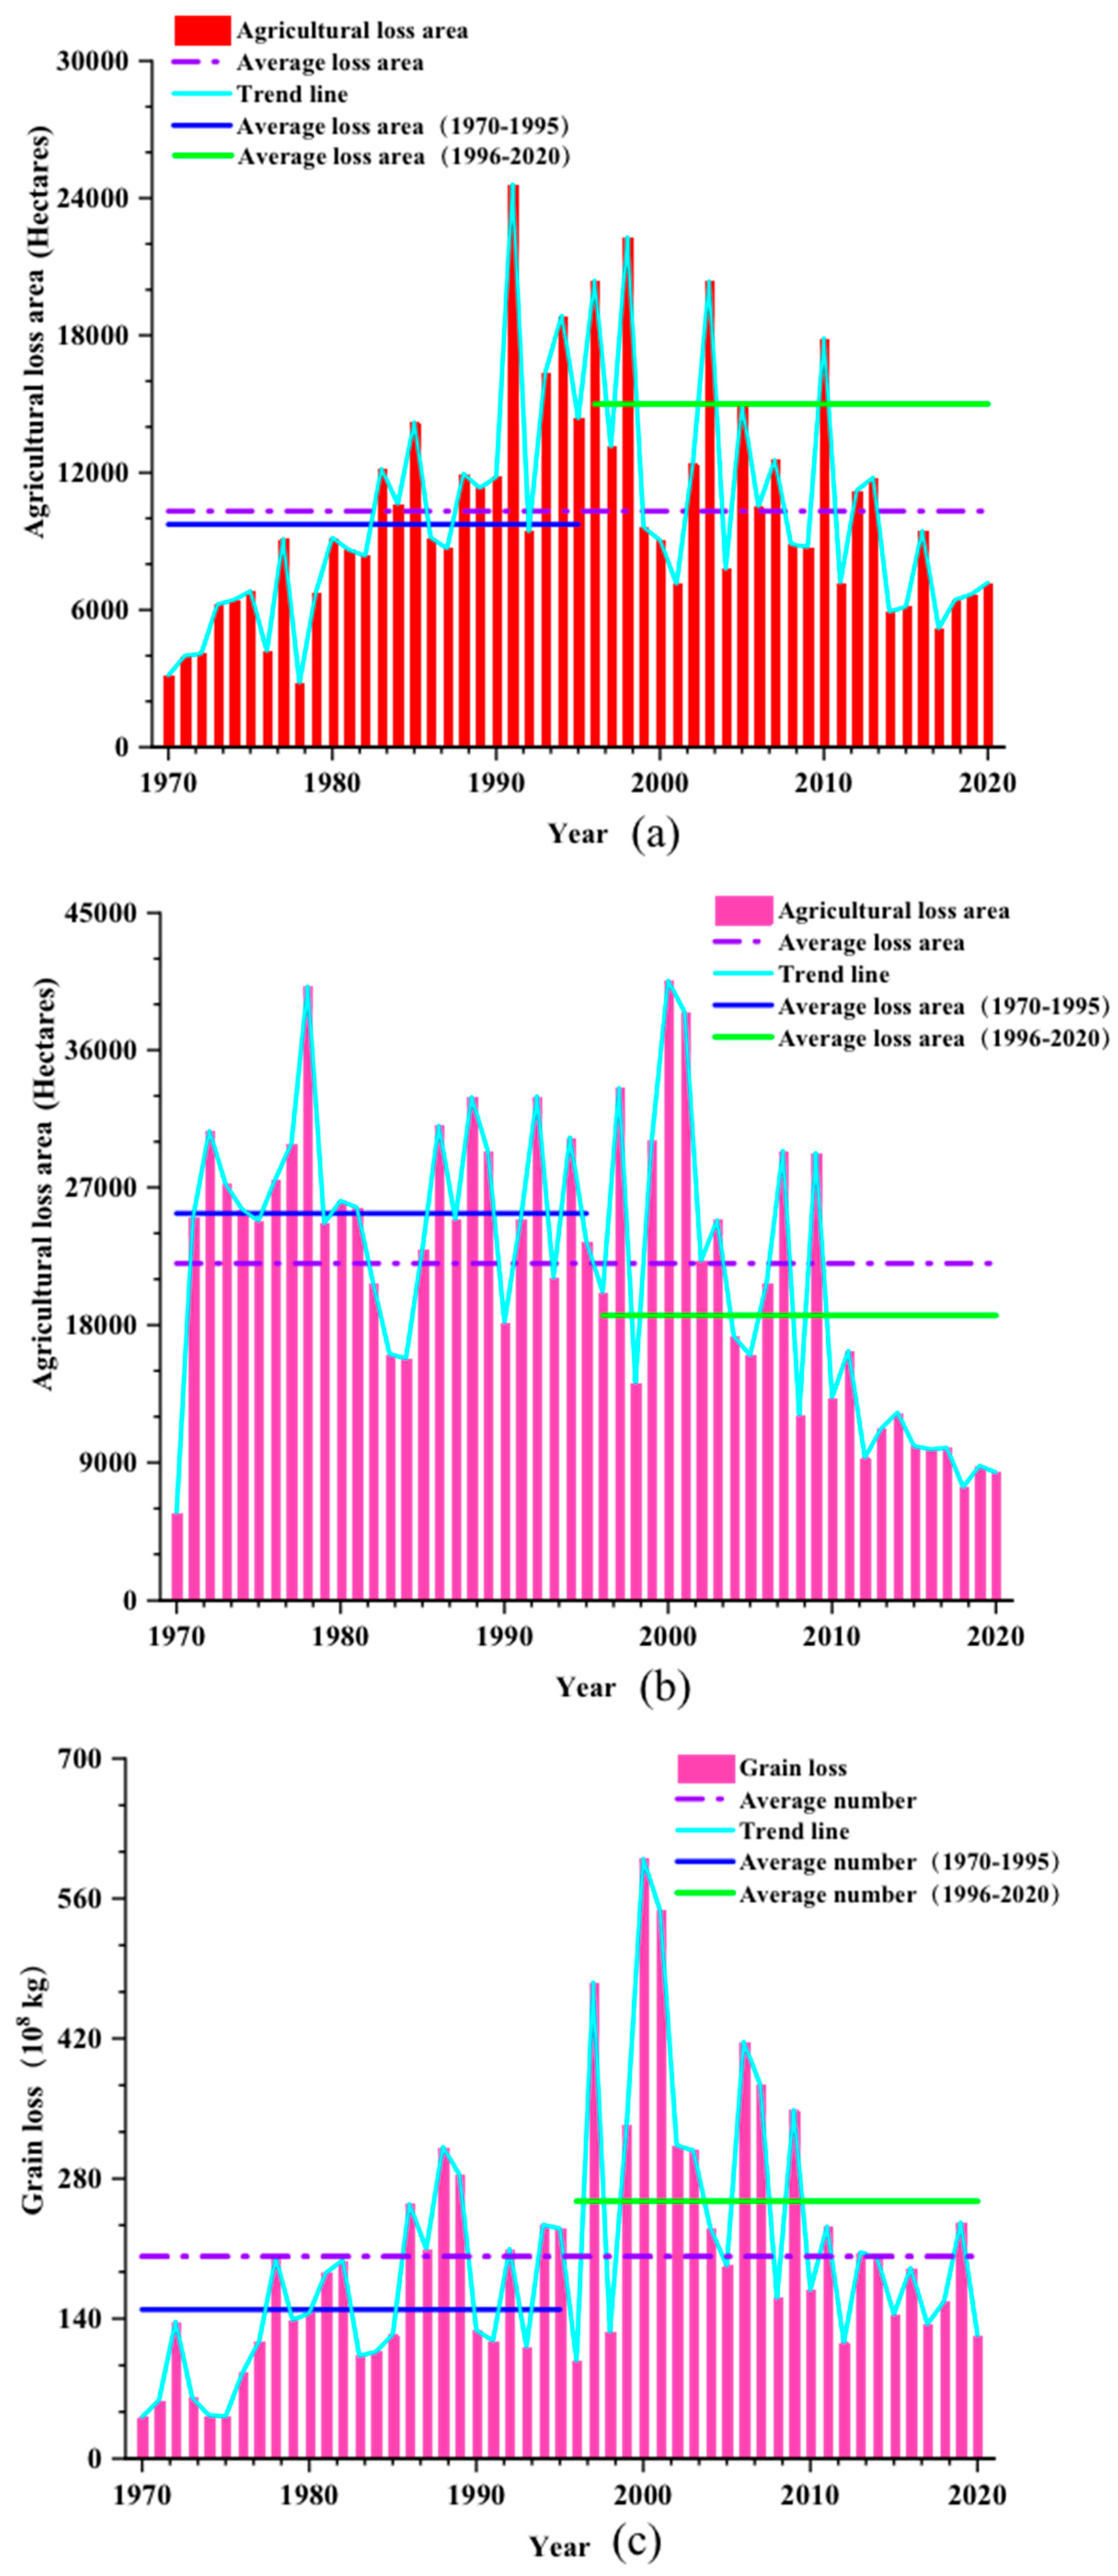
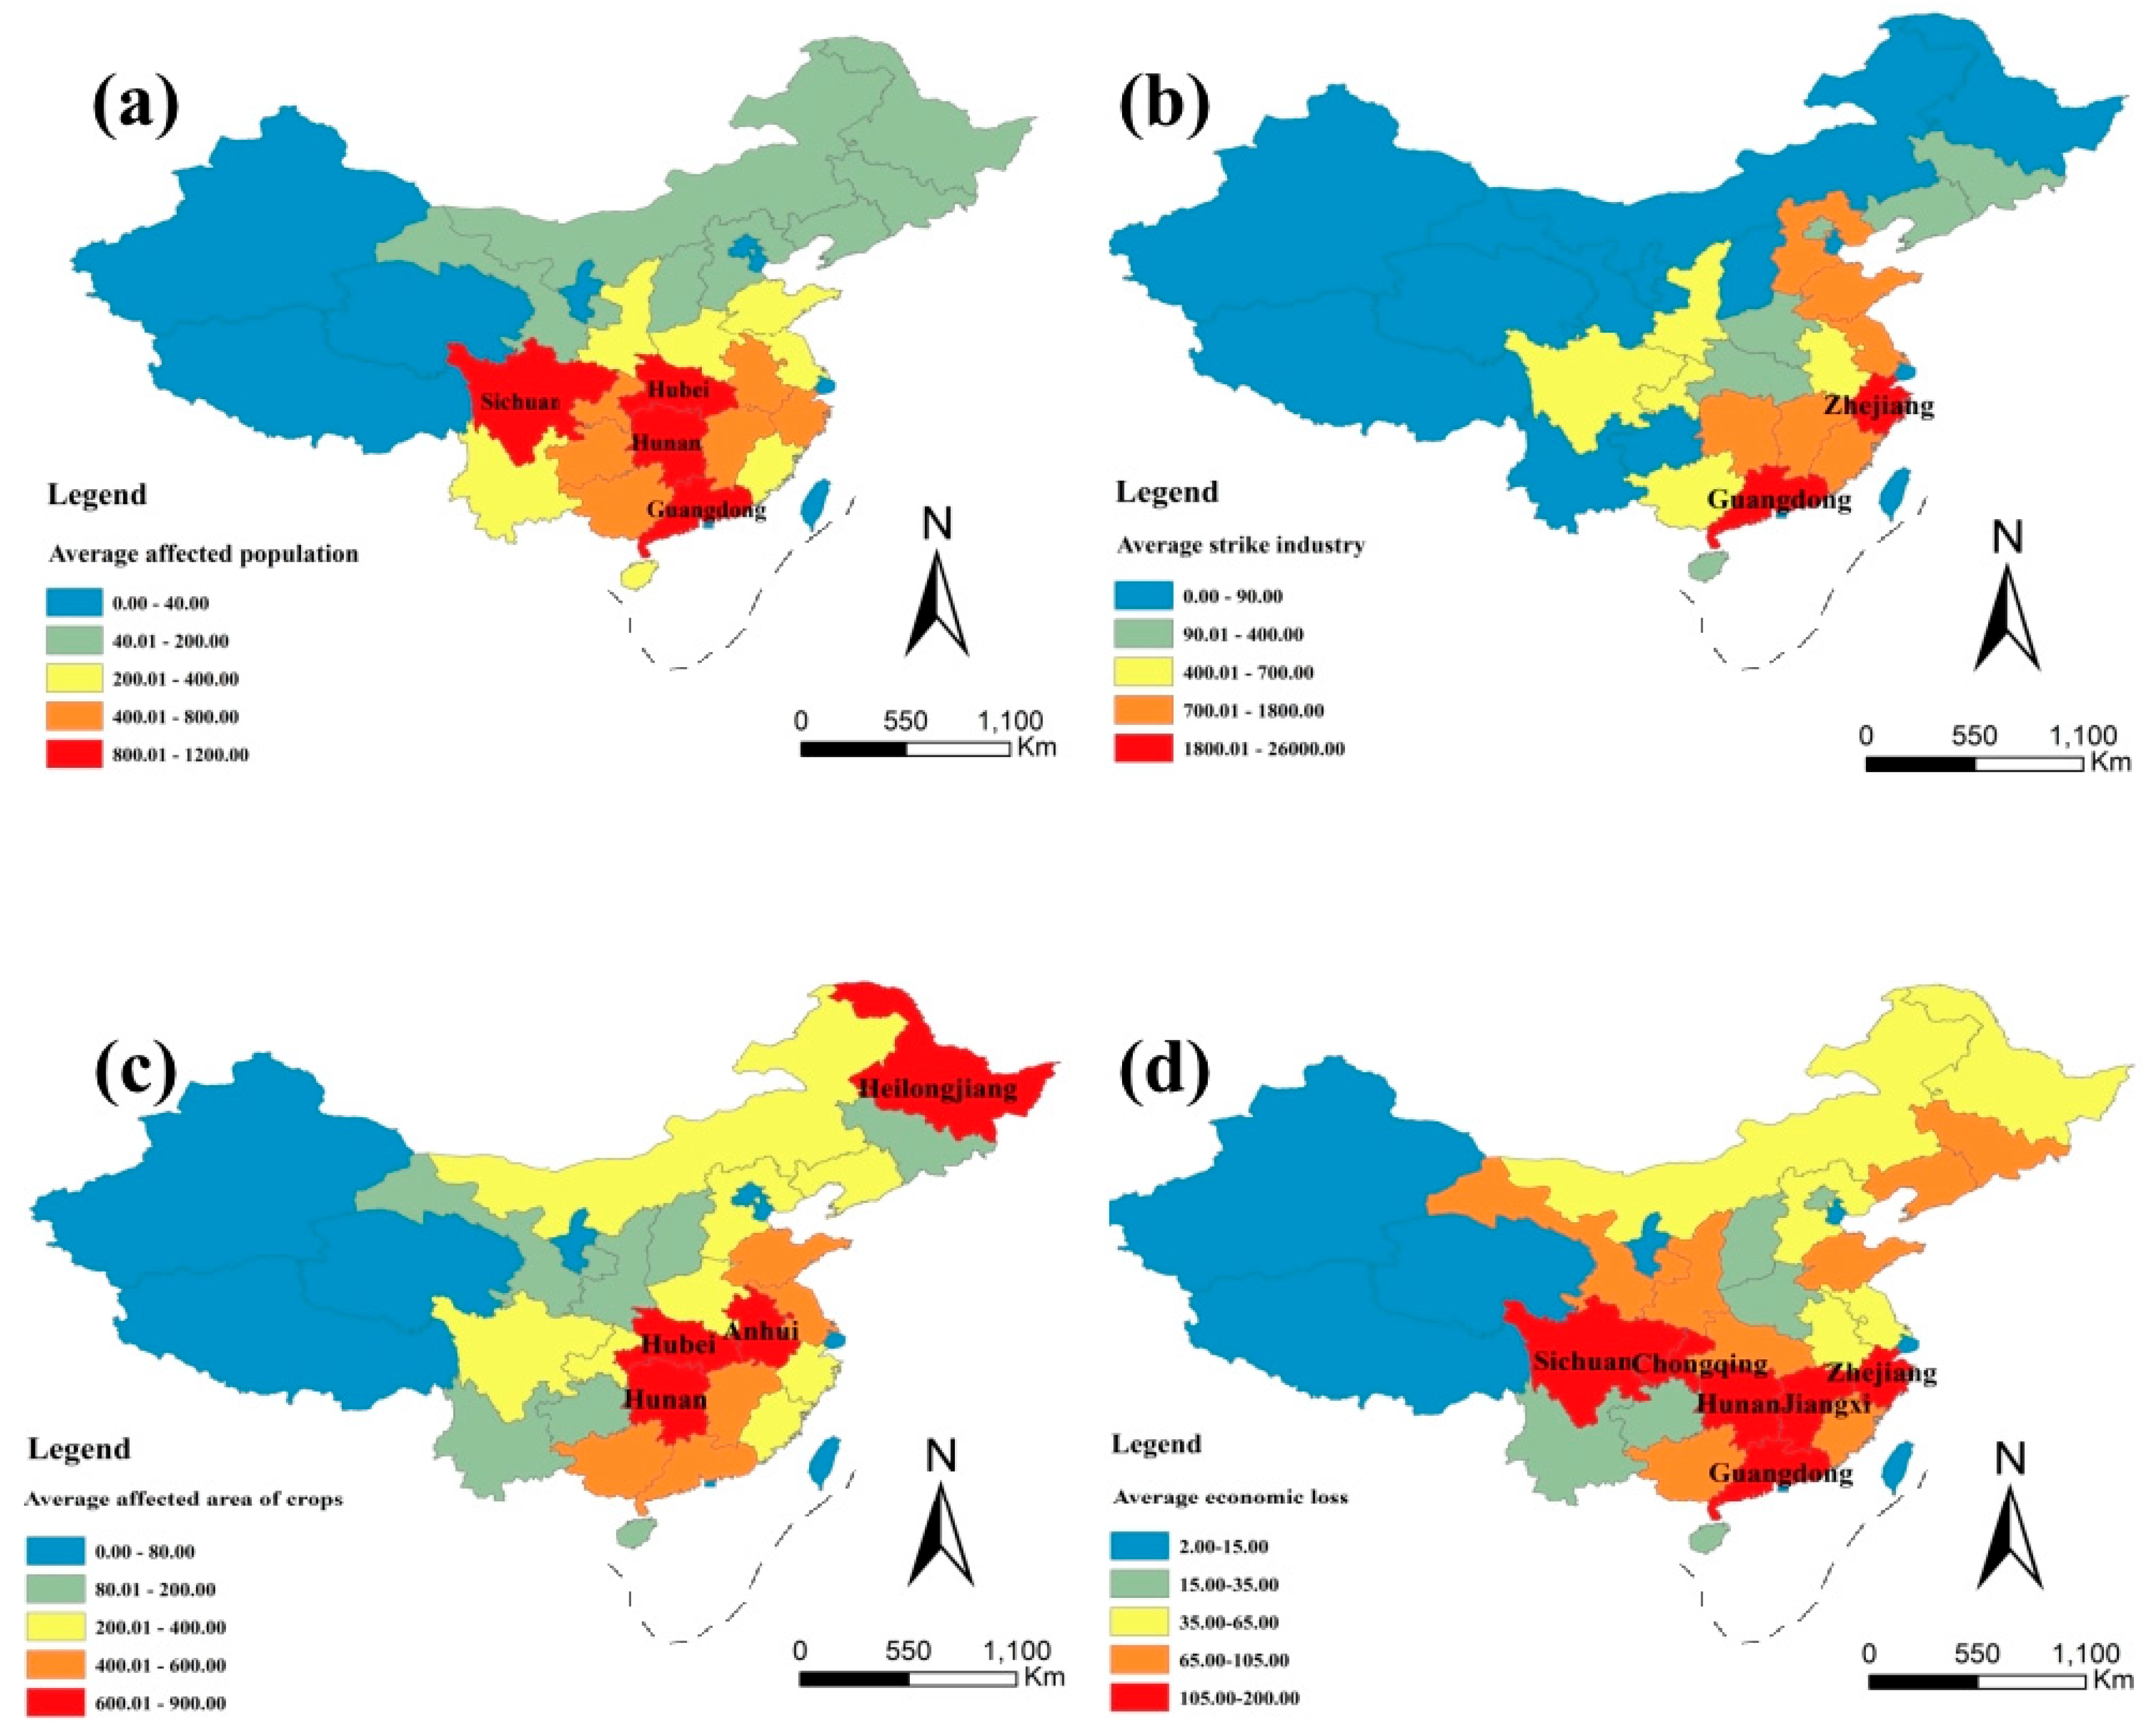
3.4. Impact on Agricultural Production
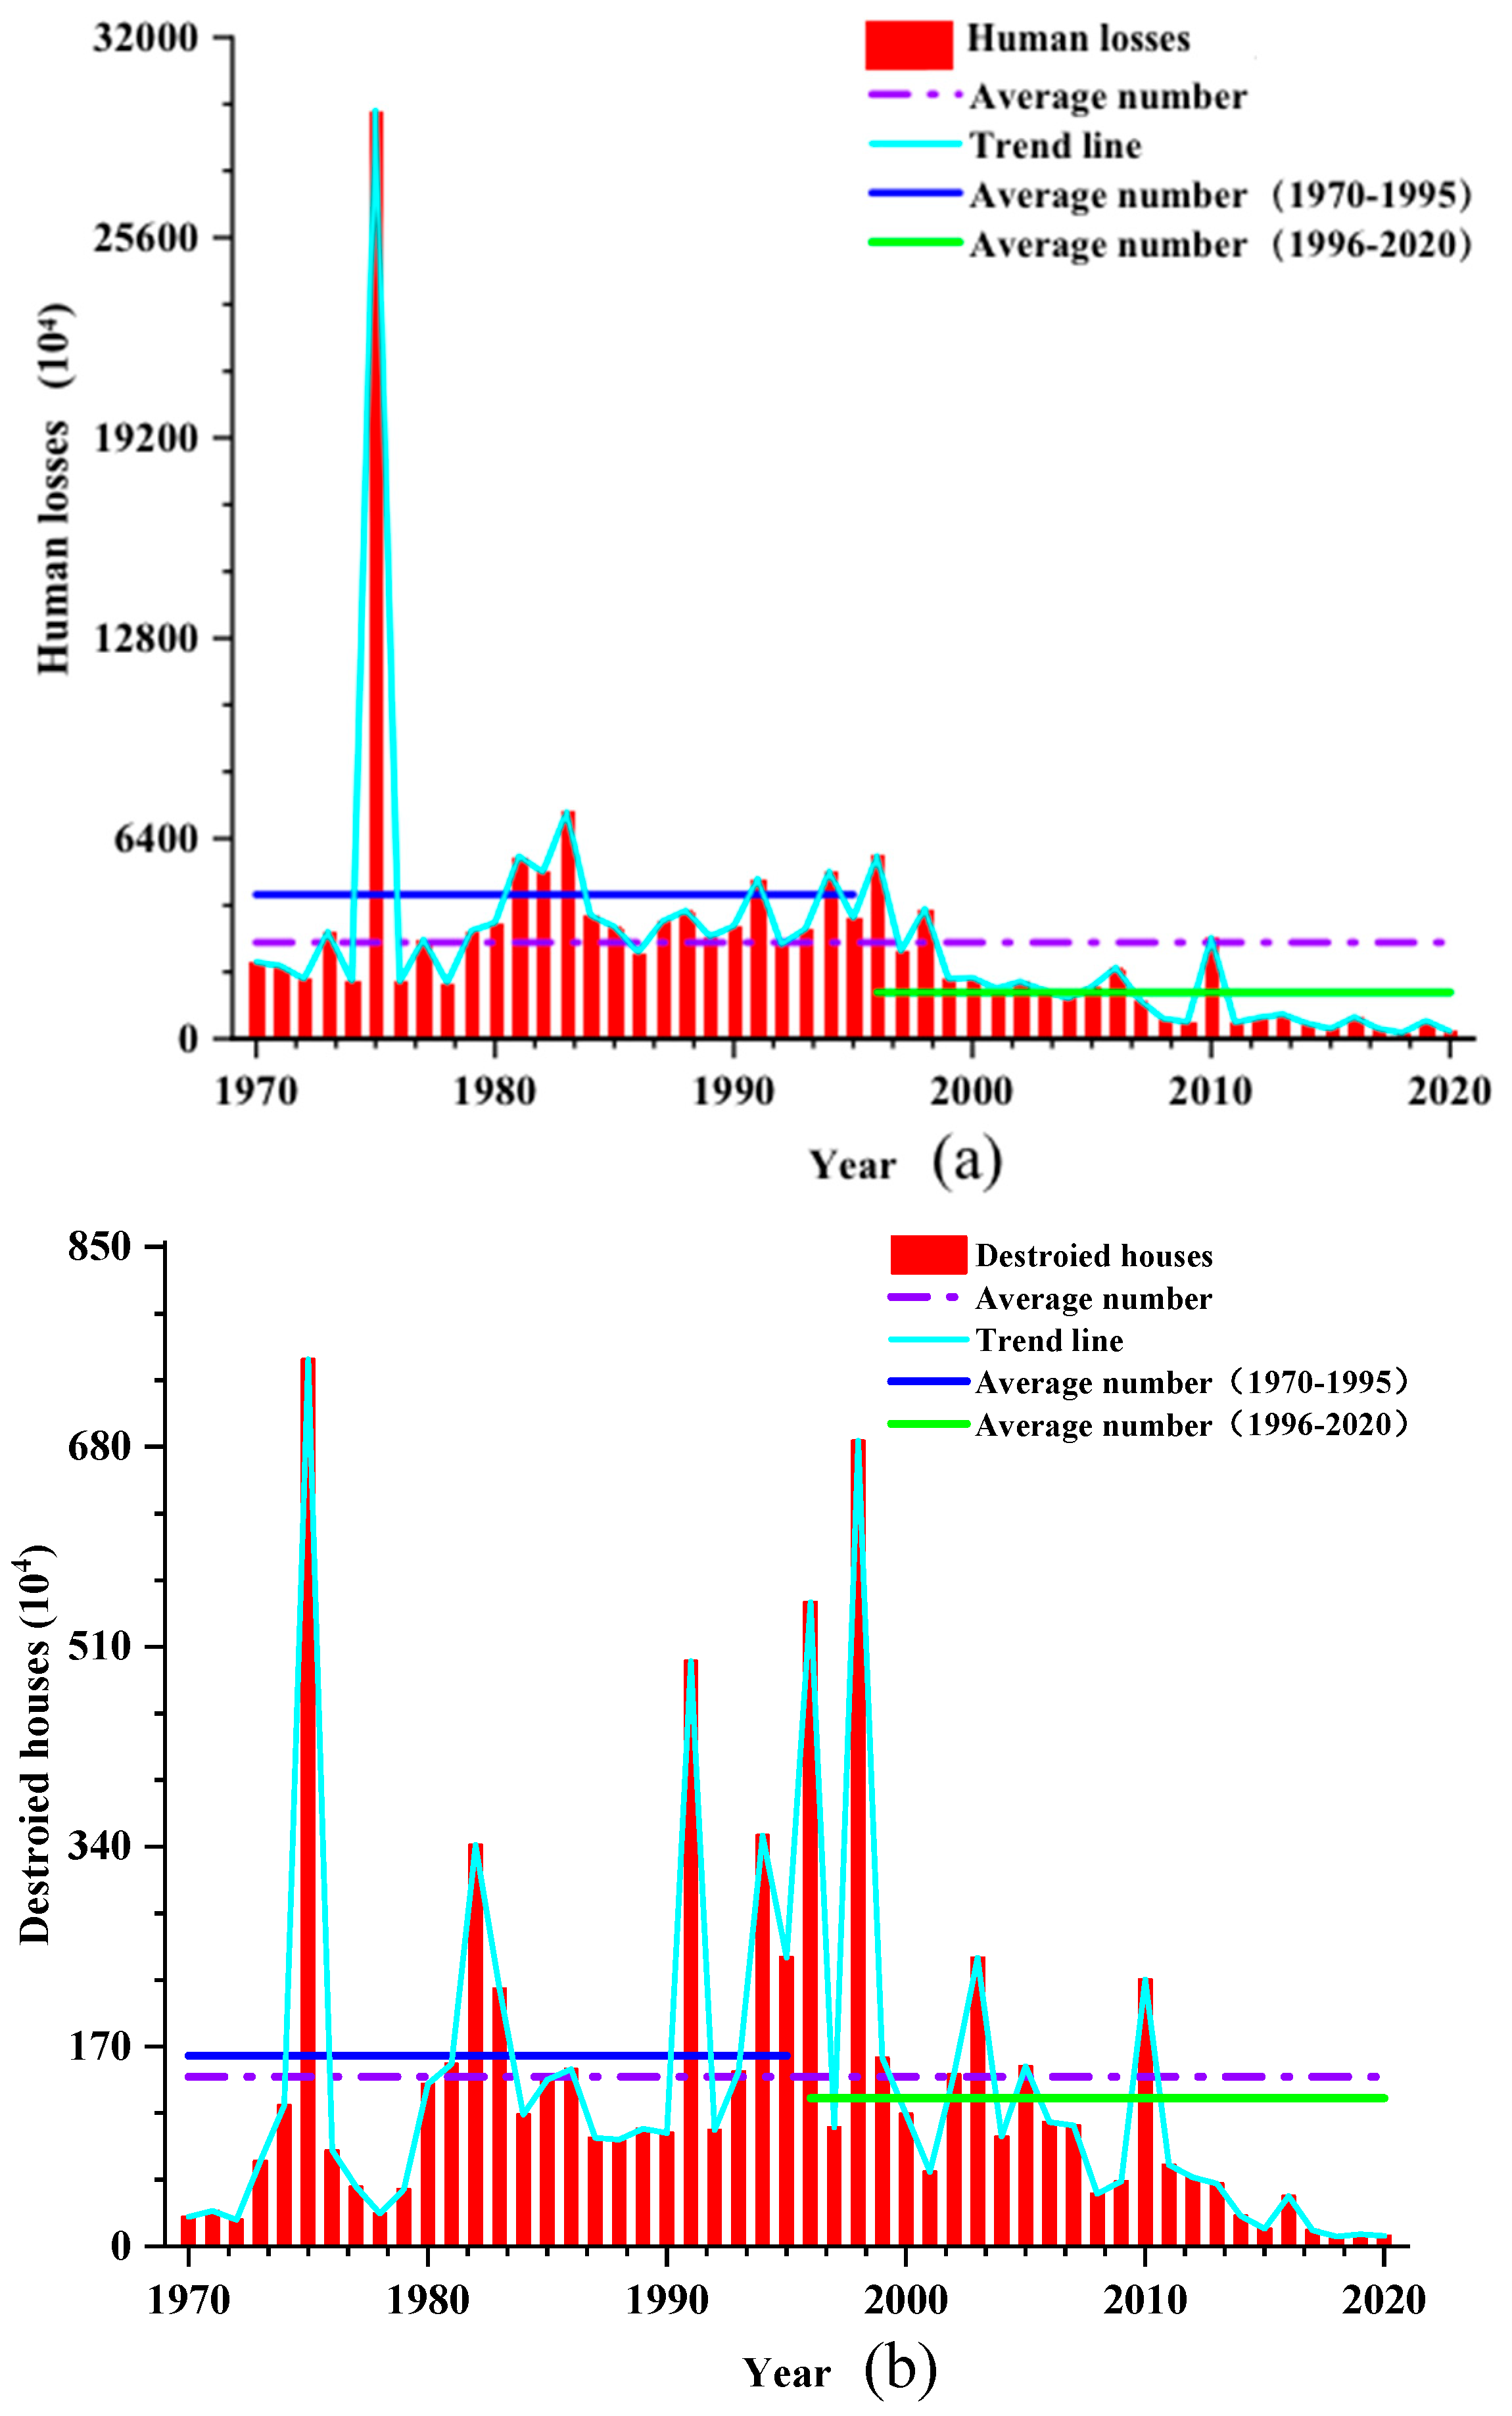
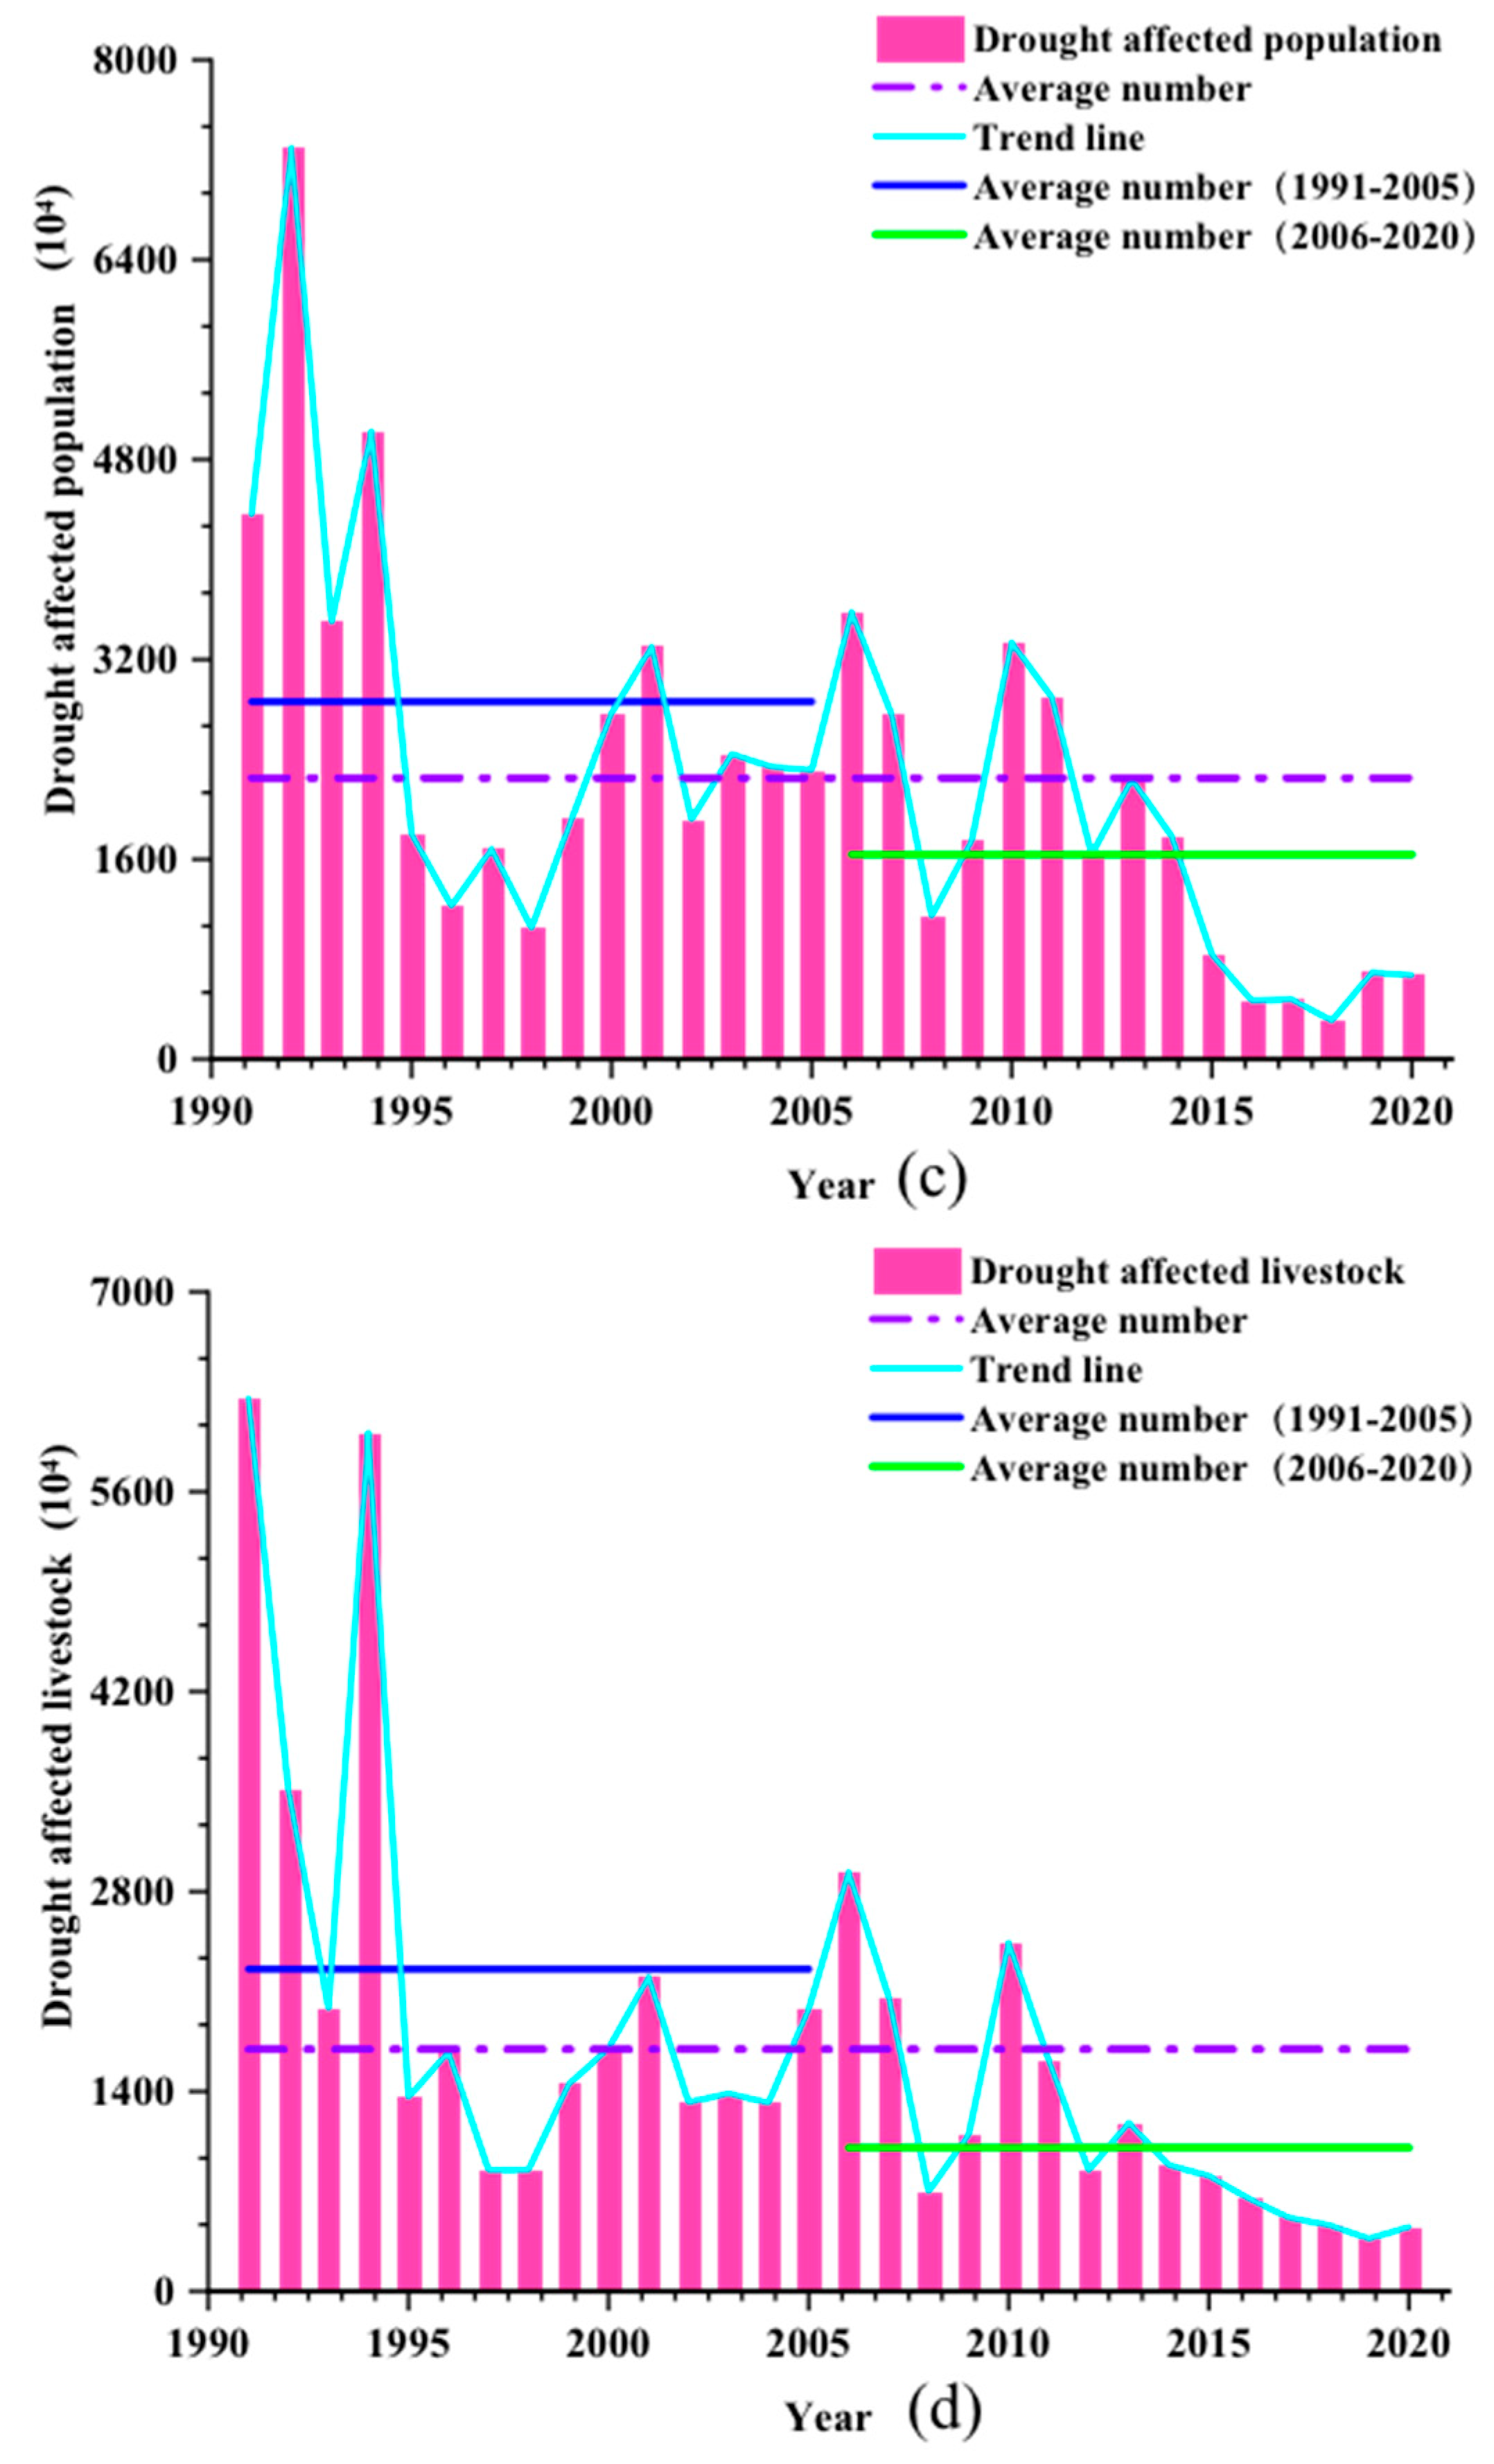
3.5. Population and Housing Losses
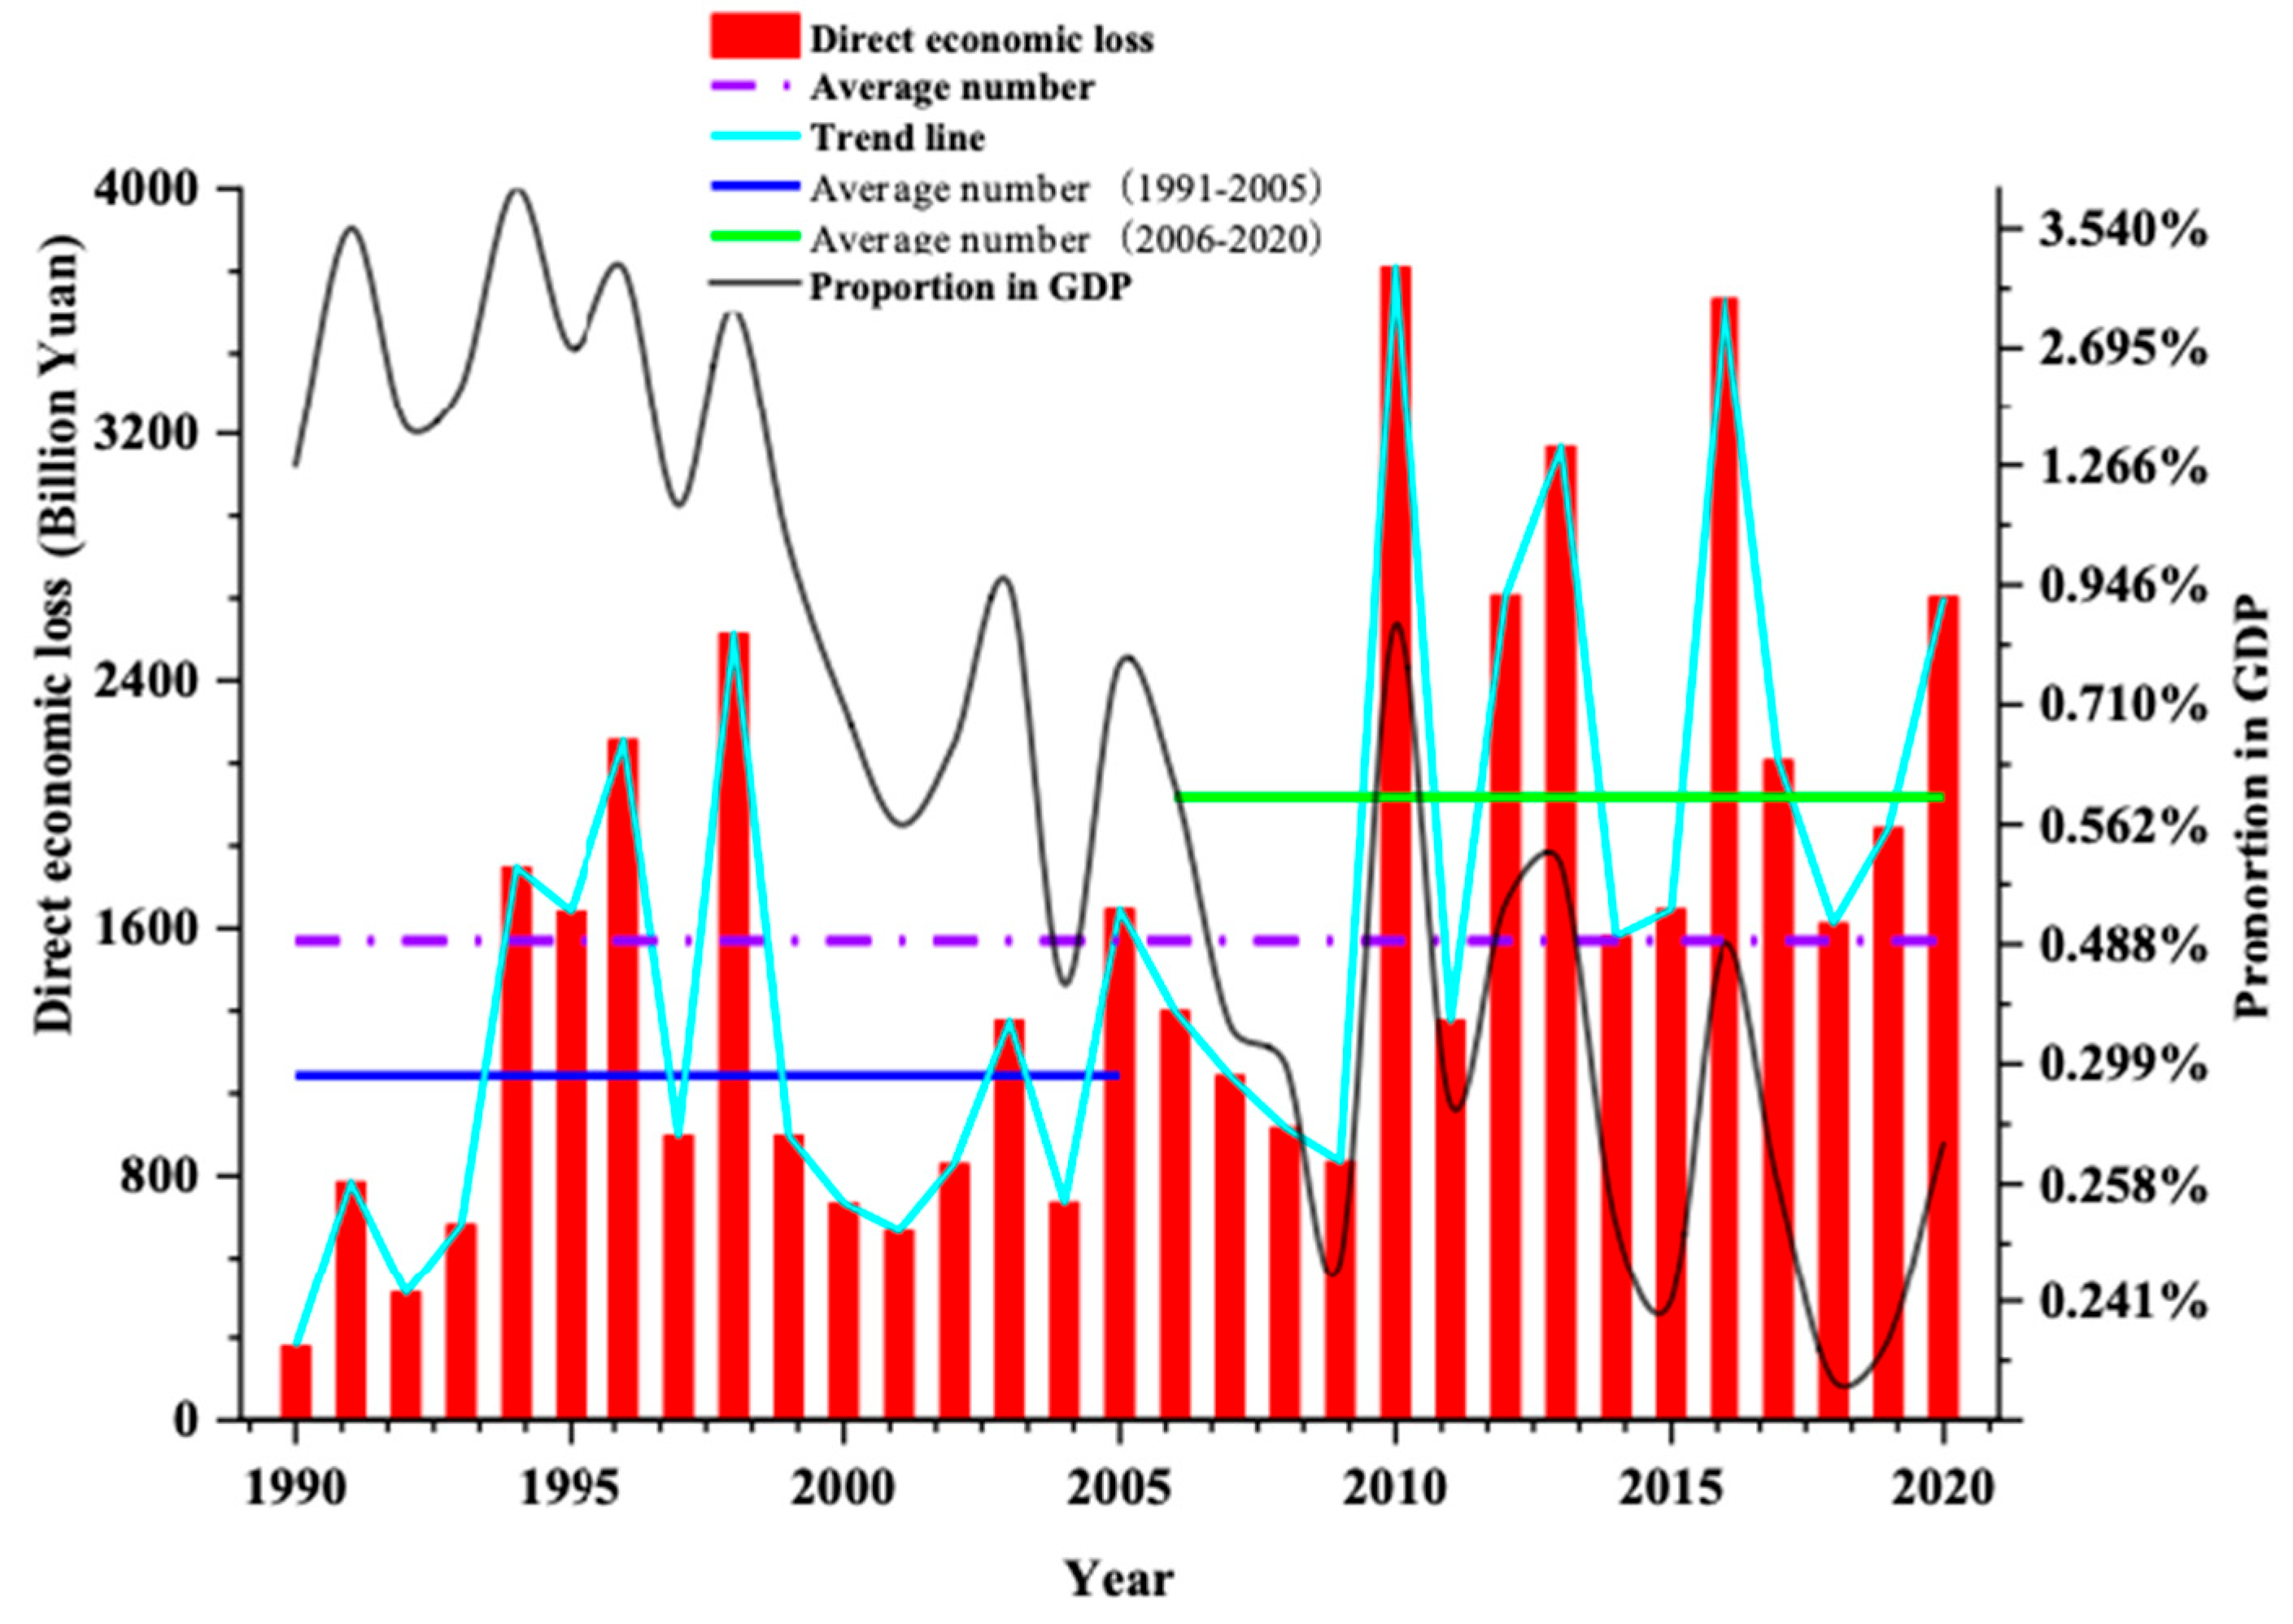
3.6. Obstacles to Social and Economic Development
3.7. Distribution Situations
4. Discussion
4.1. Impact of Indicator Changes on Floods and Droughts
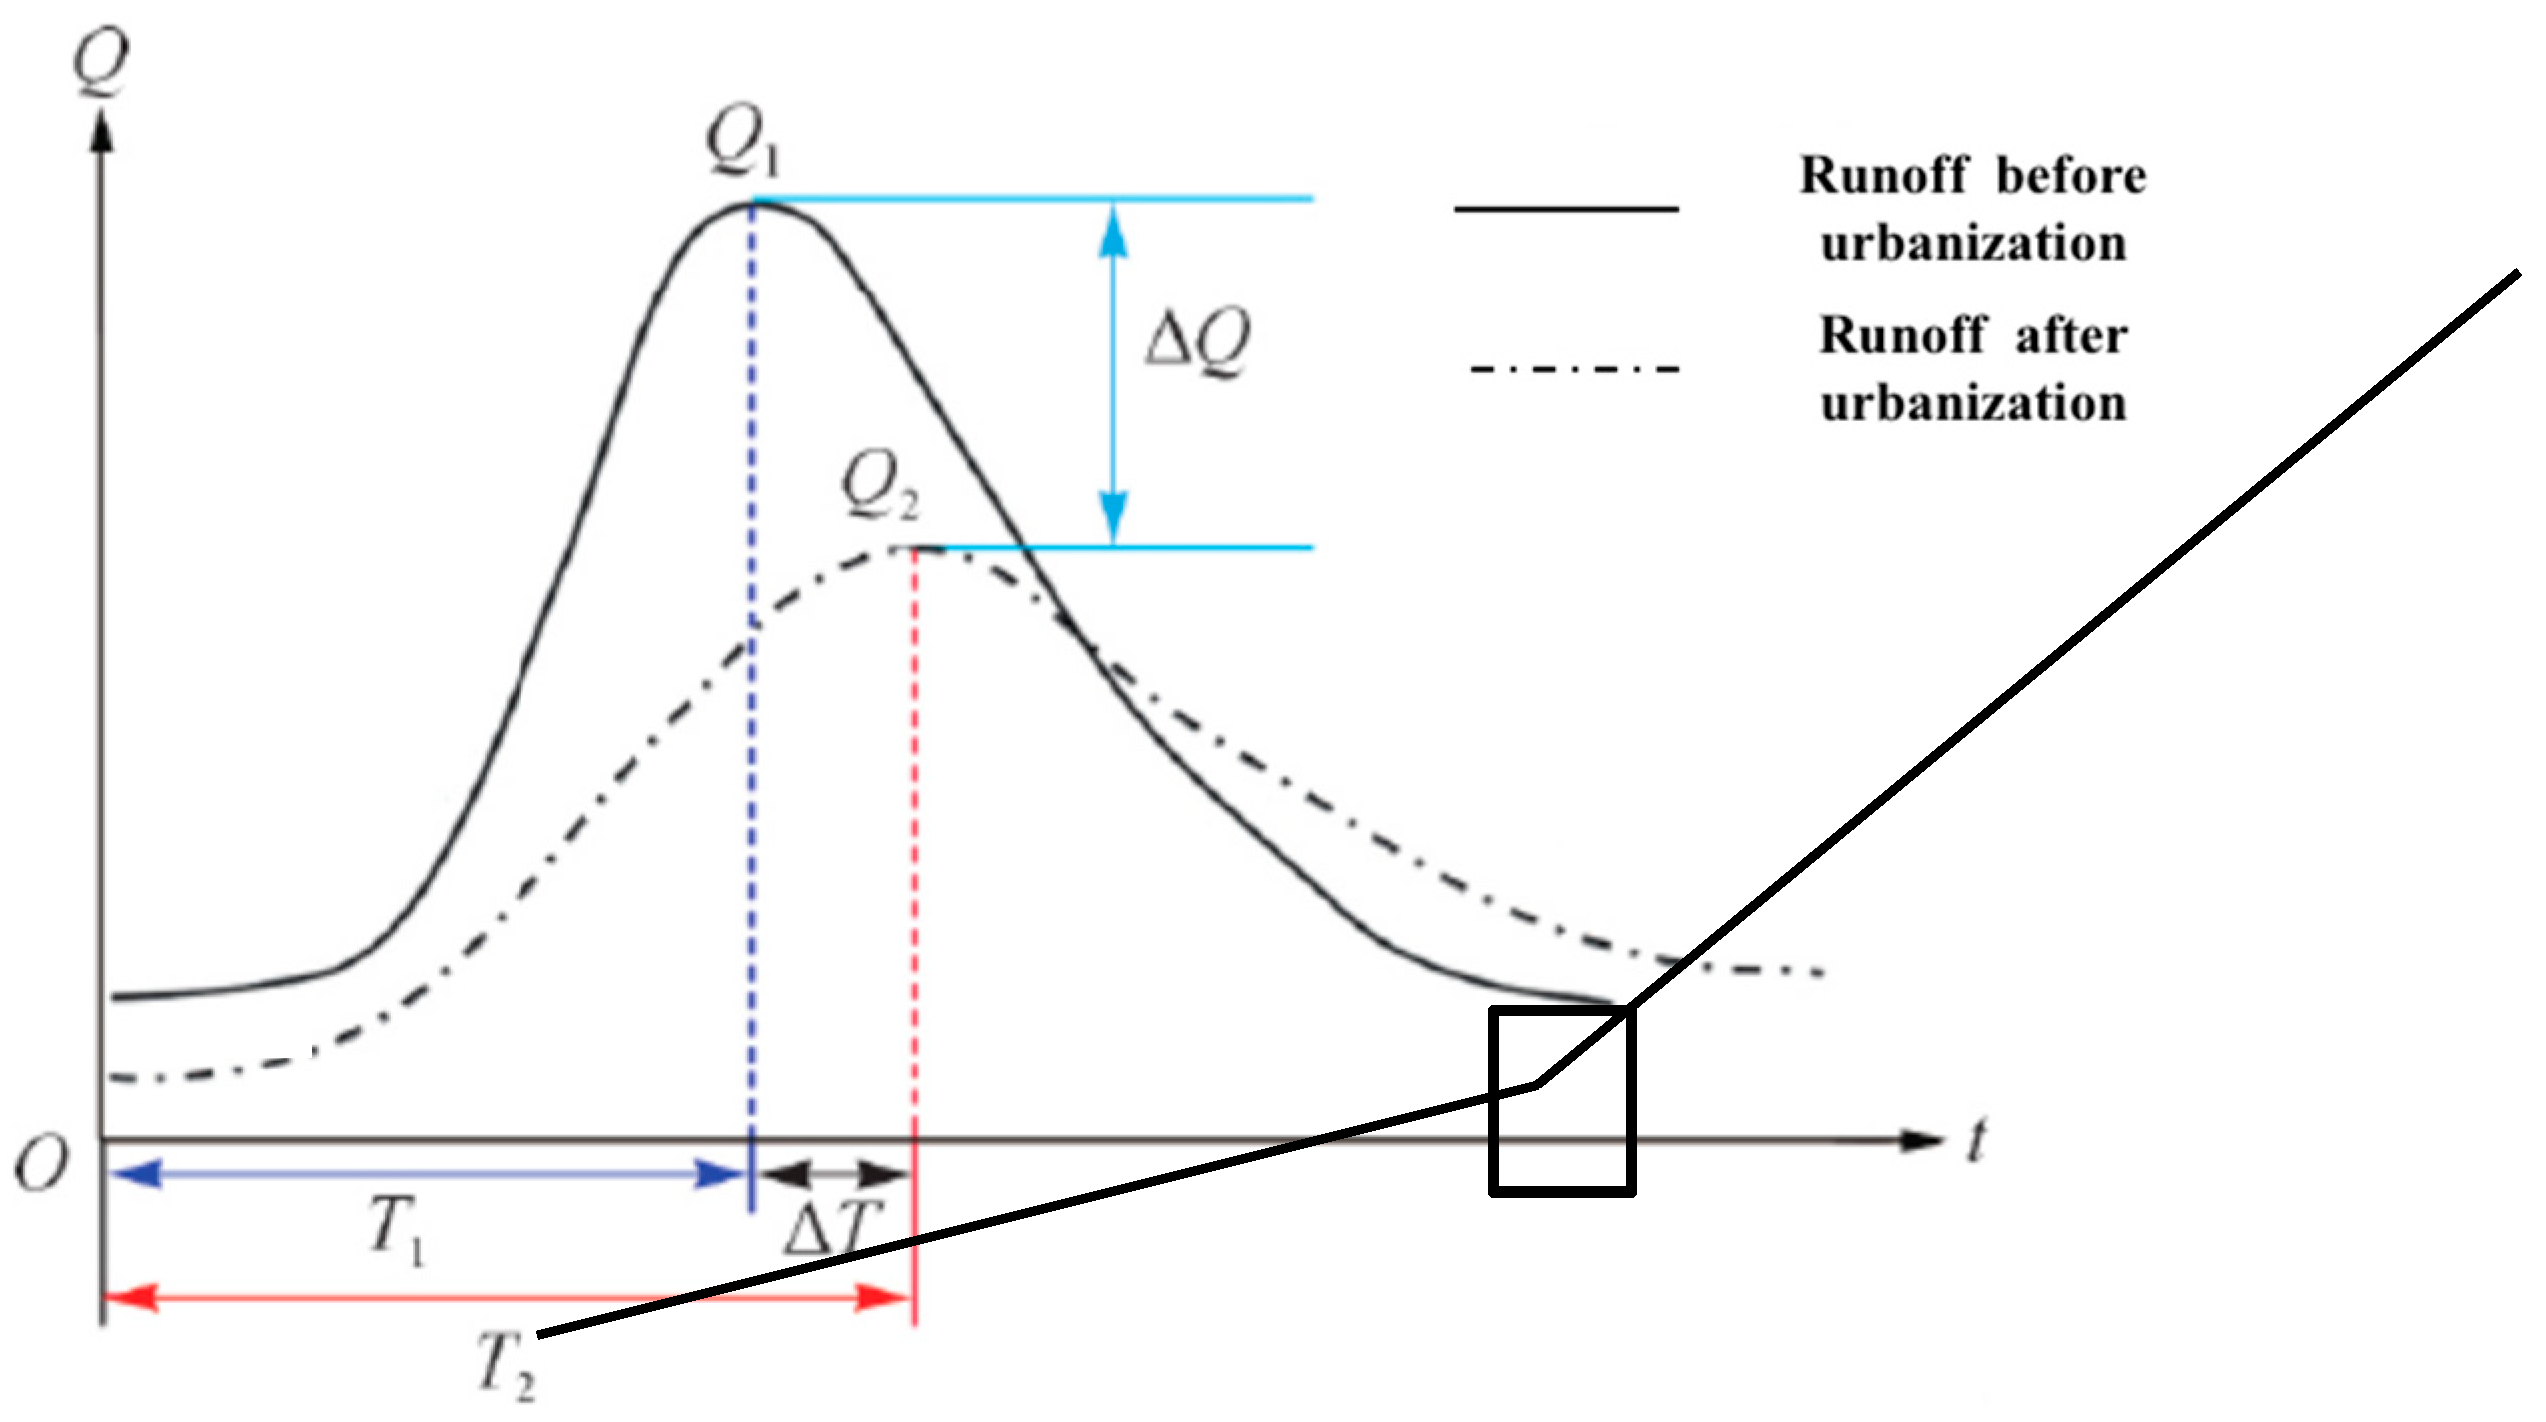
4.2. Cause Analysis of Floods and Droughts
4.3. Suggestions for Mitigating Climate Disaster Losses
4.3.1. Urban Planning and Design
4.3.2. Technology and Innovation
5. Conclusions
Author Contributions
Funding
Institutional Review Board Statement
Informed Consent Statement
Data Availability Statement
Conflicts of Interest
References
- United Nations. Population of Urban Agglomerations with 300,000 Inhabitants or More in 2014, by Country, 1950–2030 (Thousands). 2014. Available online: https://esa.un.org/unpd/wup/CD-ROM/WUP2014_XLS_CD_FILES/WUP2014-F12-Cities_Over_300K.xls (accessed on 10 August 2023).
- Luo, P.P.; Mu, Y.; Wang, S.T.; Zhu, W.; Mishra, B.K.; Huo, A.D.; Zhou, M.M.; Lyu, J.Q.; Hu, M.C.; Duan, W.L.; et al. Exploring sustainable solutions for the water environment in Chinese and Southeast Asian cities. Ambio 2022, 51, 1199–1218. [Google Scholar] [CrossRef] [PubMed]
- Xu, Y.Z.; Zhang, R.J.; Fan, X.M.; Wang, Q.T. How does green technology innovation affect urbanization? An empirical study from provinces of China. Environ. Sci. Pollut. Res. 2022, 29, 36626–36639. [Google Scholar] [CrossRef] [PubMed]
- Gong, Y.; Wei, Y.N.; Gu, J.L. Urbanisation of the Chinese Rural Population: A Literature Review of China’s New-type Urbanisation. China Int. J. 2022, 20, 181–204. [Google Scholar] [CrossRef]
- Chai, K.C.; Ma, X.R.; Yang, Y.; Lu, Y.J.; Chang, K.C. The impact of climate change on population urbanization: Evidence from china. Front. Environ. Sci. 2022, 10, 8481–8491. [Google Scholar] [CrossRef]
- Chou, J.M.; Sun, M.Y.; Dong, W.J.; Zhao, W.X.; Li, J.N.; Li, Y.M.; Zhou, J.Y. Assessment and Prediction of Climate Risks in Three Major Urban Agglomerations of Eastern China. Sustainability 2021, 13, 13037. [Google Scholar] [CrossRef]
- Duan, W.L.; He, B.; Nover, D.; Fan, J.L.; Yang, G.S.; Chen, W.; Meng, H.F.; Liu, C.M. Floods and associated socioeconomic damages in China over the last century. Nat. Hazards 2016, 82, 401–413. [Google Scholar] [CrossRef]
- Li, X.; Hu, Q. Spatiotemporal Changes in Extreme Precipitation and Its Dependence on Topography over the Poyang Lake Basin, China. Adv. Meteorol. 2019, 2019, 1253932. [Google Scholar] [CrossRef]
- China Meterological Administration. Inventory: Extreme Heavy Rainfall and Flood Events in Recent Years. Available online: http://www.qxkp.net/zhfy/byhl/202103/t20210301_2791461.html (accessed on 16 March 2021).
- Lewis, S.L.; Brando, P.M.; Phillips, O.L.; van der Heijden, G.M.; Nepstad, D. The 2010 Amazon drought. Science 2011, 331, 554. [Google Scholar] [CrossRef]
- Coumou, D.; Rahmstorf, S. A decade of weather extremes. Nat. Clim. Chang. 2012, 2, 491–496. [Google Scholar] [CrossRef]
- Zhu, Z.H.; Chen, Z.H.; Chen, X.H.; He, P.Y. Approach for evaluating inundation risks in urban drainage systems. Sci. Total Environ. 2016, 553, 1–12. [Google Scholar] [CrossRef]
- Zhang, Q.; Han, L.; Zhang, L.; Wang, J. Analysis on the Character and Management Strategy of Drought Disaster and Risk under the Climatic Warming. Adv. Earth Sci. 2014, 29, 80–91. [Google Scholar]
- Ritchie, H. Natural Disasters. 2021. Available online: https://ourworldindata.org/natural-disasters#licence (accessed on 10 August 2023).
- Maranzoni, A.; D’Oria, M.; Rizzo, C. Quantitative flood hazard assessment methods: A review. J. Flood Risk Manag. 2023, 16, e12855. [Google Scholar] [CrossRef]
- Yue, S.; Wang, C.Y. The Mann-Kendall Test Modified by Effective Sample Size to Detect Trend in Serially Correlated Hydrological Series. Water Resour. Manag. Int. J. Publ. Eur. Water Resour. Assoc. (EWRA) 2004, 18, 201–218. [Google Scholar] [CrossRef]
- Yue, S.; Wang, C.Y. Applicability of prewhitening to eliminate the influence of serial correlation on the Mann-Kendall test. Water Resour. Res. 2002, 38, 41–47. [Google Scholar] [CrossRef]
- Gu, C.L. Urbanization: Processes and driving forces. Sci. China-Earth Sci. 2019, 62, 1351–1360. [Google Scholar] [CrossRef]
- McGrane, S.J. Impacts of urbanisation on hydrological and water quality dynamics, and urban water management: A review. Hydrol. Sci. J.—J. Sci. Hydrol. 2016, 61, 2295–2311. [Google Scholar] [CrossRef]
- Jiang, S.J.; Li, S.R.; Liu, G.W.; Zhou, L. The impacts of Infrastructure Investment on the Process of Urbanization. In International Symposium on Advancement of Construction Management and Real Estate; Asian Development Bank Institute: Nanjing, China, 2009; pp. 2425–2430. [Google Scholar]
- Guan, X.L.; Wei, H.K.; Lu, S.S.; Dai, Q.; Su, H.J. Assessment on the urbanization strategy in China: Achievements, challenges and reflections. Habitat Int. 2018, 71, 97–109. [Google Scholar] [CrossRef]
- Feng, A.; Chao, Q. An overview of assessment methods and analysis for climate change risk in China. Phys. Chem. Earth 2020, 117, 102861. [Google Scholar] [CrossRef]
- Zhao, R.; Li, X.; Wang, Y.; Xu, Z.C.; Xiong, M.Y.; Jia, Q.; Li, F.T. Assessing resilience of sustainability to climate change in China’s cities. Sci. Total Environ. 2023, 898, 165568. [Google Scholar] [CrossRef]
- Song, Y.; Achberger, C.; Linderholm, H.W. Rain-season trends in precipitation and their effect in different climate regions of China during 1961–2008. Environ. Res. Lett. 2011, 6, 329–346. [Google Scholar] [CrossRef]
- Jiang, T.; Kundzewicz, Z.W.; Su, B. Changes in monthly precipitation and flood hazard in the Yangtze River Basin, China. Int. J. Climatol. 2010, 28, 1471–1481. [Google Scholar] [CrossRef]
- Cao, Z.; Wang, S.; Luo, P.; Xie, D.; Zhu, W. Watershed Ecohydrological Processes in a Changing Environment: Opportunities and Challenges. Water 2022, 14, 1502. [Google Scholar] [CrossRef]
- Sy, B.; Frischknecht, C.; Dao, H.; Consuegra, D.; Giuliani, G. Flood hazard assessment and the role of citizen science. J. Flood Risk Manag. 2019, 12, e12519. [Google Scholar] [CrossRef]
- Asim, K.M.; Martínez-Álvarez, F.; Basit, A.; Iqbal, T. Earthquake magnitude prediction in Hindukush region using machine learning techniques. Nat. Hazards 2017, 85, 471–486. [Google Scholar] [CrossRef]
- Cheng, S.; Jin, Y.; Harrison, S.P.; Quilodrán-Casas, C.; Prentice, I.C.; Guo, Y.-K.; Arcucci, R. Parameter Flexible Wildfire Prediction Using Machine Learning Techniques: Forward and Inverse Modelling. Remote Sens. 2022, 14, 3228. [Google Scholar] [CrossRef]


| Basin | Average Urbanization | Rank | Flood Statistics |
|---|---|---|---|
| Haihe River Basin | 71.70 | 1 | 26 |
| Southeast Basin | 61.60 | 2 | 12 |
| Songhua and Liaohe River Basin | 59.95 | 3 | 49 |
| Yangtze River Basin | 58.25 | 4 | 58 |
| Pearl River Basin | 54.70 | 5 | 26 |
| Huaihe River Basin | 54.52 | 6 | 27 |
| Yellow River Basin | 51.09 | 7 | 23 |
| Continental Basin | 48.20 | 8 | - |
| Southwest Basin | 32.93 | 9 | - |
Disclaimer/Publisher’s Note: The statements, opinions and data contained in all publications are solely those of the individual author(s) and contributor(s) and not of MDPI and/or the editor(s). MDPI and/or the editor(s) disclaim responsibility for any injury to people or property resulting from any ideas, methods, instructions or products referred to in the content. |
© 2023 by the authors. Licensee MDPI, Basel, Switzerland. This article is an open access article distributed under the terms and conditions of the Creative Commons Attribution (CC BY) license (https://creativecommons.org/licenses/by/4.0/).
Share and Cite
Mu, Y.; Li, Y.; Yan, R.; Luo, P.; Liu, Z.; Sun, Y.; Wang, S.; Zhu, W.; Zha, X. Analysis of the Ongoing Effects of Disasters in Urbanization Process and Climate Change: China’s Floods and Droughts. Sustainability 2024, 16, 14. https://doi.org/10.3390/su16010014
Mu Y, Li Y, Yan R, Luo P, Liu Z, Sun Y, Wang S, Zhu W, Zha X. Analysis of the Ongoing Effects of Disasters in Urbanization Process and Climate Change: China’s Floods and Droughts. Sustainability. 2024; 16(1):14. https://doi.org/10.3390/su16010014
Chicago/Turabian StyleMu, Yong, Ying Li, Ran Yan, Pingping Luo, Zhe Liu, Yingying Sun, Shuangtao Wang, Wei Zhu, and Xianbao Zha. 2024. "Analysis of the Ongoing Effects of Disasters in Urbanization Process and Climate Change: China’s Floods and Droughts" Sustainability 16, no. 1: 14. https://doi.org/10.3390/su16010014
APA StyleMu, Y., Li, Y., Yan, R., Luo, P., Liu, Z., Sun, Y., Wang, S., Zhu, W., & Zha, X. (2024). Analysis of the Ongoing Effects of Disasters in Urbanization Process and Climate Change: China’s Floods and Droughts. Sustainability, 16(1), 14. https://doi.org/10.3390/su16010014