1. Introduction
Accurate prediction of rock drilling performance is of key importance for manufacturers and contractors to advance in more efficient and sustainable underground construction and mining industries. Conventional drilling techniques rely on mechanical abrasion, which leads to high economic and environmental costs [
1,
2]. Thus, the efficiency of a rock-cutting tool and its durability are important factors to consider [
3]. Modern research shows that the mechanical and physical properties of rocks strongly condition drilling performance, such is the case for surface hardness, point hardness, porosity, uniaxial compressive strength and tensile strength [
4,
5].
Variation in the above properties as a function of temperature is a field of research for innovative thermal-assisted drilling techniques, which aims to increase efficiency and reduce economic and environmental costs in the mining and civil engineering industries. Representative examples are those based on applying direct flame on rocks [
6], which causes extensive cracks that significantly improve drilling performance. Also, a high-power laser decreases rock strength, increases drillability and decreases fracture toughness [
7]. Thus, temperature can seriously affect the physico-mechanical properties of rock samples, causing severe thermal damage in terms of increased porosity and microcracking. The extent of thermal damage and the critical temperatures are highly dependent on the physical and mineralogical properties of the rock under consideration [
8], so this research will focus on limestone rock, as this is one of the most abundant types in the Earth’s crust. In limestones from Anstrude, France, a reduction in strength due to microcracking was observed at temperatures up to 250 °C [
9]. In addition, limestones typically decrease in bulk density, ultrasonic wave velocities and effective porosity at 400 °C [
10]. A clear decrease in uniaxial compressive strength (UCS) was observed in calcareous and dolomitic rocks from Apulia, Italy, at 500 °C and above [
11]. Temperatures above 600 °C usually result in a substantial decrease in UCS [
12]. From 500 to 600 °C, the peak strength decreases slowly, while peak strain increases, the elastic modulus decreases rapidly, and Poisson’s ratio drops [
13]. Carbonate rocks showed a more significant variation in physical and mechanical characteristics when cooled by water immersion, clearly evidencing the influence of the cooling rate [
14].
One of the most widely used test methods to determine the drillability characteristics of rocks is the Drilling Rate Index (DRI) [
15]. This index is commonly used in decision making to choose Tunnel Boring Machine (TBM) cutter heads. The SJ value from the Sievers’ J-miniature drill test [
16] is combined with the S
20 value from the brittleness test [
17] to determine the DRI. SJ and S
20 represent different effects in a rotary-percussive drilling process, as S20 expresses the impact action of the drill bit, while thrust and rotation are represented by the SJ value [
18]. Turning to the effects of thermal treatments on the drilling performance of rocks, a significant 40% improvement in DRI at 600 °C was observed in Prada limestone [
19], and representative correlations were found between drillability and the mechanical and elastic properties of the rock. A pioneering work registered penetration–time curves from Sievers’ J-miniature drill tests to indicate the drilling rate on rock samples [
20]. This made it possible to propose a new Sievers’ J Interception Point (SJIP) index for assessing the ‘‘effective lifetime’’ of cutters. To do this, the authors tested quartzites to identify a “breaking point” after only a few seconds of drilling, at which point, the cutting edge of the drill bit was worn down and unable to produce any further indentation. This way of studying cutting tool wear from depth–time curves has been addressed in very few investigations, such as in the drilling performance in metal mine excavation in Turkey [
21] or to assess the efficiency of TBM cutter heads in soft ground in central Dublin [
22]. Despite its potential as an alternative method to study rock drillability, the use of the depth–time curve and its derivative, the penetration rate–time curve, have not been sufficiently investigated subsequently. Furthermore, the authors have not found any bibliographic reference in which penetration–time curves are studied after the heat treatment of the samples. However, it can provide valuable information on the effects of such treatments on more effective drilling of rocks after induced thermal damage.
In this research, samples of Prada limestone formation are subjected to heat treatment at temperatures of 105, 300 and 600 °C to induce porosity and micro-cracking. The authors study for the first time how thermal damage caused in the Prada limestone affects penetration–time curves from Sievers’ J-miniature drill tests. Finally, a new drillability value (SJ*) is proposed that corrects the Sievers’ J-value (SJ), better representing the real drillability in limestones. This will allow for better economic and environmental planning of drilling operations in the underground construction and mining industries.
2. Materials and Methods
This research focuses on Prada limestone, a Lower Cretaceous formation located in the Serra de Prada, a mountain range in the south Pyrenean area of Catalonia (Lleida, Spain). The rock samples used in this research come from horizontal boreholes drilled on both sides of the Tres Ponts Tunnel located in the municipalities of Organyà and Fígols. The tunnel, excavated entirely in Prada limestone, was inaugurated in 2021, and the authors participated in its design. In this study, two cores (1 and 2) were selected, and each core was cut into five samples. Later, the resulting ten samples were heated to 105 °C to remove moisture and were considered references for determining intact rock properties.
To induce porosity and micro-cracking in Prada limestone, the samples were subjected to heat treatment at high temperatures and cooled to produce a thermal shock [
23]. Subsequently, pairs of samples were heated slowly (5 °C/min) to 300 and 600 °C in an electric furnace. The target temperature was maintained for one hour. Thermal treatment was limited to 600 °C as samples lost their integrity at higher temperatures due to mass cracking, preventing testing. To induce different degrees of thermal damage in the rock, the heated samples were then cooled by one of two methods: (i) at a slow rate to room temperature of 21 °C or (ii) by thermal shock by immersion in water. Temperatures inside the furnace were monitored with a PicoLog 6 data logger (Pico Technology, Saint Neots, UK).
Figure 1 represents the laboratory tests and the number of repetitions on each sample.
In this research, the microtexture of Prada limestone samples was observed by optical and scanning electron microscopy (SEM) using a Hitachi S-3000 N microscope in backscattered electron mode (Hitachi High-Tech Corporation, Tokyo, Japan). For this purpose, the samples were first prepared by polishing their surfaces with alumina and diamond powder.
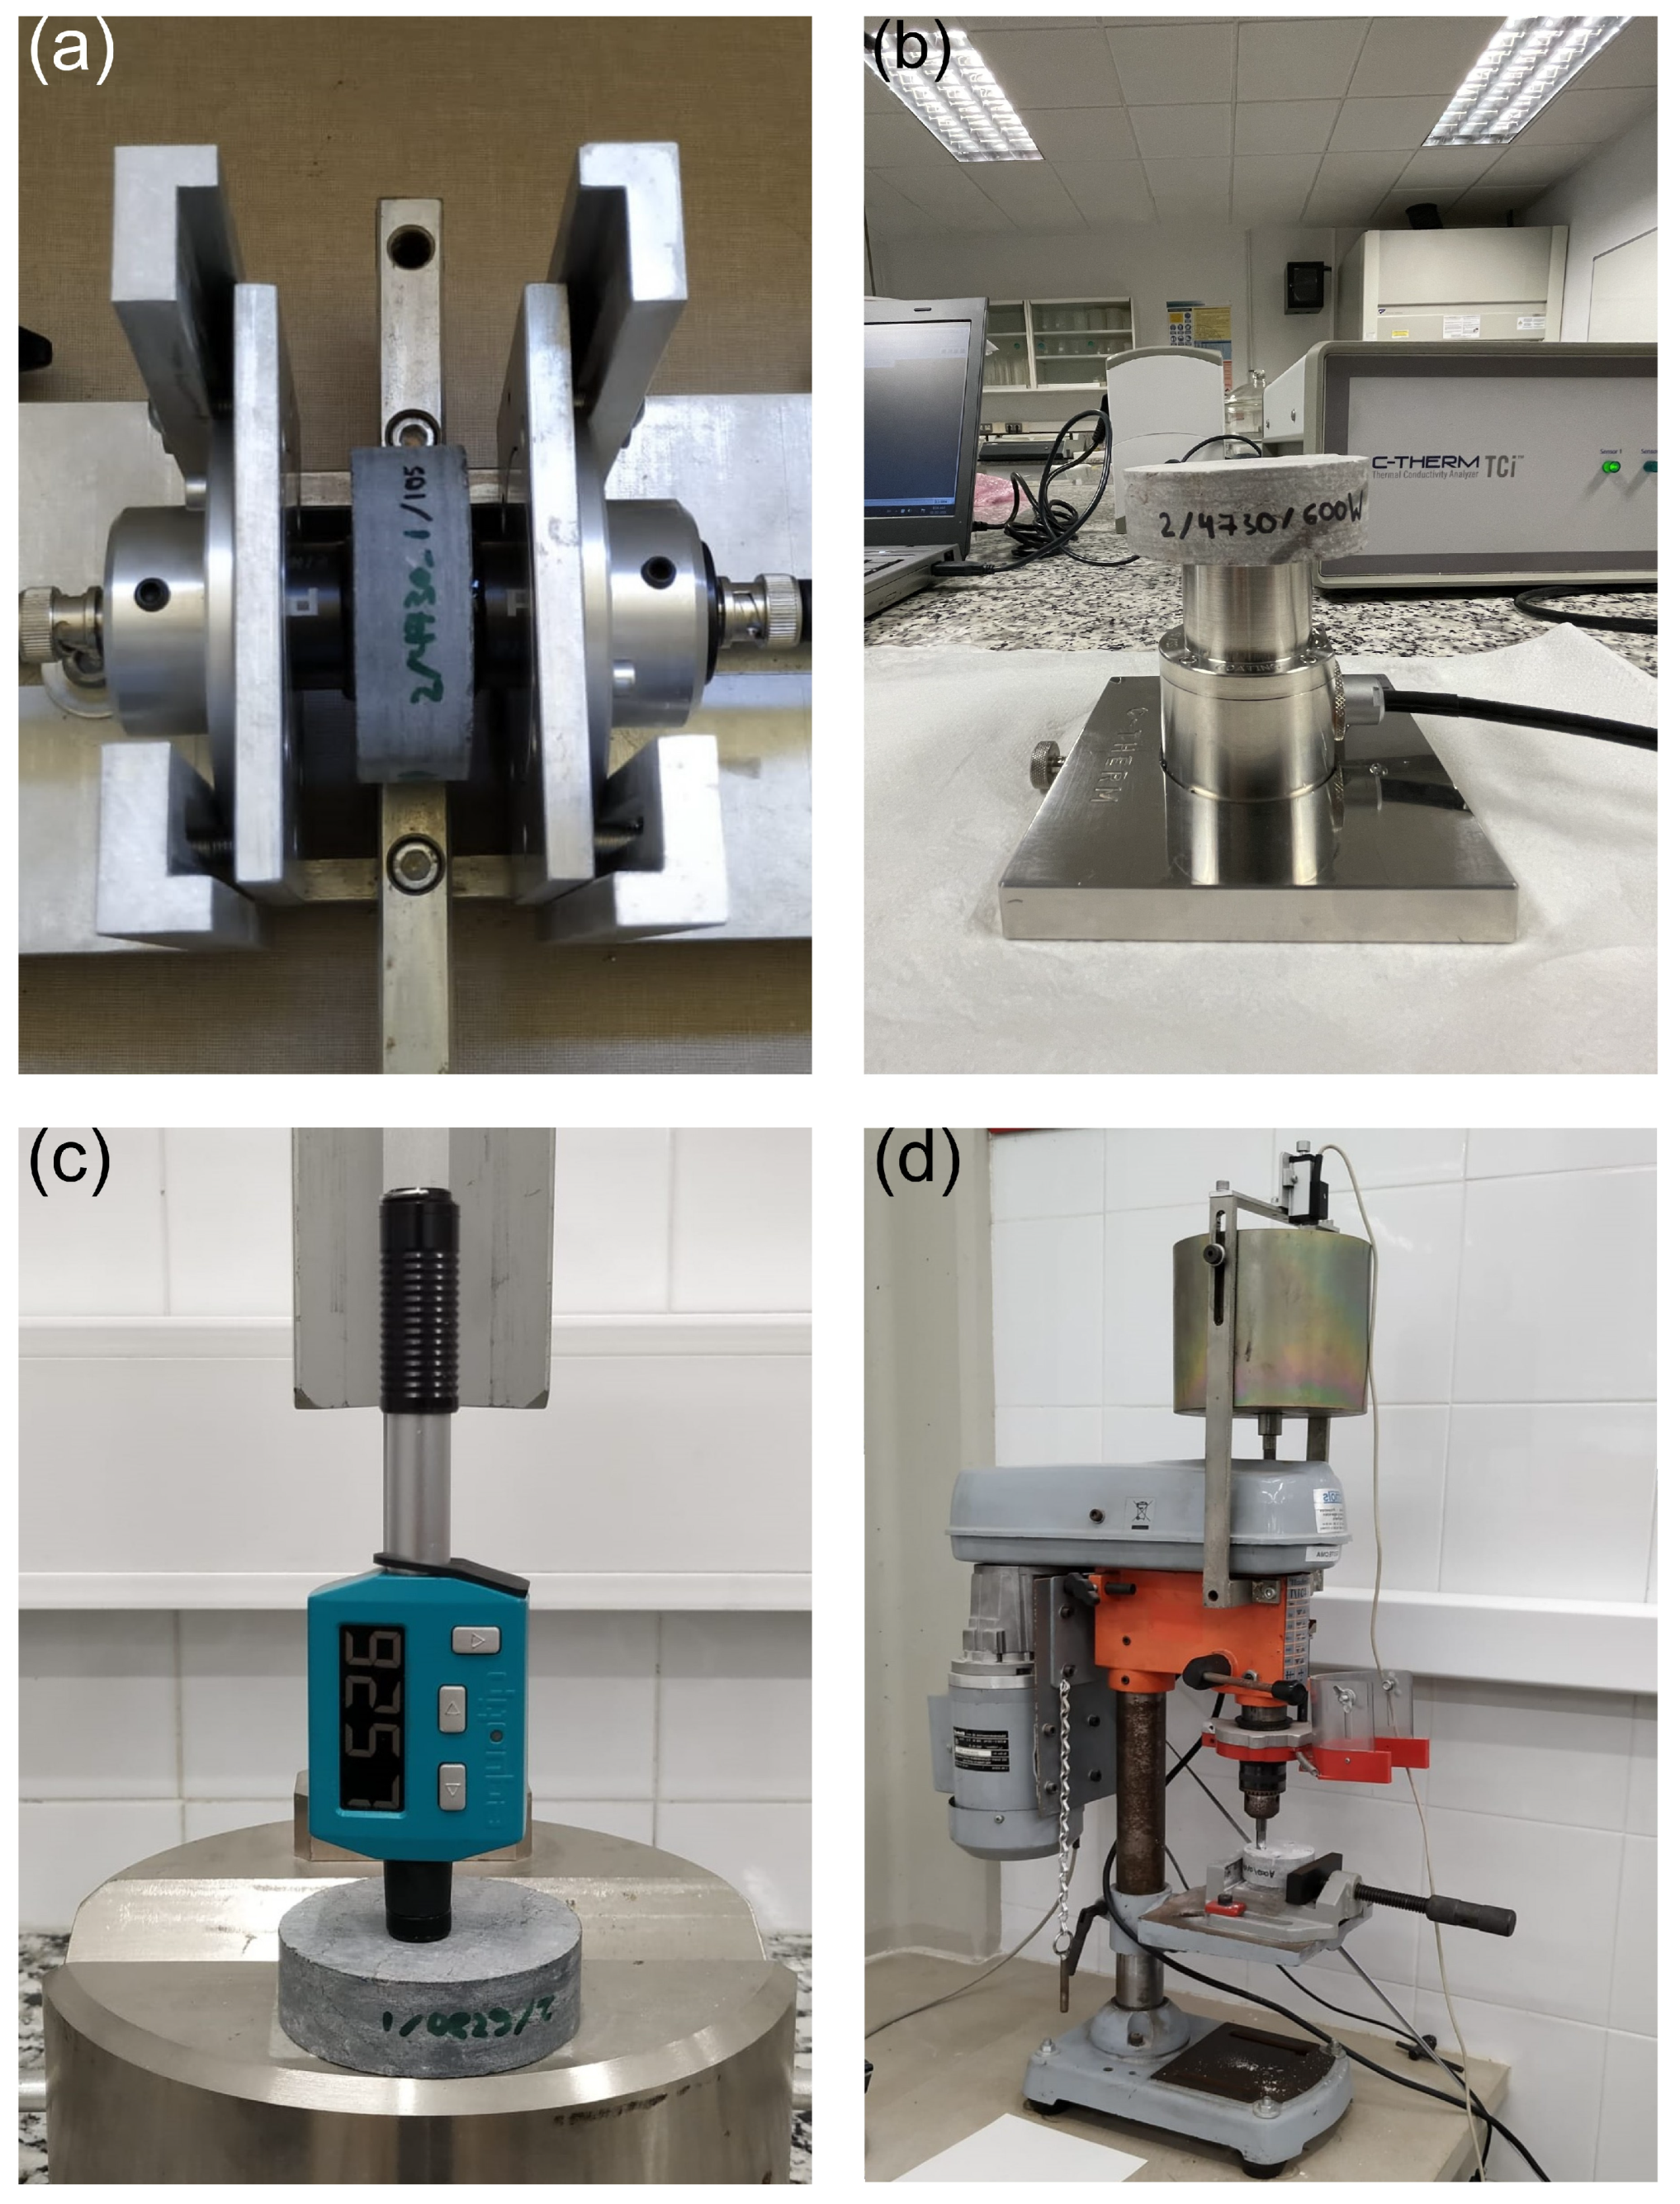
The open porosity (OP) of the samples was measured before and after thermal treatment using saturation and buoyancy techniques following the methods suggested by the International Society for Rock Mechanics (ISRM). P-wave ultrasonic velocity (US) measurements were performed on rock samples before and after subjecting them to thermal treatment, following ISRM recommendations. For this purpose, Olympus V1548 0.1 MHz piezoelectric sensors (Olympus Evident, Tokyo, Japan), Olympus video scan V1548 (0.1 MHz) transducers and emitter-receiver equipment Proceq Pundit lab+ (Screening Eagle Technologies, Zurich, Switzerland) were used (
Figure 2a).
The thermal conductivity λ of a material represents its ability to transfer heat by conduction, expressed as W/(m·K). It is strongly influenced by porosity in limestone samples [
24] and is, therefore, related to porosity and microcracking at the rock surface and to the variation in these textural properties with temperature. A Modified Transient Plane Source (MTPS) C-Therm TCi device, C-Therm Technologies, Fredericton, Canada, (
Figure 2b) was used in this research, as it is commonly used on rock samples [
24]. The flat faces of the specimens were polished to ensure flatness, and then silica gel was applied between the sample and the sensor to reduce the contact resistance and meet the test requirements. The final λ value was calculated as the average of three determinations on each sample.
Leeb rebound hardness tests were performed with an Equotip Piccolo 2 (Screening Eagle Technologies, Zurich, Switzerland) type ‘D’ (
Figure 2c). This device applies an impact energy of 11 N·mm and internally transforms the impact and rebound velocities into an L value. In this study, a total of ten tests were performed on both faces of each sample [
25], and then the final Leeb Hardness Index (HLD) of each sample was obtained as an average value, with the letter ‘D’ representing the type of impact device used.
Sievers’ J-miniature drill test (
Figure 2d) measures rock surface hardness or resistance to indentation. It is defined as the drilling depth after an Ø8.5 mm tungsten carbide miniature drill bit is operated for 60 s with a speed of 200 rpm and a vertical load of 20 kg. In this research, the test was repeated five times on each rock sample, and the Sievers’ J-value (SJ) was calculated as the average value of the depth of the drills, measured in 1/10 mm [
26]. The drill penetration was monitored every 0.5 s during the test time to represent depth–time and drilling rate–time curves. This article presents a new procedure based on Dahl et al. [
20] to delimit sections of these curves with distinct penetration rates. It consists of two steps: (1) determine the tangent lines for the steep part of the curve representing the effective drilling for the sharp edge of the drill bit and for the flatter part where drill bit wear has already occurred, and (2) find the point (the time) at which the two tangent lines intersect. This point of intersection is called the “SJIP” and is representative of the ‘‘effective lifetime’’ of the cutters.
3. Results
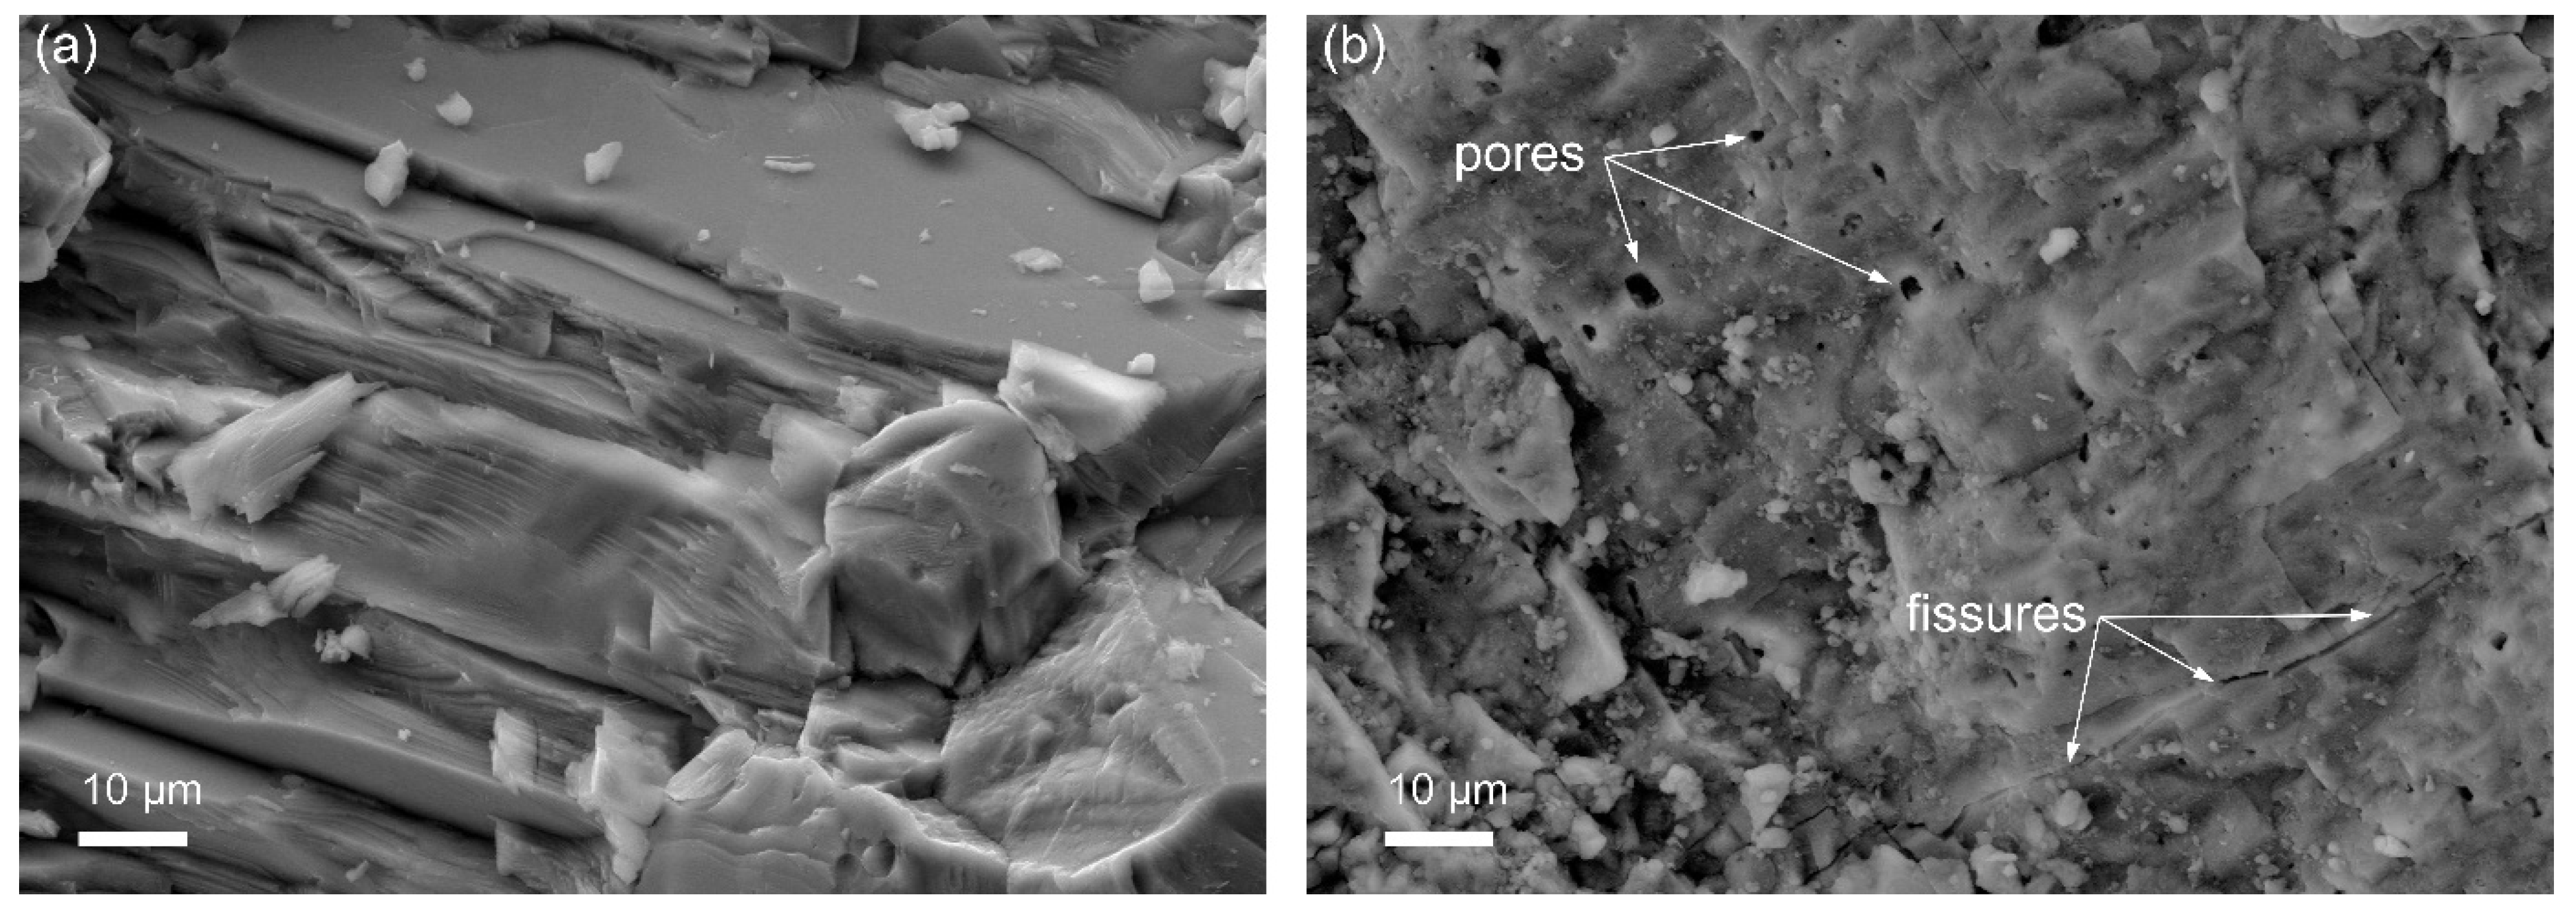
The samples showed more thermal damage when heated to the highest temperature. Thus, no significant microporosity or fissures could be observed by SEM in the intact Prada limestone (
Figure 3a). However, samples heated up to 600 °C showed well-formed and connected micro-cracks and porosity, suggesting severe thermal damage in this rock after thermal treatment (
Figure 3b).
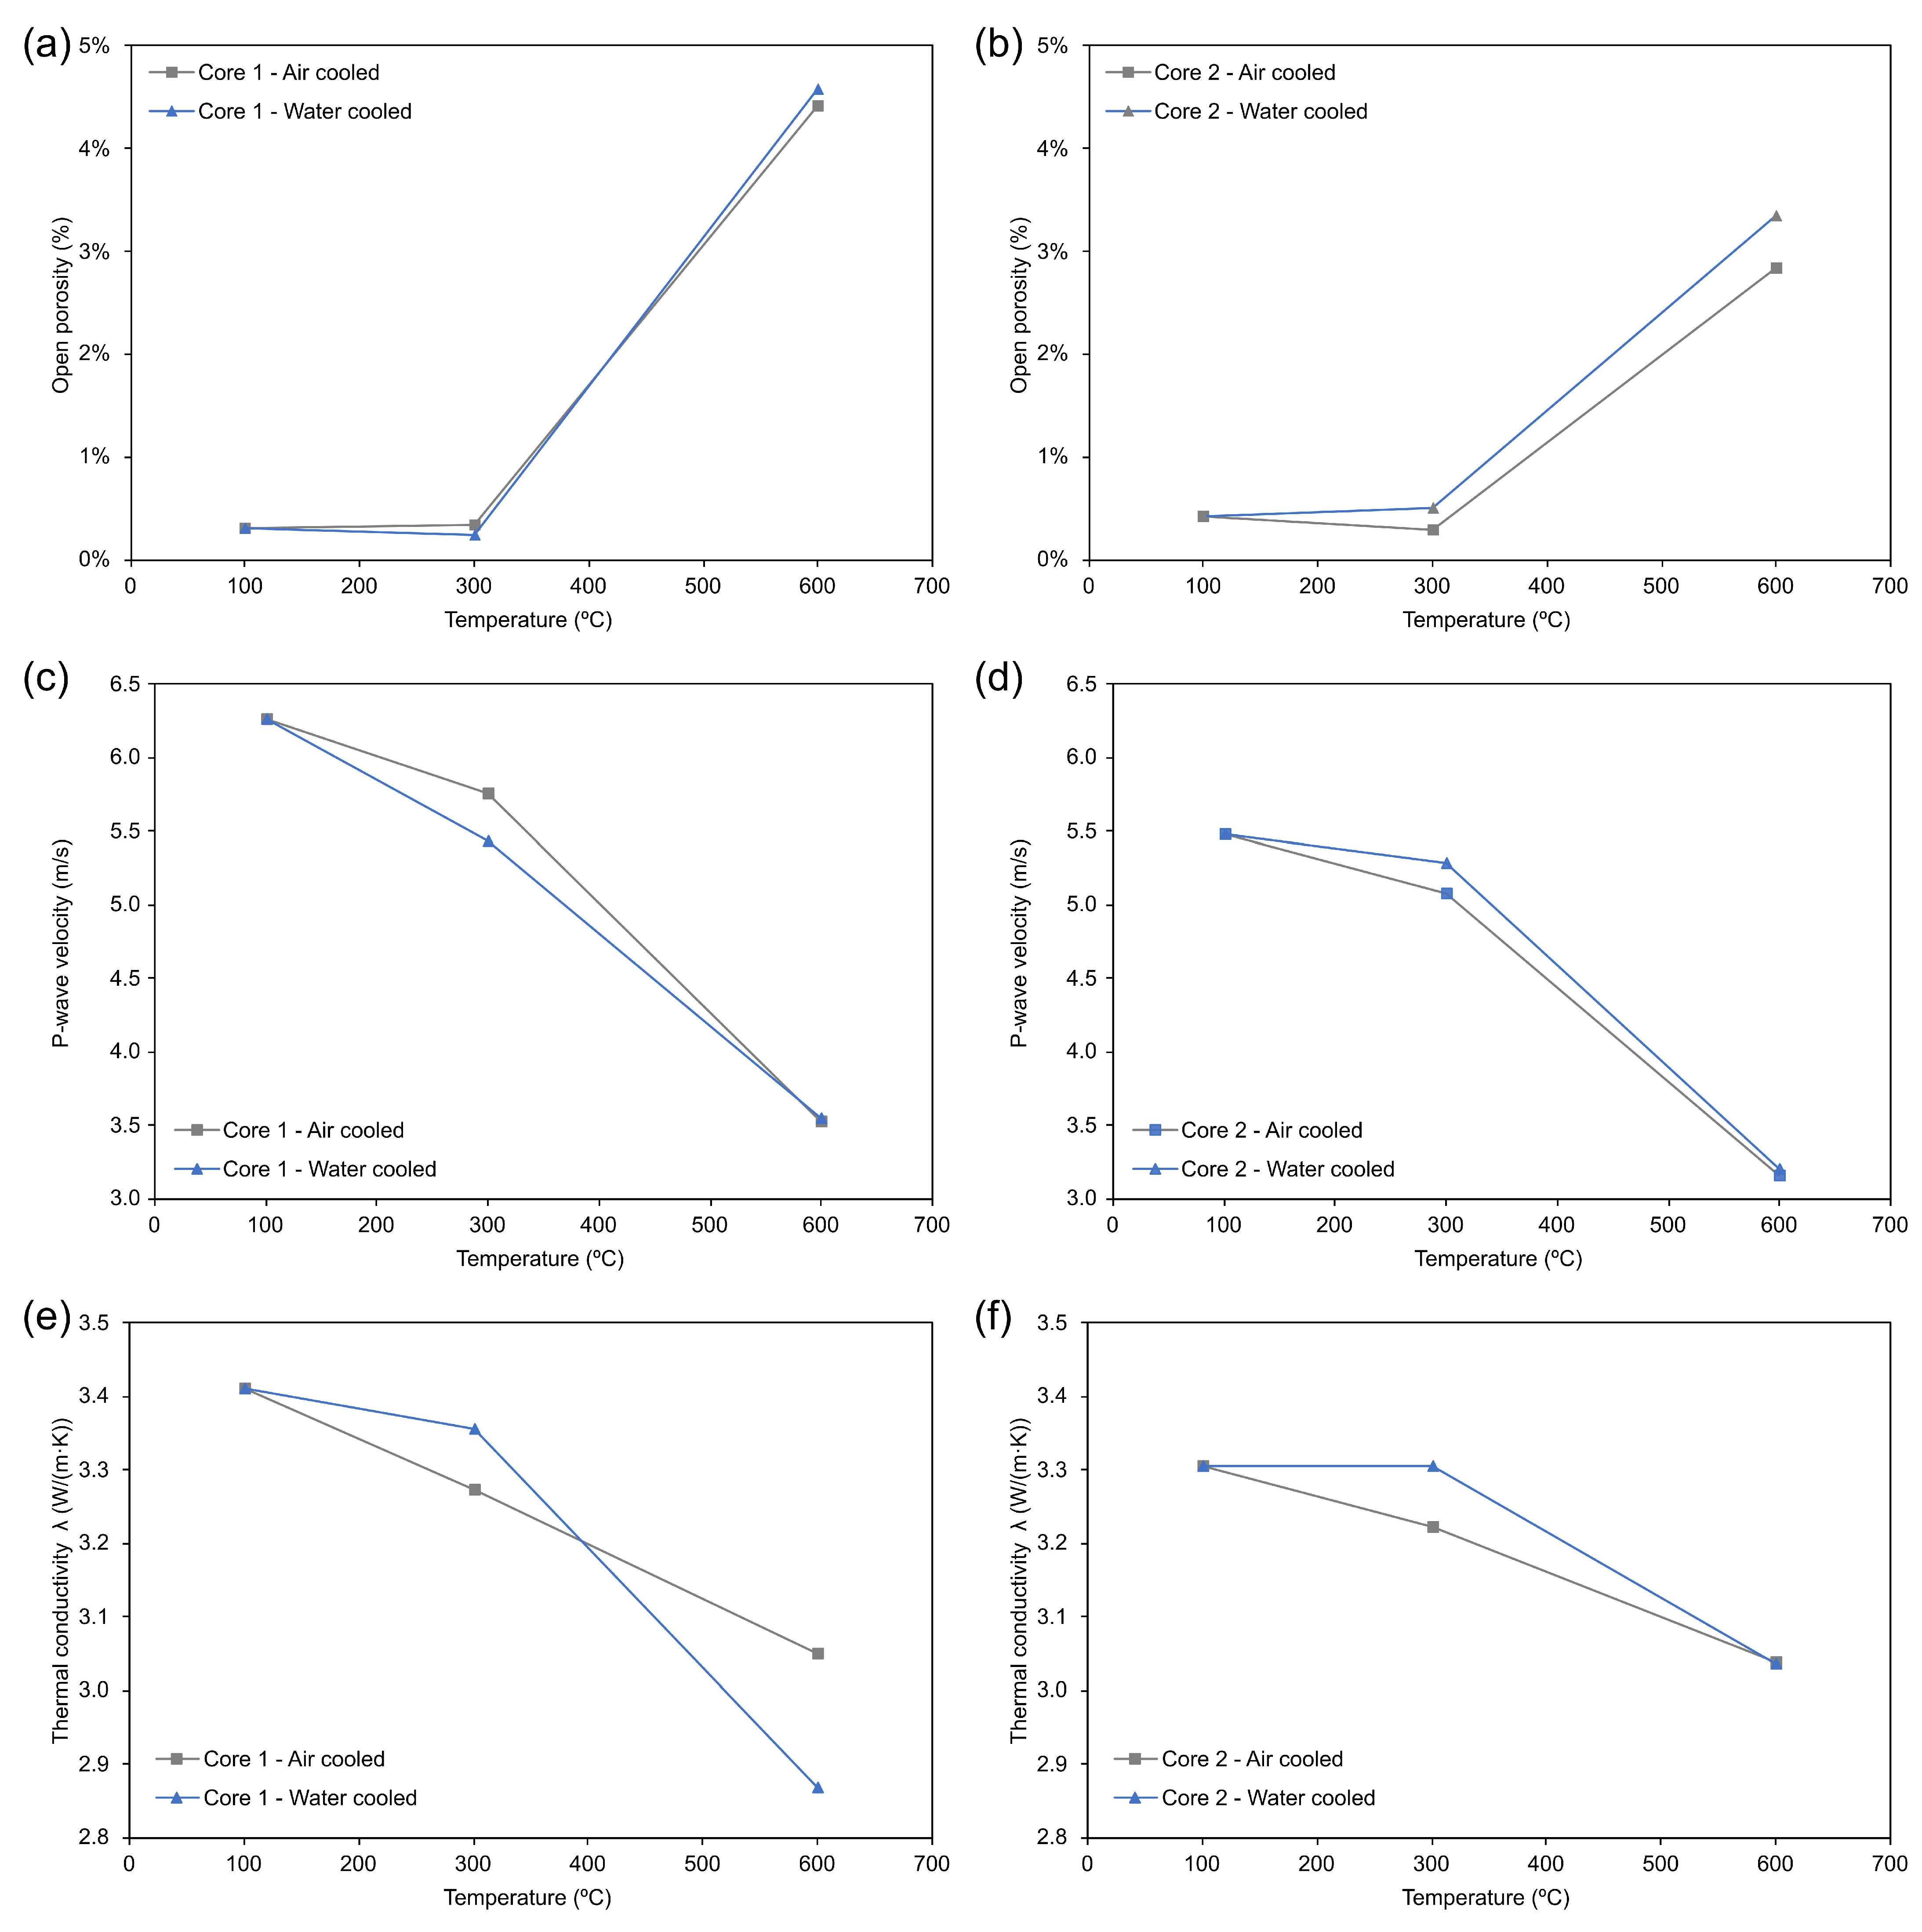
The results of the tests developed to determine the physical properties of Prada limestone are represented in
Figure 4. The intact Prada limestone showed reduced porosity values (0.30–0.40%), and its ultrasonic wave velocity was high (5.5–6.3 km/s), which is typical for low-porosity limestones [
13]. The thermal conductivity of intact Prada limestone was around 3.3–3.4 W/k·m, which is also typical for low-porosity limestones [
24]. A temperature of 300 °C caused a slight decrease in porosity in both cores 1 and 2, a 7–13% reduction in P-wave velocity, and a 2–4% decrease in thermal conductivity. At 600 °C, porosity and P-wave velocity showed a sharp variation in all variables: porosity in core 1 samples increased by a factor of 14 and in core 2, by a factor of 7. In addition, a sharp drop in P-wave velocity was measured for the maximum temperature (42–44%). Finally, the thermal conductivity decreased by 8–16%.
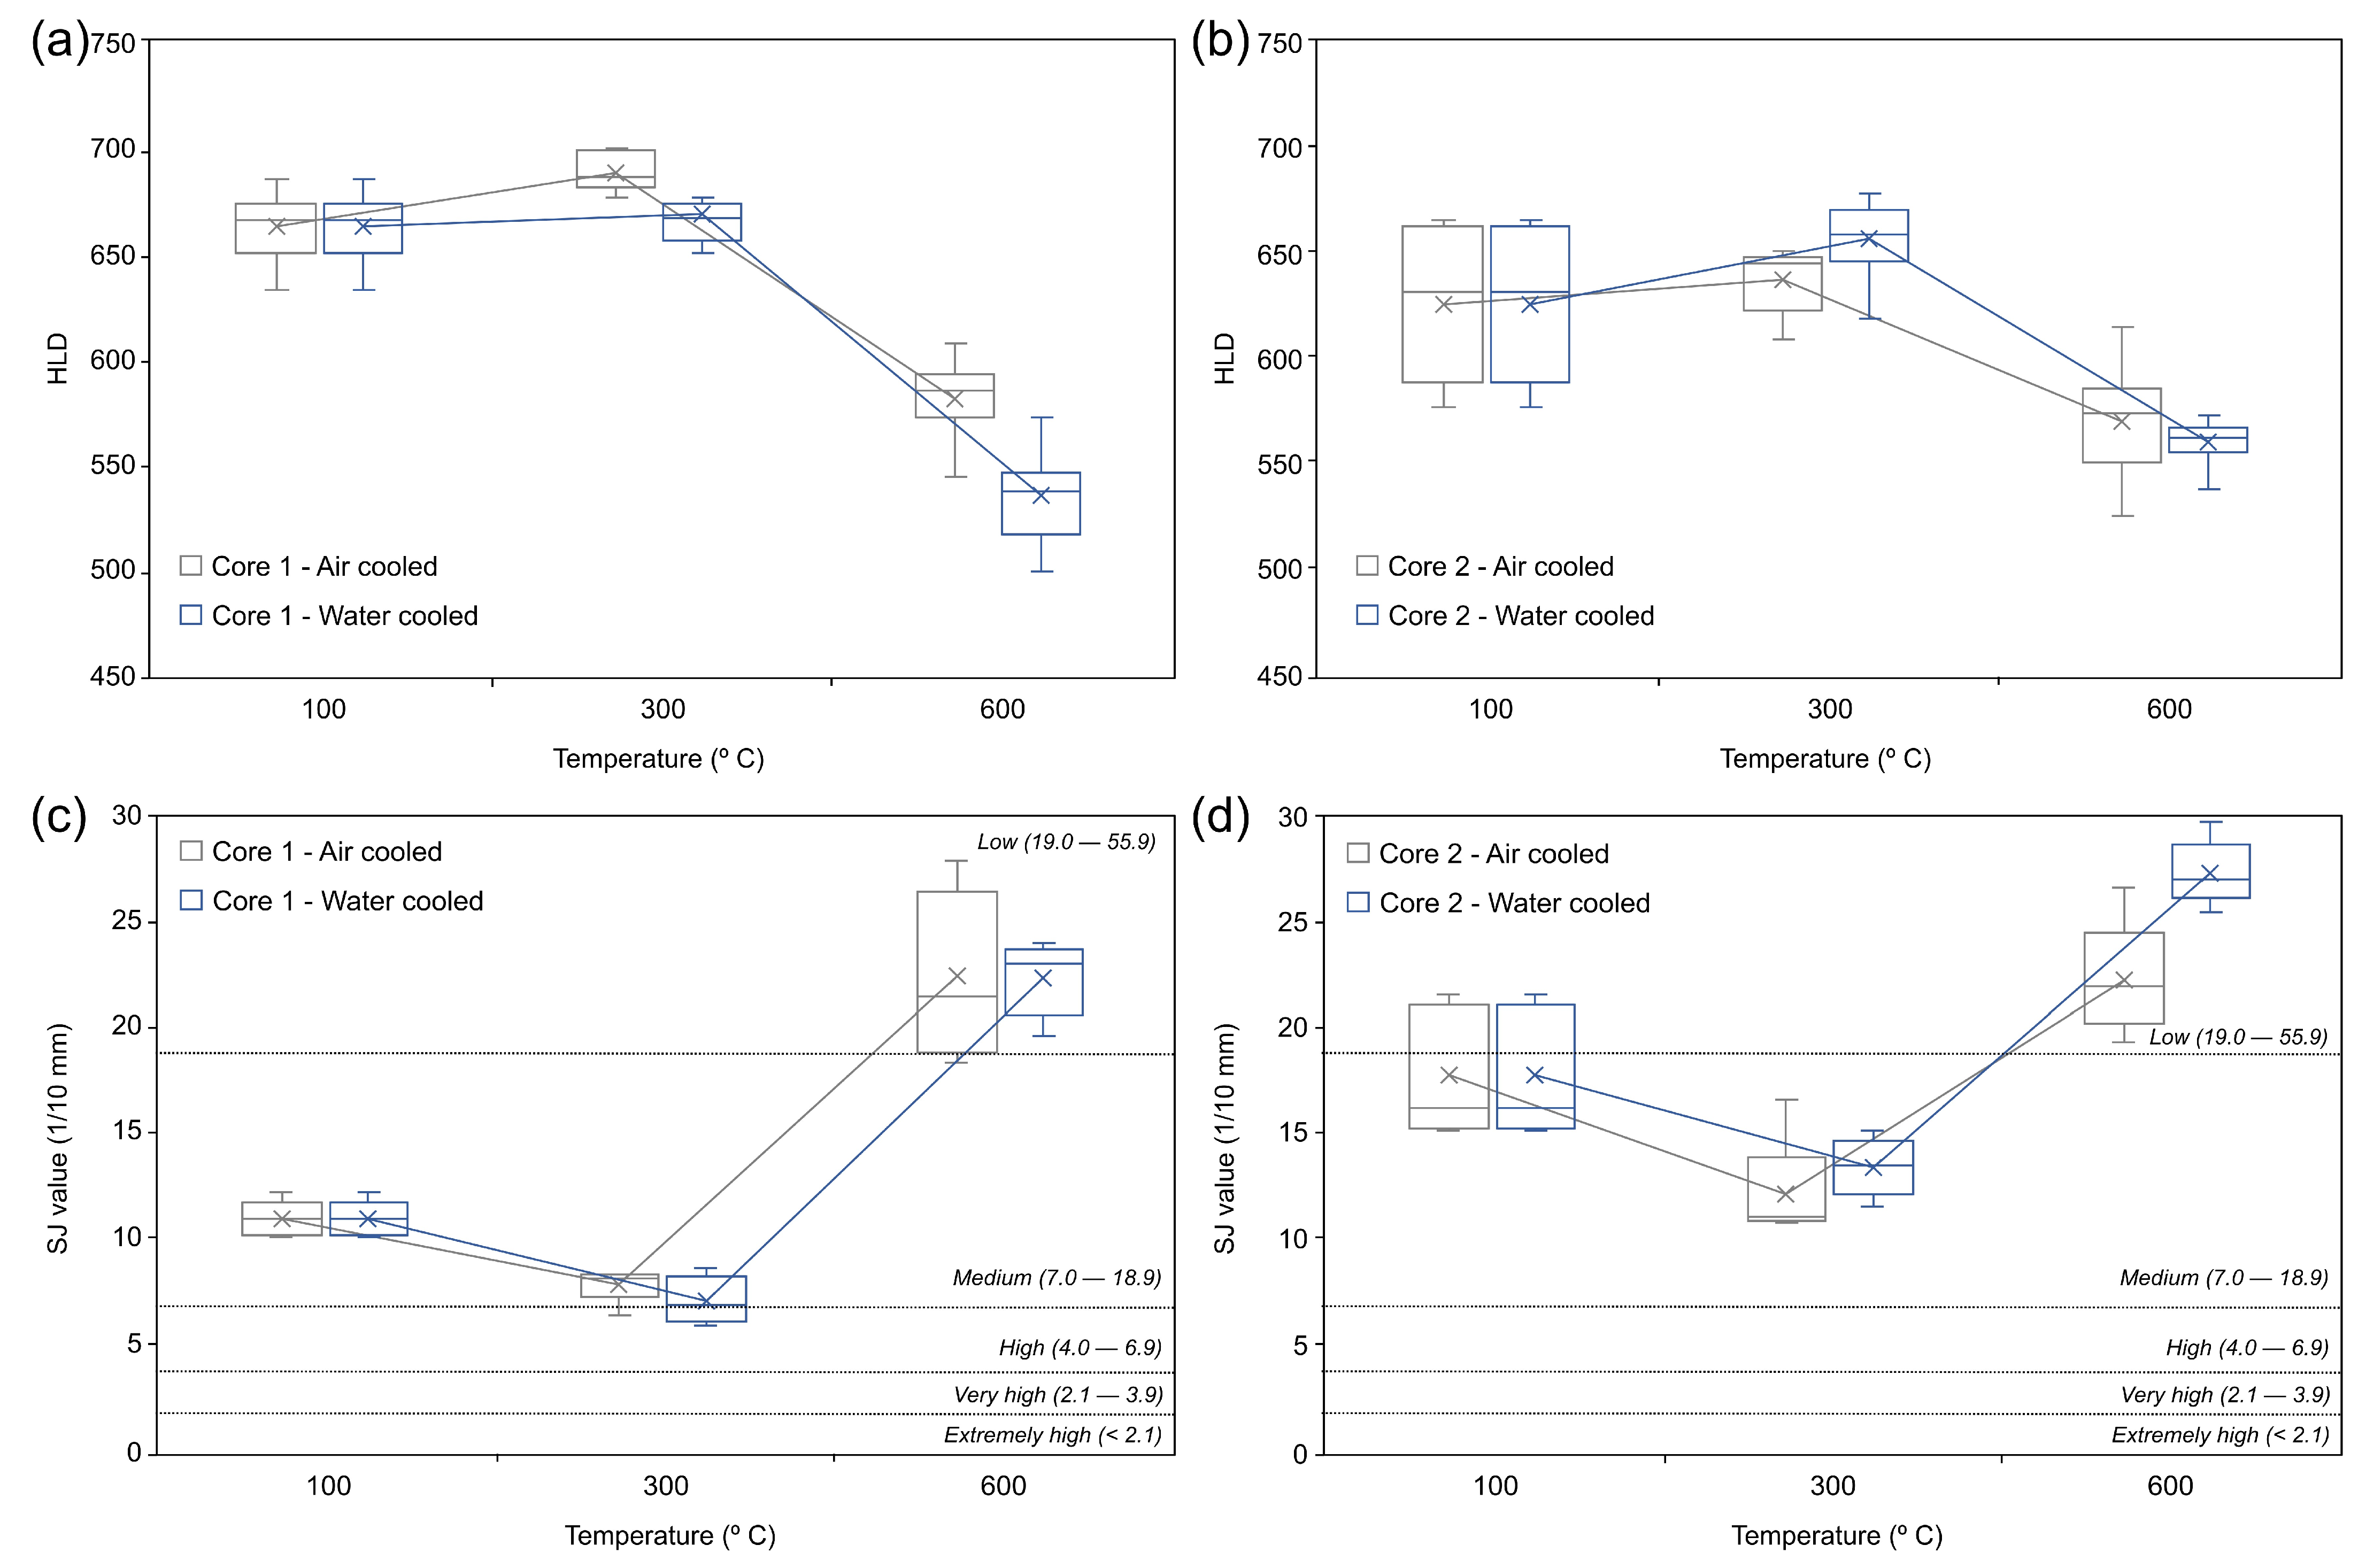
Leeb rebound tests (
Figure 5a,b) showed average values in the intact Prada limestone of 626–662, corresponding to a high surface hardness according to the classes defined by Garrido et al. [
25] for carbonate rocks. Sievers’ J-miniature drill tests (
Figure 5c,d) exhibit average SJ values of 11–17 1/10 mm, corresponding to medium indentation resistance, according to Dahl et al. [
27]. Samples heated to 300 °C showed slightly increased surface hardness and indentation resistance. Thus, the increase in HLD was up to 5% for both air- and water-cooled samples, with no apparent differences between the two methods. Samples heated up to 300 °C exhibited a clear decrease of more than 30% in SJ (increase in indentation resistance), with no apparent differences between cooling methods. Finally, the Prada limestone exhibited a significant decrease in surface hardness and indentation resistance when heated up to 600 °C. Thus, the samples generally showed a clear reduction in HLD at 600 °C, especially in core 1 samples, where the water-cooling method induced a higher surface hardness loss (19%) than in the air-cooled specimens (12%). Core 2 samples showed a more than 10% loss for both cooling methods. Despite the variation in numerical values described above, the Prada limestone remained in the high surface hardness class for all temperatures tested in this research. A temperature of 600 °C also induced a dramatic increase in the SJ above 100% in core 1, with no apparent differences between the cooling methods. In addition, the SJ in core 2 varied between 25% and 50% (the latter for the water-cooled samples). Therefore, samples from both cores 1 and 2 heated to 600 °C reduced their indentation resistance to low on the scale of Dahl et al. [
27].
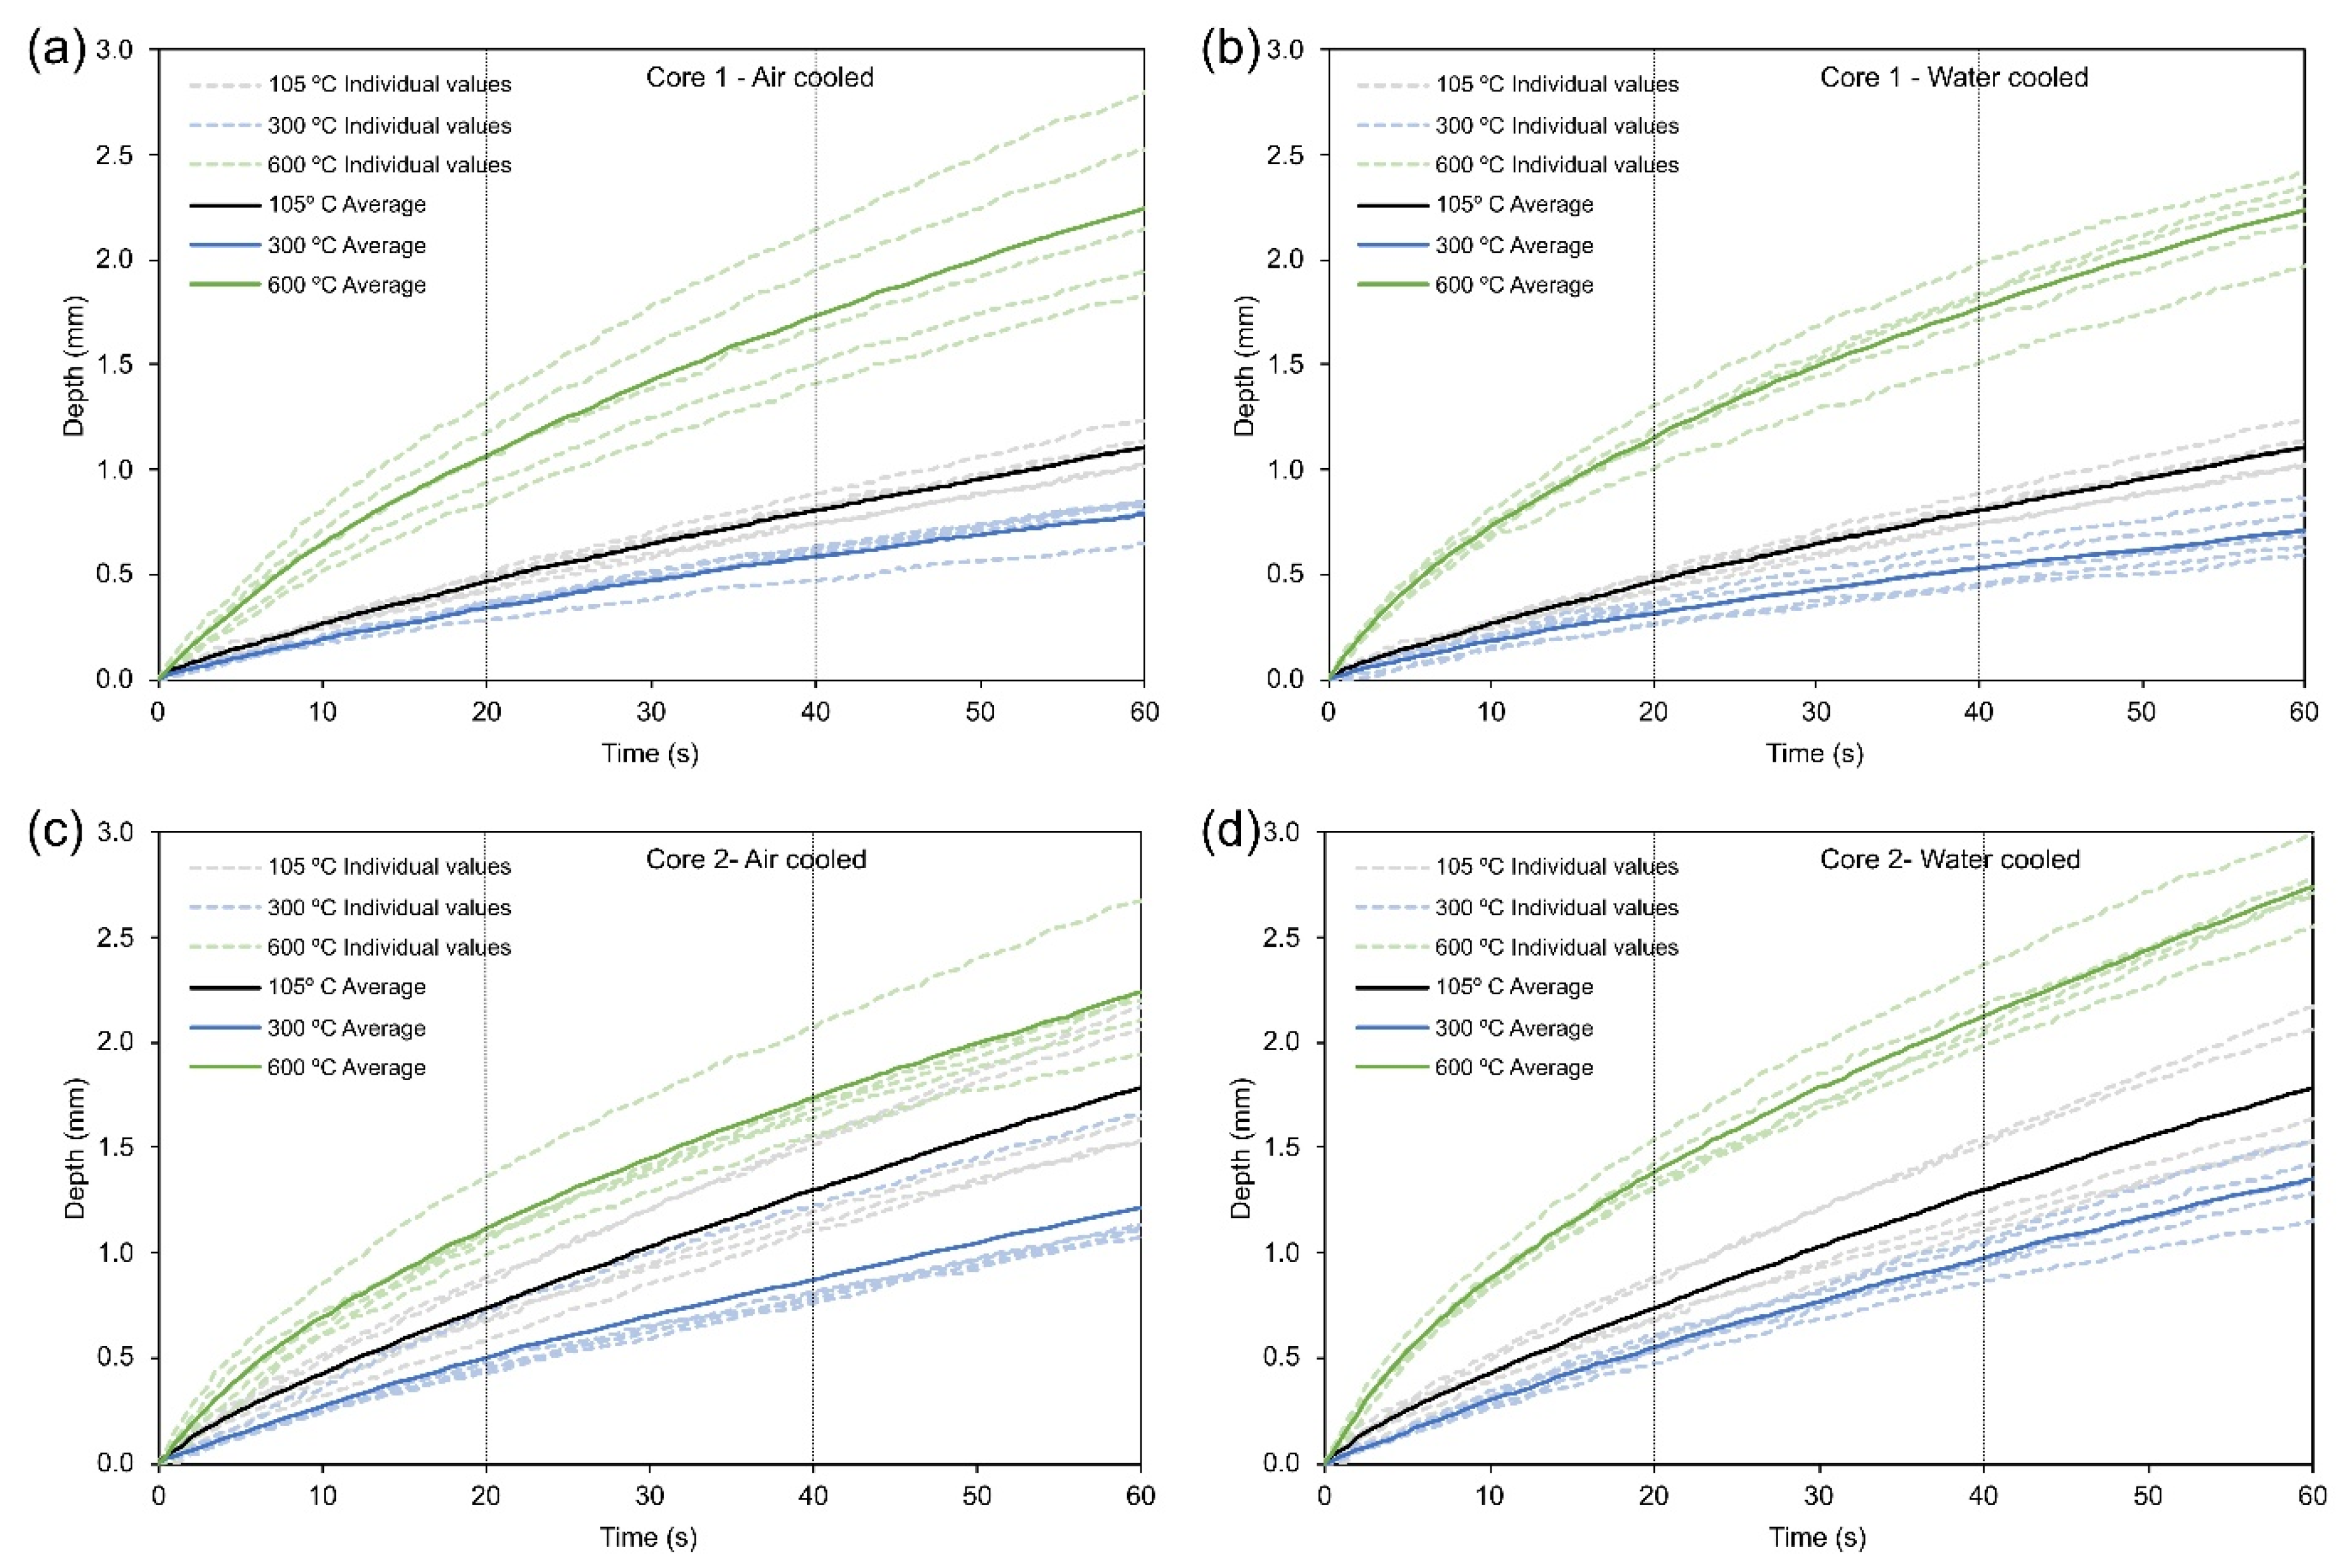
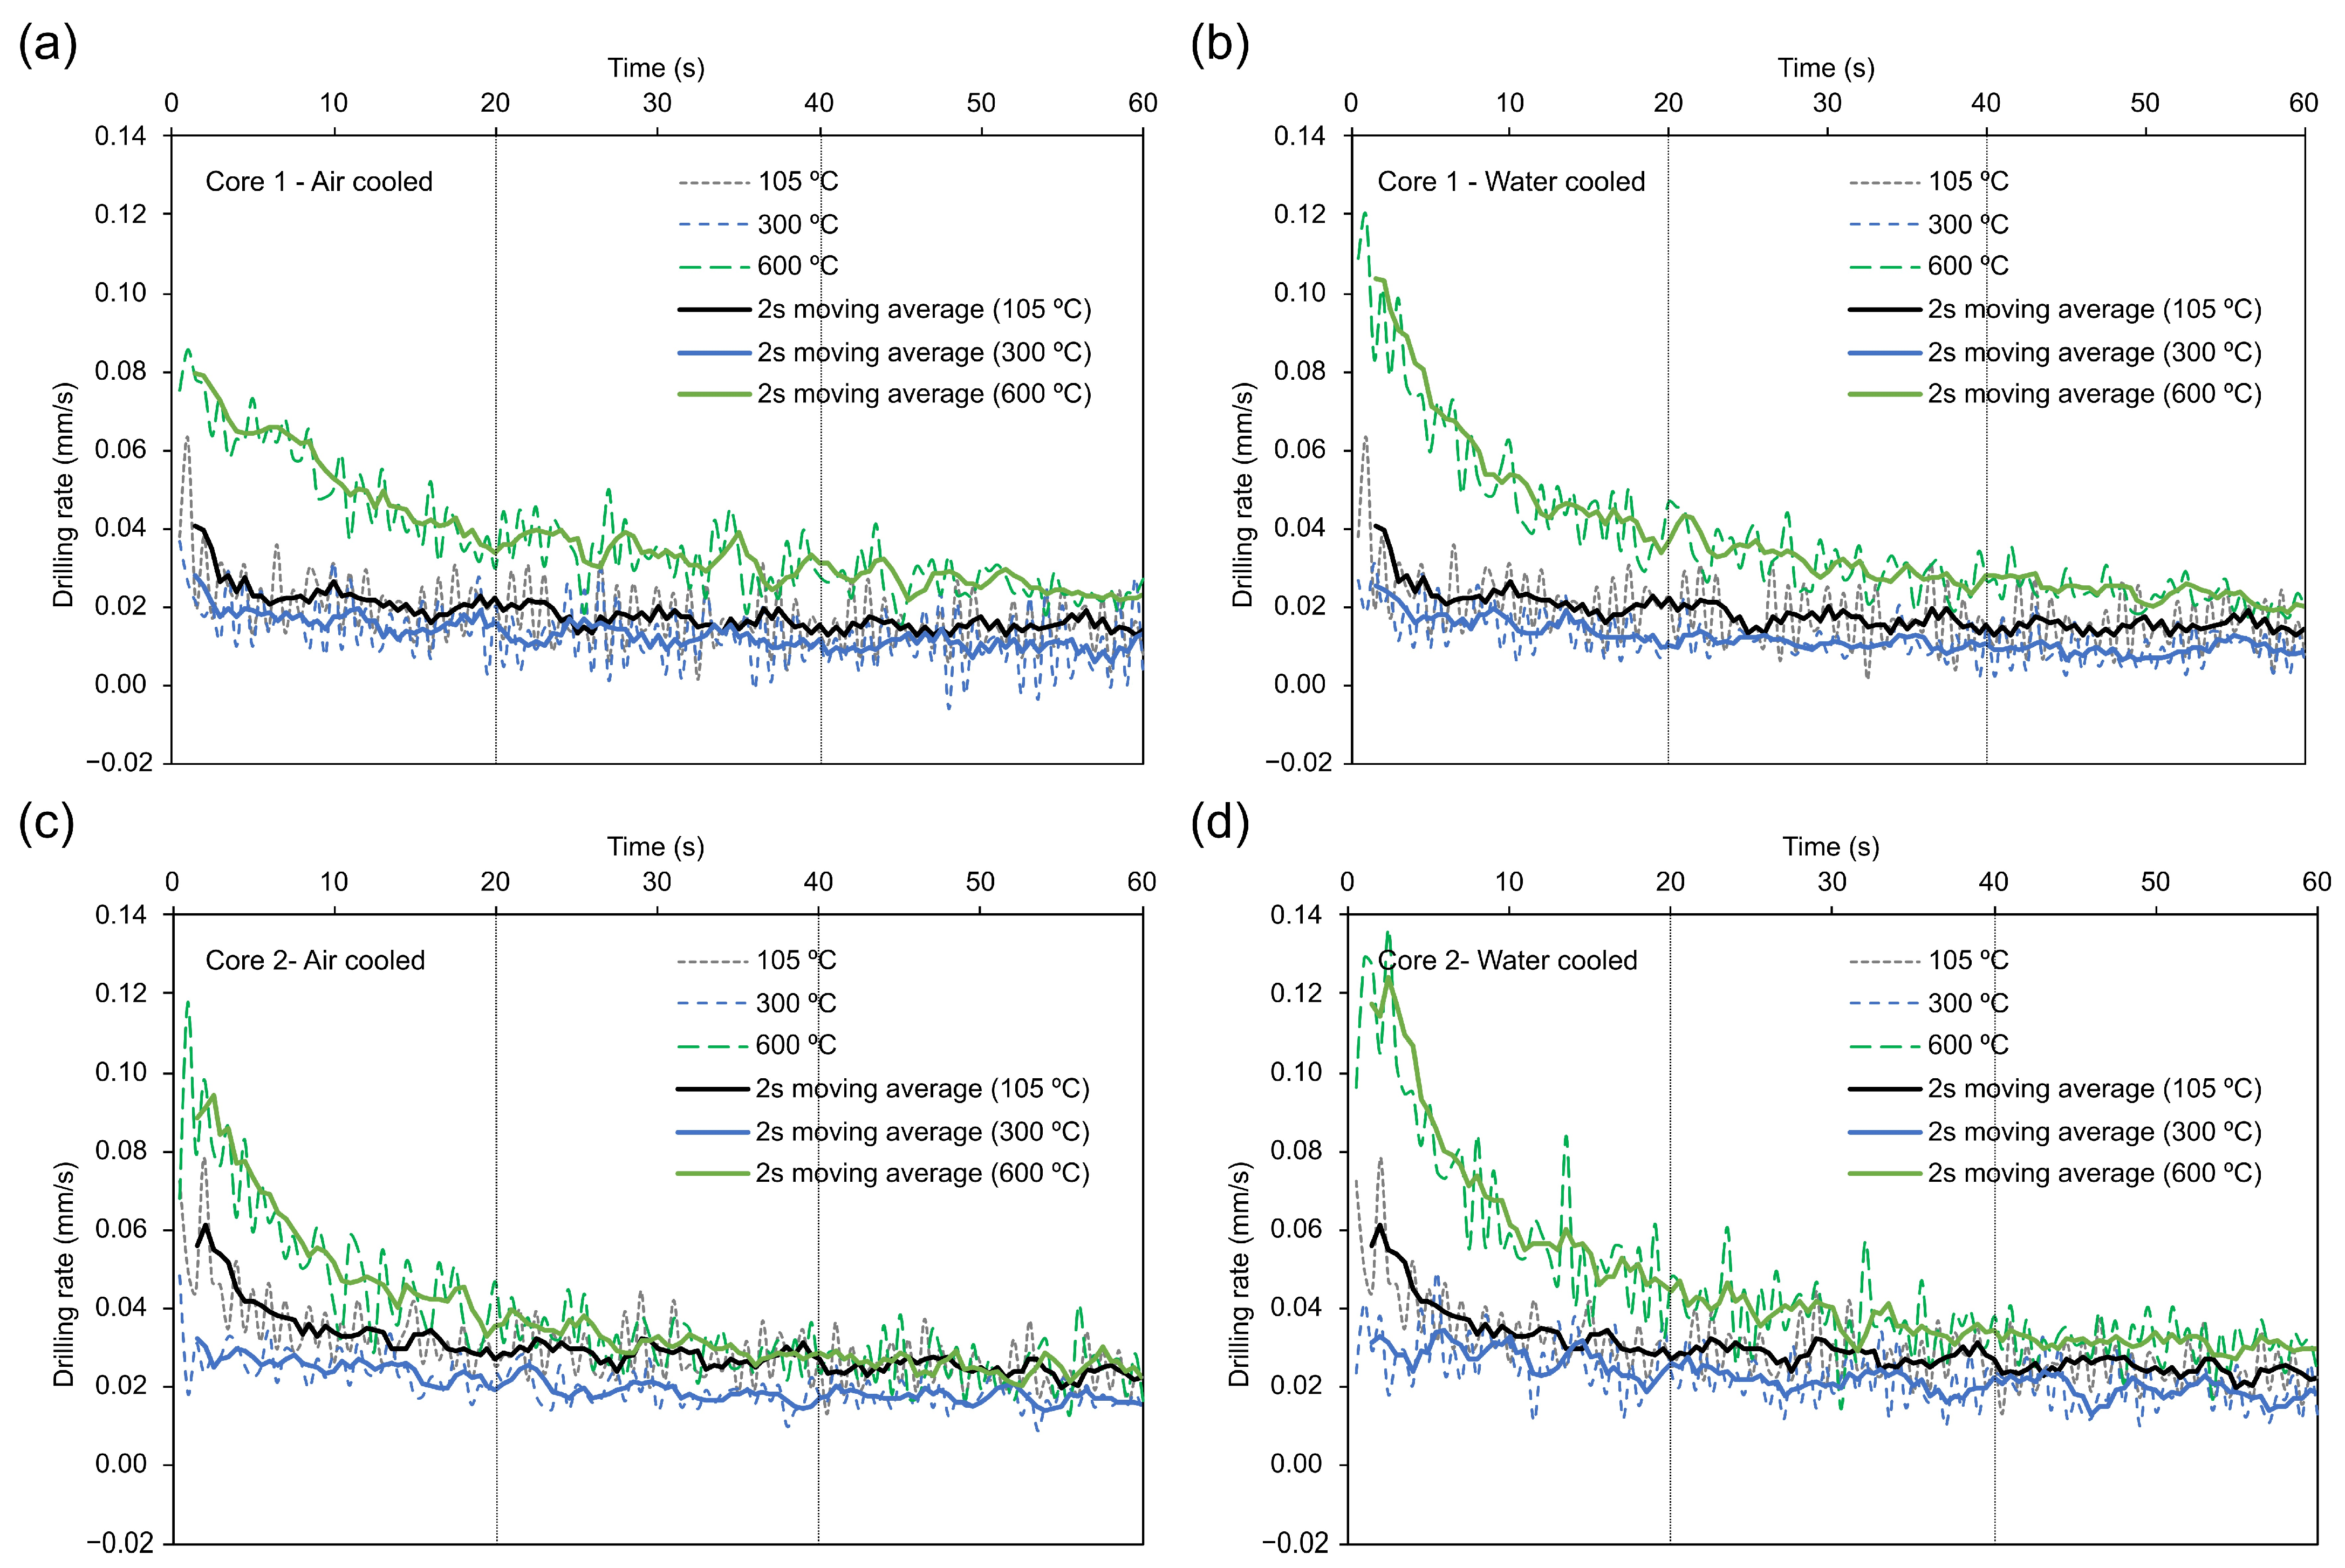
To study the evolution of the penetration rate, the penetration–time curves (
Figure 6) and the drilling rate–time graphs (
Figure 7) were divided into three equal intervals of 20 s, covering the whole test time. It can be seen how the drilling rate is higher in the first third of the test for all temperatures and cooling methods, and almost stable from the second interval until the end of the test. Thus, in this study, two different characteristic zones are established: (a) a shallow depth (Zone 1) showing a high initial penetration rate, and (b) a deeper zone in which the penetration rate decreases and tends to stabilise (Zone 2). The extent of both zones depends strongly on the maximum temperatures reached. Thus, samples heated to 600 °C exhibit a higher initial drilling rate and extension in Zone 1. It can also be observed that rapidly cooled samples show an increase in the drilling rate and extension of Zone 1, especially for target temperatures of 600 °C. On the other hand, the drilling rate and Zone 1 extension are lower when samples are heated up to 300 °C, as represented in
Figure 6 and
Figure 7.
4. Discussion
This novel research demonstrates the relationship between the variation in Leeb surface hardness and Sievers’ J-value with temperature. Thus, both properties follow similar trends: a hardening effect (i.e., increased difficulty in drilling) at 300 °C and a drastic decrease in surface hardness at 600 °C (i.e., increased ease of drilling). Furthermore,
Figure 8a shows a linear correlation between these phenomena. Although both tests measure rock surface hardness [
27], the authors have not found a proven correspondence between the results of both tests in the existing scientific literature.
The variation in surface hardness and drillability is due to different physicochemical mechanisms triggered by the temperatures reached and the cooling methods used. Thus, intermediate temperatures of 300 °C induce a hardening effect in Prada limestone, increasing surface hardness and indentation resistance. Such an effect is related to the closure of pores and fissures by thermal dilation of calcite [
23], and the authors attribute a marginal decrease in porosity measured at 300 °C to this effect (
Figure 4a,b). The increase in SJ due to the hardening effect (
Figure 5c,d) was previously reported for Prada limestone [
19] and is now confirmed in this research.
High temperatures of 600 °C induce severe thermal damage in Prada limestone, leading to a dramatic decrease in surface hardness and an increase in the drillability of the samples. The SJ is mainly influenced by the mineralogical composition of the rock, grain size and grain binding, degree of weathering/alteration, microfracturing and foliation [
27]. In this case, the increase in the number and density of microcracks at 600 °C observed in SEM (
Figure 3b) leads to an ease in the indentation capacity represented by SJ. A drop in the surface hardness expressed by HLD was also observed (
Figure 5a,b), which is linked to the global strength decay process due to increased microcracking in the rock [
25]. The thermal damage was so intense that it was highlighted in the variation of all the physical properties studied in this research (
Figure 4). Thus, properties representing the rock integrity showed visible variation: increased open porosity and decreased P-wave velocity. Thermal conductivity also showed a visible drop, and this is because porosity is critical in the thermal conductivity of limestone rocks [
24]. Thus, an appreciable increase in porosity at 600 °C implies that the proportion of air in the material increases so that the conductivity logically decreases since the conductivity of air is much lower than that of minerals [
28]. The causes of the dramatic thermal damage experienced by Prada limestone at 600 °C are mainly attributed to the anisotropic expansion of calcite [
9] and the mismatch in thermal expansion coefficients between mineral particles, especially from 400 °C [
29]. In general, thermal damage in rocks is higher when samples are cooled at high speed with water (quenching) due to internal tensile stresses that nucleate cracks [
30,
31]. However, this effect is not evident in the samples tested (except for TC tests), which the authors attribute to the fact that a temperature of 600 °C causes very high thermal damage, resulting in such extreme values of the parameters that no differences can be appreciated according to the type of cooling used. Indeed, a temperature of 600 °C marks the limit at which the Prada samples retain their integrity, according to previous research [
14].
Correlations between most physical, mechanical and drilling characteristics in the thermally treated Prada limestone (
Figure 8) are more robust than those reported for intact rocks. Such strong correlations represent a typical pattern of change in rock features resulting from thermal damage. Thus, increased porosity, microcrack growth, and coalescence, especially at 600 °C, proportionally affect all studied properties of Prada limestone.
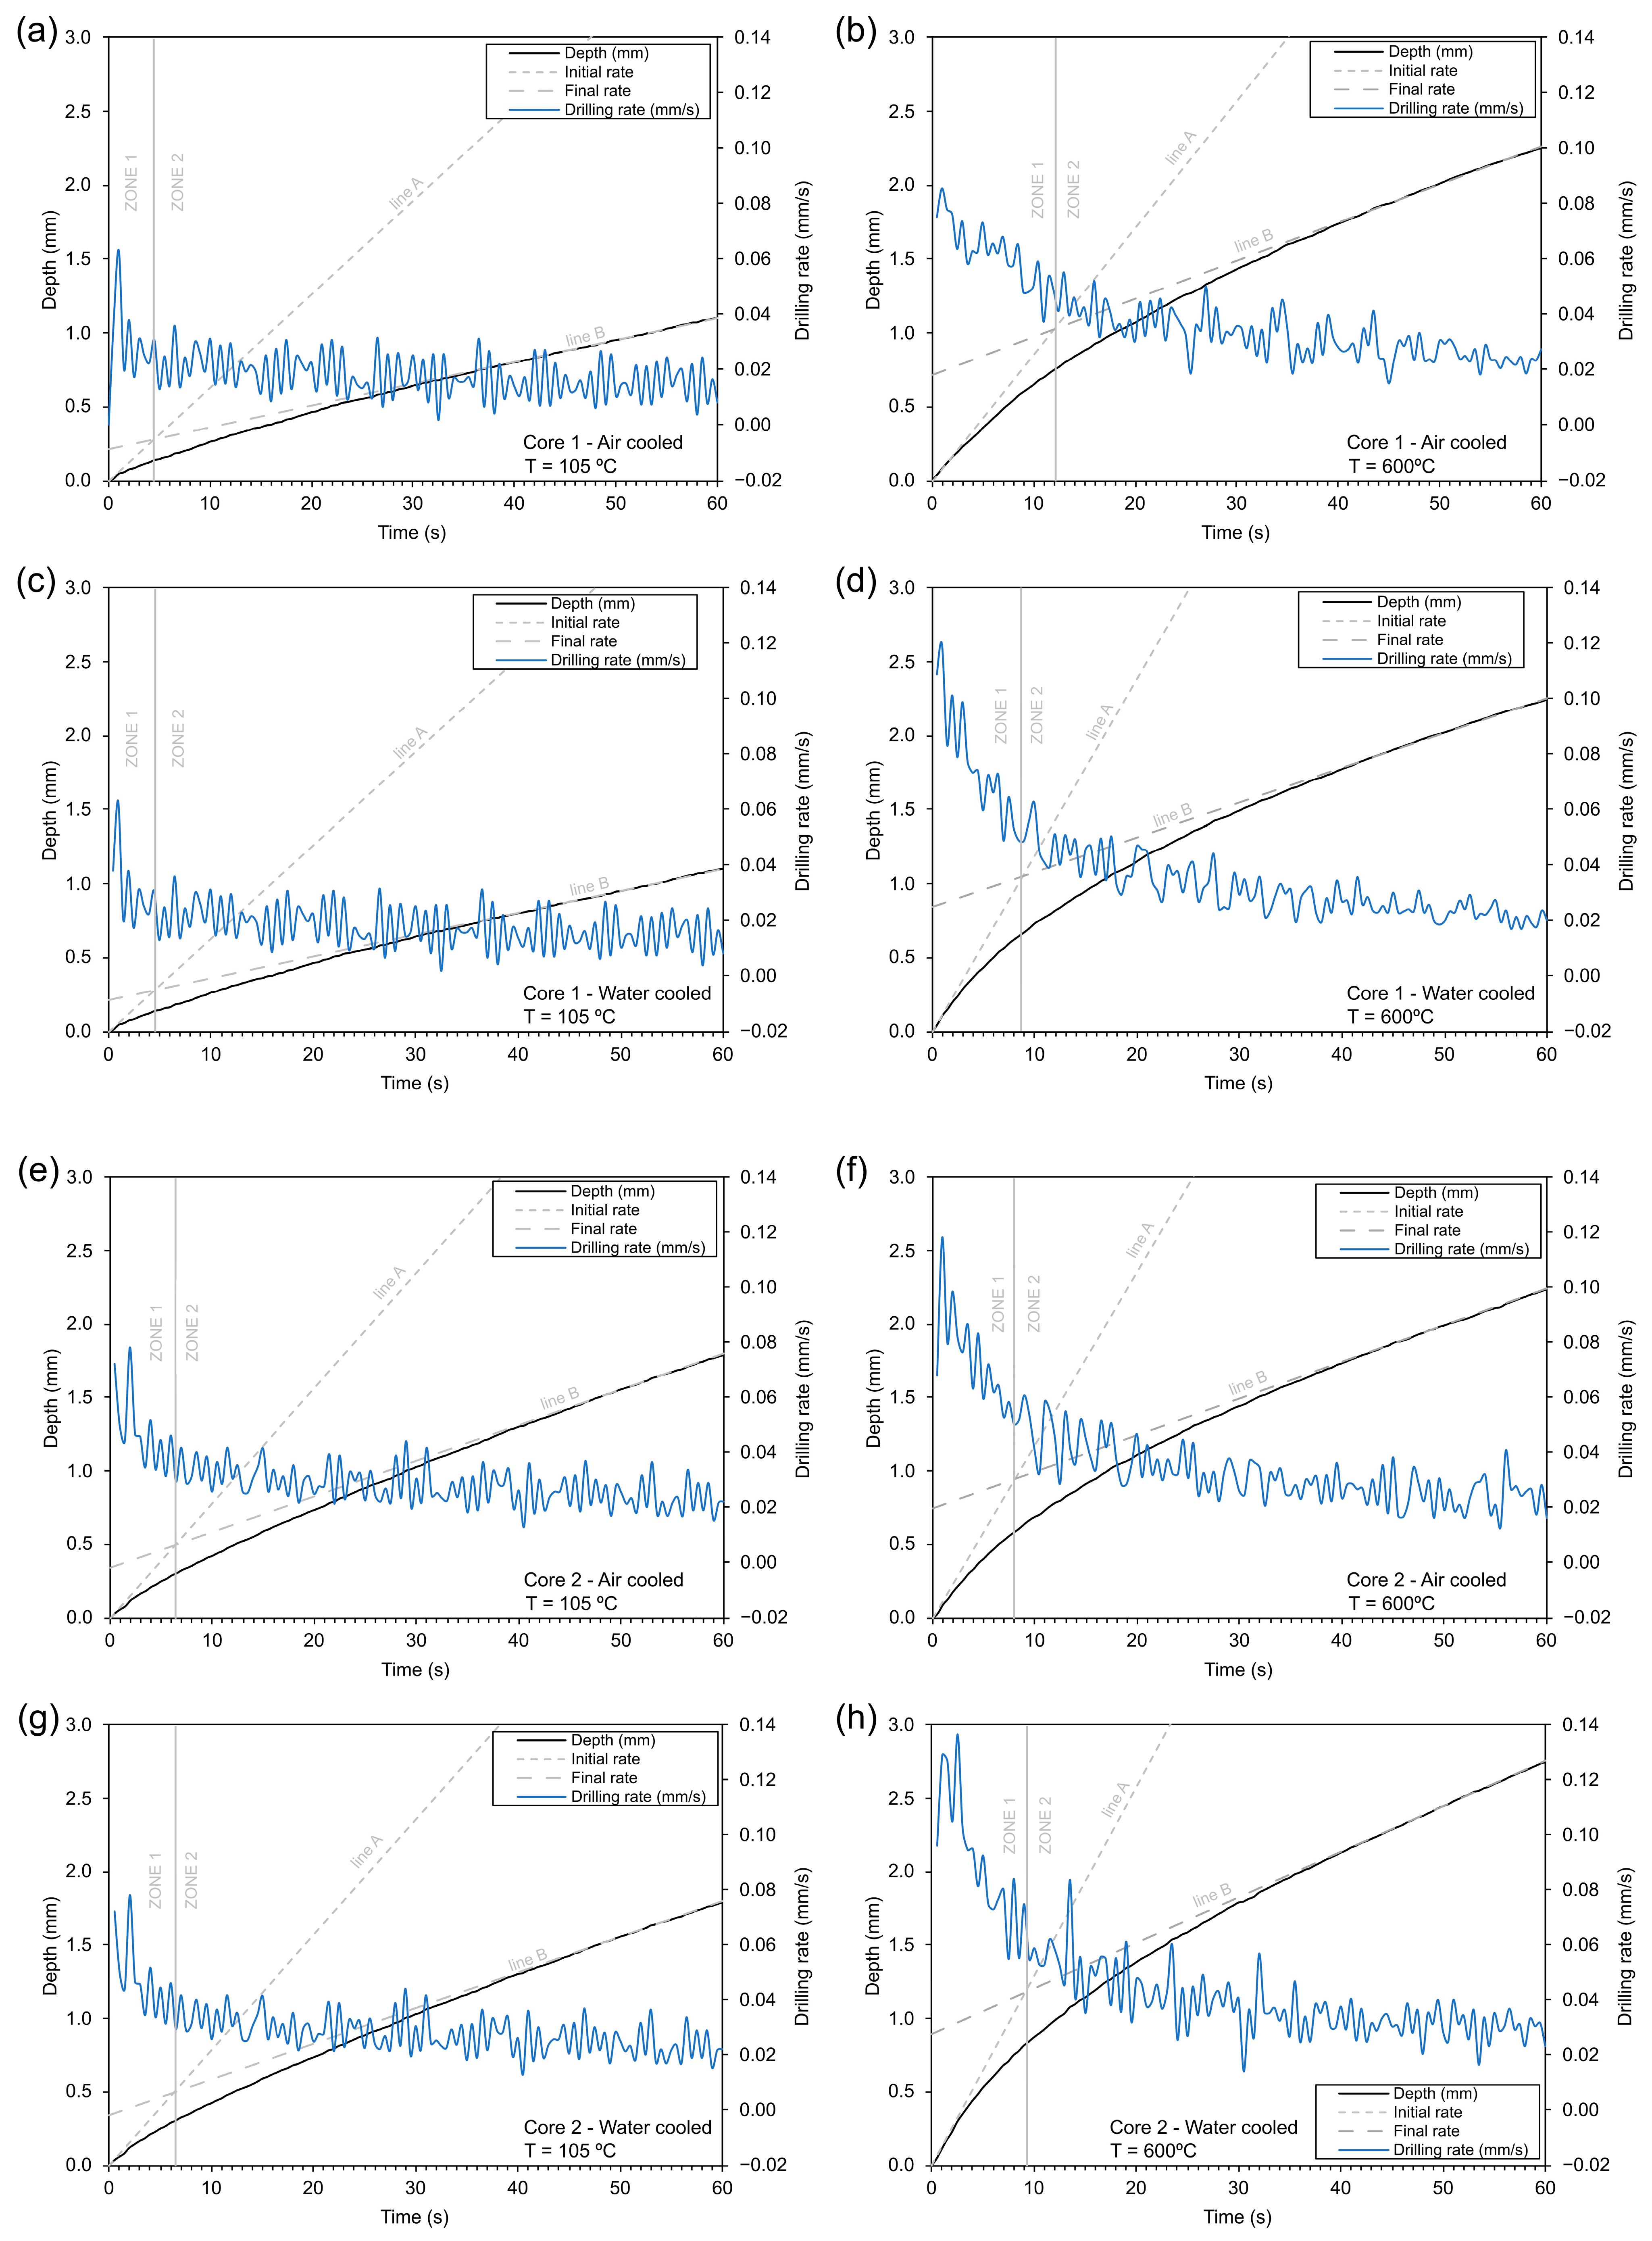
It is necessary to devise a calculation method to correctly delimit Zones 1 and 2 from the depth–time curves depicted in
Figure 6. This research proposes a new procedure based on the two-step method of Dahl et al. [
20]. In the methodology proposed in this research, the tangent line for the steep part of the depth–time curves in Zone 1 (line A) was calculated as the line passing through the origin and having a slope whose value is the average penetration rate in the first 2 s (this allows correcting for erratic values occurring in the first seconds of drilling). The tangent line for the flatter part (line B) was calculated as the line passing through depth value at 50 s with a slope whose value coincides with the average drilling rate between 40 and 60 s.
Figure 9 represents the solutions for lines A and B and the intersection point delimiting Zones 1 and 2. Temperatures of 105 and 600 °C have been represented to appreciate the displacements of the boundaries between Zones 1 and 2 due to thermal effects.
A higher penetration rate in Zone 1 (
Figure 9) is attributed to two simultaneous factors: (i) the time it takes for the drill bit to adjust and settle into the rock surface and (ii) increased thermal damage to the surface of the thermally treated samples. A rapid penetration of the drill bit in the first seconds of the test, followed by stabilisation or a rapid decrease in drilling rate, was described in previous research and related to accelerated cutting edge wear [
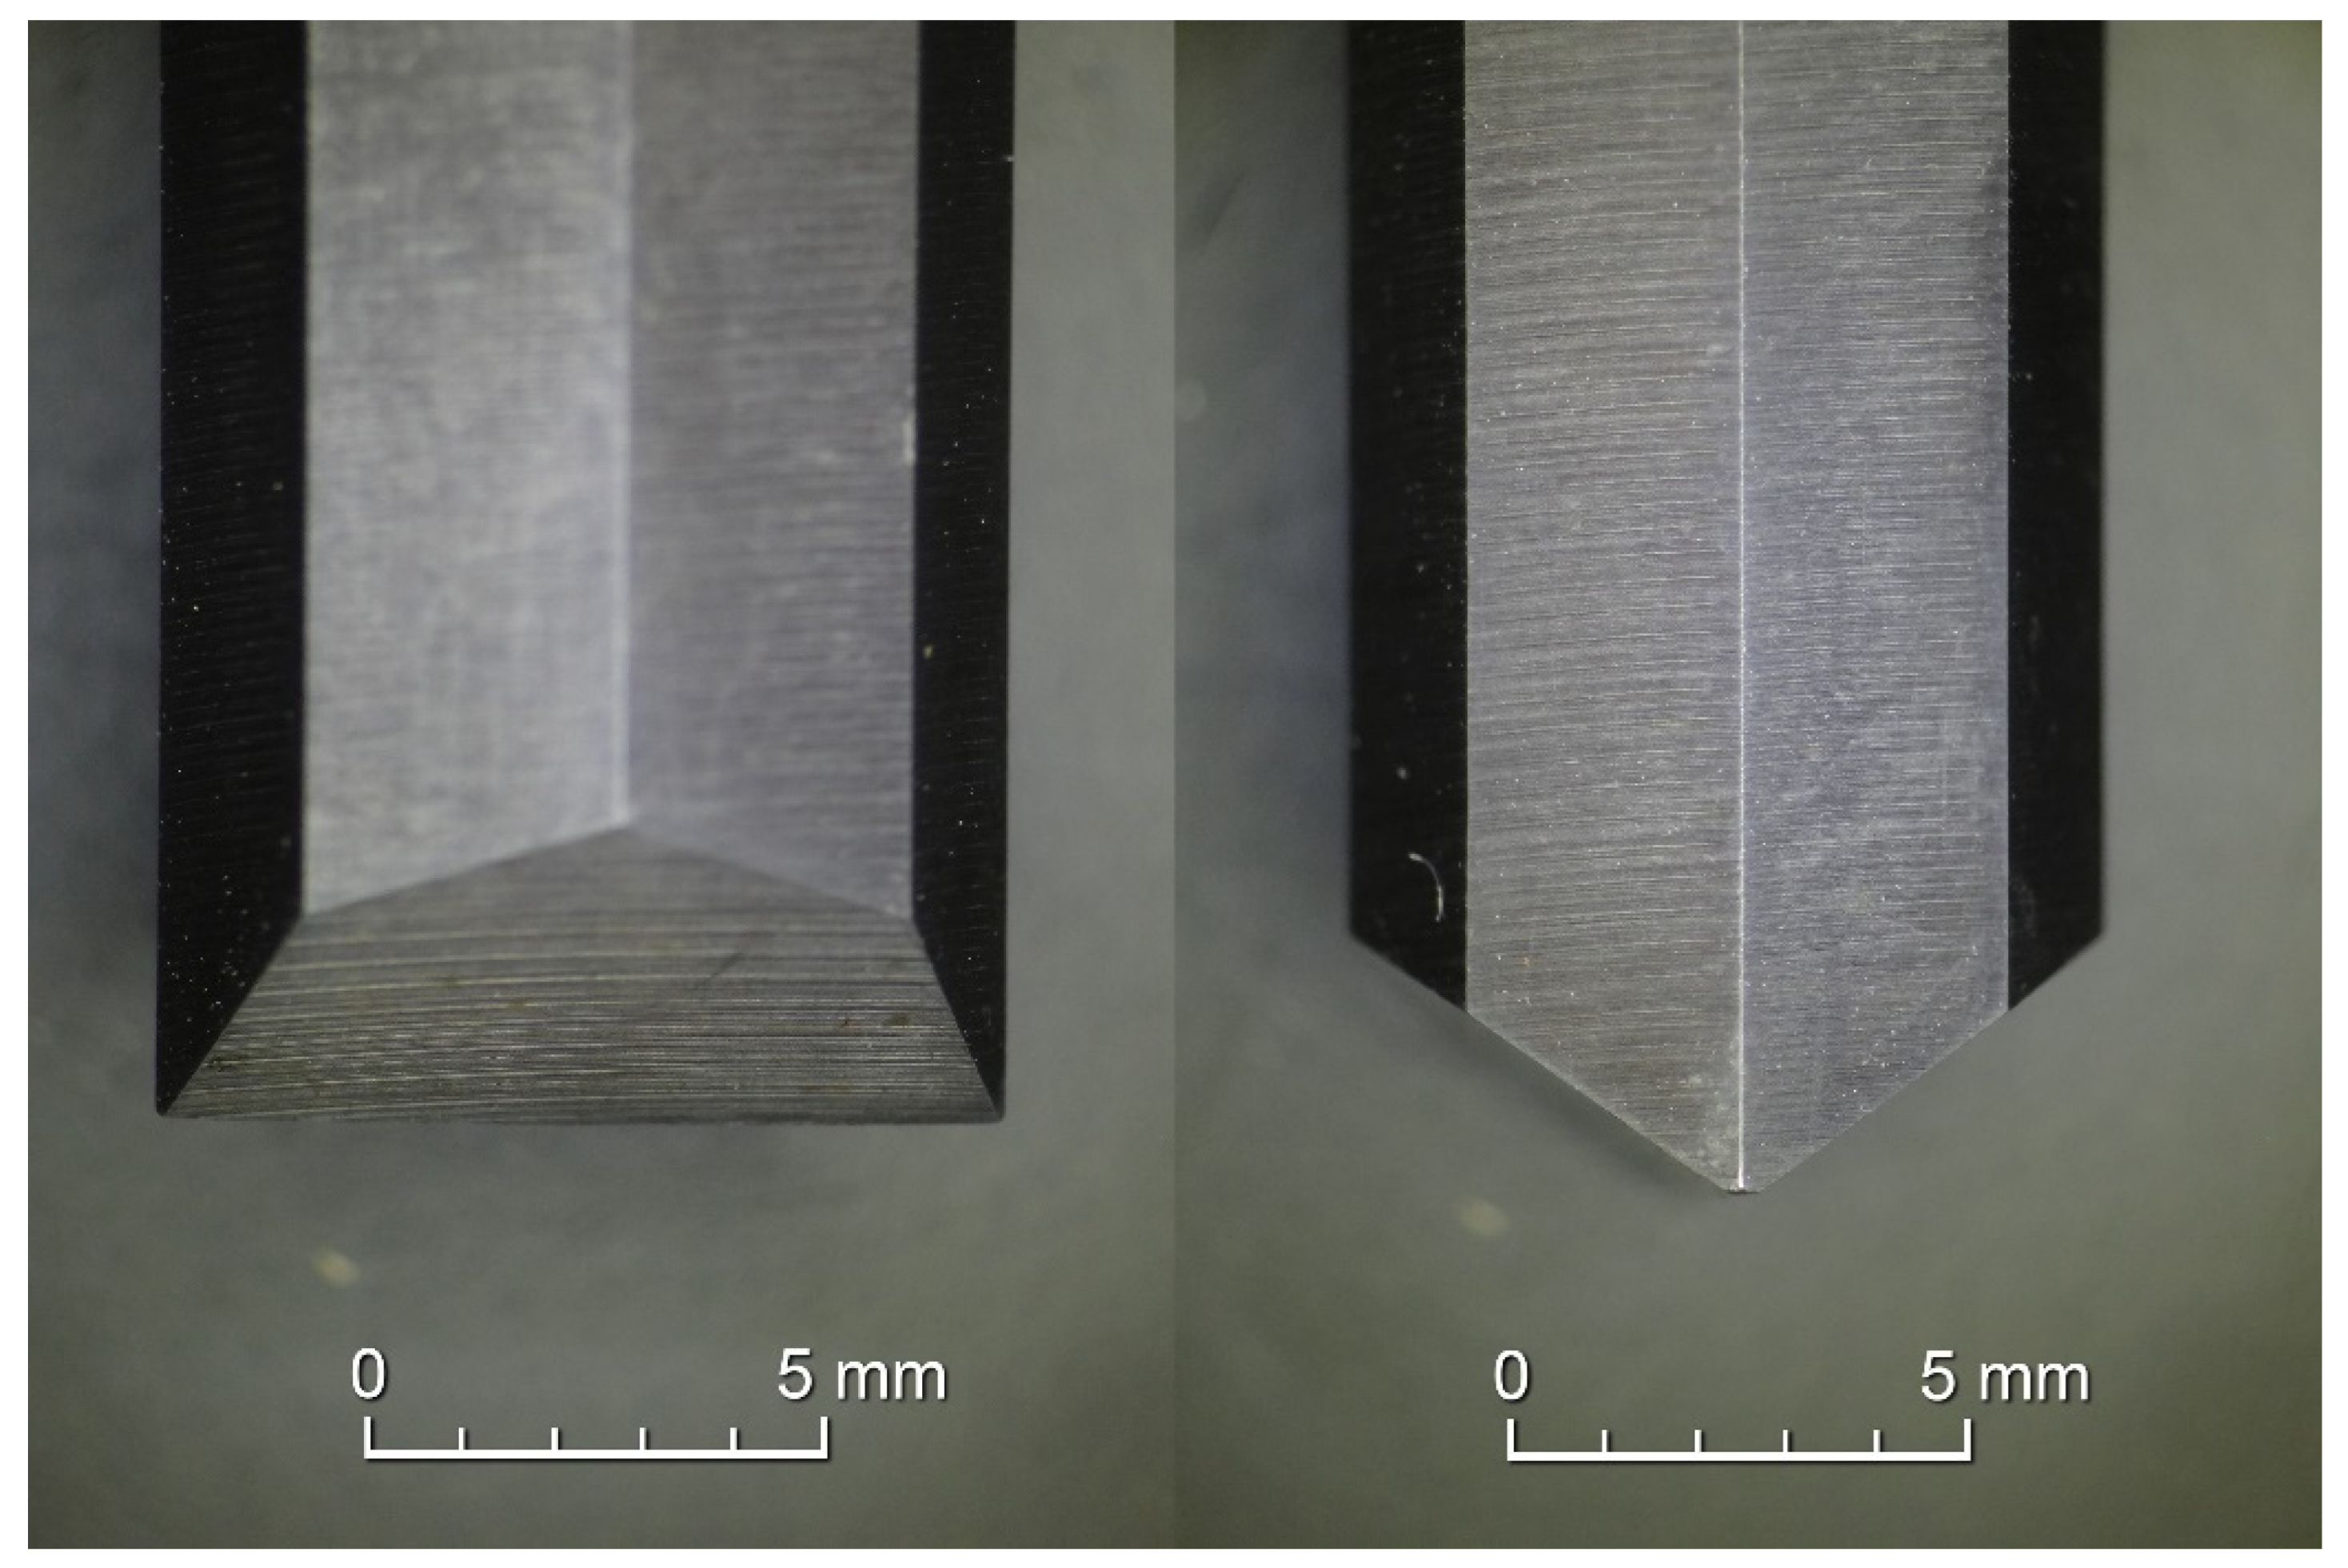
21]. Rocks with a significant quartzite content show a “breaking point” in the penetration–time curves, which is related to accelerated drill bit wear. However, this behaviour is not observed in Prada limestone because (i) Prada limestone is a rock with a low quartz content (<1%) according to previous research [
14], (ii) no breaking points could be identified in the drilling rate curves and (iii) the drill bit used in this research showed little or no signs of cutting edge wear (
Figure 10). In other cases, an initial peak is followed by a decrease in drilling rate due to the formation of a powder cushion that inhibits the action of the drill bit. However, this was not the case in the tests conducted in this research, where powder evacuation was facilitated by the continuous application of air to the drill hole.
All of the above could cause erroneous conclusions regarding the drillability of limestones. Once these first tenths of a millimetre section are overcome (Zone 1), the penetration rate tends to stabilise and seems to more realistically represent the drillability of the material (Zone 2). Therefore, a corrected SJ value (SJ*) should be proposed that excludes Zone 1 and gives more weight to Zone 2. The main characteristics of the new SJ* value are as follows: (i) it does not consider the depth achieved in Zone 1 (DZ1), and (ii) it adds a new depth value (DZ2) as a result of extending the test time of Zone 1 (TZ1) along the tangent line B defined in Zone 2. The sequence required to obtain the corrected SJ value (SJ*) is summarised below:
xA and yA are time (s) and depth (mm) from line A, respectively.
PA is the slope of line A.
y0 and y2 are depth values at x = 0 s and x = 2 s, respectively.
- 2.
Determine line B (Equation (2)), whose tangent is the average value of the penetration rate between 40 and 60 s and passes through the depth value in t = 50 s.
xB and yB are time (s) and depth (mm) from line B, respectively.
PB is the slope of line B.
y40, y50 and y60 are depth values at x = 40, 50 and 60 s, respectively.
- 3.
Analytically obtain the intersection of lines A and B (Equation (3)), which marks the boundary between Zones 1 and 2 at a new value called TZ1, corresponding to a depth value DZ1.
TZ1 and DZ1 correspond to x and y of the intersection point, respectively.
PA and PB correspond to the slopes of lines A and B, as defined in Equations (1) and (2).
y50 correspond to depth value at x = 50.
- 4.
Subtract from the final depth value of the test at t = 60 s (named DZ2) the value of DZ1 to correct the effect of drill bit accommodation and thermal damage at the rock surface.
- 5.
Calculate a new depth called Dext (Equation (4)), obtained by multiplying a time TZ1 by the slope of line B, thus ensuring that the total time to determine SJ* is 60 s.
- 6.
Finally, the corrected SJ value is obtained as in Equation (5):
where SJ* is expressed in tenths of a millimetre.
Removing Zone 1 (which presents the highest penetration rates) from the SJ* calculation involves the final SJ* values being lower than those initially determined for SJ. Reductions above 6–9% for temperatures of 105 and 300 °C and 17–21% for the highest temperature of 600 °C, in which maximum initial gradients exist, have been measured. The categorisation of drillability on the Dahl et al. [
27] scale is different for the new SJ* values, especially for the maximum temperature of 600 °C, for which in most of the tested samples, the category changes one class (i.e., from low to medium) for the resistance to drilling. The methodology proposed here to determine SJ* does not alter the key features of the rock’s drilling performance previously described in this research: a hardening of the material is evident at 300 °C, as well as a significant decrease in indentation resistance at 600 °C due to thermal damage. The final SJ* and original SJ values for all cores are depicted in
Table 1.
5. Conclusions
In this research, the authors study for the first time how thermal damage induced in Prada limestone affects penetration–time curves from Sievers’ J-miniature drill tests. To do so, samples were subjected to temperatures of 105, 300 and 600 °C and then cooled at fast or slow rates to observe differences. To explain the observed changes in the drillability of the material, the authors focused on the thermal damage in the rock, which was evaluated based on SEM, OP, US, TC and HLD tests. The following are the primary conclusions derived from this research:
High temperatures caused a hardening effect in the samples at 300 °C and a subsequent increase in microcracking and deterioration of the physicomechanical properties at 600 °C.
This research demonstrates in a novel way a direct relationship between the variation with temperature in Leeb surface hardness and drillability represented by SJ value: a hardening effect (and difficulty for drilling) at 300 °C and a dramatic decrease in surface hardness at 600 °C (and increase in drilling) due to appreciable thermal damage in the rock.
Depth–time curves from Sievers’ J-miniature drill tests exhibit two distinct regions in intact and thermally treated samples: a shallow Zone 1 characterised by rapid penetration and a deep Zone 2 where the penetration rate slows and becomes steadier.
A new analytical methodology to determine the extent of Zones 1 and 2 is proposed, based on the intersection of representative lines A and B that are tangent to depth–time curves in Zones 1 and 2, respectively.
The overall drilling rate in the rock (in both Zones 1 and 2) and the extent of Zone 1 increase at 600 °C due to thermal damage in the rock.
An initial peak in the drilling rate and the extent of Zone 1 is due to the time taken for the drill bit to adjust and accommodate itself in the rock surface and to more significant thermal damage in the surface of the thermally treated rock, so this Zone 1 is not considered as representative of the overall drillability.
Zone 2 seems to be more representative of the real drillability of the material, so a novel corrected SJ* value, which discards Zone 1 and gives more weight to Zone 2, is proposed.
The corrected SJ* values are lower than those initially determined for SJ, especially for the highest temperature of 600 °C, involving a change from low to medium resistance to drilling in the scale of Dahl et al. for Prada limestone.
The new evaluation of Sievers’ J-value (SJ*) proposed in this work confirms the main conclusions about the drilling performance observed in this research: a hardening at 300 °C and a straight increase in the drillability at 600 °C due to thermal damage.
The methodology presented in this research for determining a corrected SJ* value is intended to supplement the method for obtaining the SJ, whose contribution to determining DRI and its application in the choice of TBM is widely demonstrated in practice. The novel correction method proposed in this research represents an improved method for evaluating and forecasting drilling efficiency in limestone rocks, especially after being thermally damaged. This advancement offers enhanced capabilities for optimising economic and environmental considerations when planning drilling operations in underground construction and mining.
Future research should compare the SJ and SJ* values with on-site limestone drilling data such as Weight on Bit (WOB), Revolutions Per Minute (RPM), Drilling Rate of Penetration (ROP) and Torque (TRQ), where SJ* is expected to be the best predictor. Future research should also study the influence of in situ parameters of the drilling fluid. Once the correlations between SJ* and in situ drillability parameters are established, it will be possible to use SJ* to better adjust numerical models and specific software for drilling simulation. Finally, extending this research to a broader number of rock typologies will allow a better understanding of the proposed index.


 ,
, 


