Article

Visualization Monitoring of Industrial Detonator Automatic Assembly Line Based on Digital Twin

1
Hubei Engineering Research Center of Industrial Detonator Intelligent Assembly, Wuhan 430073, China
2
School of Mechanical Engineering and Automation, Wuhan Textile University, Wuhan 430073, China
*
Author to whom correspondence should be addressed.
Sustainability 2023, 15(9), 7690; https://doi.org/10.3390/su15097690
Submission received: 23 October 2022 / Revised: 18 January 2023 / Accepted: 24 February 2023 / Published: 8 May 2023
(This article belongs to the Special Issue Big-Data-Driven Sustainable Manufacturing)

Abstract

:
The continuous development of information technology has increased the level of automation and informatization in the manufacturing industry, which makes it necessary for companies to effectively monitor their assembly lines. Aiming to visualize the monitoring challenges of the assembly line production process, taking the industrial detonator automatic assembly line as the research object and referring to the digital twin five-dimensional model, a visualization monitoring method that utilizes an assembly line based on a digital twin is proposed. First, the architecture of the assembly line visualization monitoring system based on digital twin is constructed, and its specific operation flow is studied. Then, three key implementation methods, including assembly line virtual entity model construction, data collection in the assembly process and complex equipment error detection, are studied. Finally, a visualization monitoring system for the industrial detonator automatic assembly line is designed and developed, which verifies that the proposed method is effective in the visualization monitoring of the assembly line.

1. Introduction

With the rapid development of the new generation of information technologies, such as the Internet of Things, big data, cloud computing, artificial intelligence and 5G communication, the manufacturing industry is gradually undergoing a process of transformation towards automation, intelligence and informatization, and the economic benefits of manufacturing enterprises have been significantly improved. At the same time, as the number of workers decreases and the scale of production lines expands, companies urgently need to effectively monitor and control the status of production lines, so as to achieve the remote management of production lines. However, the traditional production line monitoring mode is mainly based on manual records and two-dimensional charts, etc., and lacks real-time and visual effects, which makes it difficult to realize the effective monitoring of the production process and fails to meet the supervision needs of enterprises.
At present, many experts and scholars have carried out much research on different issues regarding production line monitoring via the processing of workshop information with increasingly mature technologies. Sun et al. [1] used the mathematical model of the regulating valve to deal with the missing data and proposed to use MDRSN (modified deep residual shrinkage network) for regulating valve fault diagnosis, which improved its accuracy. A modeling method based on a multimodal time series was proposed in [2], in order to realize the real-time anomaly detection of the robot execution process. Liu et al. [3] studied the technical framework of the real-time monitoring and optimal control of a CNC machining production line based on big data, and elaborated the key technologies involved in it. A visual monitoring system for small and medium-sized automatic production lines was developed in [4], and has been applied in an enterprise. A hybrid process monitoring and fault diagnosis method, combining multiple methods, was proposed in [5] through extending the supervised learning-based LLEDA (local linear exponential discriminant analysis) method to unsupervised learning. Leng et al. [6] studied data specification, common service protocols, data labels, datasets and hybrid computing techniques, and proposed an overall solution for monitoring a big data analysis system. A process-based monitoring technology for complex product assembly workshops was proposed in [7], which realized the fine monitoring of complex product assembly workshop sites. An integrated model for the multi-objective monitoring of machining automatic production lines was constructed in [8], and it has been used in a gear machining automatic production line. The above studies are focused on state monitoring and fault diagnosis for different objects, but they all lack real-time synchronization and the faithful mapping of multi-physical, multi-scale and multi-disciplinary attributes in physical space.
With the support of new information technologies, digital twin technology can map physical entities with multi-physical, multi-scale and multi-disciplinary attributes in real time, ultimately realizing a two-way interaction between real and virtual space, which is a possible and effective way to solve the lack of visualization monitoring methods that was mentioned above. The concept of “twins” can be traced back to the Apollo program of NASA (National Aeronautics and Space Administration) in the 1960s [9]. Two identical space vehicles were fabricated in this program, one of which was left on Earth as a twin to reflect the status of the space vehicle on the mission in real time. In 2003, Professor Michael Grieves put forward the concept of “virtual digital representation equivalent to a physical product” in his product lifecycle management course at the University of Michigan [10]. It was defined as a digital replica of a specific device or set of devices that can abstractly represent a real device and can be used for testing under real or simulated conditions. This concept can be considered as a prototype of the digital twin. However, the concept did not attract much attention from scholars when it was first proposed because the related technology was not mature enough at that time. In recent years, due to the rapid development of cloud computing, the Internet of Things, big data, mobile Internet, artificial intelligence and other new information technologies, digital twin technology has gradually entered the public’s view. Tao et al. [11,12,13] took the lead in proposing the concept of a digital twin workshop, expounded the system composition, operation mechanism, characteristics, and key technologies of the digital twin workshop, and established a set of digital twin standard system architectures in order to provide a theoretical reference for realizing the interaction and integration between the physical world and the information world of manufacturing. Zhao et al. [14] analyzed the relationship between the digital twin workshop and 3D visual real-time monitoring, and proposed a multi-level 3D visual monitoring mode and a real-time data-driven virtual workshop operation mode. A 6D model of a 3D visualization interactive system of a digital twin workshop was proposed in [15]. The architecture of a digital twin system for the workshop production process was established in [16], which provides a technical solution for the realization of a digital twin system for the workshop production process. Ma et al. [17] studied the visual management and control system architecture of a production cell that was driven by a digital twin by analyzing the monitoring and management requirements of a production cell. A real-time visual monitoring method for the discrete manufacturing workshop, based on digital twin, was proposed in [18] by using an object-oriented approach. Wei et al. [19] proposed a digital twin workshop architecture and technical route based on real-time data driven, and developed a prototype system, which provides a key support for the application of digital twin technology in the field of intelligent manufacturing. Zhou et al. [20] proposed a 6D model of a workshop 3D visual monitoring system based on a digital twin, referring to the theoretical model of the digital twin, and developed a 3D visual monitoring system for a stamp production workshop.
To sum up, there are many achievements in the research of the production monitoring system and digital twin workshop, but the following deficiencies still exist.
The monitoring results are mostly presented in traditional numerical charts, which cannot directly describe the real-time status of the object, and it is difficult to give managers a reference for decision-making.
The lack of research on the visual monitoring methods of the production process in special fields such as the chemical industry, blasting and nuclear energy.
Most of the existing systems lack application services for the trajectory error detection of complex equipment on production lines, so the visual monitoring of the production process is not contributing enough.
In view of these problems, the main contents of this paper include the following: to propose a visualization monitoring method for the assembly line based on a digital twin; to analyze and explain its concrete system architecture and operation flow in detail; and to study three key implementation methods, including the assembly line virtual entity model construction, data collection in the assembly process and complex equipment error detection, and verify the effectiveness and feasibility of the proposed method.
The rest of this paper is organized as follows. Section 2 studies the overall architecture of the assembly line visualization monitoring system based on a digital twin, and Section 3 analyses the key implementation methods. Section 4 discusses the results of the assembly line visualization monitoring system. Section 5 summarizes the full text and gives the future research direction.

2. Assembly Line Visualization Monitoring System Based on Digital Twin

The digital twin system is an aggregate of physical entities, virtual scenarios and application service systems. Through the interaction of information and feedback between all its parts, it performs a multidisciplinary, multi-physical quantity, multi-scale and multi-probability simulation of the physical entities, and finally realizes the simulation, monitoring, control, diagnosis, prediction and optimization of the whole lifecycle of the physical entities. The low-maturity digital twin system [21] can use the twin model to reproduce the operational state and change process of physical entities in real time and indirectly control their operation process, so as to complete the real-time visualization monitoring of the target object. In this paper, referring to the five-dimensional model of the digital twin [22], the architecture of the assembly line visualization monitoring system, based on digital twin, is constructed by combining the characteristics and monitoring requirements of an industrial detonator automatic assembly line, as shown in Figure 1. The system architecture includes four parts: physical layer, virtual layer, simulation layer and application layer, which involves three key implementation methods: assembly line virtual entity model construction, data collection in the assembly process and complex equipment error detection.
(1)
Physical layer
In the digital twin visualization monitoring system, the physical layer is the basis for establishing the real-to-virtual faithful mapping mechanism and the execution terminal of the production plan, including assembly-related resources such as transfer equipment, bayonet equipment, transportation equipment, robotic arms, material, PLC, sensors, etc. The main function of this layer is to complete the entire assembly process, execute the control instructions of the application layer, as well as be responsible for the generation, collection and transmission of the basic data required for the system operation.
(2)
Virtual layer
The running state, dynamic behavior and assembly scenarios of the physical layer can be mapped through the virtual layer in real time, which is the core of the digital twin system. According to the composition of the physical layer and visual monitoring requirements, the virtual layer constructed in this paper contains a robot model, an equipment model, a product model, and an algorithm model, etc. Every model of a physical entity has geometrical, physical, behavioral, and rule properties. The algorithm model mainly performs the functions of equipment error detection, entity model driving, multi-source information analysis and equipment status display.
(3)
Simulation layer
The simulation layer is an integrated processing platform for all kinds of information during the operation of the visualization monitoring system. By establishing connections between the layers, multi-source heterogeneous data from the physical layer and virtual layer are uploaded to the simulation layer in real time and stored in the corresponding database. Meanwhile, the simulation layer filters, cleans, transforms, classifies, associates, integrates, mines, fuses and visualizes the large amounts of data received. Based on the processed data, the corresponding models in the model base are invoked to achieve the mapping physical space, offline simulation, error calculation and the optimization analysis of the assembly activities.
(4)
Application layer
The application layer is a user-oriented layer that can provide users with services such as error detection, state monitoring, historical data tracing and the remote operation and maintenance of assembly lines by encapsulating the data, rules and calculation results generated from the interaction of information between the physical layer, virtual layer and simulation layer.
The specific flow of the visual monitoring, based on the above system architecture, is shown in Figure 2; this includes four main steps: system initialization, verifying the program, and visualization monitoring and troubleshooting. When the visualization monitoring system, based on a digital twin, runs, first of all, it is necessary to initialize all the models and establish communication between all the layers; this provides the prerequisites for the virtual mapping of the physical space. Then, the assembly scheme is simulated to verify its reasonableness and ensure that the whole assembly process is safe and efficient. While the system is running, the basic data of the physical layer are collected and processed in real time, and all data are archived and visualized, so as to acquire the hidden knowledge of the data. Based on real-time data and virtual scenes, the synchronization mapping of the assembly line running state and the error detection of the complex equipment trajectory are realized. Thus, whether the assembly line and its visual monitoring system’s running state is normal can be quickly judged, and they can be stopped urgently in case of failure in order to avoid any possible harm caused by the failure. Once the fault is rectified, the running status of the assembly line continues to be monitored until the system is shut down.

3. Key Implementation Methods

According to the architecture and operation flow of the assembly line visualization monitoring system, based on a digital twin, this paper focuses on three key implementation methods: assembly line virtual entity model construction, data collection in the assembly process and complex equipment error detection.

3.1. Assembly Line Virtual Entity Model Construction

The virtual entity model of the assembly line is a high-fidelity replica of the physical layer in virtual space, which is the basis of realizing 3D virtual monitoring. For different types of assembly resources in the physical layer, this paper describes various models in the virtual layer from geometric, physical, behavioral, and rule perspectives, with reference to the visual monitoring requirements of the assembly line and the 4D model of the digital twin virtual entity [23], as shown in Equation (1).
M V E = { M G , M P , M B , M R }
where MG is the geometrical model, MP is the physical model, MB is the behavioral model, and MR is the rule model. Each model has the ability to map entities, the computational analysis and time-varying evolution, as well as its own different properties, as shown in Figure 3.
(1) Geometrical model M G
The geometrical model describes geometric parameters such as shape, size and location of the physical layer assembly resources, and the relationship between parts, which is defined as follows:
M G = { S h a p e , S i z e , L o c a t i o n , R e l a t i o n s h i p , }
where Shape represents the actual appearance and shape of the assembly resources, which can usually be defined by an envelope shape or the exact appearance parameters [24]. However, due to the requirements of the system’s visual monitoring service, the exact actual appearance parameters must be used; Size indicates the size of the assembly resources; Location indicates the relative spatial location of the assembly resources, including three coordinate axis parameters of the Cartesian coordinate system, which are usually fixed values; and Relationship indicates the assembly relationship between the components of an assembly resource. The geometrical model can be constructed with 3D modeling software (SolidWorks, PROE, AutoCAD, UG, etc.). The constructed geometrical model should meet the requirements of being light weight and having a small data volume as much as possible, so as to reduce the operation consumption of the system and improve the efficiency of the simulation of the virtual layer [25].
(2) Physical model M P
The physical model is constructed by adding relevant properties (material properties, weight, mechanical properties, etc.), constraints, features and other information regarding the physical entities, in order to describe the physical properties (mass, mechanical properties, etc.), vibration and impact of the assembly resources, which is defined as follows:
M P = { M a s s , M a t e r i a l , P e r f o r m a n c e , }
where Mass, Material and Performance denote the quality, material properties and mechanical properties of the assembly resources, respectively. The physical model can be described using the semantic modeling method of ontology [26] and can usually be simulated and analyzed by software such as ANSYS and Hypermesh.
(3) behavioral model M B
Based on the physical model, the behavioral model describes the dynamic behavior of the physical layer assembly resources under the combined influence of external perturbations, control commands and internal operating mechanisms [27], which is defined as follows:
M B = { O p e r a t i o n , E r r o r , D e g r a d a t i o n , }
where Operation, Error and Degradation represent the normal operation, error generation and performance degradation behaviors of the assembly resources, respectively. The behavioral model can be constructed by using the AutomationML [28] modeling method to accurately map the operation state and the behavior of the physical layer through real-time data in multi-source heterogeneous data, so as to realize the virtual–real synchronization of the monitoring system.
(4) Rule model M R
The rule model is defined as follows:
M R = { A c c u m u l a t i o n , J u d g m e n t , H a b i t , }
These include rules for the coordinate transformation of the assembly resource parts, rules for error formation and accumulation, rules for error reasonableness judgment, rules for error compensation, user operating habits, relevant field standards, etc. The rule model is described using the semantic modeling method of ontology, which can be iteratively optimized with the operation of the system, and then the virtual entity model is iteratively modified, so as to ensure the timeliness of the faithful mapping of virtual space to physical entities.

3.2. Data Collection in Assembly Process

The physical assembly line contains equipment such as transfer, bayonet, and transport, with different manufacturers, models, communication interfaces and protocols; the data generated in the assembly process are characterized by large quantities and multiple heterogeneous sources. In order to achieve the fast, comprehensive and accurate collection and integration of the assembly process data, a unified standardized data collection architecture and a comprehensive data integration management model need to be established. OPC UA (OLE for Process Control Unified Architecture) [29] supports cross-platform and cross-protocol communication with fast and stable data transmission, which is ideal for collecting multi-source heterogeneous data. Therefore, to solve the problem of assembly process data collection and information interaction between the layers of the visual monitoring system, an OPC UA-based assembly process data collection architecture is constructed in this paper, as shown in Figure 4.
The data collection architecture in this paper utilizes the client/server mode [30]. The OPC UA server is placed at the assembly site, and connects with sensors, PLCs, controllers, and document libraries of the physical layer through the data bus in order to obtain multi-source heterogeneous data and text files in the physical layer in real time, and realize the collection of basic data in the assembly process. After standardized processing, the data and text files obtained by the OPC UA servers are transmitted to the OPC UA clients via a data bus. The virtual scenes and error detection models in the virtual layer act as clients to receive standardized data in real time, which drive the generation of services; this includes the mapping of the physical space, three-dimensional monitoring and off-line simulation. Accordingly, user control commands and optimization results from the application layer can also be sent down to the assembly site through the simulation layer for controlling the assembly activities remotely and intelligently.
Since the information interaction between the physical devices in the physical layer and the OPC UA servers is simultaneous, real-time data from different devices need to be classified and integrated for collecting data quickly and accurately, and improving the mapping efficiency of virtual scenes. Therefore, in this paper, a data integration management model is constructed for the assembly process, as shown in Figure 5. The basic data generated by the whole physical layer consist of static data, such as attribute parameters, design parameters, and knowledge data, and dynamic data, such as state data, operation data, and environment data. The basic data are collected categorically and integrated into the simulation layer, and through a series of operations and data processing, it derives the statistical data; these include progress data, error data, and historical data. The collection of basic data and the derivation of statistical data together provide the necessary data support for the operation of the visual monitoring system.

3.3. Complex Equipment Error Detection

Complex equipment in assembly lines is often responsible for the assembly or transportation of important parts, and the accumulation of errors in their end effectors has the greatest impact on the quality of product assembly. Therefore, in order to improve the quality of product assembly and the safety of assembly activities, a complex equipment end effector trajectory error detection method is proposed in this paper; this combines vector similarity [31] with a six-joint tandem-type robot as an example.
The traditional method of vector similarity evaluation, based on cosine similarity, is used to evaluate the similarity between two vectors quantitatively by calculating the cosine value of the angle between them. Suppose that there are curve tangent vectors,   A = ( A 1 , A 2 , A 3 , , A n ) and   B = ( B 1 , B 2 , B 3 , B n ) , their corresponding normalized vectors are A = ( A 1 , A 2 , A 3 , , A n ) and B = ( B 1 , B 2 , B 3 , , B n ) , respectively, where the vector dimension n is a positive integer. Then, the cosine similarity between A and B can be calculated by Equation (6).
cos ( A , B ) = A · B | | A | | × | | B | | = i = 1 n A i × B i i = 1 n ( A i ) 2 × i = 1 n ( B i ) 2
cos ( A , B ) monotonically decreases in ( 0 , π 2 ) and takes values in the range of [ 0 , 1 ] . The value of cos ( A , B ) of tow vectors with a larger angle is smaller, which shows that the similarity of both is lower. The value of cos ( A , B ) of tow vectors with a smaller angle is larger, which shows that the similarity of both is higher. The cosine similarity can effectively evaluate the similarity degree of two vectors in a direction, but cannot represent the similarity of their modulus length. In response to this problem, Qiao et al. proposed the definition of the cotangent similarity [31], in order to improve the accuracy of the vector similarity calculation. The specific formula for one kind of cotangent similarity is as follows:
cot ( A , B ) = cot ( π 4 π 4 × max | A i B i | )
where A i , B i [ 0 , 1 ] ,i is an integer between [1,n]. Compared with cos ( A , B ) , the numerical differences between the various dimensions of the vectors are also considered in cot ( A , B ) ; this is able to evaluate the similarity between the vectors comprehensively from the perspective of both the direction and modulus length, and has higher computational accuracy.
In order to better reflect the magnitude and variation trend in the end effector trajectory error, the concept of an error coefficient based on the cotangent similarity is proposed in this method in order to further realize the real-time feedback compensation for the end effector trajectory errors. Let the tangent vectors of the desired and actual trajectory curves of the end effector in moment t be D = ( Δ f D , Δ t ) and R = ( Δ f R , Δ t ) , respectively. Δ t is a very small time variable. Δ f D and Δ f R are the changes in the two curves in the moment Δ t . Normalizing the vectors D and R yields D = ( Δ f D , Δ t ) , R = ( Δ f R , Δ t ) ; then, the proposed error coefficient can be calculated by using the following equations.
E = μ 1 E a + μ 2 E c
E a = | Δ f f D ( t ) | = | f D ( t ) f R ( t ) f D ( t ) |
E c = cot ( π 4 π 4 × | Δ f D Δ f R | )
where E is the error coefficient, and f D ( t ) and f R ( t ) represent the function values of the desired curve and the actual curve at time t, respectively. Numerical error E a is the ratio of the difference in the function value between the desired curve and the actual curve Δ f , and the desired curve function value f D ( t ) at time t, reflecting the magnitude of the trajectory errors. Direction error E c is the cotangent value of the angle between the tangent vector of the desired curve and the tangent vector of the actual curve at time t, reflecting the changing trend in the trajectory errors. μ 1 and μ 2 are the weight coefficients, μ 1 + μ 2 = 1 . The value of the weight coefficients is related to the characteristics of the actual evaluation object [16]. Since E a is the main part of error control, 0.8 μ 1 1 is usually taken. The specific steps of the trajectory error detection method based on the error coefficient are as follows.
Receive real-time data from the database and classify it into desired data D d and actual data D r .
Calculate the numerical error E a between D d and D r at the current moment according to Equation (9).
Plot the desired curve and the actual curve, and calculate the directional error E c between the two curves at the current moment according to Equation (10).
Calculate the error coefficient E at the current moment according to Equation (8).
Visualize E a , E c and E at the current moment to the users in real time.
Repeat the above steps until the error detection service is closed.
The specific workflow of the robot end effector trajectory error detection service, based on the above method, is shown in Figure 6. When the visual monitoring system provides error detection services to users, firstly, the various data generated by the robot are collected through external sensors; these are called operation data. At the same time, the various control data that are embedded in the robot control instructions or programs are extracted; these are called command data. The above two kinds of data are cleaned, transformed, associated, integrated, mined and fused, and the processed data are transmitted to the database and the virtual model of the robot, respectively. The virtual model of the robot is driven by the data to map and simulate the behavior of the physical entity in real time, and the simulation data generated from it are also transmitted to the database. Then, using the fused data in the database, the robot operation status is detected in real time through the error detection model in order to judge whether the actual trajectory error of the robot is reasonable. When the result is unreasonable, the feedback control of the robot is realized in the form of returning the control instructions through the error compensation model. All results will be recorded and visualized for the human–machine interaction and post-maintenance of the device. The last step is to enter the next detecting cycle and repeat the above operation.

4. Case Study

4.1. Case Description

Industrial detonators are special commodities with flammable and explosive properties, which are widely used in mining, railroads, water conservancy projects, infrastructure construction and other national economic fields. The special characteristics of these products lead to their production process needing to meet the following requirements: ① explosion-proof, ② sealing and dustproof, ③ safety. Hence, the production process should be strictly monitored to make each work station foolproof. In this case, a digital twin is necessary to effectively utilize the collected data and available knowledge in order to monitor the station production status, the equipment errors, and the progress of the production process.
The ignition element head, gunpowder and industrial base detonator are the three main components of an industrial detonator. As shown in Figure 7, an industrial detonator automatic assembly line is mainly composed of a laser coding unit, a compressing middle unit, a welding unit, a compressing top unit, and a transportation unit, which is characterized by high product quality requirements, a complex assembly process and a high accident rate, etc. In compressing the middle unit and compressing the top unit, station status monitoring is necessary in order to prevent safety accidents. In the laser coding unit and the welding unit, the monitoring of the equipment errors is significant in order to improve production efficiency and the product qualification rate. To demonstrate the applicability of the proposed architecture, four monitoring requirements of station real-time action, equipment parameters, equipment errors and production progress are considered in this paper.

4.2. Implementation

Based on the requirements of industrial detonator automatic assembly and the architecture proposed in Section 2, we designed and developed a visualization monitoring system for the industrial detonator assembly line. Its operating interface is shown in Figure 8. The virtual layer of this system was constructed by using SolidWorks, Unity3d, PiXYZ and other software. The real system’s sensors are based on OPC UA for data acquisition. The real-time data of the real system operation process are stored in the database through the processing of MTConnect client data. The C# code and driving functions of the virtual system call the database to complete the data interaction of the assembly process in the physical and virtual spaces. Equipment errors are calculated by the error detection algorithm in the application layer, based on the real-time data in the database. The calculation results are also called by the C# code in the virtual layer for the detection of equipment errors.

4.3. Results and Discussion

On the premise of the virtual mapping of the production activities of the physical assembly line, combined with the application layer in Figure 1, the application services of this prototype system are developed in this paper.
(1) Station status monitoring
The real-time action of each station can be monitored in multiple views, as shown in Figure 9. Multi-view monitoring includes the front view, back view, top view and first-person roaming view. By switching between different views or adjusting the orientation of the view, the omnidirectional visual monitoring of the assembly line production process can be realized. With the faithful mapping of the virtual system, users can detect abnormal movements in the stations in the real system in real time, and correct the errors through PLC.
(2) Equipment parameter monitoring
Figure 10 illustrates the parameters of a piece of equipment in the industrial detonator automatic assembly line. This service can display the static attribute parameter information and dynamic operation state information of each equipment, and the interface can be hidden or displayed by means of a human–machine interaction. Once the calculated error exceeds the set threshold for a long time, users will receive an alarm from the virtual system in order to realize the timely repair or replacement of the equipment.
(3) Equipment error monitoring
Figure 11 shows the results of the position error monitoring in the X, Y and Z directions of the robot end effector. In Figure 11, the blue and red lines represent the desired and actual trajectories of the effector, respectively. This service records the historical data of equipment errors and describes the trend in the equipment errors.
(4) Production progress monitoring
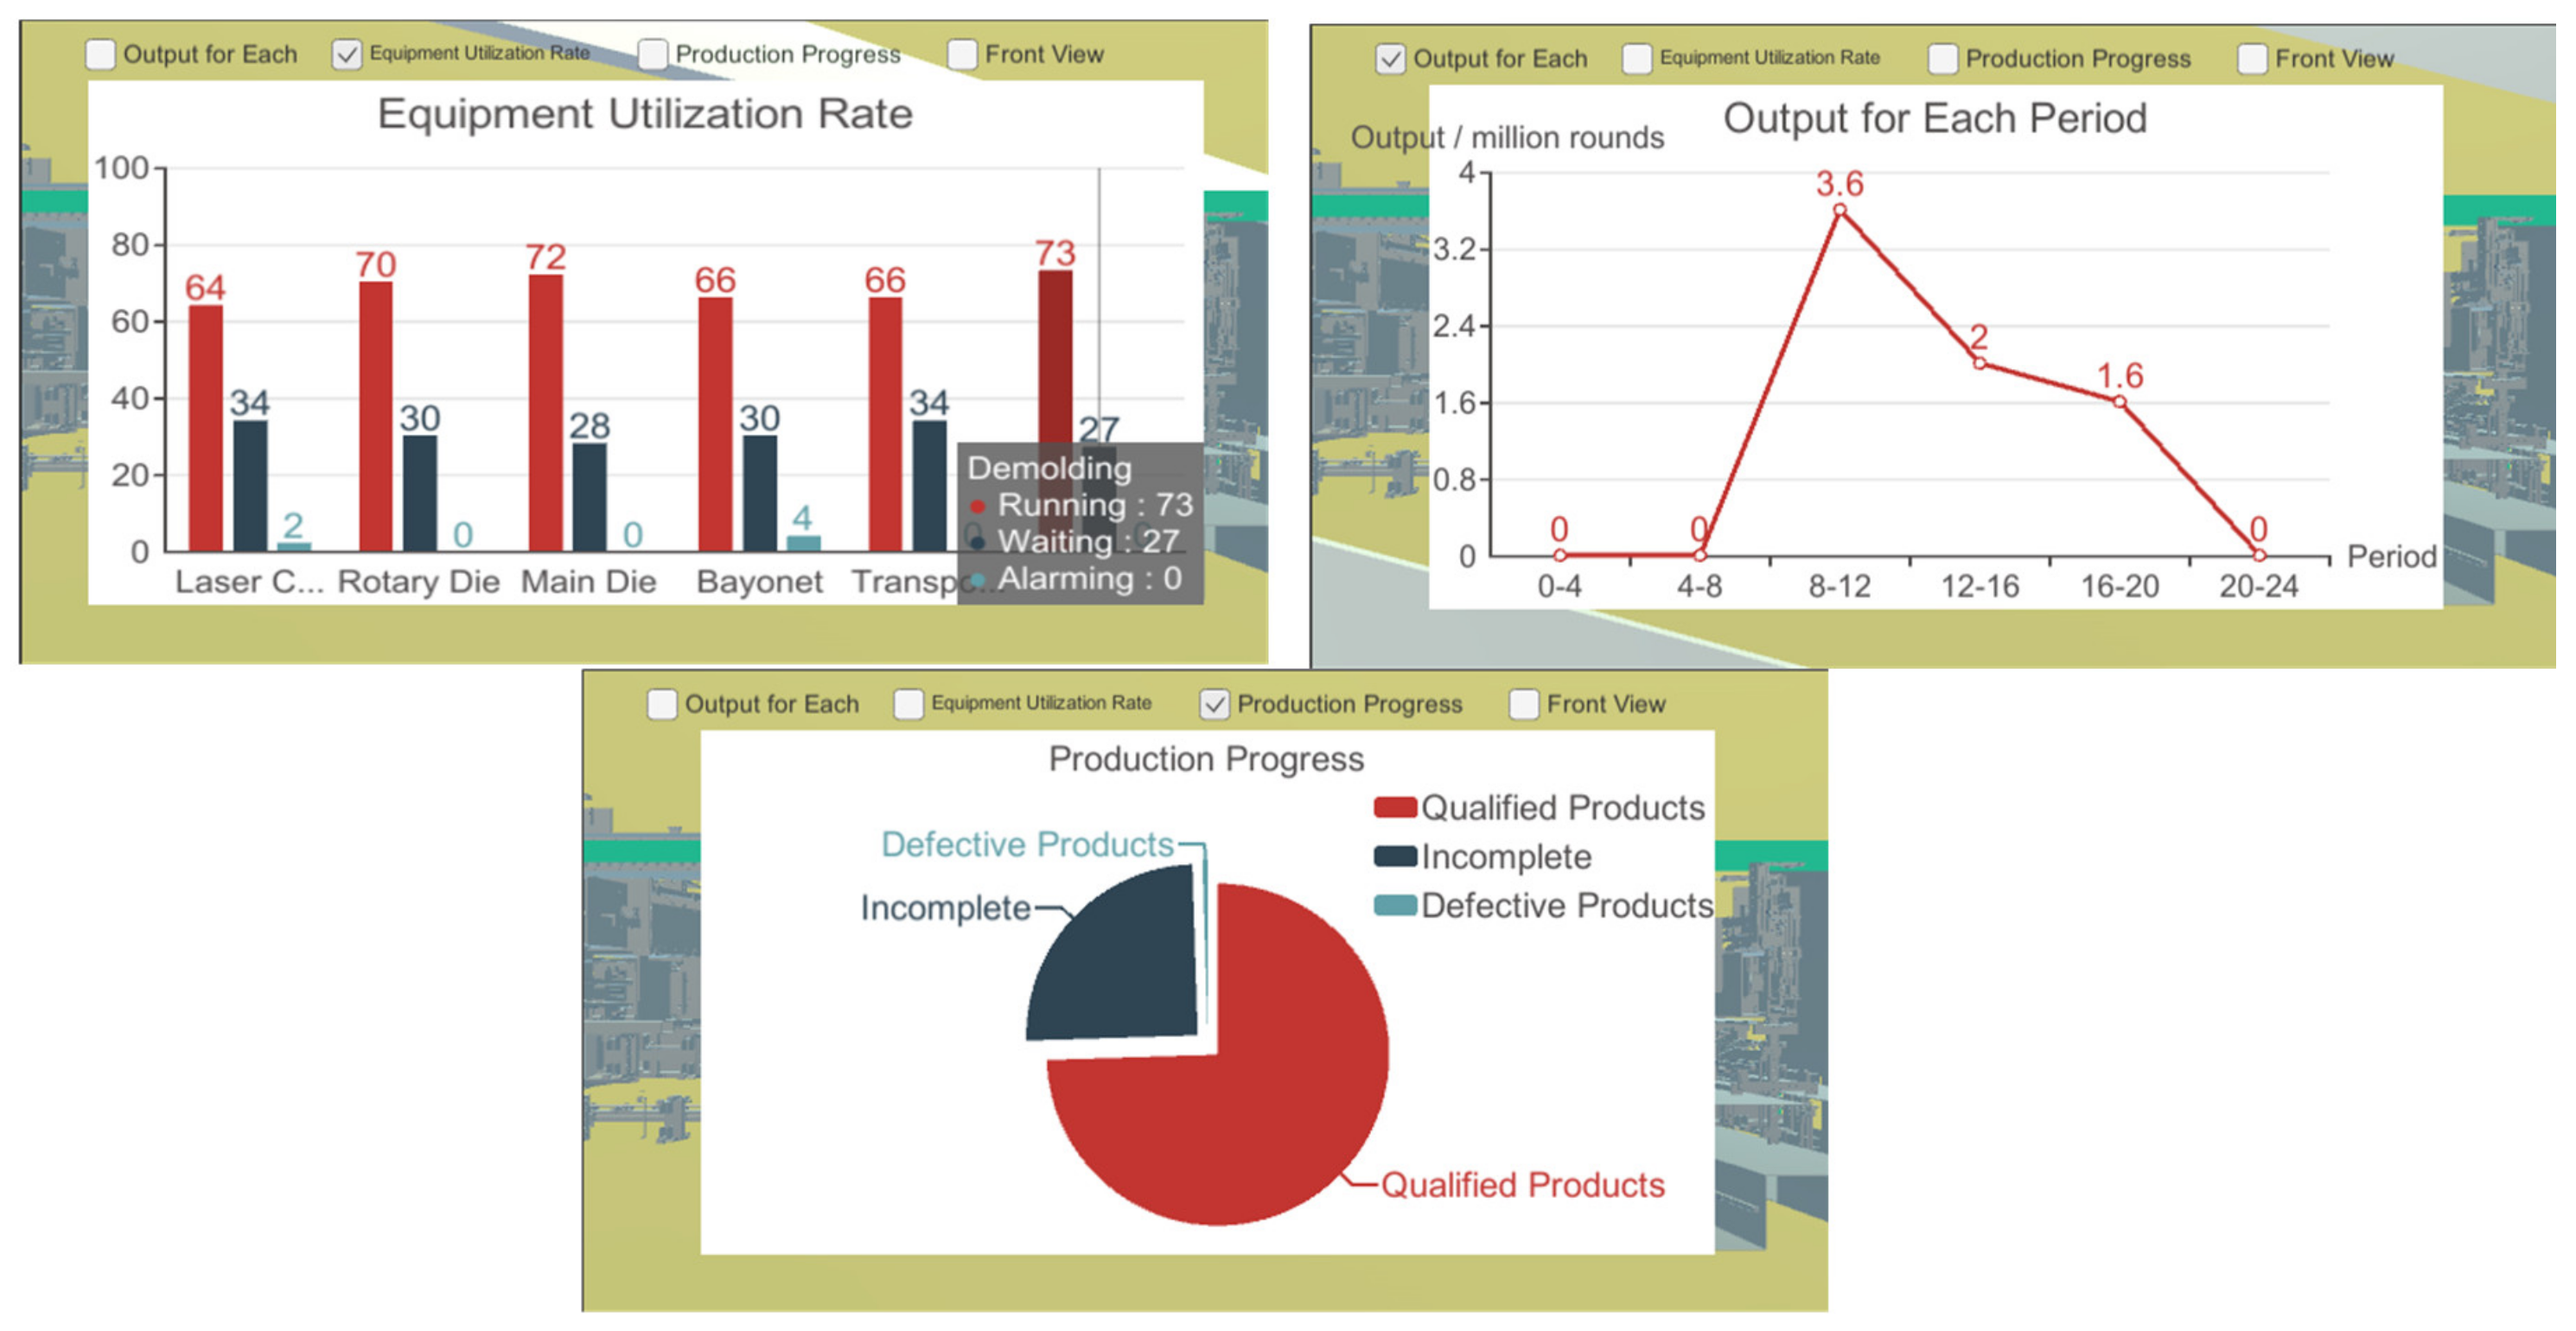
As shown in Figure 12, various data on the assembly line are recorded, which includes production progress, equipment utilization rate, output for each period, etc. Through this service, users can intuitively know related information regarding the economic benefits of production lines, which is conducive to the resource scheduling and energy consumption control of production lines.
Through the development and application of this prototype system, the virtual mapping of the production activities of the assembly line and the effective monitoring of the production process are basically realized, which effectively improves the control level and safety factor of the assembly line. The real-time data-driven virtual system maps the real system with a time delay of less than 3 s. The virtual system is 90% consistent with the real system. The failure rate of products is reduced to 0.05%. The efficiency of querying information related to the production progress of the assembly line has been greatly improved. The proposed architecture is proven to be applicable and effective.

5. Conclusions

In order to enhance intelligent manufacturing, digital twin-based application services represent key technology solutions. Digital twin technology has a great potential for application in intelligent product assembly. Using the industrial detonator automatic assembly line as the research object, a kind of assembly line visualization monitoring method, driven by a digital twin, is proposed in this paper in order to resolve the visualization monitoring challenges that are evident in the production process. The system architecture of this method is constructed and its three key implementation methods, including the assembly line virtual entity model construction, data collection in the assembly process and complex equipment error detection, are studied. Moreover, a visual monitoring prototype system is designed and developed in order to verify the feasibility and effectiveness of the method proposed in this paper, and to explore the initial application of digital twin technology in the field of production monitoring. The application of the proposed architecture effectively improves the control level and safety factor of the assembly line, and reduces the failure rate of products.
However, this research still has limitations that need to be further studied. The construction of a true digital twin requires the integration of multidisciplinary expertise and breakthroughs in multi-field-related technologies. The challenges include the construction of the twin model, virtual–real space communication, the twin model synchronization update, and virtual system service development. Subsequent research will combine big data analysis and machine learning, etc., to analyze and mine twin data, and gradually realize the intelligent decision control of the assembly process and the predictive maintenance of complex equipment.

Author Contributions

Conceptualization, H.L. and Y.Y.; Methodology, Y.Y.; Software, C.Z. (Chi Zhang); Validation, C.Z. (Chengjun Zhang); Formal Analysis, Y.Y. and W.C.; Investigation, H.L.; Resource, C.Z. (Chengjun Zhang); Data Curation, H.L. and W.C.; Writing—Original Draft, H.L. and Y.Y.; Writing—Review and Editing, H.L. and C.Z. (Chi Zhang); Visualization, C.Z. (Chengjun Zhang); Supervision, W.C.; Project Administration, H.L.; Funding Acquisition, H.L. All authors have read and agreed to the published version of the manuscript.

Funding

This work was supported by Key Laboratory of Metallurgical Equipment and Control Technology, Ministry of Education, Wuhan University of Science and Technology (Project ID: MECO2022B05); Scientific research project of Hubei Provincial Department of Education (Project ID: B2020077).

Institutional Review Board Statement

Not applicable.

Informed Consent Statement

Not applicable.

Data Availability Statement

Not applicable.

Conflicts of Interest

The authors declare that they have no known competing financial interests or personal relationships that could have appeared to influence the work reported in this paper.

References

  1. Sun, F.; Xu, H.; Zhao, Y.H.; Zhang, Y.D. Data-driven fault diagnosis of control valve with missing data based on modeling and deep residual shrinkage network. J. Zhejiang Univ. Sci. A 2022, 23, 303–313. [Google Scholar] [CrossRef]
  2. Wu, H.M.; Zhang, G.Y.; Guan, Y.S.; Juan, R. Multimodal time series modeling-based robot safety surveillance. J. Harbin Inst. Technol. 2020, 52, 126–132. [Google Scholar]
  3. Liu, J.K.; Hao, S.H.; Wang, S.H.; Fu, H.Y. Data driven technical framework of real-time monitoring and control optimization for CNC machining production line. J. Comput. Integr. Manuf. Syst. 2019, 25, 1875–1884. [Google Scholar]
  4. Wei, D.H.; Wang, H.F.; Liu, L.Y. Visual monitoring system for small and medium-sized automatic production lines. J. China Mech. Eng. 2020, 31, 1351–1359. [Google Scholar]
  5. Chen, X.L.; Wang, R.X.; Wang, J.; Zhou, J.L. Industrial process monitoring and fault diagnosis based on hybrid discriminant analysis. J. Acta Autom. Sin. 2020, 46, 1600–1614. [Google Scholar]
  6. Leng, X.W.; Chen, G.P.; Jiang, Y.; Zhang, J.Q.; Cao, Y.F. Data specification and processing in Big-data analysis system for monitoring and operation of smart grid. J. Autom. Electr. Power Syst. 2018, 42, 169–176. [Google Scholar]
  7. Ye, J.H.; Liu, S.L.; Liu, J.H.; Weng, G. On-site monitoring technology of complex product assembly workshop based on process. J. Comput. Integr. Manuf. Syst. 2017, 23, 1469–1480. [Google Scholar]
  8. Chen, P.; Liu, F.; Ning, J.F. Integrated model for multi-objective monitoring on automatic machining line and its application. J. Comput. Integr. Manuf. Syst. 2017, 23, 473–481. [Google Scholar]
  9. Rosen, R.; Von Wichert, G.; Lo, G.; Bettenhausen, K.D. About the importance of autonomy and digital twins for the future of manufacturing. J. IFAPapers Line 2015, 48, 567–572. [Google Scholar] [CrossRef]
  10. Grieves, M. Digital Twin: Manufacturing Excellence through Virtual Factory Replication; Florida Institute of Technology: Melbourne, FL, USA, 2014. [Google Scholar]
  11. Tao, F.; Zhang, M.; Cheng, J.F.; Qi, Q.L. Digital twin workshop: A new paradigm for future workshop. J. Comput. Integr. Manuf. Syst. 2019, 25, 2405–2418. [Google Scholar]
  12. Tao, F.; Ma, X.; Hu, T.L.; Huang, Z.G.; Cheng, J.F.; Qi, Q.L.; Zhang, M.; Liu, W.R.; Zhang, H.; Wang, S.G.; et al. Research on digital twin standard system. J. Comput. Integr. Manuf. Syst. 2019, 25, 2405–2418. [Google Scholar]
  13. Tao, F.; Qi, Q. Make more digital twins. J. Nat. 2019, 573, 490–491. [Google Scholar] [CrossRef] [PubMed]
  14. Zhao, H.R.; Liu, J.H.; Xiong, H.; Zhuang, C.B.; Miao, T.; Liu, J.S.; Wang, B. 3D visualization real-time monitoring method for digital twin workshop. J. Comput. Integr. Manuf. Syst. 2019, 25, 1432–1443. [Google Scholar]
  15. Zhang, Q.L.; Yang, Z.W.; Duan, J.G.; Liu, Z.; Qin, J.Y. Three-dimensional visualization interactive system for digital twin workshop. J. Southeast Univ. 2021, 37, 137–152. [Google Scholar]
  16. Liu, L.Y.; Du, H.X.; Wang, H.F.; Liu, T.Y. Construction and application of digital twin system for production process in workshop. J. Comput. Integr. Manuf. Syst. 2019, 25, 1536–1545. [Google Scholar]
  17. Ma, J.; Wang, Y.C.; Zhao, M.; Jiang, Z.Q.; E, M.C.; Wang, Q. Visualization management and control methods of production cell based on digital twin. J. Comput. Integr. Manuf. Syst. 2021, 27, 1256–1268. [Google Scholar]
  18. Wu, P.X.; Guo, Y.; Huang, S.H.; Yang, N.J.; Xiong, W.J.; Guo, J.T. Visual real-time monitoring method for distance manufacturing workshop based on digital twin. J. Comput. Integr. Manuf. Syst. 2021, 27, 1605–1616. [Google Scholar]
  19. Wei, Y.X.; Guo, L.; Chen, L.X.; Zhang, H.Q.; Hu, X.T.; Zhou, H.Q.; Li, G. Research and implementation of digital twin workshop based on real-time data driven. J. Comput. Integr. Manuf. Syst. 2021, 27, 352–363. [Google Scholar]
  20. Zhou, C.; Sun, K.T.; Li, J.; Yu, C.G.; Ju, L.K. Workshop 3D visual monitoring system based on digital twin. J. Comput. Integr. Manuf. Syst. 2022, 28, 758–768. [Google Scholar]
  21. Tao, F.; Zhang, C.Y.; Qi, Q.L.; Zhang, H. Digital twin maturity model. J. Comput. Integr. Manuf. Syst. 2022, 28, 1267–1281. [Google Scholar]
  22. Tao, F.; Liu, W.R.; Zhang, M.; Hu, T.L.; Qi, Q.L.; Zhang, H.; Sui, F.Y.; Wang, T.; Xu, H.; Huang, Z.G.; et al. Five-dimension digital twin model and its ten applications. J. Comput. Integr. Manuf. Syst. 2019, 25, 1–18. [Google Scholar]
  23. Tao, F.; Zhang, H.; Qi, Q.L.; Xu, J.; Sun, Z.; Hu, T.L.; Liu, X.J.; Liu, T.Y.; Guan, J.T.; Chen, C.Y. Theory of digital twin modeling and its application. J. Comput. Integr. Manuf. Syst. 2021, 27, 1–15. [Google Scholar]
  24. Zhang, C.Y. Research on Reconfigurable Modeling of Industrial Robotic Digital Twin Manufacturing Systems. Master’s Thesis, Wuhan University of Technology, Wuhan, China, 2020. [Google Scholar]
  25. Li, L.B. Development of Production Measurement Process Monitoring System Based on Digital Twin. Master’s Thesis, Donghua University, Shanghai, China, 2022. [Google Scholar]
  26. Dai, S.; Zhao, G.; Yu, Y.; Zheng, P.; Bao, Q.W.; Wang, W. Ontology-based information modeling method for digital twin creation of as-fabricated machining parts. J. Robot. Comput.-Integr. Manuf. 2021, 72, 102173. [Google Scholar] [CrossRef]
  27. Liu, H.L.; Yue, P.; Xia, C.H.; Zhao, W.J. Discrete manufacturing workshop virtual entity behavioral model description method based on VDEVS. J. Comput. Integr. Manuf. Syst. 2021, 27, 2950–2960. [Google Scholar]
  28. Chou, X.L.; Zhu, R.; Xing, Y.; Hu, J.Y. Digital twin modeling technology for solenoid assembly production line. J. Comput. Integr. Manuf. Syst. 2022, 28, 1696–1703. [Google Scholar]
  29. Fan, J.W.; Yang, Y.; Pan, R.; Li, W.H. Development of remote monitoring system for CNC machine tools based on OPC UA. J. Mach. Tool Hydraul. 2022, 50, 44–48+54. [Google Scholar]
  30. Sun, Y.L.; Ma, W.M.; Zhang, C.; Song, Y.J.; Cui, J. Research on key technologies of digital twin-oriented intelligent production line monitoring system. J. Aeronaut. Manuf. Technol. 2021, 64, 58–65. [Google Scholar]
  31. Qiao, F.; Guan, L.E.; Wang, Q.L. A fast similarity calculation method based on cotangent similarity and BP neural network. J. Tongji Univ. (Nat. Sci.) 2021, 49, 153–162. [Google Scholar]
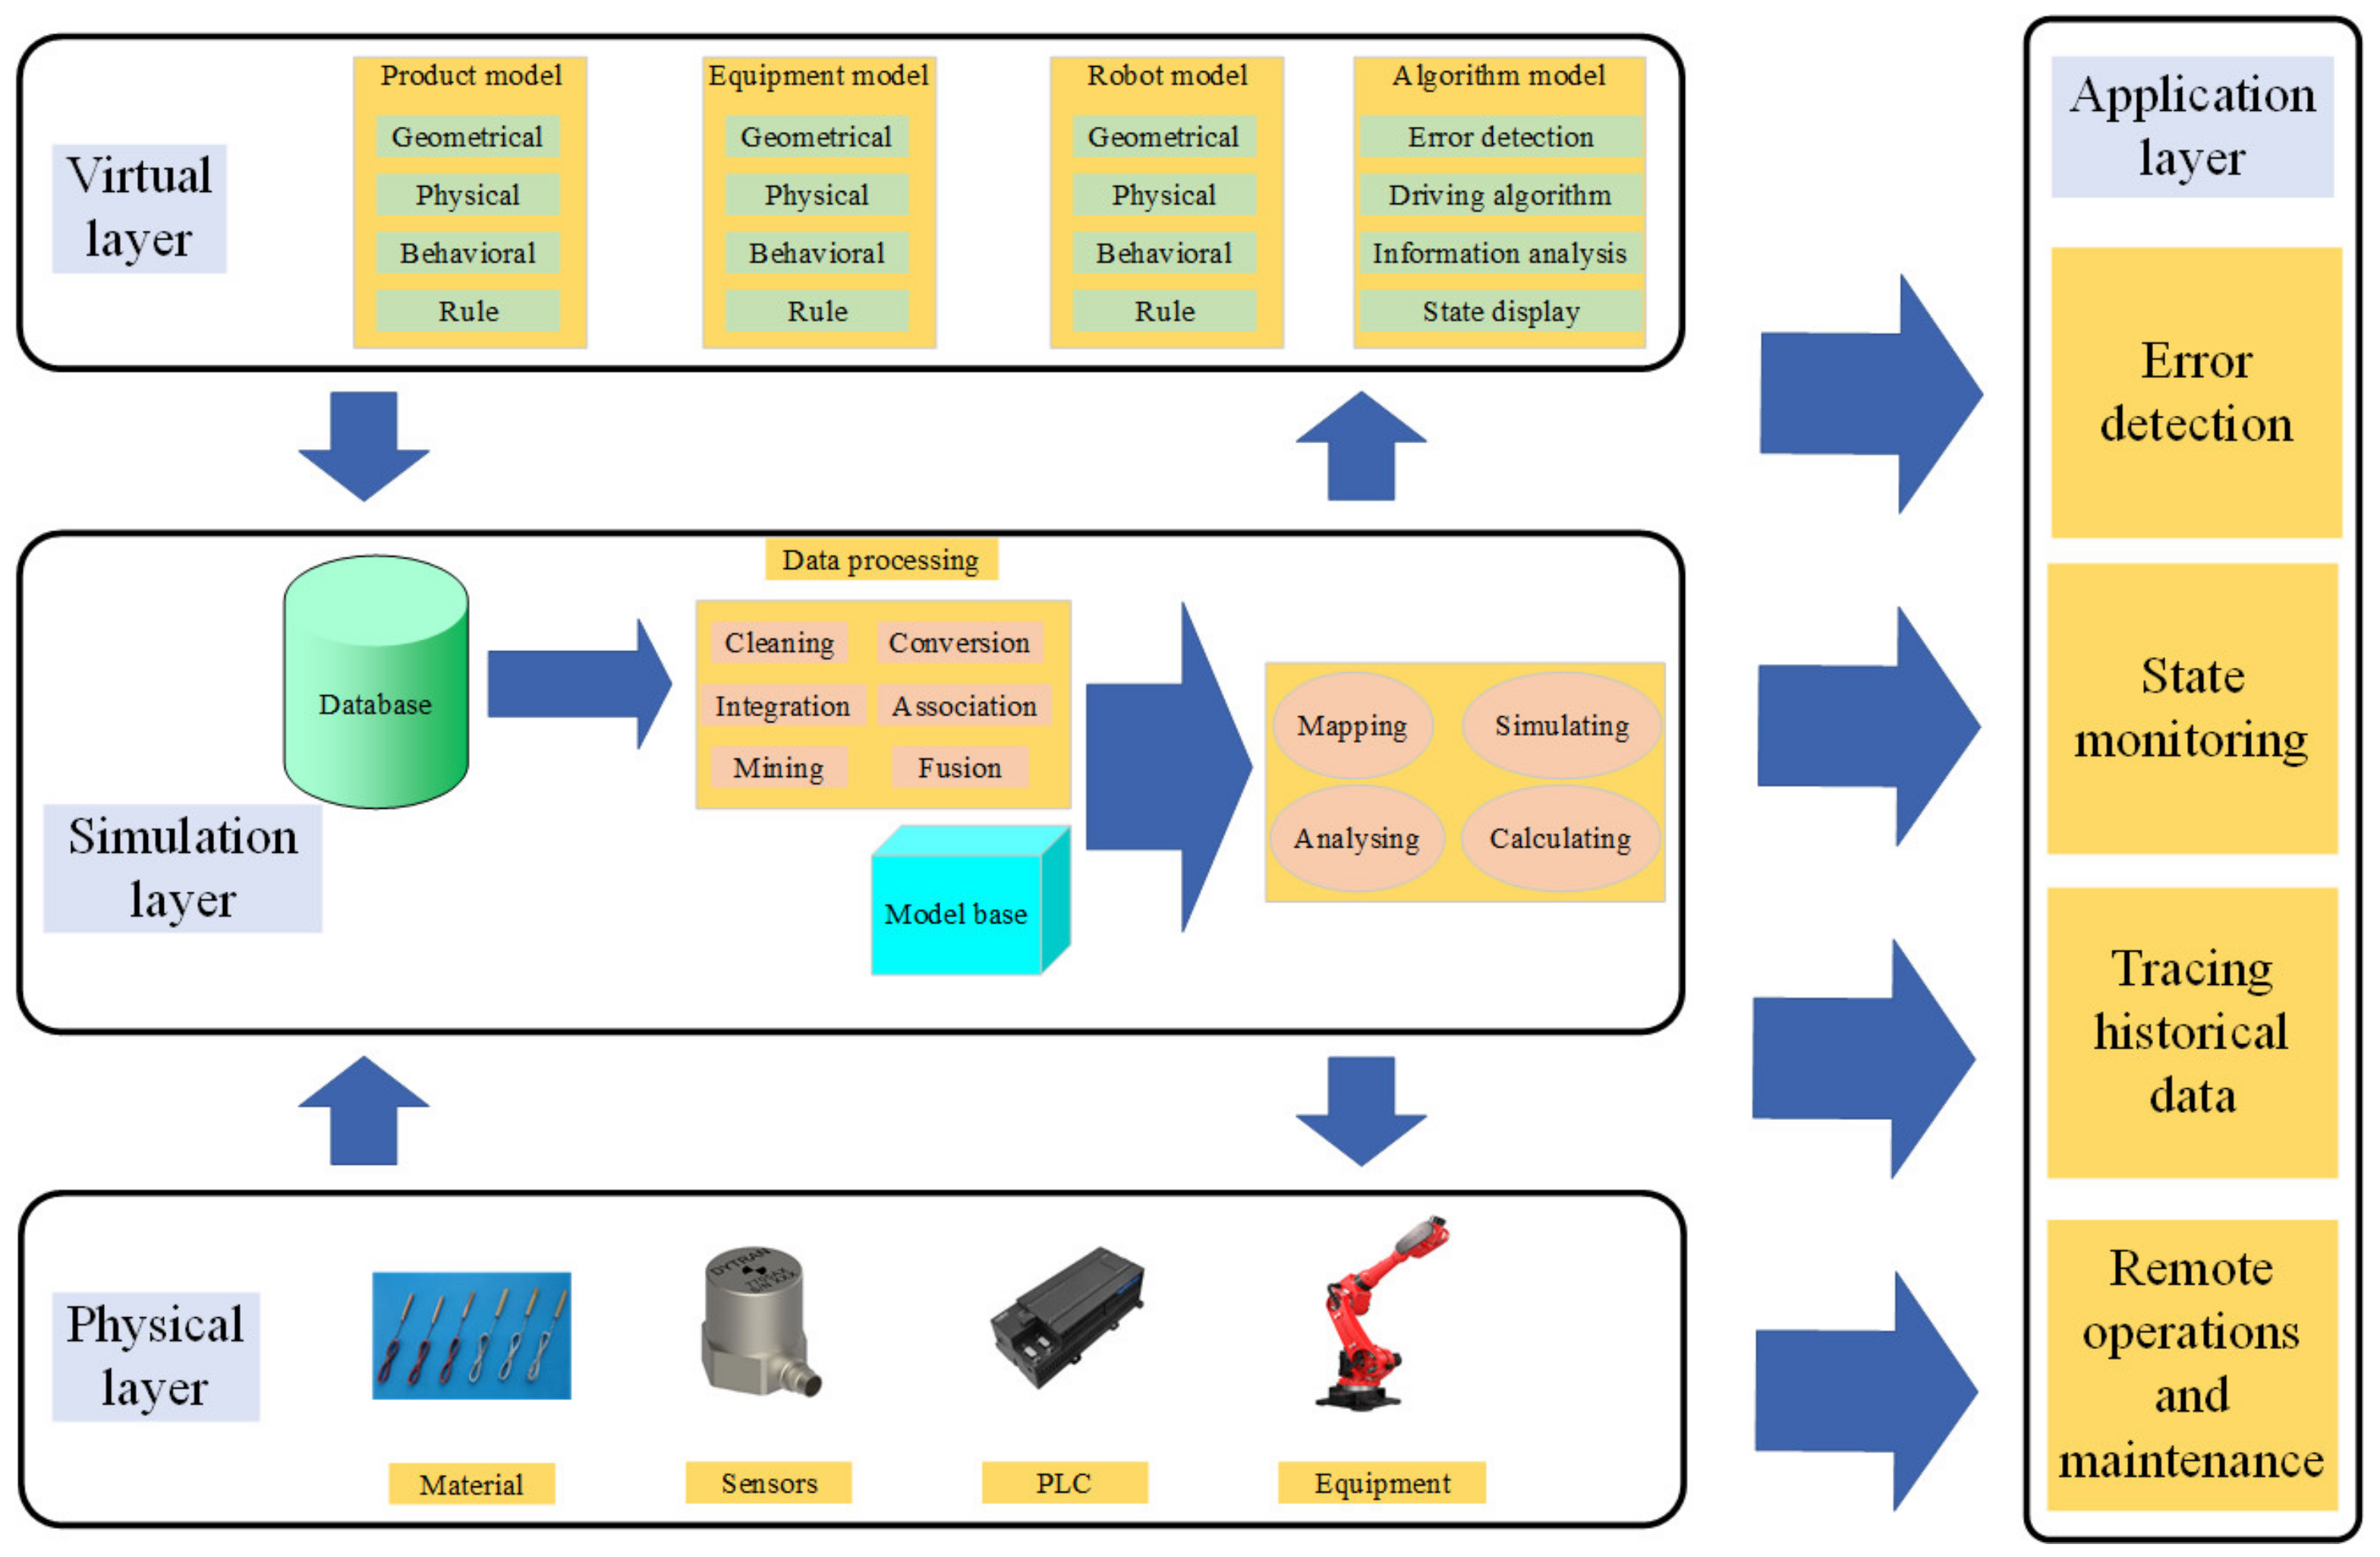
Figure 1. Architecture of assembly line visualization monitoring system.
Sustainability 15 07690 g001
Figure 2. Operation flow of assembly line visualization monitoring system.
Sustainability 15 07690 g002
Figure 3. Virtual entity model.
Sustainability 15 07690 g003
Figure 4. Architecture of assembly process data collection.
Sustainability 15 07690 g004
Figure 5. Data integration management model.
Sustainability 15 07690 g005
Figure 6. Workflow of robot end effector trajectory error detection service.
Sustainability 15 07690 g006
Figure 7. Main stations of the assembly line.
Sustainability 15 07690 g007
Figure 8. Operating interface of the virtual system.
Sustainability 15 07690 g008
Figure 9. Station status multi-view monitoring.
Sustainability 15 07690 g009
Figure 10. Equipment parameter monitoring.
Sustainability 15 07690 g010
Figure 11. Equipment error monitoring.
Sustainability 15 07690 g011
Figure 12. Production progress monitoring.
Sustainability 15 07690 g012
Disclaimer/Publisher’s Note: The statements, opinions and data contained in all publications are solely those of the individual author(s) and contributor(s) and not of MDPI and/or the editor(s). MDPI and/or the editor(s) disclaim responsibility for any injury to people or property resulting from any ideas, methods, instructions or products referred to in the content.