Article

The Spatiotemporal Patterns and Driving Factors of Culture and Tourism Listed Companies in China

1
School of Geography and Ocean Science, Nanjing University, Nanjing 210023, China
2
Huangshan Park Ecosystem Observation and Research Station, Ministry of Education, Huangshan 245899, China
*
Author to whom correspondence should be addressed.
Sustainability 2023, 15(9), 7686; https://doi.org/10.3390/su15097686
Submission received: 29 March 2023 / Revised: 27 April 2023 / Accepted: 3 May 2023 / Published: 8 May 2023
(This article belongs to the Special Issue Sustainable Travel Development)

Abstract

:
The integration of culture and tourism is the key measure for China in transforming and upgrading the tourism industry. It could promote the sustainable development by reducing the consumption of tourism resources. During the implementation of this policy, culture and tourism listed companies play a leading role, as they are the major force in the cultural and tourism industry, and their spatiotemporal characteristics shows the level of development of the cultural and tourism industry and the economy in different regions. Taking the culture and tourism companies as the research objects, this paper analyzed the spatiotemporal patterns and evolution mechanism of culture and tourism listed companies over a long time scale. The results showed that: (1) the number of newly added listed companies in the cultural, tourism, and cultural and tourism categories basically showed the same change trend, and the developing process could be divided into three periods, namely embryonic (1978–1992), exploration (1992–2006) and growth (2007–2021). (2) The spatial distribution of Chinese culture and tourism listed companies developed from “single core” to “one core and multiple stars”, and gradually stabilized into a spatial pattern of “three cores”. The center of gravity was located in the southeast of China, moving from south to north in the shape of a “Z”. (3) Traffic service, government financial strength, financial environment and tourism resource endowment are the main factors affecting the spatial distribution of Chinese culture and tourism listed companies. Compared with the impact of a single influencing factor, the interactions between various factors are much stronger, especially the combinations of tourism resource endowment and another three factors, namely traffic service, communication development and economic development.

1. Introduction

As sustainable development has become a global consensus, China is taking steps to promote its sustainable economic development by transformation of its economic development and strategic restructuring of its economy [1]. The integration of culture and tourism is one of its key policies to achieve this goal. Culture, as the core of China’s strategy of building a strong cultural nation, plays a role in enhancing national confidence and serving society. Tourism, as an important way to meet people’s aspirations for a better life, has a comprehensive driving function for boosting the economy and stabilizing society, but at the same time it has brought over-consumption of resources and damage to the ecological environment. Integrating culture and creativity into tourist attraction, tourism publicity and tourism brands can accelerate the upgrading of the tourism industry and transform the traditional model of relying on resource consumption into a new one of low energy consumption and high income, achieving a harmonious unity between the cultural and tourism industry and the ecological environment, thereby contributing to the sustainable development of the ecological environment and the economy [2,3]. In 2009, the Ministry of Culture and the National Tourism Administration issued the Guiding Opinions on Promoting the Integrated Development of Culture and Tourism, which clearly made a series of strategic arrangements to promote the coordinated development and in-depth integration of culture and tourism [4]. In 2018, the Ministry of Culture and Tourism of the People’s Republic of China was officially established. It is obvious that the convergence of the culture industry and tourism industry has become an inevitable trend in China.
Meanwhile, as the head of the cultural tourism industry, culture and tourism listed companies are an organizational form that combines the cultural and tourism industry with finance after reaching a certain level of development. They are an important carrier and support for cultural and tourism integration, functioning as the barometer of the cultural tourism industry and the indicator of regional cultural tourism economy, and their quantity and quality directly affect regional cultural and tourism revenue and even the national economy [5]. Through their spatial distribution, we can get a glimpse of the balance of the cultural and tourism industry and the coordination of regional economies. Their spatial evolution mechanism can provide reference for improving the cultural and tourism economy in the right way, exploring and innovating the mode and path of cultural and tourism integration according to local conditions, thereby promoting sustainable economic development.
With the deepening of cultural and tourism integration and the expansion of the cultural and tourism industry, academia has been paying increasing attention to the driving force of the industry—culture and tourism listed companies. At present, research on culture and tourism listed companies mainly focuses on three aspects. The first aspect is enterprise performance evaluation. Ma et al. [6] believe that the economic performance of listed companies in the scenic area category is significantly different in both the time and space dimensions. Liu et al. [7] found that the operating efficiency of listed companies in the cultural and tourism industry has a significant positive impact on their profitability. Zhu [8] and Ma [9] et al. constructed a performance evaluation system for listed companies in the cultural and tourism industry, which can provide an important reference for stakeholders to evaluate enterprises and make decisions. The second aspect is business diversification. The diversified M&A of China’s tourism listed companies is mainly driven by factors such as industry market opportunities, state-owned holdings and political affiliation [10]. Dou et al. [11] found that it is rather common for media listed companies, which belong to cultural listed companies, to carry out diversified operations, and the overall diversity in the cultural industry is significantly higher than that of other industries; and listed companies should choose suitable diversification types according to their own industrial attributes to avoid blind unrelated diversification. Pang et al. [12] found that corporate social networks can reduce the incentive for tourism listed companies to internalize external resources with diversification by reducing transaction costs. Personal social networks can help the management to obtain information about new products and new markets to improve the diversification ability of tourism listed companies. The final aspect is enterprise management. Du et al. [13] constructed an empirical model of the interaction between the governance system and performance of tourism listed companies, confirmed the positive correlation between the two and provided effective guidance and countermeasures for tourism listed companies to build a sustainable governance mechanism. Han et al. [14] proved that, for listed cultural and creative enterprises, high-quality internal management can notably inhibit financial fraud. Additionally, improving the internal control systems can promote the healthy and long-term development of cultural and creative industries. However, it is rare for researchers to study culture and tourism listed companies from a geographical perspective. Although, some studies conducted from a geographical perspective on other research objects rooted in the cultural and tourism industry provide inspiration and reference for the ideas and research methods in this paper. Yuan et al. [15] used the nearest neighbor index, the standard deviation ellipse (SDE) and kernel density estimation to describe the spatial patterns of cultural resources within the Yellow River National Cultural Park, and used the Geodetector tool to study the influence of physical geography and social and human factors on the spatial distribution pattern of cultural resources. Kuang et al. [16] analyzed the spatial distribution and clustering characteristics of 407 national intangible cultural heritages in Central China by using the geographic concentration index and kernel density, and then explored natural and social environmental influencing factors and their interaction on ICH spatial distribution using the Geodetector. Luo et al. [17] took 585 theme parks in the Chinese mainland as the research objects, using the nearest neighbor index, kernel density and SDE to analyze the development stage characteristics, spatiotemporal differentiation and diffusion of the theme parks, and multiple factor regression analysis methods were used to explore the influencing factors. As mentioned, most of the current research related to culture and tourism companies has focused on the performance and management of the enterprises. Little attention has been paid to the study of their geographic characteristics, and the literature introducing the complete developing process of culture and tourism listed companies since the emergence of China’s cultural and tourism industry is also rare.
Consequently, this paper takes China’s culture and tourism listed companies as research subjects, collecting the panel data from 1992 to 2021, and firstly analyzes the time-series evolution characteristics to introduce the complete developing process of cultural and tourism companies. Then, GIS analysis methods are used to explore the spatial distribution characteristics over a long time scale to understand the spatial evolution of culture and tourism listed companies. Indicators from the four dimensions of “cultural and tourism development”, “economic conditions”, “public services” and “political support” are selected as conditional variables, and the Geodetector is used to explore the influencing factors of spatial distribution of culture and tourism listed companies to determine which factors and their interaction play a core role in it.
The aim of this paper is to introduce the complete growing process of culture and tourism companies since the emergence of the cultural and tourism industry, reveal the spatial distribution characteristics of the culture and tourism companies over the past 30 years with the help of GIS spatial analysis methods, and explore the spatial influencing mechanism of the spatial evolution based on single-factor analysis and two-factor interaction analysis using the Geodetector.
The contributions of this study paper are mainly two aspects. From the theorical aspect, this study fills the research gap in studying culture and tourism listed companies from a geographical perspective, thereby enriching and deepening the research system of enterprise geography and tourism geography. From the practical aspect, first, this study clarifies the complete growth process of culture and tourism companies since the very beginning of the industry to help visualize the industry characteristics and predict future trends. Second, this study reveals the spatial layout evolution of culture and tourism companies to help grasp the past and current quality levels of cultural and tourism integration and development in different regions of China accurately, and identify backward regions of the high-quality and sustainable development of the cultural and tourism industry. In addition, by clarifying which factors and their interactions play a central role in the layout of culture and tourism companies, this study helps to optimize the spatial structure of the cultural and tourism industry according to local conditions.

2. Data and Methods

2.1. Data Source

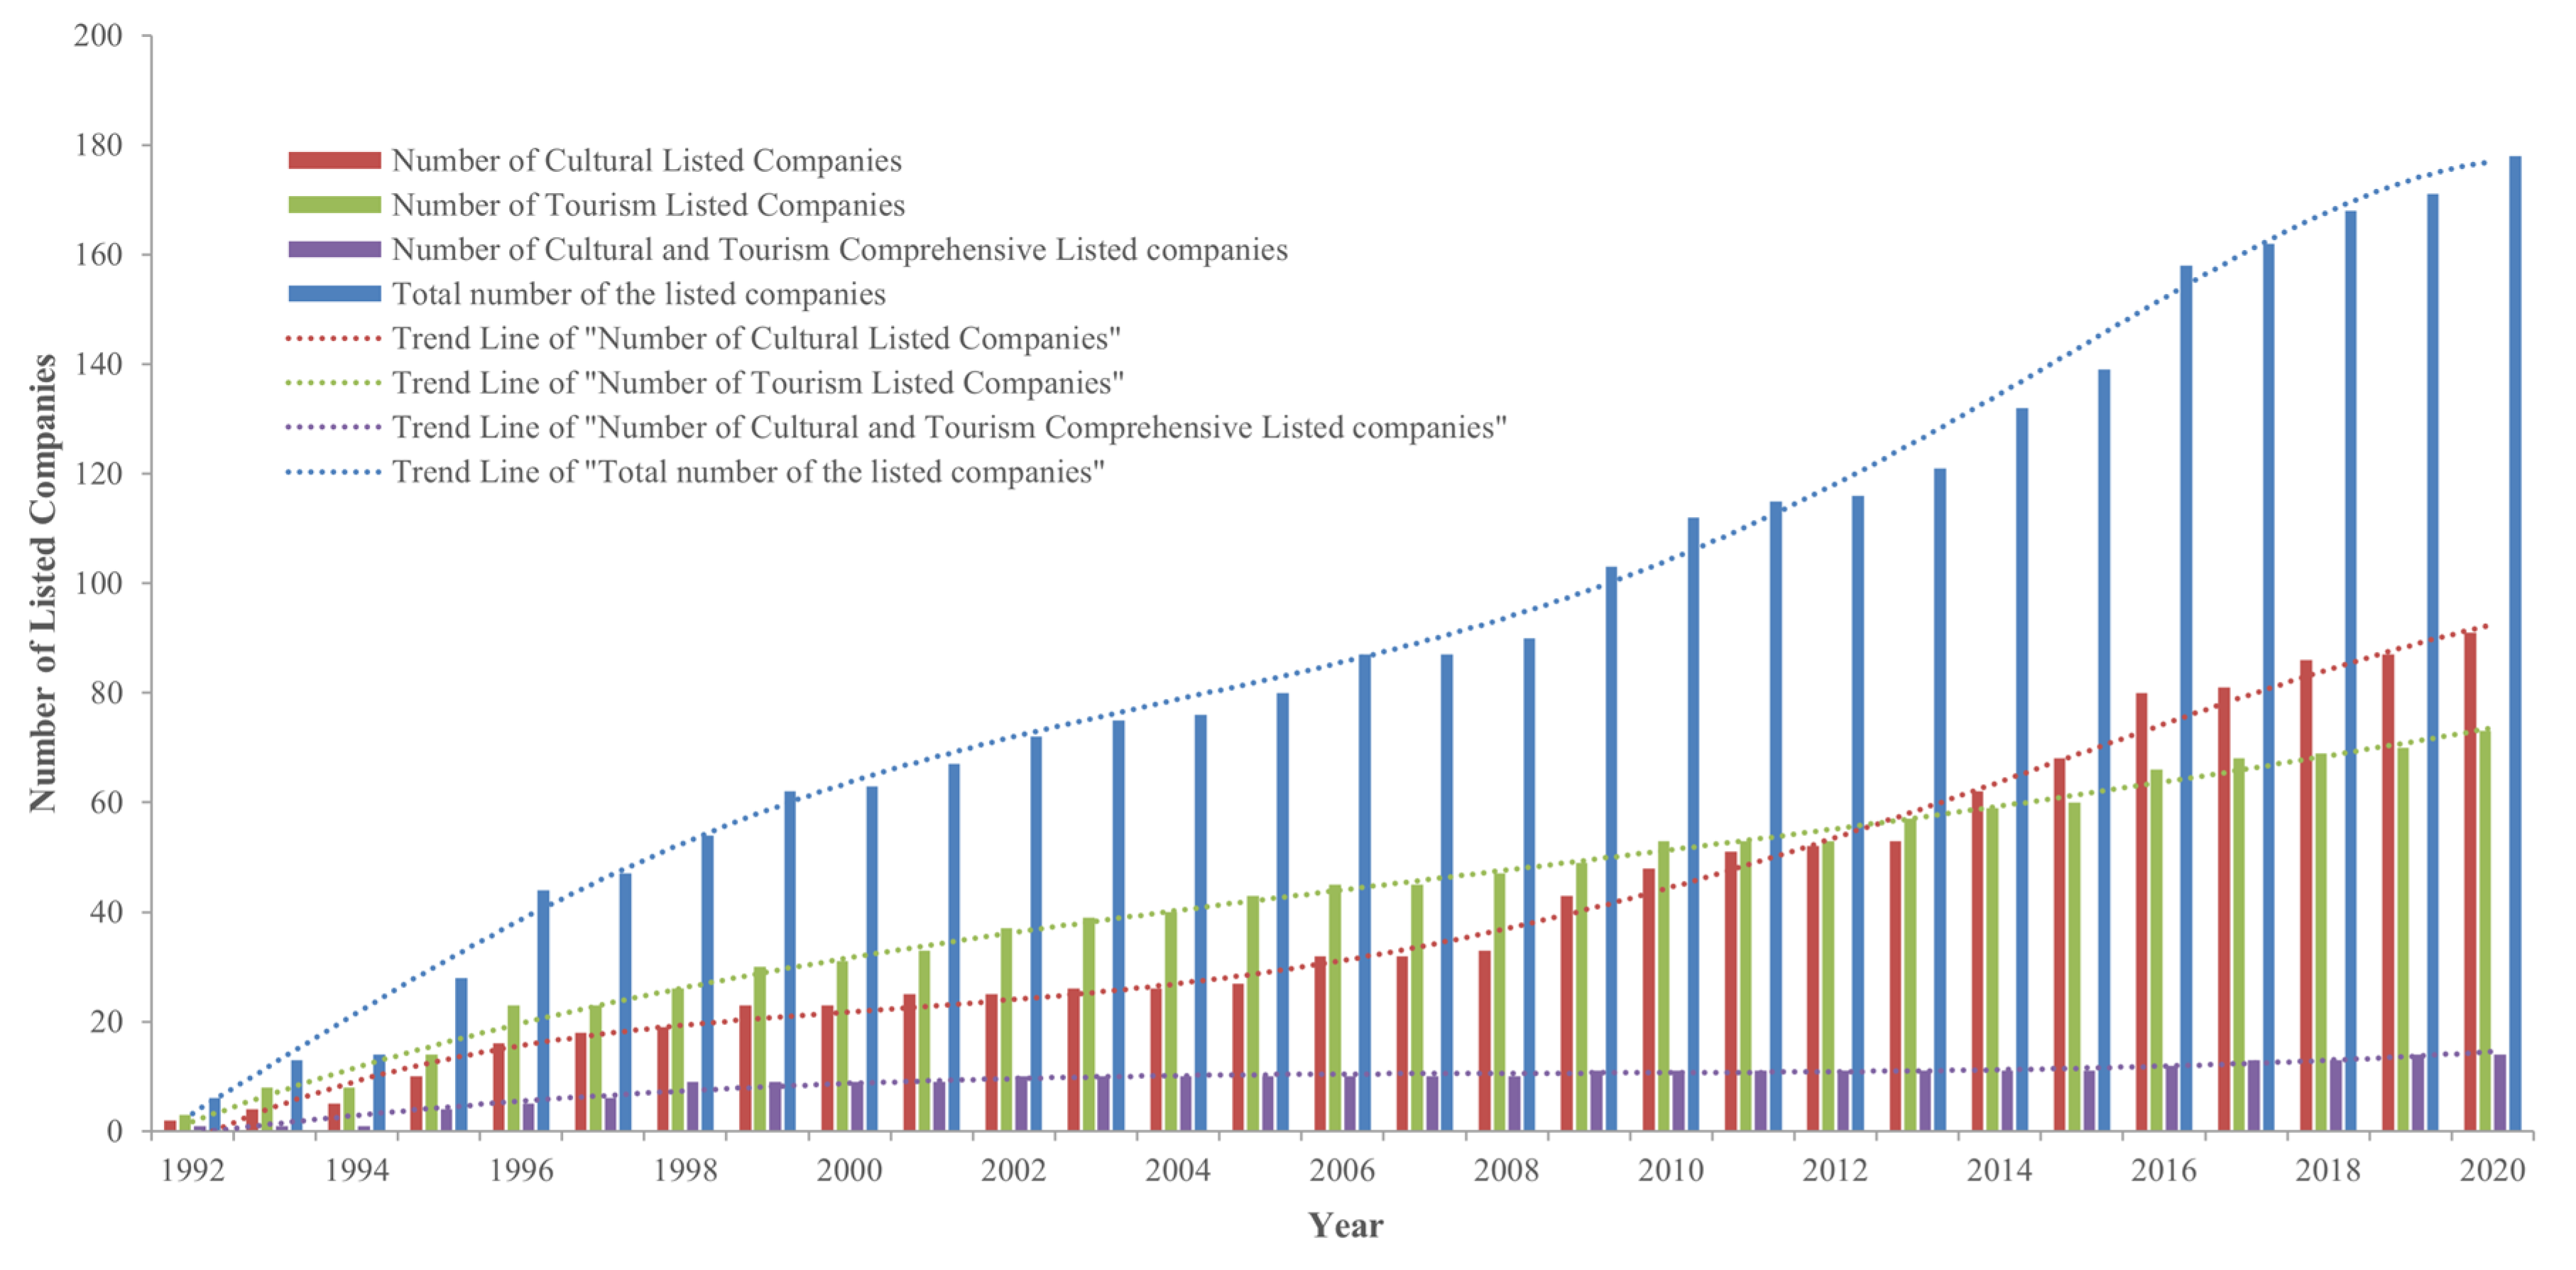
The research object of this paper, “culture and tourism listed companies”, was determined according to the Guidelines for the Classification of Listed Companies (revised in 2012) issued by the CSR. The data of culture and tourism listed companies were sourced from the Tianyancha Enterprise Database and China Stock Market & Accounting Research Database (CSMAR) (the data extraction deadline was November 2021). Firstly, we checked the “Listing Status” for A-shares, Chinese stocks, Hong Kong stocks and Science and Technology Board, and selected listed companies with the industry codes 53 (Railway Transport), 54 (Road Transport), 55 (Water Transport), 56 (Air Transport), 61 (Accommodation), 62 (Catering), 70 (Real Estate), 72 (Business Services), 78 (Public Facilities Management), 85 (News And Publishing), 86 (Radio, Television, Film, Film and Television and Recording Production) and 87 (Culture and Art Industry). Secondly, in order to avoid mistakes and omissions, relevant studies and industry research reports of the CTSC were compared in multiple ways to supplement and confirm the research objects. Finally, we selected the listed companies according to their main businesses and retained the listed companies that are mainly engaged in culture and tourism. Finally, 178 companies were listed in the Shanghai, Shenzhen and Hong Kong sectors, including 73 tourism listed companies, 91 cultural listed companies and 14 comprehensive cultural and tourism listed companies. The longitude and latitude data of the enterprises’ geographical locations were obtained with the help of the Map Location tool.
In the analysis of influencing factors, the data of scenic spots of 3A and above were obtained from Qunar (https://www.qunar.com/ accessed on 20 December 2021), the ranking of city openness was derived from the investment big data website of CIC (http://d.ocn.com.cn/analyse/city/hj3000-100.shtml accessed on 20 December 2021) and the land price of commercial services was obtained from the China Land Price Detection Network (https://www.landvalue.com.cn/Lvmonitor/Index accessed on 20 December 2021). Other data of indicators were obtained from the 2021 China Statistical Yearbook and the statistical yearbooks and statistical bulletins of all provinces and cities in 2021. The list of the culture and tourism companies in this study has been uploaded to Github (https://github.com/WenjieHu1999/The-Spatiotemporal-Patterns-and-Driving-Factors-of-Culture-and-Tourism-Listed-Companies-in-China.git accessed on 27 April 2023).

2.2. Research Methods

2.2.1. Kernel Density Estimation

The kernel density estimation method is usually used to indicate the balanced degree of the distribution density of point elements in a certain geographic space and can visually reflect the dispersion or clustering characteristics of point elements. [18,19]. In this study, the kernel density of culture and tourism listed companies in China was calculated to estimate its spatial clustering characteristics and measure the overall spatial pattern change. The greater the value of the kernel density, the higher the degree of the aggregation of culture and tourism listed companies. It is calculated by Equation (1):
f n X = n n h i = 1 n K X X i h
where F(x) is the kernel density estimate; n is the number of point elements in the analysis range, and K ( X X i h ) is the kernel density function; h is the search radius; and ( X X i ) means the distance from the estimated point x to the actual event x i .

2.2.2. Standard Deviation Ellipse

The standard deviation ellipse (SDE) is often used to reflect the overall characteristics of the spatial distribution of elements from multiple perspectives. The spatial center of gravity of the SDE reflects the average position of the overall range of the distribution; the azimuth reflects the direction of the main trend of its spatial spread; and the ratio of the length of the long and short axes reflects the shape of its spatial distribution [20]. In this study, standard deviation ellipses and spatial centers of gravity of different time periods were drawn to measure the spatial distribution trend and the trend of center of gravity migration. It is calculated by Equation (2):
C = 1 n i = 1 n x 2 - i = 1 n x i - y i - i = 1 n x i - y i - i = 1 n y 2 -
where C is the standard deviation ellipse; xi and yi are the coordinates of point i; { x - , y - } denotes the mean center of the point elements; and n is the total number of point elements.

2.2.3. Geodetector

The Geodetector method is able to reveal the influences of factors, and there are mainly two modules of the Geodetector tool that are used in this study. Q has a value range of [0, 1], and the larger the Q value, the greater the influence of the factor on the spatial distribution, and the opposite for a smaller Q value [21].
(1) Single-factor detection. Single-factor detection is able to quantify whether a geographic factor influences the spatial distribution of an indicator value and the weight of that factor. It can be calculated Equation (3):
Q = 1 1 N σ 2 h = 1 L N h σ h 2
where Q is the magnitude of the explanatory power of the influencing factors; N and Nh are the sample capacity in the whole area and layer h, respectively; σ 2 and σ h 2 are the variances of Y values (which in this study is the number of culture and tourism listed companies) in the whole area and layer h, respectively; and L is the number of categories of variable X.
(2) Interactive factor detection. There are logical connections between different influencing factors [22]. The interactive detection module of the Geodetector can reveal whether the joint effect of two factors will lead to an enhancement or a weakening of the explanatory power of the spatial differentiation of elements. In this study, the interactive factor detection was used to explore the interaction between the single driving factors. Through an interactive comparison of the impact of X and Y culture and tourism companies, we can determine whether two factors affect the spatial distribution of culture and tourism companies in China alone or jointly, including the following five relationships: two-factor antagonism, single-factor antagonism, two-factor enhancement, two factors that are independent of each other, and two factors that are nonlinearly enhanced [23].

3. Spatiotemporal Distribution Analysis

3.1. Sequential Change

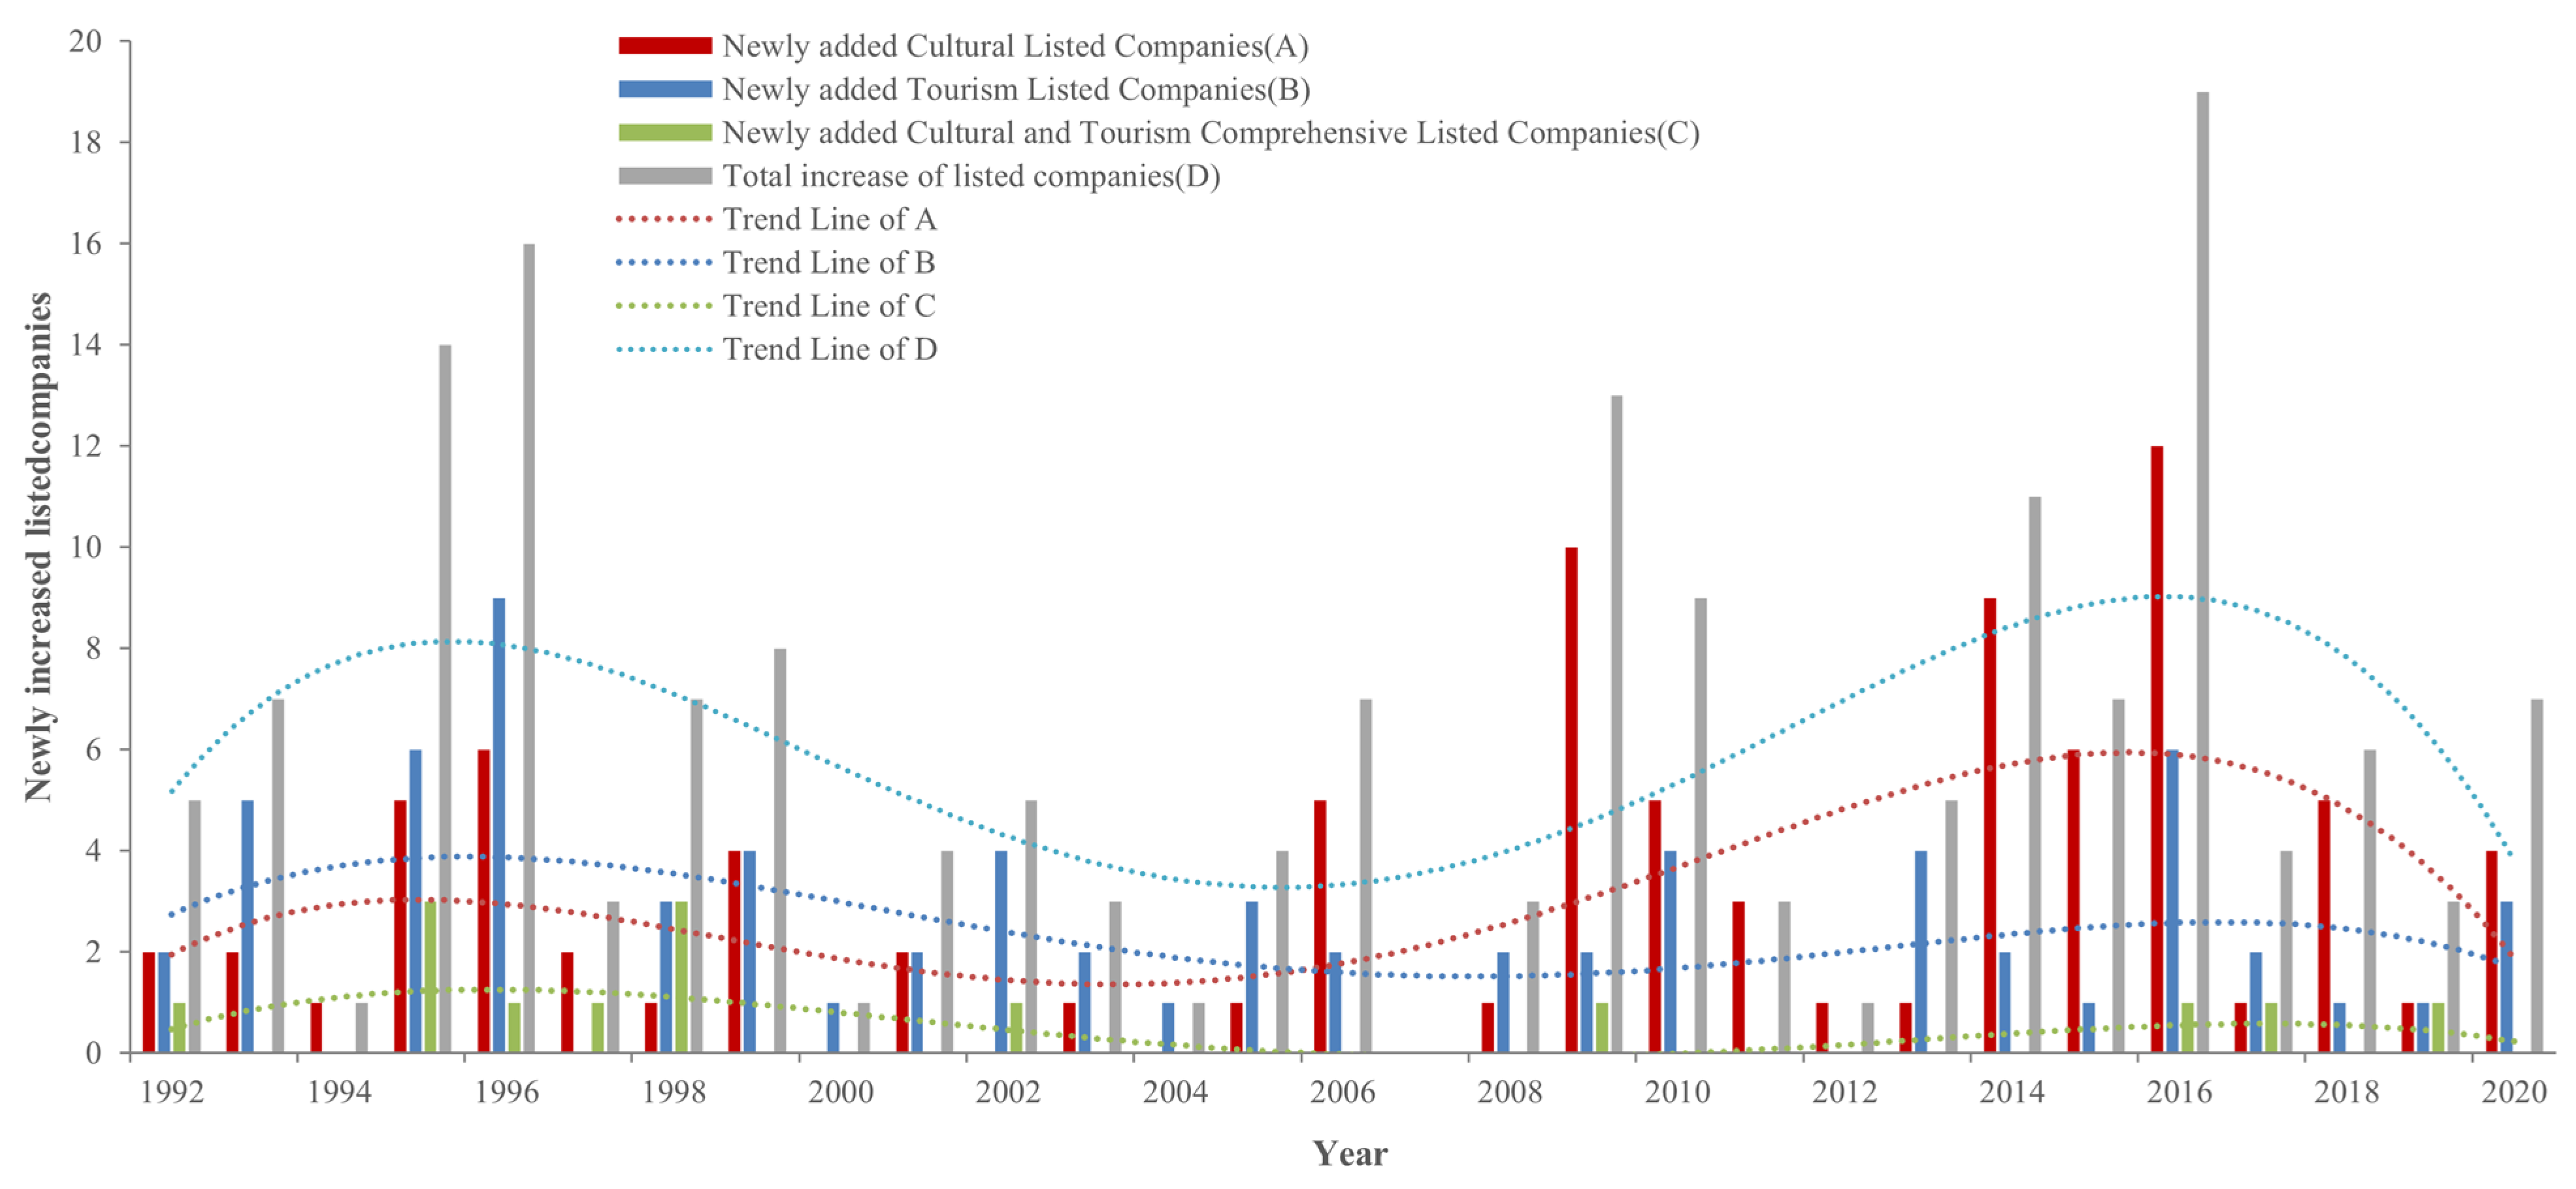
According to the main business of the enterprise, culture and tourism listed companies in China were divided into three categories: cultural listed companies, tourism listed companies, and comprehensive cultural and tourism listed companies. From 1992 to 2021, there was variability in the total number of listed companies in the three categories (Figure 1). The number of comprehensive cultural and tourism listed companies remained the lowest, while the number of cultural listed companies continued to grow and overtook that of tourism listed companies in 2013. As of 2021, the number of cultural listed companies was the largest with 91, followed by 73 listed companies in the tourism category, with the fewest listed companies in the comprehensive category, totaling 14. The trend lines fitted to the year-on-year increments in the three types of listed companies show the relative consistency of their changes (Figure 2), which indicates that the development of the cultural and tourism industry has been mutually beneficial and complementary in the last 30 years under the influence of various factors. Although the changes are dynamic, steady-state characteristics are shown. According to the dynamic (“peak and valley” of the curve) and steady-state (change consistency) nature of the incremental trend line, the development of culture and tourism listed companies can be roughly divided into three stages.

3.1.1. Embryonic (1978–1992)

In March 1978, the Central Committee of the Communist Party of China approved and forwarded the Request for Instructions on the Development of Tourism, which included the China Tourism Administration as the direct subordinate of the State Council. From October 1978 to July 1979, Comrade Xiaoping Deng made five speeches announcing that tourism should be developed as soon as possible and affirming the economic function of tourism. In December 1978, the Third Plenary Session of the 11th CPC Central Committee was held, officially opening the process of China’s transformation from a planned economy to a market economy. The development of tourism was included in the national economic and social development plan, and the ideological emancipation window in the cultural field was gradually opened. In 1990, the Shanghai Stock Exchange and the Shenzhen Stock Exchange announced their opening successively, marking the beginning of China’s stock trading. In June 1992, the CPC Central Committee and the State Council identified tourism as a key industry in the tertiary industry in the Decision on Accelerating the Development of the Tertiary Industry. In the same year, mass transit was listed on the Shanghai Stock Exchange, marking the beginning of the embryonic stage of the development of culture and tourism listed companies.

3.1.2. Exploration (1992–2006)

Under the background of positive factors such as tourism policy and financial environment, culture and tourism listed companies in China developed rapidly, from 1 new company in 1992 to 16 new added companies in 1997, which is the first peak of the increased quantity curve. At the same time, the total number increased to 44, with the emergence of representative tourism listed companies such as Mount Emei A, China Eastern Airlines and the China Youth Travel Service. After the peak, the growth rate began to slow down. The emergence and spread of the Asian financial crisis in 1998 led to a foam phenomenon in domestic economic development. In addition to the stagflation in tourists and income, the tourism industry was also affected negatively by construction mistakes in scenic spots, resorts and theme parks [24,25,26]. In 1998, there were only three new culture and tourism listed companies in China, entering a downturn. In September 1999, the State Council issued a new version of the National Holiday Measures for Annual Festivals and Memorial Days, and October 1 became the first “Golden Week” for tourism in China. In June 2000, the General Office of the State Council forwarded the Several Opinions on Further Development of Holiday Tourism issued by nine ministries including the National Tourism Administration, and formally established the “Golden Week” holiday system, which made a significant contribution to the high growth in income of the culture and tourism industry [27]. Between 1999 and 2000, 15 culture and tourism listed companies emerged, including China International Trade, Guilin Tourism, First Travel Hotel and CITS United. In 2006, the Outline of the 11th Five-Year Plan for the Development of China’s Tourism Industry clearly stated that the tourism industry should be cultivated as an important industry in the national economy, creating a favorable development environment for culture and tourism listed companies.
Overall, influenced by the external economic environment, the increase rate of culture and tourism listed companies in China slowed down during the exploration period. However, thanks to the first round of positive fiscal and cultural-tourism-related policies, the decline was relatively stable. The total volume increased, and at the end of 2006 there were 80 culture and tourism listed companies in China.

3.1.3. Growth (2007–2021)

At the end of 2006, China’s deflation was effectively curbed, and the macroeconomic environment was significantly improved. In 2007, the National Tourism Administration approved 66 scenic spots, including the Palace Museum, as the first batch of national 5A tourist attractions. The tourism resource value of the selected scenic spots was maximized, and hence the best comprehensive benefits were obtained. In 2008, the government implemented the second round of positive fiscal policy to save China’s economy from the global economic crisis. In 2009, the National Tourism Administration and the Ministry of Culture issued the Guiding Opinions on Promoting the Integrated Development of Culture and Tourism, which officially started the era of cultural and tourism integration. The cultural tourism industry was being nurtured in a new way and was beginning to take its place in the market. In 2017, “Holistic Tourism” was first included in the Government Work Report, and the tourism industry ushered in a new stage of industrial upgrading, quality improvement and efficiency increase. Hence, culture and tourism listed companies in China showed a good development momentum, with 19 new companies added. Huakai Creative, Handreading Technology, Tianmu Lake, Hengdian Film and Television, Fengyuzhu and other cultural and tourism enterprises were listed in 2017, representing the second peak of the curve of the increase in culture and tourism listed companies.
After 2018, the international situation changed dramatically, the economy, finance and tertiary industries showed a trend of decline, the overall profit of domestic listed companies declined, and the increase in the number of culture and tourism listed companies began to fall back. In 2020, COVID-19 had a serious impact on tourism in China, both inbound and outbound, as well as on the production of cultural products. The development of the cultural tourism industry was in a “pause” state. In 2021, after a series of policy adjustments, some signs of recovery appeared, but the outbreak of a broader pandemic around the world still restricted the overall recovery of the cultural tourism industry. By 2021, the total number of culture and tourism listed companies in China was 178, which were distributed among 52 cities and still in the growth stage.

3.2. Spatial Distribution Evolution

3.2.1. Spatial Pattern Change

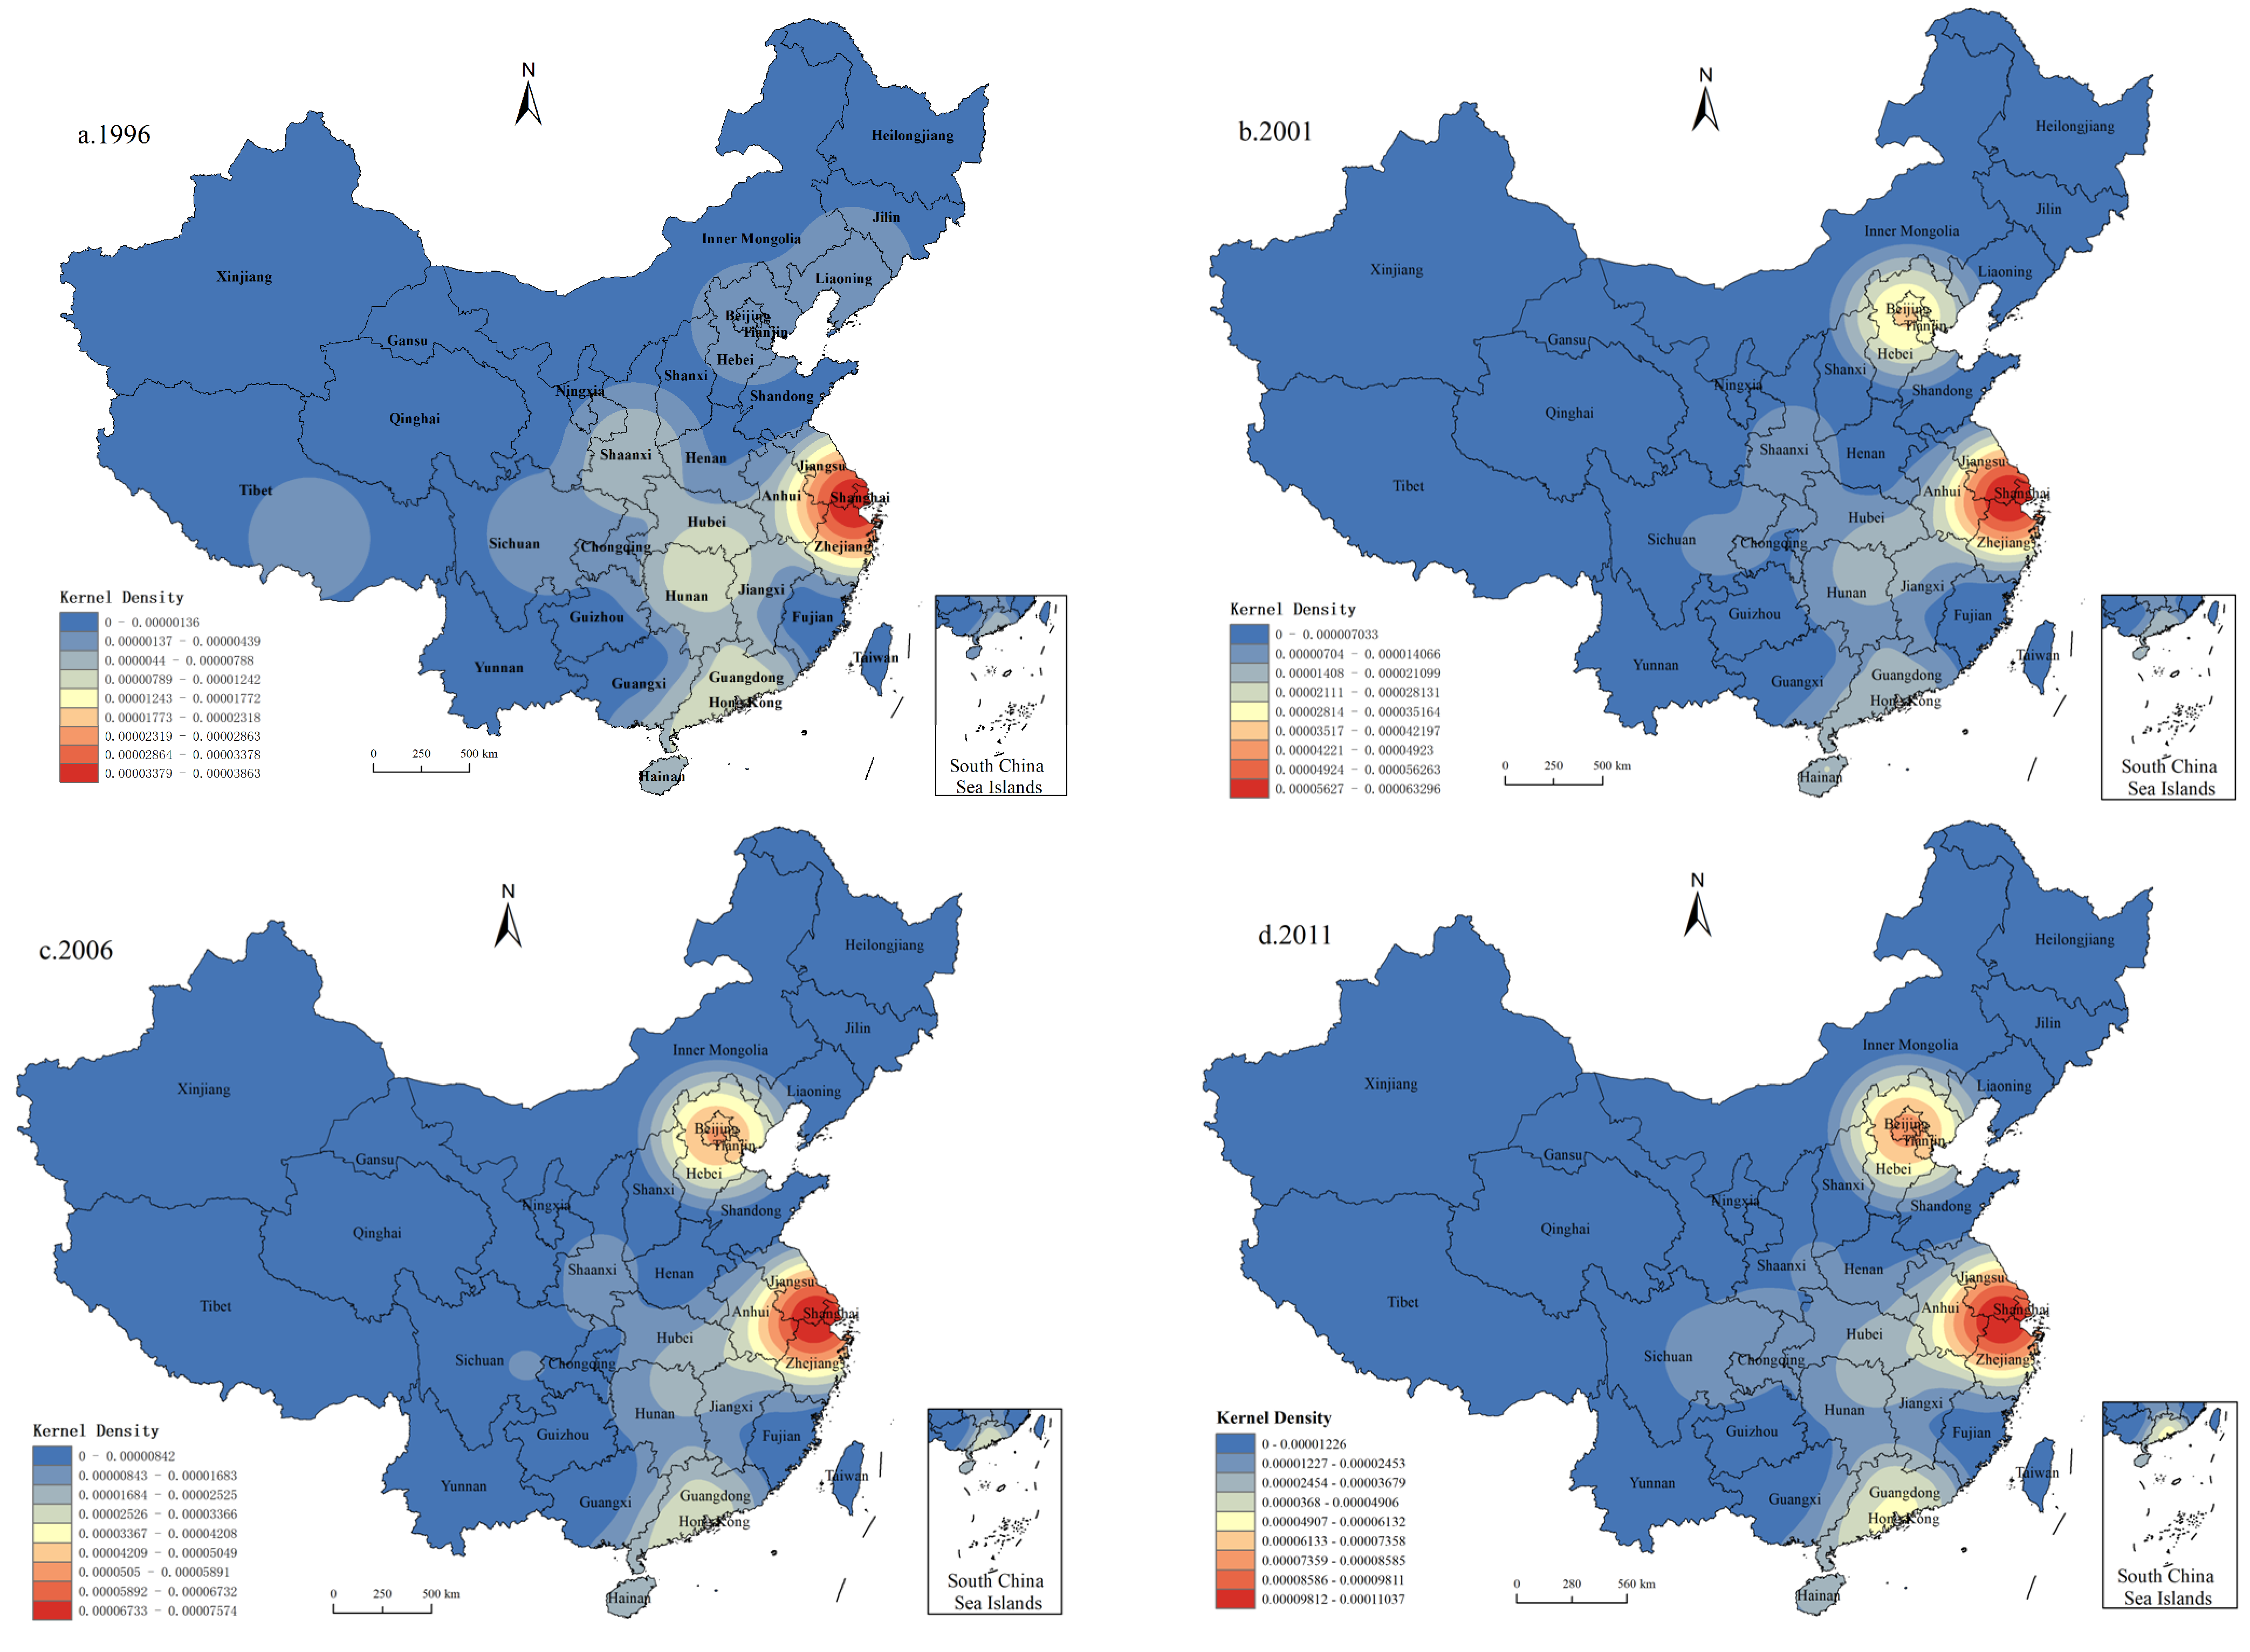
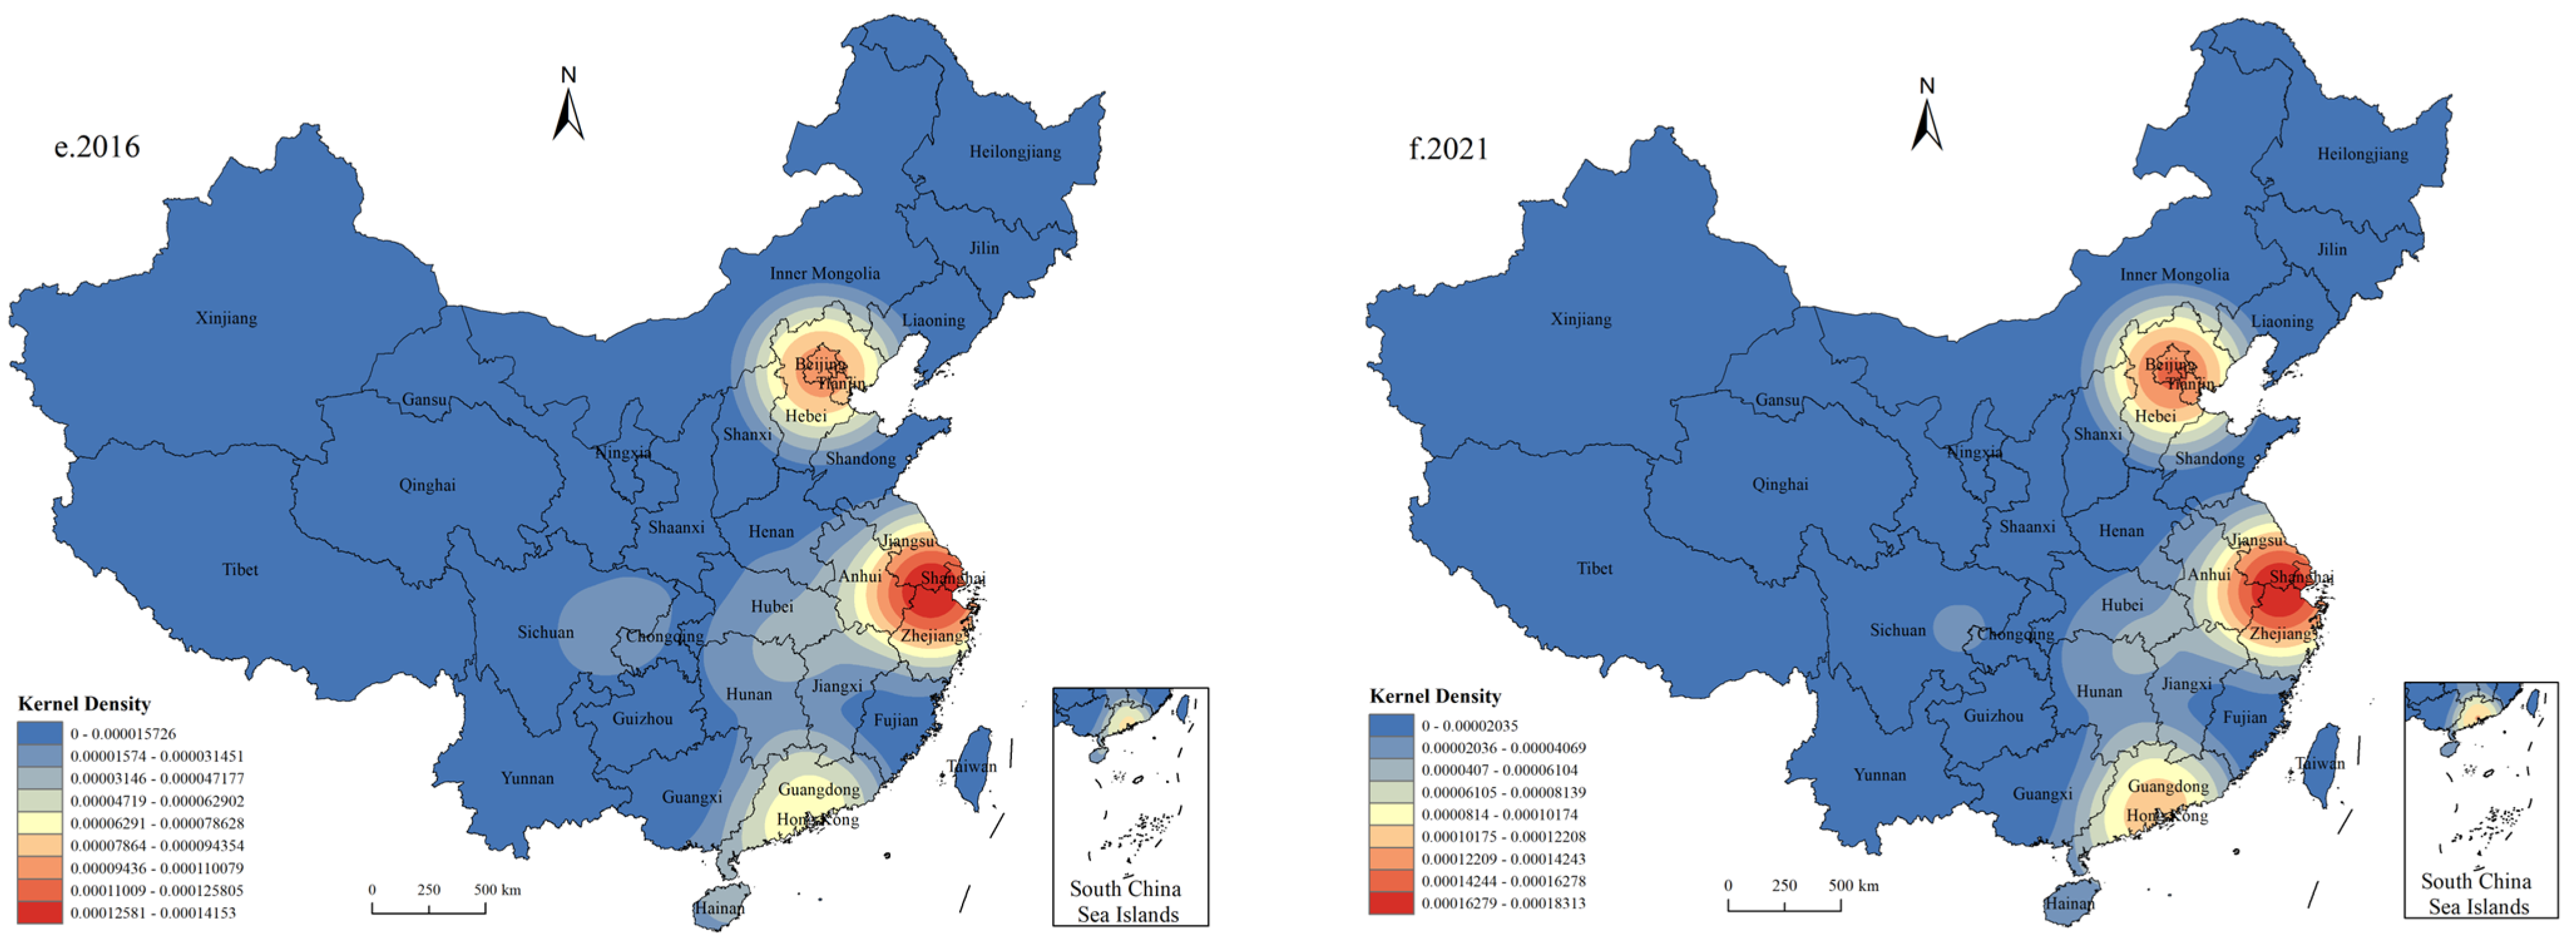
The POI data of culture and tourism listed companies in China from 1992 to 2021 were sorted at six time points, namely, 1996, 2001, 2006, 2011, 2016 and 2021. The data were visualized using the kernel density estimation tool in ArcGIS10.5 (Figure 3). It can be seen that the spatial pattern of culture and tourism listed companies in China showed a spatial evolution feature of transforming from a “single core” to “one core and multiple stars”, gradually stabilizing to “three cores”.
In 1996, culture and tourism listed companies were mainly concentrated in Shanghai and its surrounding areas, forming a “single core cluster” distribution pattern with the Yangtze River Delta as the core. In 2001, a new sub-core area was added in the Beijing–Tianjin–Hebei (B–T–H) region. At the same time, the Pearl River Delta (PRD) and Hainan region gradually took shape as sub-clusters, presenting a spatial distribution pattern of coexisting points and patches. From 2006 to 2016, the Chinese government issued a series of policies such as the Coordinated Development Plan for Urban Agglomeration in the Pearl River Delta, the Regional Plan for the Yangtze River Delta, and the Outline of the Coordinated Development Plan for Beijing-Tianjin-Hebei, which clarified the important strategic position of the three key urban agglomerations, and further promoted the development of the two core areas of B–T–H and the PRD, forming a “triple-core” spatial distribution pattern together with the Yangtze River Delta. In addition, in 2011, the State Council officially approved the ChengduChongqing Economic Zone Regional Plan, clarifying its strategic position as an important economic center in western China [28]. With the acceleration of the development of the Chengdu–Chongqing Economic Zone, it became the sub-core area for the distribution of culture and tourism listed companies in China. By 2021, the spatial distribution of culture and tourism listed companies in China had been steadily polarized into a pattern of “three core pillars”, with the Pearl River Delta, Yangtze River Delta and Beijing–Tianjin–Hebei, respectively, from south to north. Comparing the six time points, the proportion of culture and tourism listed companies distributed in three major regions (PRD, YRD and B–T–H) and three major cities (Guangzhou, Shanghai and Beijing) gradually increased, and the overall concentration degree was strengthened.

3.2.2. Center of Gravity Migration

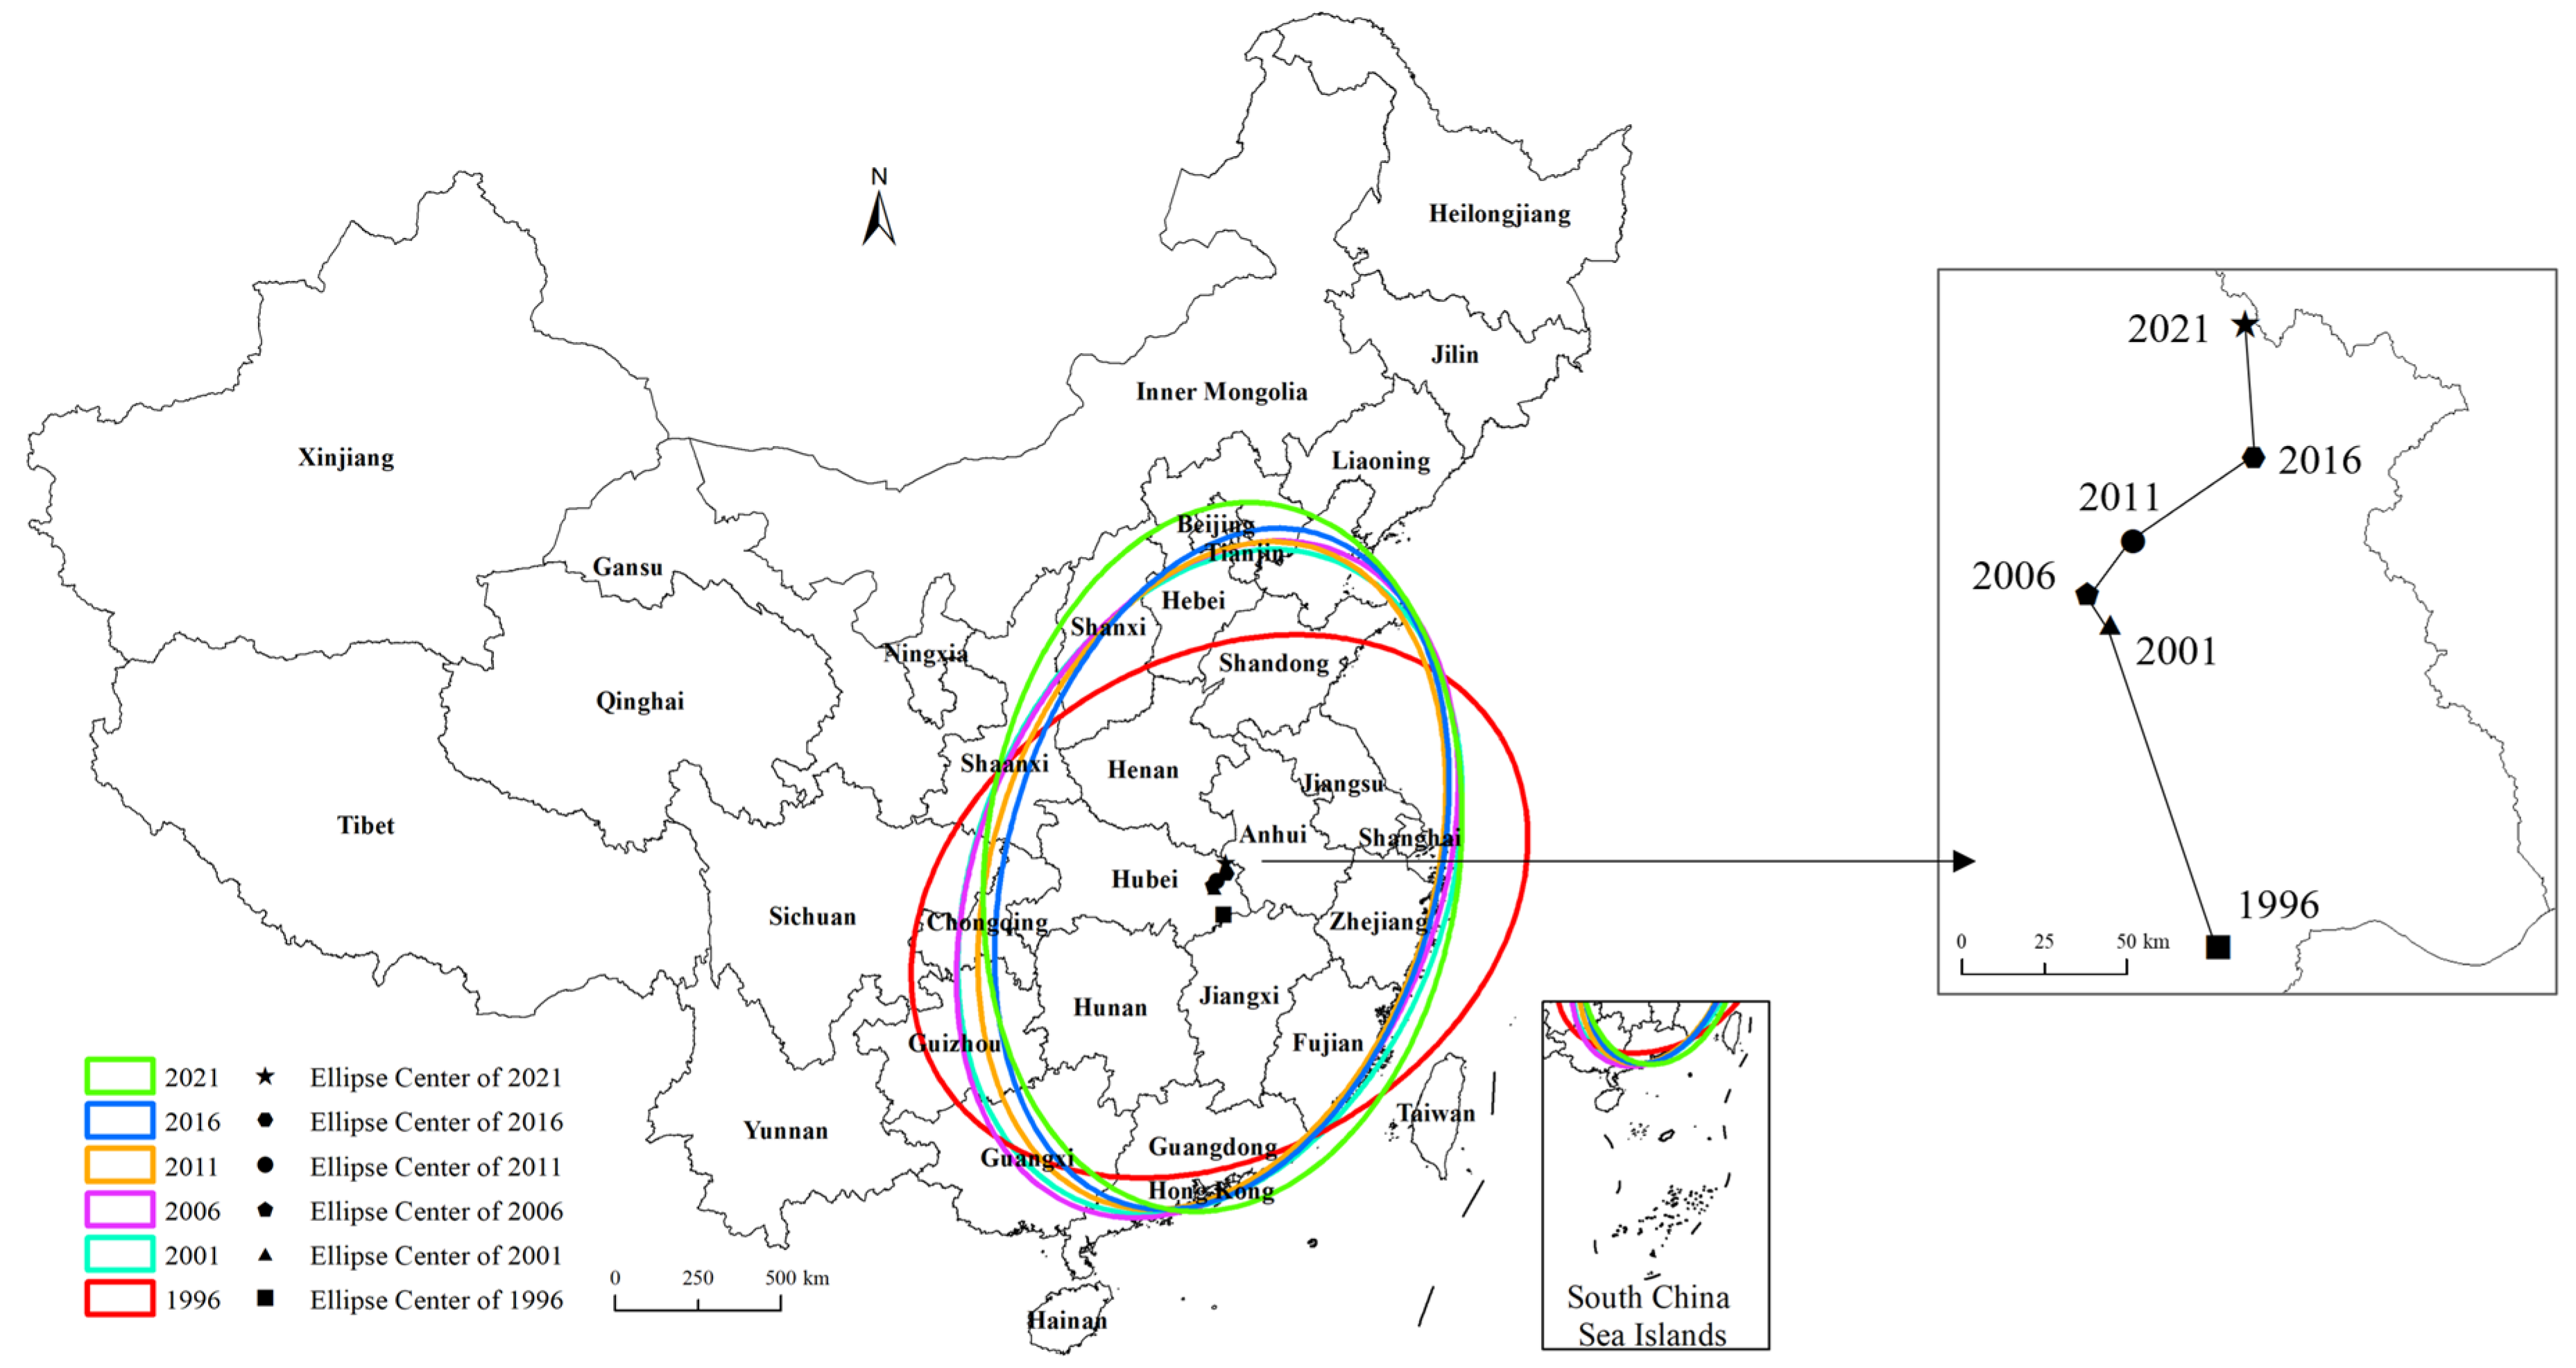
As mentioned above, we selected the same six time points and used ArcGIS10.5 to draw a standard deviation ellipse (Figure 4) for the purpose of analyzing the overall spatial migration trend of culture and tourism listed companies in China from 1992 to 2021.
The change in the standard deviation ellipse shows a pattern of “expanding–shrinking–expanding”. In 1996, the ellipse was located in the southeast of China, with a total area of 2,312,933.36 km2, covering the whole of central China, the whole of eastern China and the two provinces of South China. Between 2001 and 2006, the ellipse was dominated by central and eastern China, with a significant expansion of the range to northern China. From 2011 to 2016, the elliptical range began to shrink, corresponding to the gradual polarization of the distribution of culture and tourism listed companies. In 2021, the area of the ellipse suddenly increased to the maximum value, 2,407,368.25 km2, as, although the spatial distribution at this stage showed a multi-core point distribution pattern, there were also many discrete listed companies outside the core area, thus broadening the scope of the ellipse. As a side note, by 2021, the spatial distribution of culture and tourism listed companies in China showed the dual characteristics of obvious clustering and a wide overall distribution range.
Corner θ (Table 1) showed a clear trend of decreasing. From 1996 to 2021, θ of each time point gradually decreased from 58.43° to 7.72°, and the main axis of the ellipse continuously shifted to the northwest, which indicates that culture and tourism listed companies diffused to the northwest during this period, forming a “northeast–southwest” pattern. The introduction and deepening of the Western Development Strategy in 2000 increased the average annual economic growth rate of the western region, narrowing the economic development gap between the western region and other regions [29], which caused the main axis of the ellipse to shift significantly to 37.43° in the northwest direction from 1996 to 2001. After that, due to structural and cyclical adjustments, economic growth slowed down, and the ellipse maintained the trend of shifting in the same direction but slowly.
As for the center of gravity, it moved in a “Z” shape, and changed between 29.83–31.20 ° N and 115.01–115.50° E. In the direction of latitude, the center of gravity continued to move northward. This is because Beijing, as the capital city, has strong natural conditions for the development of the cultural tourism industry, and its attraction to listed companies is stronger than in the core area in the south. In the direction of longitude, the center of gravity moved westward first and then eastward. The strong support of the government for the western region and the rich tourism resources in the southwest region caused the center of gravity to move westward for a short time. After reaching the westernmost point in 2006, it gradually returned to the east.

4. Analysis of Driving Factors

In order to analyze the numerous factors affecting the spatial distribution of culture and tourism listed companies in China, according to the relevant literature, combined with the characteristics of listed companies, this paper constructed four dimensions of indicators, namely, “cultural and tourism development”, “economic conditions”, “public services” and “political support”. The following indicators were selected: the number of scenic spots of grade 3A and above (X1); the quality score of scenic spots (X2) (10 points for 5A, 6 points for 4A and 4 points for 3A; the total score is obtained using the formula “score of single scenic spot × number of scenic spots = total score of scenic spot quality”, to represent the development level of cultural tourism [6] (the number of tourists and tourism revenue were not selected, firstly because the reliability of the data is questionable, and secondly because there is endogeneity between the two and the quantity and quality of scenic spots)); GDP (X3); the ranking of urban openness (X4); the number of financial industry employees (X5), which represents economic conditions [30,31]; the number of star-rated hotels (X6); telecom business income (X7); airport passenger throughput (X8), representing public services [32]; land price of commercial services (X9); and local financial expenditure (X10), representing policy support [33,34], with a total of 10 factors (Table 2). Then, the natural breakpoint method in ArcGIS was used to divide the 10 continuous independent variables into five categories and obtain discrete type values. After that, single-factor detection and interactive-factor detection were carried out using Geodetector.

4.1. Single-Factor Detection

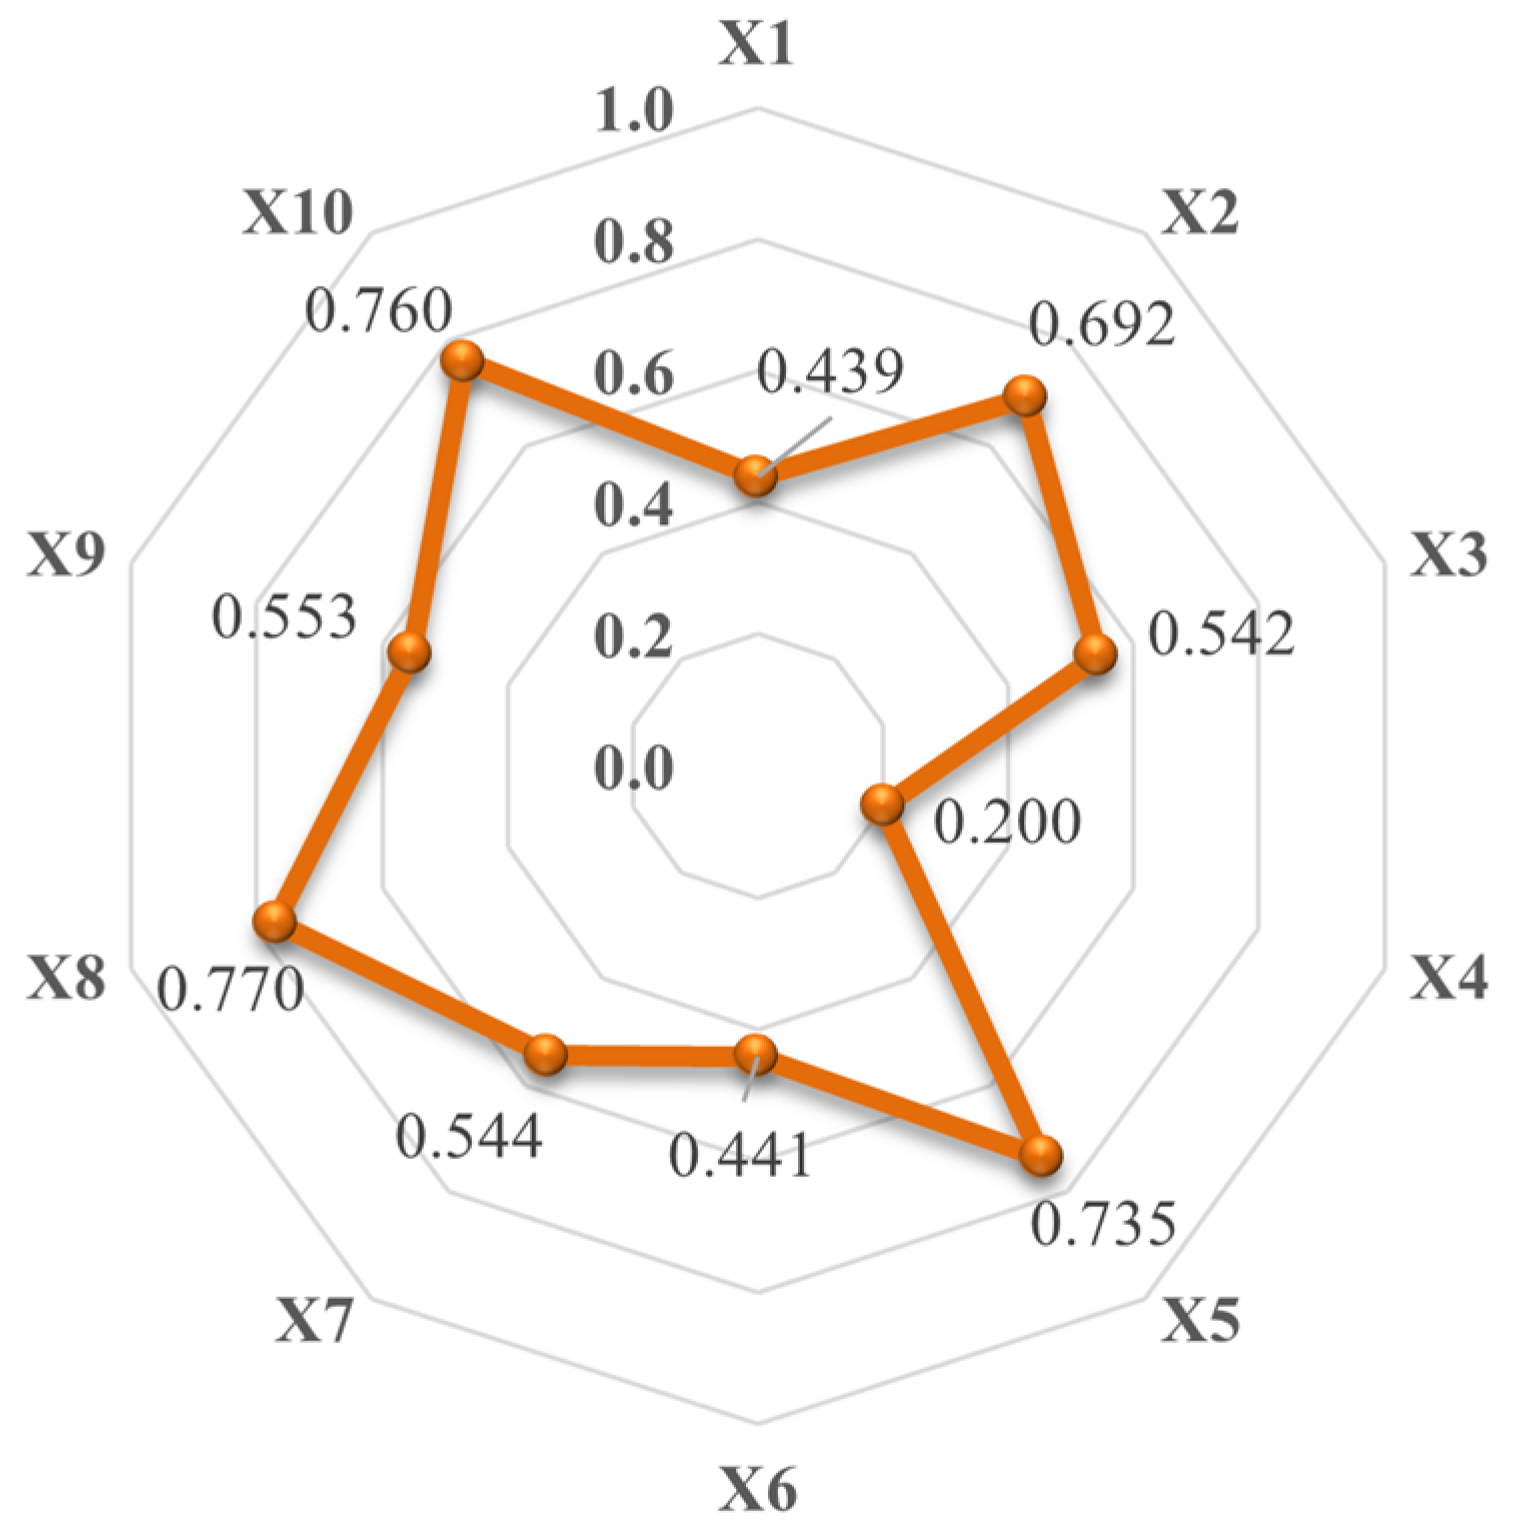
As shown in Figure 5, in the order of explanatory power, the Q value of each factor was as follows: airport passenger throughput (0.770) > local financial expenditure (0.760) > number of financial industry employees (0.735) > scenic spot quality score (0.692) > commercial land price (0.553) > telecom business revenue (0.544) > GDP (0.542) > number of star-rated hotels (0.441) > number of scenic spots of 3A and above (0.439) > ranking of urban openness (0.200).
(1)
Cultural Tourism Development
The quality score of scenic spots had an explanatory power of 0.692 for the spatial distribution of culture and tourism listed companies in China, and 0.439 for the number of scenic spots of 3A and above. The development of cultural tourism enterprises is strongly related to the quality of local tourist attractions. Scenic spots with excellent resources can more easily attract tourists, stimulate the supply of cultural products while boosting consumption, and promote the development of the cultural tourism industry chain. The rich types and large number of high-level scenic spots mean that there is sufficient space and various choices for tourists. As a corporate force rooted in the cultural tourism industry, culture and tourism listed companies are more likely to have their locations in cities and regions with a high abundance of tourism resources.
(2)
Economic Location
The explanatory power of the number of financial industry employees reached as high as 0.735, ranking third, indicating that the regional financial environment is very important for the spatial distribution of culture and tourism listed companies in China. Cities such as Beijing, Shanghai and Shenzhen, with some of the highest numbers of culture and tourism listed companies, also have the highest number of financial industry employees. Culture and tourism listed companies need a good financing environment and adequate financial services, meaning that cities and regions with a developed financial industry are more likely to attract them. The factor explanatory power of GDP was 0.542, showing that regional economic growth has a certain boosting effect. Only cities with a strong economy can easily produce economies-of-scale effects to attract culture and tourism listed companies in China [35]. The urban openness ranking had a relatively small impact on culture and tourism listed companies in China, with an explanatory power of only 0.200.
(3)
Public Service
The explanatory powers of airport passenger throughput, telecom business income and the number of star-rated hotels were 0.770, 0.544 and 0.441, respectively. The control of transportation services over the distribution of culture and tourism listed companies in China ranked first: on the one hand, the large-scale movement of tourists from the source to the destination depends on good transportation agencies; on the other hand, listed companies have a large number of demands for national and international conferences, and the high-frequency flow of personnel requires cities to be equipped with high-level transportation facilities, such as airports, meaning that convenient transportation services are the primary impact factor. The level of communication development also had some influence, especially in the period of COVID-19, where online conferences were particularly necessary. The impact of accommodation services, on the one hand, lies in the tourists’ sense of experience, and high-quality accommodation conditions attract “repeat visitors”; on the other hand, it decides the experience of employees or customers on business trips. Considering the treatment of personnel, culture and tourism listed companies tend to choose cities with relatively many star-rated hotels to settle in.
(4)
Policy Support
The explanatory power of local fiscal expenditure ranked second, reaching 0.760. The regions with a strong government financial strength are in a position to allocate additional corporate working capital and corporate renovation funds, and have a more adequate budget for the protection and development of their culture and heritage. The explanatory power of the commercial land price level was 0.553. In Beijing, Shenzhen, Shanghai and other cities where the commercial land price level is relatively high, the distribution of culture and tourism listed companies is also relatively dense. It is clear that culture and tourism listed companies are willing to bear the higher land rent costs in places where the infrastructure is complete and the office environment is comfortable.

4.2. Interactive Factor Detection

The results show that the influence of factor integration is greater than that of a single factor (Table 3), and all of the top three factors are combinations of the scenic spot quality score (X2) and other factors, namely, X2 ∩ X8 (0.961), X2 ∩ X7 (0.937) and X2 ∩ X3 (0.924), which shows that the interaction between the quality of urban tourist attractions and the level of transport services, communication development and economic development has a dominant control on the spatial distribution pattern of culture and tourism listed companies in China. This also proves that, for culture and tourism listed companies, strong tourism resource endowment is an extremely critical factor in increasing their distribution in a city or region. The influence of X3 ∩ X7 is the smallest, with 0.582. In addition to the nonlinear enhancement of X1 ∩ X4 and X4 ∩ X6, the remaining interactions of influencing factors show a two-factor enhancement, which shows that, in the process of forming the spatial differentiation pattern of culture and tourism listed companies in China, each driving factor does not independently have an influence, but plays a synergistic role together with other factors. This reflects the complexity of the driving factors and formation mechanism of the spatial differentiation of culture and tourism listed companies in China.

5. Discussion

From the perspective of geography, this paper extracts the data for culture and tourism listed companies in China from 1992 to 2021, takes prefecture-level cities and above as statistical units, reveals the spatiotemporal evolution characteristics over the past 30 years with the help of GIS spatial analysis, and explores the factors and their interactions affecting culture and tourism listed companies by means of single-factor analysis and two-factor interaction analysis using the Geodetector.
Our study found that, since China’s reform and opening up, the culture and tourism companies had been poised for springing up, and the three categories of them (cultural category, tourism category and comprehensive cultural and tourism category) showed a basically consistent trend, which according to the “peak and valley” of the curve and the change consistency could be divided into three periods, namely, the embryonic (1978–1992), the exploration (1992–2006) and the growth (2007–2021). The developing trend was found to be closely related to the relevant national cultural and tourism policies, and external economic and financial background.
In the past 30 years, the overall spatial layout of culture and tourism listed companies in China showed a spatial evolution pattern of transforming from “single core” to “one core and multiple stars”, gradually stabilizing to a “three cores” with the B–T–H, the PRD and the Yangtze River Delta being the “cores”. This is in line with the research on the headquarters of the Chinese listed companies conducted by Zhong [31] and Pan [36], according to which the spatial aggregation of the Chinese listed companies are located in the same three most developed regions in China, which indicates that the Chinese culture and tourism industry is not yet developed enough to bring into full play the high-quality tourism resources of regions where the economy and transportation are underdeveloped, failing to break away from the inherent distribution pattern of listed companies. The reason could be found in Liu’s [7] research, which pointed out that many cultural and tourism listed companies have shown below average profitability, with a shortage of cultural boutique projects, and are generally in a state of investment saturation, excessive investment and insufficient output, causing the low driving capacity for regional economy. The standard deviation ellipse shifted from southeast to the northwest over time and showed a pattern of “expansion–contraction–expansion”, and the center of gravity moved from south to north along a “Z”-shaped track. Compared with the findings of Meng [37] and Zhong [31] that Chinese listed companies are gradually evolving from the central and western part to the eastern metropolises and the center of gravity of listed companies is gradually shifting to the southeast, the results of this paper are quite the opposite, indicating that, although the culture and tourism companies are concentrated in the prosperous areas, they do show a diffusion trend to the regions undeveloped but with great tourism resources.
Cultural and tourism development, economic conditions, public services and political support had explanatory power in the spatial distribution of culture and tourism listed companies in China. In terms of single factors, the level of transportation services, the financial strength of the government and the control of the financial environment ranked as the top three. However, the interaction of various influencing factors had a far greater impact on the spatial distribution of culture and tourism listed companies than one single factor. The leading interactive factors were the quality of scenic spots and transportation services, the quality of scenic spots and the level of communication development, and the quality of scenic spots and the level of economic development, indicating that tourism resource endowment has a strong impact on the formation of the distribution pattern of culture and tourism listed companies. Combined with the results of single-factor detection, it can be seen that, if a region has only high-quality cultural and tourism resources, the positive impact to the spatial distribution of cultural and tourism listed companies cannot be maximized. Only when the great quality of regional tourism resources and relatively universal influencing factors such as traffic reachability, technology level and capital play a positive role at the same time, can the concentration of cultural and tourism listed companies be determined. This is in line with Kuang’s [16] research on central China’s intangible cultural heritage and Yuan’s [15] research on cultural resources in the Yellow River National Cultural Park in China, both of which focused on the objects rooted in the cultural and tourism industry. According to their study, the interaction impact of one key factor combined with some others is also greater than that of the single factors, indicating that the spatial distribution of objects rooted in the cultural and tourism industry results from multi-factor coupling, and the effects of all driving factors need to be comprehensively considered. The main type of interactions between those factors was two-factor enhancement, also reflecting the complex characteristics of the formation mechanism of the spatial differentiation of culture and tourism listed companies in China.

6. Conclusions

Culture and tourism listed companies not only have a close relationship with the development of the cultural tourism industry, but also, as large enterprises, have important significance in promoting local economic development and optimizing the image of cities and regions [36]. This paper provides guidance for the reasonable layout of cultural and tourism enterprises by studying the space–time evolution patterns and influencing factors of culture and tourism listed companies. Culture and tourism listed companies mainly converge to the three major urban clusters in the east, while the distribution density in the central and western regions is relatively low. In addition, the distribution balance of culture and tourism listed companies in China needs to be improved and the spatial structure needs to be optimized. Regarding the influencing factors of layout of culture and tourism listed companies, the interactions between the quality of tourist attractions and the level of transport services, communication development and economic development have dominant controls on the spatial distribution pattern.

6.1. Implications

Based on the above findings, in response to the strategies of “Western Development” and “Central Rise”, this study proposes recommendations for the promotion of the balanced development of culture and tourism companies, and an increase in revenue of the cultural and tourism industry from the perspective of high-quality development. First, given that the growth of culture and tourism listed companies is closely related to policy changes, strong policy support should be provided to the cultural and tourism industry. There is a need to give full play to the guiding role of government planning and the leading role of culture and tourism companies, to accelerate the upgrading of the cultural and tourism industry, thereby achieving the continuous transformation of tourism resource advantages into market advantages and industrial advantages. In addition, to the backward regions, financial payments transfer should be implemented, to balance the regional financial capacity, thereby enhancing the enterprise support and transformation capacity of governments in the regions with limited distribution of culture and tourism listed companies.
Second, given the significant differences in the distribution of culture and tourism listed companies between the southeast and northwest regions, each region should make construction plans according to local conditions. The eastern regions should be encouraged to make full use of their advantages of economic location, public services and policy bias to enhance the radiation effect and drive the cultural and tourism economy of the surrounding areas, to change the distribution of culture and tourism listed companies from agglomeration to diffusion and improve the rationality of coverage. The western region should improve the equipment of star-rated hotels, airports and communication information services, thereby provide tourists with a better experience; moreover, the production of excellent film and television works would also bring good publicity and attraction effects to the local scenic spots.
Lastly, given that the quality of tourism resources plays a crucial role in the distribution of cultural and tourism listed companies, each region should attach importance to the protection and development of cultural and tourism resources. The eastern region can leverage its economic and technological advantages to create a digital cultural tourism format, such as building regional smart cultural tourism public service platforms, speeding up the distribution of digital tourism consulting service centers, and encouraging cultural and tourism listed companies to accelerate digital transformation. Those measures will help to foster new scenes of digital cultural tourism and push the cultural tourism industry into a new stage. The western region can revitalize rural tourism and pastoral tourism by amplifying agricultural and rural characteristics; at the same time, while developing and utilizing the natural landscape, the local culture, which could be unique and profound, is supposed to be explored as well to create a local cultural and tourism brand and maximize the value of cultural tourism resources.

6.2. Limitations and Further Research

This study also has some limitations. (1) This study discussed the Chinese culture and tourism listed companies as point elements when analyzing the spatial pattern, without collecting and analyzing the relevant attribute data of culture and tourism listed companies, such as the corporate culture, business performance and corporate image [38]. (2) This study only picked the culture and tourism listed companies whose offices are located in the Chinese Mainland, and it did not explore the listed companies working in Hong Kong, Macao and Taiwan, which will have a certain impact on the evolution of the overall spatial layout. In addition, small- and medium-sized enterprises in the cultural and tourism industry were not considered either, which may have an impact on the discussion of spatial balance in the cultural and tourism industry. In addition, this study did not analyze and compare the spatial evolution and impact mechanisms of different types of cultural and tourism listed companies. (3) At the end of 2022, the Chinese government ended the implementation of the isolation policy on COVID-19, setting off a wave of retaliatory tourism around China, and providing more relaxed conditions for artistic works, film and television works, which may cause subversive changes in the cultural and tourism industry. Therefore, follow-up studies may need to conduct further in-depth research from the following angles. First, build links to more attribute data and discuss the spatial differentiation in the performance, management mode and marketing characteristics of culture and tourism listed companies, to analyze the cultural and tourism industry more deeply and specifically. Second, conduct a larger sample collection to discuss the spatial differentiation and type differences of small- and medium-sized cultural and tourism enterprises or all enterprises in this industry. Last, in view of the changes in China’s cultural and tourism industry before and after COVID-19, discuss the increase and decrease in the number of cultural and tourism enterprises in different regions and the difference in profits.
Author Contributions

Conceptualization, W.H. and J.Z.; methodology, W.H.; software, W.H. and L.Z.; validation, W.H., J.Z., Y.S. and L.Z.; formal analysis, W.H.; investigation, W.H., L.Z. and Y.S.; resources, J.Z.; data curation, W.H. and J.Z.; writing—original draft preparation, W.H.; writing—review and editing, J.Z. and W.H.; visualization, W.H.; supervision, J.Z.; project administration, J.Z.; funding acquisition, J.Z. All authors have read and agreed to the published version of the manuscript.

Funding

This research was funded by the National Natural Science Foundation of China (NSFC; grant number 42271251).

Data Availability Statement

Not applicable.

Acknowledgments

The authors would like to thank the anonymous reviewers for their comments and suggestions which contributed to the further improvement of this paper, and Jingxian Pan for giving precious opinions to this study and helping with the revision of this paper.

Conflicts of Interest

The authors declare no conflict of interest.

References

  1. Han, L. On the Economic Climate of Sustainable Tourism Development in China. Nat. Resour. Sustain. Dev. 2012, 524–527, 3746–3749. [Google Scholar] [CrossRef]
  2. Zu, L. Study on the Indepth Integration of Central Chinese Culture and Tourism. In Proceedings of the 9th Euro-Asia Conference on Environment and Csr: Tourism, Society and Education Session (Pt Iii), Tokyo, Japan, 29–30 June 2013; pp. 82–88. [Google Scholar]
  3. Li, F. Culture as a Major Determinant in Tourism Development of China. Curr. Issues Tour. 2008, 11, 492–513. [Google Scholar]
  4. Liang, R.; Wang, Y.; Feng, X.; Xu, X. Analysis on the Structural Characteristics of Social Relations Network of Listed Cultural and Sports Tourism Enterprises—A Comparative Perspective Between the Same Industry and Cross Industry. Tour. Trib. 2021, 36, 14–25. [Google Scholar]
  5. Rice, M.D.; Lyons, D.I. Geographies of corporate decision-making and control: Development, applications, and future directions in headquarters location research. Geogr. Compass 2010, 4, 320–334. [Google Scholar] [CrossRef]
  6. Ma, X.; Liu, Y. Spatial and Temporal Differences and Influencing Factors of the Operating Performance of Scenic Spot Listed Companies. Econ. Geogr. 2014, 34, 194–200. [Google Scholar]
  7. Liu, W.; Xue, Y.; Zhen, Y. Research on the Relationship Between Operating Efficiency and Profitability of Cultural Tourism Listed Companies. Econ. Probl. 2017, 11, 108–113. [Google Scholar]
  8. Zhu, E. Evaluation of the Operating Performance of Cultural Industry Listed Companies—An Empirical Analysis Based on the Financial Data of 81 Companies. Tech. Econ. Manag. Res. 2017, 1, 124–128. [Google Scholar]
  9. MA, C. Grey Correlation Degree Analysis on the Operating Performance of the Tourism Listed Company in China. Adv. Appl. Econ. Bus. Dev. 2011, 209, 106–112. [Google Scholar]
  10. Wang, X.; Liang, X.; Wu, X. Research on the Driving Mechanism of Diversified M&A of China’s Tourism Listed Companies—Qualitative Comparative Analysis Based on Fuzzy Sets. Tour. Trib. 2021, 36, 52–68. [Google Scholar]
  11. Dou, R. Analysis on the Reasonable Path of Diversified Operation of China’s Media Enterprises—Empirical Analysis Based on the Data of China’s Media Listed Companies. Hubei Soc. Sci. 2021, 9, 158–168. [Google Scholar]
  12. Pang, X.; Chen, C.; Wang, H. The Impact of Social Networks on Corporate Diversification: An Empirical Study Based on China’s Tourism Listed Companies. Contemp. Financ. Econ. 2016, 10, 69–79. [Google Scholar]
  13. Du, X.; Yang, J.; Yang, Q. Empirical Study on the Interaction between Corporate Governance and Corporate Performance in Tourism Listed Companies. Rev. Cercet. Interv. Soc. 2018, 62, 114–128. [Google Scholar]
  14. Han, F.; Tian, K. Internal Control, Earnings Management and Financial Fraud—Empirical Evidence Based on Listed Companies in Cultural and Creative Industries. J. Southwest Natl. Univ. 2017, 38, 124–131. [Google Scholar]
  15. Yuan, D.; Wu, R.; Li, D.; Zhu, L.; Pan, Y. Spatial Patterns Characteristics and Influencing Factors of Cultural Resources in the Yellow River National Cultural Park, China. Sustainability 2023, 15, 6563. [Google Scholar] [CrossRef]
  16. Kuang, R.; Zuo, Y.; Gao, S.; Yin, P.; Wang, Y.; Zhang, Z.; Cai, S.; Li, N. Research on the Spatial Distribution Characteristics and Influencing Factors of Central China’s Intangible Cultural Heritage. Sustainability 2023, 15, 5751. [Google Scholar] [CrossRef]
  17. Luo, Z.; Cheng, Q.; Lin, M. Spatiotemporal Development Patterns and Influencing Factors of Theme Parks in China. Geogr. Geo-Inf. Sci. 2022, 38, 135–142. [Google Scholar]
  18. Kang, J.; Zhang, J.; Hu, H. Analysis of spatial distribution characteristics of traditional villages in China. Adv. Geogr. Sci. 2016, 35, 839–850. [Google Scholar]
  19. Chen, J.; Liu, D.; Zhou, Y. Analysis of the spatial distribution and causes of traditional villages in the Jialing River Basin. Econ. Geogr. 2018, 38, 148–153. [Google Scholar]
  20. Zhao, L.; Zhao, Z. Research on Spatial Differentiation of China’s Economy Based on Characteristic Ellipse. Geogr. Sci. 2014, 34, 979–986. [Google Scholar]
  21. Wang, J.; Xu, C. Geodetector: Principles and Prospects. Acta Geogr. Sin. 2017, 71, 116–134. [Google Scholar]
  22. Wang, P.; Zhang, J.; Sun, F. Spatial Distribution Characteristics and Influence Mechanism of Traditional Villages in Southwest China. Econ. Geogr. 2021, 41, 204–213. [Google Scholar]
  23. Tong, Y.; Long, H. The Spatial Differentiation Factors of Guizhou Traditional Ethnic Villages. Econ. Geogr. 2015, 3, 132–137. [Google Scholar]
  24. Li, L. Thinking about the Existing Problems in the Development of Cultural Tourism Resources. Bus. Cult. 2008, 1, 318. [Google Scholar]
  25. Li, X.; Cui, M. Research on the Current Situation and Countermeasures of Theme Park Development in China. J. Jiujiang Univ. 2005, 3, 63–66. [Google Scholar]
  26. Tang, J. Present Situation, Problems and Development Conception of Tourism Resort in China—A Case Study of South Jiangsu. Master’s Thesis, Nanjing Normal University, Nanjing, China, 2002. [Google Scholar]
  27. Wang, X. The Only Way for Leisure Holiday Tourism in China: From “Golden Week” to Paid Vacation. J. Tour. 2002, 4, 51–55. [Google Scholar]
  28. Lin, L. Overall Promotion of the Construction of the Chengdu-Chongqing Economic Zone. Econ. Syst. Reform 2012, 1, 12–14. [Google Scholar]
  29. Liu, S.; Wang, Y.; Hu, A. The Effect of Western Development and China’s Regional Economic Convergence. Econ. Res. 2009, 44, 94–105. [Google Scholar]
  30. Marcato, G.; Milcheva, S.; Zheng, C. Urban Economic Openness and IPO Underpricing. J. Real Estate Financ. Econ. 2018, 56, 325–351. [Google Scholar] [CrossRef]
  31. Zhong, Y.; Fu, Y.; Guo, W. Research on the Evolution of the Spatial Pattern of Headquarters of Chinese Listed Companies and Its Driving Factors. Sci. Geogr. Sin. 2018, 38, 485–494. [Google Scholar]
  32. Zhu, L.; Zhou, Y.; Ma, H. Analysis of the Coupling and Coordination between Provincial Tourism Public Services and Tourism Efficiency in China. Econ. Probl. 2020, 11, 95–102. [Google Scholar]
  33. Han, H.; Yang, C.; Song, J. Spatial pattern evolution and location selection factors of Beijing wholesale enterprises. Acta Geogr. Sin. 2018, 73, 219–231. [Google Scholar]
  34. Wang, L.; Mao, Y. A Study on the Dynamic Change of Capital Structure and Its Target Adjustment: Empirical Evidence from Listed Companies in Jiangsu Province. Financ. Account. Mon. 2015, 11, 52–57. [Google Scholar]
  35. Hu, C.; Sun, J.; Wang, T. Infrastructure, City Size, and Urban Economic Growth in the Metropolitan Belt: A Comprehensive Analysis Framework for Mediation and Regulation Effects. China Soft Sci. 2020, 10, 85–95. [Google Scholar]
  36. Pan, F.; Liu, Z.; Xia, Y. The Location Distribution and Agglomeration Characteristics of Chinese Listed Enterprise Headquarters. Geogr. Res. 2013, 32, 1721–1736. [Google Scholar]
  37. Meng, D.; Wei, G.; Sun, P. Analyzing the Characteristics and Causes of Location Spatial Agglomeration of Listed Companies: An Empirical Study of China’s Yangtze River Economic Belt. Complexity 2020, 2020, 8859706. [Google Scholar] [CrossRef]
  38. Li, S.; Sun, H.; Liu, S. The Spatial and Temporal Evolution of China’s New Physical Bookstores in the Last 20 Years and Its Influential Factors—Analysis Based on the Data of Sisyphus, Yanjiyou and Maokong. Econ. Geogr. 2020, 40, 67–73. [Google Scholar]
Figure 1. Evolution trend of the total number of Chinese culture and tourism listed companies in 1992–2021.
Sustainability 15 07686 g001
Figure 2. Evolution trend of the increments in culture and tourism listed companies in China in 1992–2021.
Sustainability 15 07686 g002
Figure 3. Kernel density distribution of culture and tourism listed companies in China in (a) 1996, (b) 2001, (c) 2006, (d) 2011, (e) 2016 and (f) 2021.
Sustainability 15 07686 g003aSustainability 15 07686 g003b
Figure 4. Changes in the standard deviation ellipse and center of gravity distribution.
Sustainability 15 07686 g004
Figure 5. Results of single factors affecting the distribution of culture and tourism listed companies in China.
Sustainability 15 07686 g005
Table 1. Parameters of SDE.
YearCenter of Gravity LatitudeCenter of Gravity LongitudeArea (km2)Angle θ (°)
1996115.26° E29.83° N2,312,933.3658.43
2001115.06° E30.57° N2,314,139.1221.00
2006115.01° E30.64° N2,317,867.6921.90
2011115.15° E30.75° N2,154,279.0217.70
2016115.49° E30.90° N2,136,549.6015.69
2021115.50° E31.20° N2,407,368.257.72
Table 2. Index of spatial distribution driving factors of culture and tourism listed companies in China.
Target LayerDetection FactorRepresentative Indicator
Cultural tourism developmentTourism resource abundanceNumber of scenic spots of 3A and above (X1)
Tourism resource endowmentScenic spot quality score (X2)
Economic locationDegree of economic developmentGDP(X3)
Openness levelRanking of urban openness (X4)
Financial environmentNumber of financial industry employees (X5)
Public servicesAccommodation service levelNumber of star-rated hotels (X6)
Level of developed communicationTelecommunication business revenue (X7)
Traffic service levelAirport passenger throughput (X8)
Policy supportLand price levelCommercial land price (X9)
Government financial strengthLocal financial expenditure (X10)
Table 3. Results of the interactions between factors affecting the distribution of culture and tourism listed companies in China.
X1X2X3X4X5X6X7X8X9
X20.823 *
X30.596 *0.924 *
X40.767 ^0.788 *0.734 *
X50.818 *0.810 *0.808 *0.801 *
X60.616 *0.894 *0.662 *0.783 ^0.841 *
X70.602 *0.937 *0.582 *0.729 *0.814 *0.657 *
X80.811 *0.961 *0.824 *0.842 *0.886 *0.820 *0.829 *
X90.807 *0.865 *0.730 *0.628 *0.846 *0.888 *0.732 *0.914 *
X100.825 *0.882 *0.799 *0.796 *0.842 *0.839 *0.813 *0.829 *0.829 *
Note: * refers to two-factor enhancement, and ^ refers to nonlinear enhancement. X1—number of scenic spots of 3A and above; X2—scenic spot quality score; X3—GDP; X4—ranking of urban openness; X5—number of financial industry employees; X6—number of star-rated hotels; X7—telecommunication business revenue; X8—airport passenger throughput; X9—commercial land price; and X10—local financial expenditure. Shading: red—q > 0.9; green—0.9 > q > 0.8; and blue—0.8 > q > 0.
Disclaimer/Publisher’s Note: The statements, opinions and data contained in all publications are solely those of the individual author(s) and contributor(s) and not of MDPI and/or the editor(s). MDPI and/or the editor(s) disclaim responsibility for any injury to people or property resulting from any ideas, methods, instructions or products referred to in the content.