Abstract
This study was designed to assess the long-run association between the Kingdom of Saudi Arabia (KSA) and world export fertilizer (urea and DAP) prices. It also aims to disclose the effect of KSA fertilizer export quantities on global food security. KSA and world fertilizer prices and quantities were collected from various sources for the period ranging from 2002 to 2020. The results from the autoregressive distributed lag bounds and Engle–Granger two-step procedure tests discovered that there are long-run associations between KSA and world urea and DAP prices, respectively. Fully modified ordinary least squares and dynamic ordinary least squares model results were compatible with the results of the autoregressive distributed lag model. From the ECM results, the coefficient of adjustment parameter for KSA urea and DAP prices (as a dependent variable) proved positive and insignificant, leading to the conclusion that the model was powerless to right its previous time instability. This may be due to the short time interval of the series under study, and indicate that it requires more than 12 months to return to its long-run equilibrium. Likewise, the results showed that KSA fertilizer (urea and DAP) export quantities have a positive, highly significant impact on world urea and DAP export quantities. Reference to forecasting analysis results, the growth rates of urea exports quantities equal to 0.002 and 0.004 for the period from 2002 to 2018 and from 2019 to 2026, respectively. In addition, the growth rates of DAP export quantities equal to 0.45 and 0.07 for the period 2002 to 2018 and for the forecast period 2019 to 2026, respectively. With reference to KSA fertilizer exports, the importer countries rank among the main countries producing wheat, sorghum, maize, rice, and millet (chief food crops) in the world, showing that the KSA fertilizer (urea and DAP) export quantities contribute directly to global food security through fertilizer exportation and indirectly through the contribution of the importer’s countries in production of chief food crops. Recommendations drawn from the results are to increase the contribution of the KSA to global food security through lowering the time required to absorb fertilizer price shocks in the world (less than 12 months) and increase the KSA’s fertilizer export quantities.
1. Introduction
Food security is defined by the FAO as “existing when all people, at all times, have physical and economic access to sufficient, safe, and nutritious food that meets their dietary needs and food preferences for an active and healthy life” [1,2]. This definition involves the broad concept of food security, which is categorized by four pillars linked to availability, access, utilization, and stability [2,3,4,5]. The pillars are interconnected with agricultural innovation [4,6], social capital [4,7], kitchen equipment [4,8], and worldwide shocks [4,9].
The FAO definition has been refined [10,11,12,13]; accordingly numerous methodological measures of food security have been settled [10,14,15,16]. The Food Insecurity Experience Scale (FIES) assesses food insecurity through the survey respondents’ “lived experience” of food access [10]. The FIES is globally adjusted to safeguard cross-country comparison and has appeared as a chief pointer of food insecurity [10,17]. Under the official SDG indicator framework, the FIES-based estimate of the incidence of moderate or severe food insecurity in a nation’s population underpins the second United Nations Sustainable Development Goal (SDG 2) to end hunger and all resulting malnutrition by 2030 [10,18]. The FIES is used by many scientists [19,20,21]. The Global Food Security Index (GFSI) is an indicator of national-level food security and has been recorded since 2012 [10,22]. The GFSI is constructed upon 34 single indicators across three theoretical pillars of food security: availability, affordability, and safety [10,23]. The GFSI is applied by numerous scientists [24,25].
Increasing awareness about the global food security issue is linked to the substantial rise of the world population, the limited resources available to produce enough food [26,27,28], and climate change. According to the forecast of the United Nations [29,30], the worldwide population will peak at 9.8 billion in 2050; accordingly, food demand will growth by more than 50%, leading to a food crisis [29,31]. On the other hand, food insecurity may be a consequence of the unavailability of food, unsatisfactory buying power [27,32], and inefficient delivery and use of food [27,33]. Poverty [27,34], natural disasters [27,33,35,36], political violence, and geopolitical issues lead to an uneven supply of food worldwide [27,37].
Outline food security will be a global contest in the coming years [38,39,40]. The global food trade is important to the food security issue resulting from the growth of globalization [40,41]. The global trade includes food production inputs such as fertilizers. Due to the diversification of food production, consumption and resource donation levels between counties, the worldwide trade has developed to regulate the disconnection between supply and demand beside maintaining utilization of resources [40,42,43].
Availability of food is a key determinant of food security [44]. In order for food to be available, agriculture production must be increased. Factors of production (such as fertilizers, labor), climate change, institutional and policy innovation, and technological progress are factors influencing grain production [29,45,46]. Nutrients sourced from chemical fertilizer are critical to increase agricultural production by enhancing the land’s productivity [47]. Fertilizer is considered an important tool to augment food production [48]. Food prices are a vital factor in the food security equation [44]. Stable prices enhance food security, while price instability and volatility can contribute to exacerbating food crises. Instability of fertilizer prices leads to instability of food production and prices. Instability of food production directly affects the food security situation, while the fertilizer prices indirectly affect food security. The author states that, in reference to availability of food, food security can be defined as the situation when the markets of all production inputs of food (including fertilizer) are well integrated (i.e., prices are stable).
Fertilizers are important to ensure crops receive adequate nutrients, to promote growth, and to confirm a moral yield. Urea ammonium phosphate and diammonium phosphate (DAP) are extracted from phosphoric acid, which is the main raw material [49].
Market integration and food security: market integration shows the degree to which actions in one market segment influence actions elsewhere in the same market [50,51]. Integrated markets are defined as markets in which the price of differentiated products does not operate separately [52,53]. If prices in one market align with price shock waves in other markets, then the markets are complementary [51]. This means that the activities or the mechanisms of market integration tend to create price stability and equilibrium between the markets. The mechanisms of market integration can be simply illustrated by the movement of the food (product) from a surplus market to a deficit one [50], leading to attainment of food security. Thus, knowledge of market integration or the relationship between different markets can consequently play a vital role in understanding food security [5].
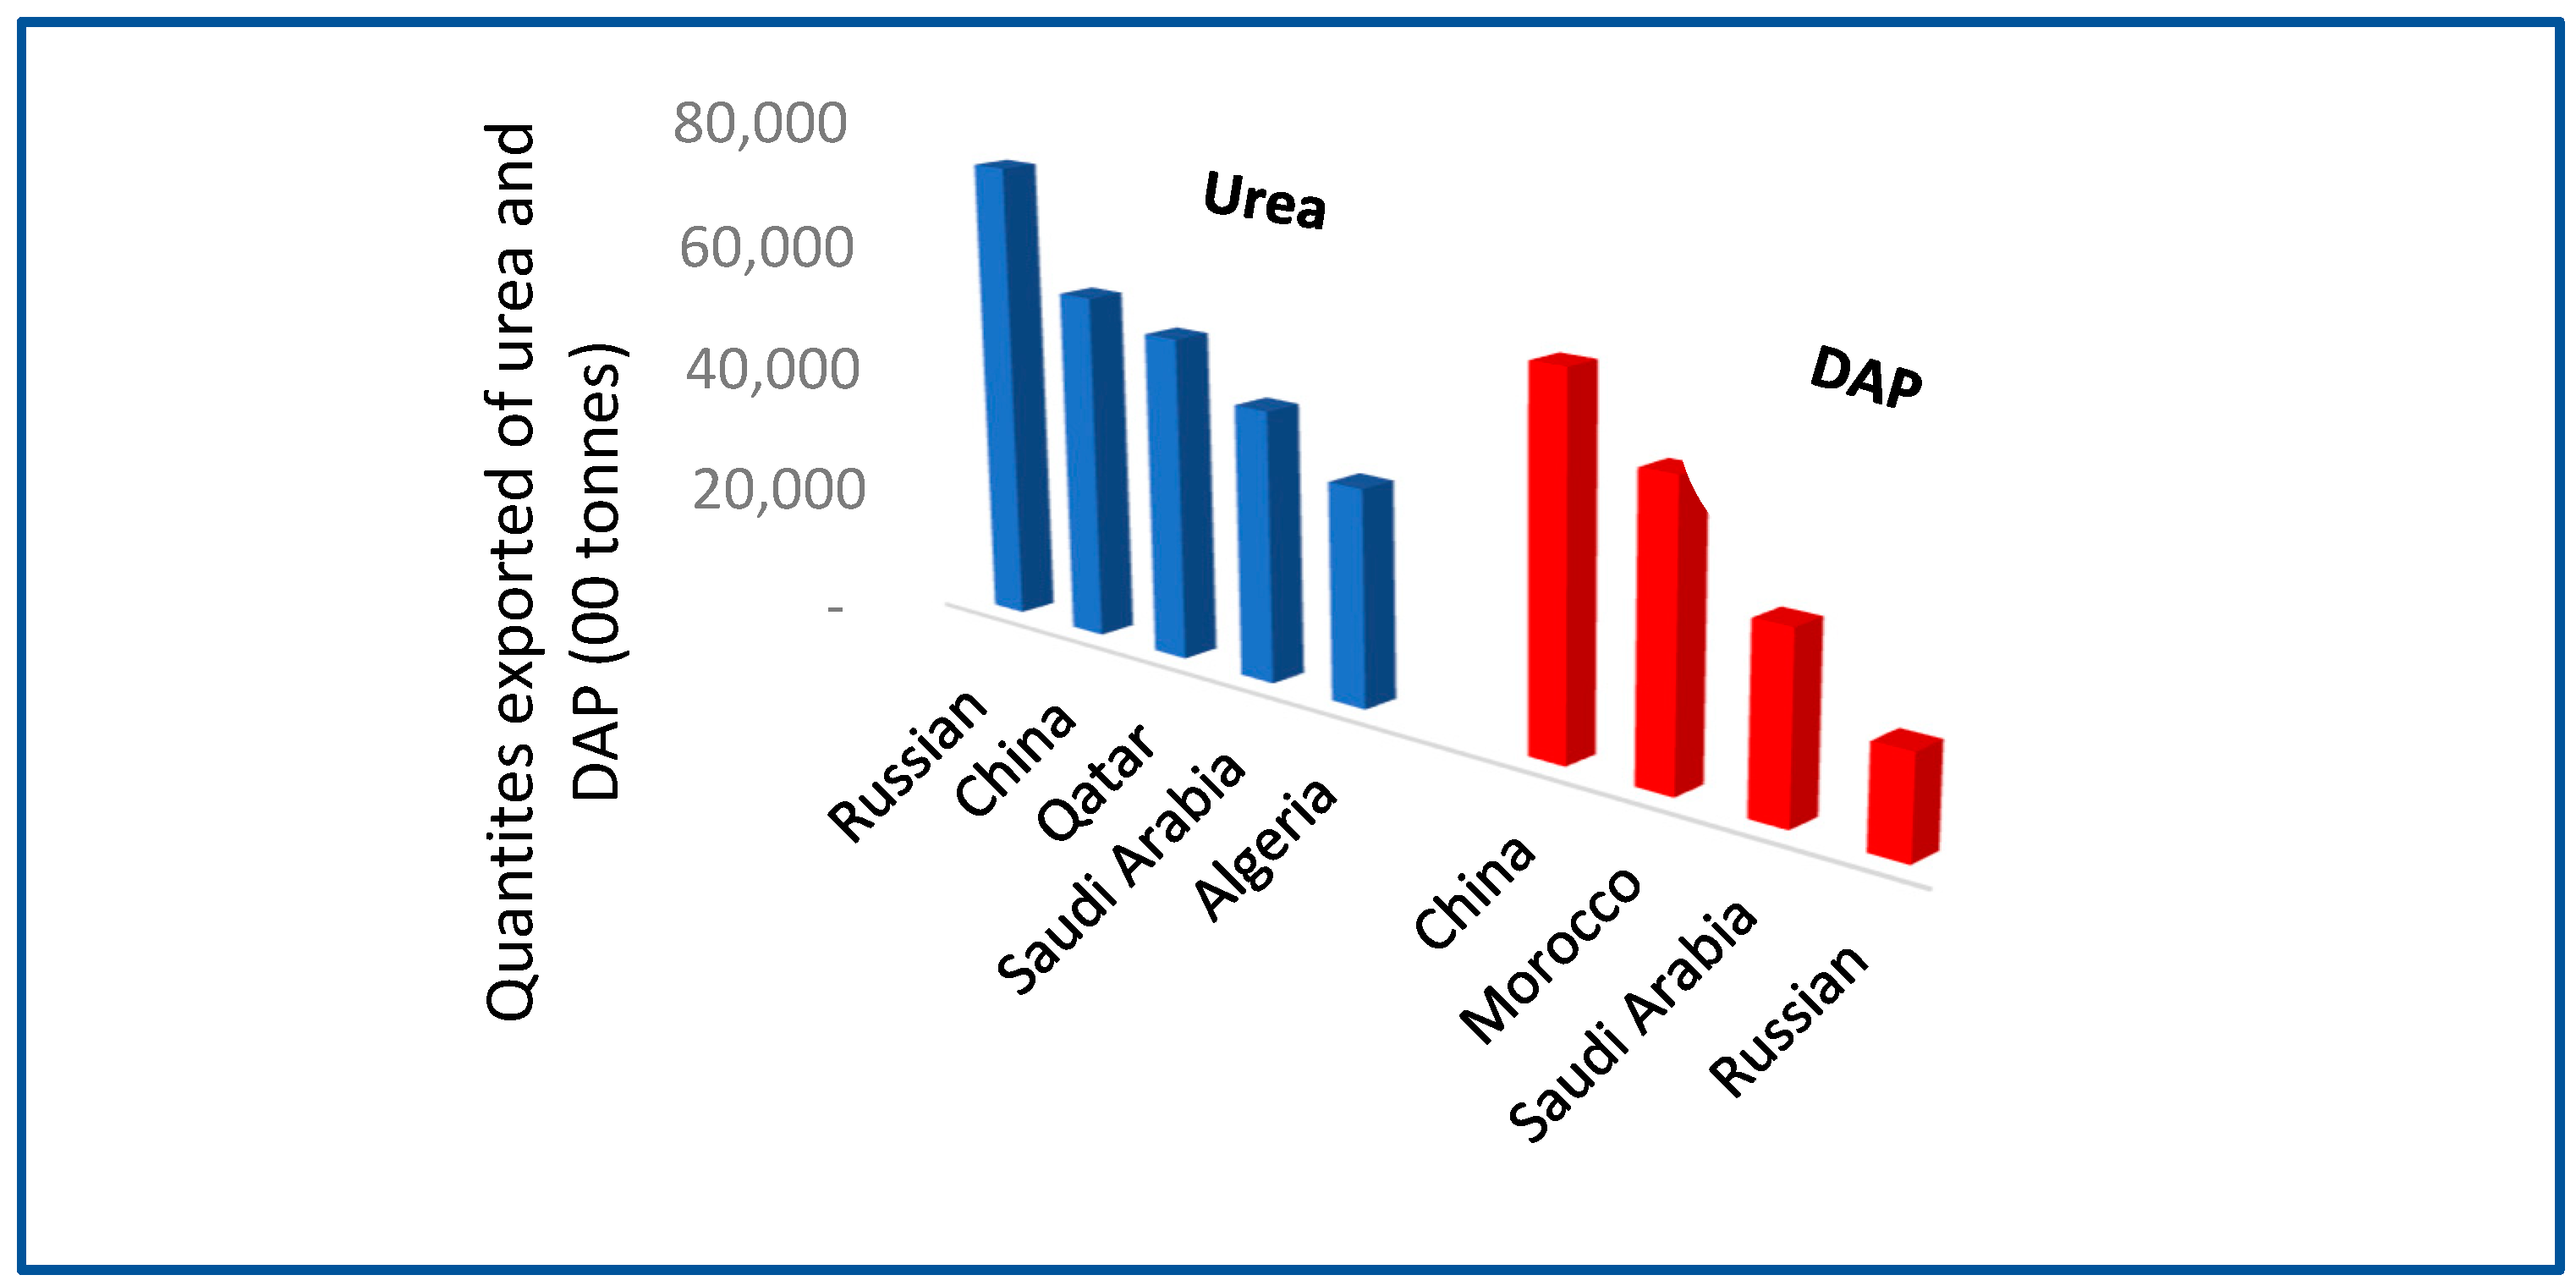
KSA fertilizer: Regarding non-oil exports in the KSA, the petrochemical sector is considered a major contributor to the KSA economy [54]. The sector (production and export) is anticipated to increase in the following years, in line with the KSA Vision 2030 [55] strategy [56]. Urea and DAP fertilizers are petrochemical products. Urea is used globally and is economic compared to other nitrogenous fertilizers [57]. DAP offers the appropriate nutrients required for farming vegetables, wheat, barley, and other crops [58]. The KSA is considered one of the main exporters of urea and DAP [59]. Figure 1 shows that the KSA is ranked fourth and third regarding urea and DAP fertilizer export quantities, respectively.
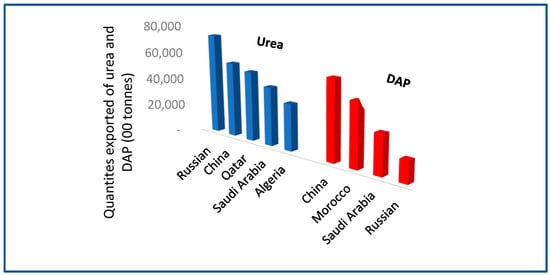
Figure 1.
Top countries exported urea and DAP fertilizer (00 tonnes) in 2020. Source: Constructed by author.
The significance of this study emerged from its objectives; to assess the relationship between KSA and world fertilizers (urea and DAP) and to disclose the impact of KSA fertilizer (urea and DAP) exports on global food security. Few studies consider fertilizer, in spite of its vital role in food security. Hence, this study’s intent is to enrich the literature on this topic.
The study is organized as follows: The first section is an introduction to the concept of food security and market integration, and the link between them; the importance of fertilizer and the KSA fertilizer positionality are also mentioned. In the second section, the research methods are covered. The third section contains the results and discussion. A discussion, conclusion, and recommendation are found in the fourth section.
2. Materials and Methods
2.1. Data Description
To shed light on the extent of cointegration between KSA and world fertilizer export prices and to cover the impact of KSA fertilizers on global food security, KSA and world fertilizer export prices were collected for the period from 2002 to 2020 [60]. The fertilizer export quantities from the KSA and elsewhere in the world were also collected for the period of the study [59]. The EVIEWS 9 program was used to analyze the data. The information about such data is presented in Table 1.

Table 1.
Variables description.
2.2. Analysis Methods
2.2.1. Cointegration Tests: Testing Long-Run Association (ARDL Bounds Test)
- Unit root test: [61,62] state the following equation to test the order of integration of the series under study, using the ADF test:where B1 and B2 are ADF coefficients to be valued, b is the trend, C is the constant, e is error term, and t is the time selected. In testing the null hypothesis (H0), X has a unit root against alternative hypothesis (H1), X has a stationary. The series variables are stationary if the t-statistic of the ADF coefficient is greater than t-critical values.
- 2.
- The autoregressive distributed lag (ARDL bounds test): To test long-run association between the series, the ARDL model test was applied. The ARDL test is efficient for small observations of time series and used irrespective of the series order I(0) and I(1) but not I(2). The following equations were used [62,63]:where from Equations (3) and (4), a1, a2—coefficients of the difference of lag independent variables; b1, b3—coefficients of lag dependent variable; b2, b4—coefficients of lag independent variable, respectively; E1, E2—error terms.
ARD tests were used to examine the existence of long-run association between the series; with acceptance of null hypnosis, indicating no long-run association (null hypothesis: b1 = b2 = 0 against alternative hypothesis b1 ≠ b2 ≠ 0 in Equation (3). A similar test was applied for the Y variable as dependent variable (null hypnosis: b3 = b4 = 0 against alternative hypothesis b3 ≠ b4 ≠ 0 in Equation (4)).
The cumulative sum (CUSUM) method was used to test the stability of the ARDL model estimates [64]. The estimated coefficients are steady if the residual is located within the 5% critical boundaries, indicating a 5% level of significance. If the two equations (Equations (3) and (4)) have lower and upper bound (two critical F-values), they confirm the integrated order (1(0) and 1(1) of the variables, respectively [63].
To approve the outcomes of ARDL statistics, dynamic ordinary least squares (DOLS) and fully modified ordinary least squares (FMOLS) models were used [65]. The FMOLS and DOLS model outcomes give reasonable valuations of long-run associations between the series. Likewise, these methods have ability to accurately reveal the serial correlation problem occurring between a variable and its lag.
- 3.
- Error correction model (ECM): The ECM test is applied to measure the speed parameter of the short-run relationship between two series [66]. It is run when the cointegration test appears to show a long-run association between the series. The ECM equations are the followings [62]:where b5 and b8: coefficients of difference of lag dependent variable; b6 and b9: coefficients of difference of lag independent variable; b7 and b10: speed of adjustment (this necessarily must be negative and significant to accurately show model instability); SU: KSA urea export quantities; WU: world urea export quantities; V1 and, V2: error correction terms; U1 and U2: error terms.
Using residual diagnostics tests, ECM feasibility was estimated using the following.
Breusch–Pagan–Godfrey test of heteroscedasticity: In this test, the null hypothesis is homoscedasticity and the alternative hypothesis heteroscedasticity. The null hypothesis is accepted when the p-value is more than 0.05, indicating that the residual is homoscedasticity.
Residual normality test: The residual is normally distributed once the probability of the Jarque–Bera statistic is higher than 0.05.
2.2.2. Cointegration Tests: Testing Long-Run Association (Engle–Granger Test)
To conduct the cointegration test through Engle–Granger test, order of integration of the series must be specified first (same order of integration 1(1)). Then, the Engle–Granger test can be directed [1,35]. The method includes the followings stages:
- The regression equations are as follows:where b11 and b12 are the slopes coefficient estimate from Equations (7) and (8), respectively.
- The ADF test is applied on the residuals (zt1 and zt2) examining whether the series are connected. If the ADF statistics are negative and greater than the critical t-value (of order 1), then it is predictable that the coefficient b11 and b12 exit (b11 and b12≠ 0) and the series are cointegrated. Accordingly, the series is integrated of order 1,1.
- Error correction model (ECM)
The ECM test is applied to measure the rapidity parameter of the short-run relationship among the binary series [66]. It is run when the cointegration test shows long-run association between the series. The ECM equations are:
where b13 and b16: coefficients of difference of lag dependent variable; b14 and b17: coefficients of difference of lag independent variable; b15 and b18: speed of adjustment (necessity be negative and significant to accurate model instability); SD: KSA urea export quantities; WD: world urea export quantities; V3 and V4: error correction terms; U3 and U4: error terms.
Additionally, the ECM viability was checked by testing residual diagnostics tests as mentioned earlier.
2.2.3. Regression Test
Simple regression model analysis was used to evaluate the influence of KSA fertilizer export quantities (urea and DAP as independent variable) on world fertilizer export quantities (urea and DAP), using the following equations:
where WUQ and SUQ are export quantities of urea from the world and the KSA, respectively (Equation (11)). WDQ and SDQ are export quantities of DAP from the world and the KSA, respectively (Equation (12)); b19 and b20 = coefficients to valued; C = constant and e = the error term; L = logarithm.
2.2.4. Forecasting Analysis
Forecasting analysis was applied to KSA fertilizer export quantities (urea and DAP). Similarly, the KSA fertilizer (urea and DAP) growth rate was computed for the period from 2002 to 2018 and for the period 2019 to 2026 (forecasting period). The growth rate was calculated using the following equation [62]:
where Gt represent growth rate between two sequential years. F represents KSA quantities of fertilizer export (urea and DAP) and t = year. Then, the growth rate of urea and DAP was enumerated for the period from 2002 to 2018 and for the period 2019 to 2026 as following [62]:
where and n represent growth rate for a specific period and number of years, respectively. The models of forecasting were checked by different forecasting accuracy indicators: mean squared error (MSE), alpha, beta, and gamma. MSE is the average of the squared differences between the original and forecast values in the dataset. It measures the variance of the residuals. Alpha is used to test the smoothing of data points. Beta measures trend value. Gamma measures seasonality value. The accuracy values for alpha, beta, and gamma are between 0 and 1.
2.2.5. The Impact of KSA Fertilizer on Global Food Security: Qualitative Analysis
Based on the results of market integration, regression analysis and KSA fertilizer export to global market, the qualitative analysis was run. In addition, the qualitative analysis was dig dipper through analysis of the contribution of the importer’s countries of KSA fertilizers on the global production of staple food crops (wheat, sorghum, maize, rice, and millet).
3. Results
The study was directed to disclose the cointegration relationship between KSA fertilizer prices and world fertilizer prices and reveals the impact of KSA fertilizer on global food security. Accordingly, it involves two portions: one regarding the cointegration relationship between KSA fertilizer prices and world fertilizer prices, and the other concerning the impacts of KSA fertilizers on global food security. Urea and DAP fertilizers were the focus of this study.
3.1. Part One: Cointegration Test Analysis Results (KSA Urea and World Urea)
3.1.1. The Results of Unit Root Tests
Using the unit root test, the stationarity of KSA and world urea fertilizers prices were analyzed. The ADF statistics were detected as significant (10 and 1% levels) at level and first difference, indicating that the two series are stationary at 1(0) and 1(1), respectively, (Table 2). The two series did not show the same stationary order; accordingly, the ARDL bounds test was selected to assess the association among them.

Table 2.
Unit root test results.
3.1.2. Results of ARDL Tests
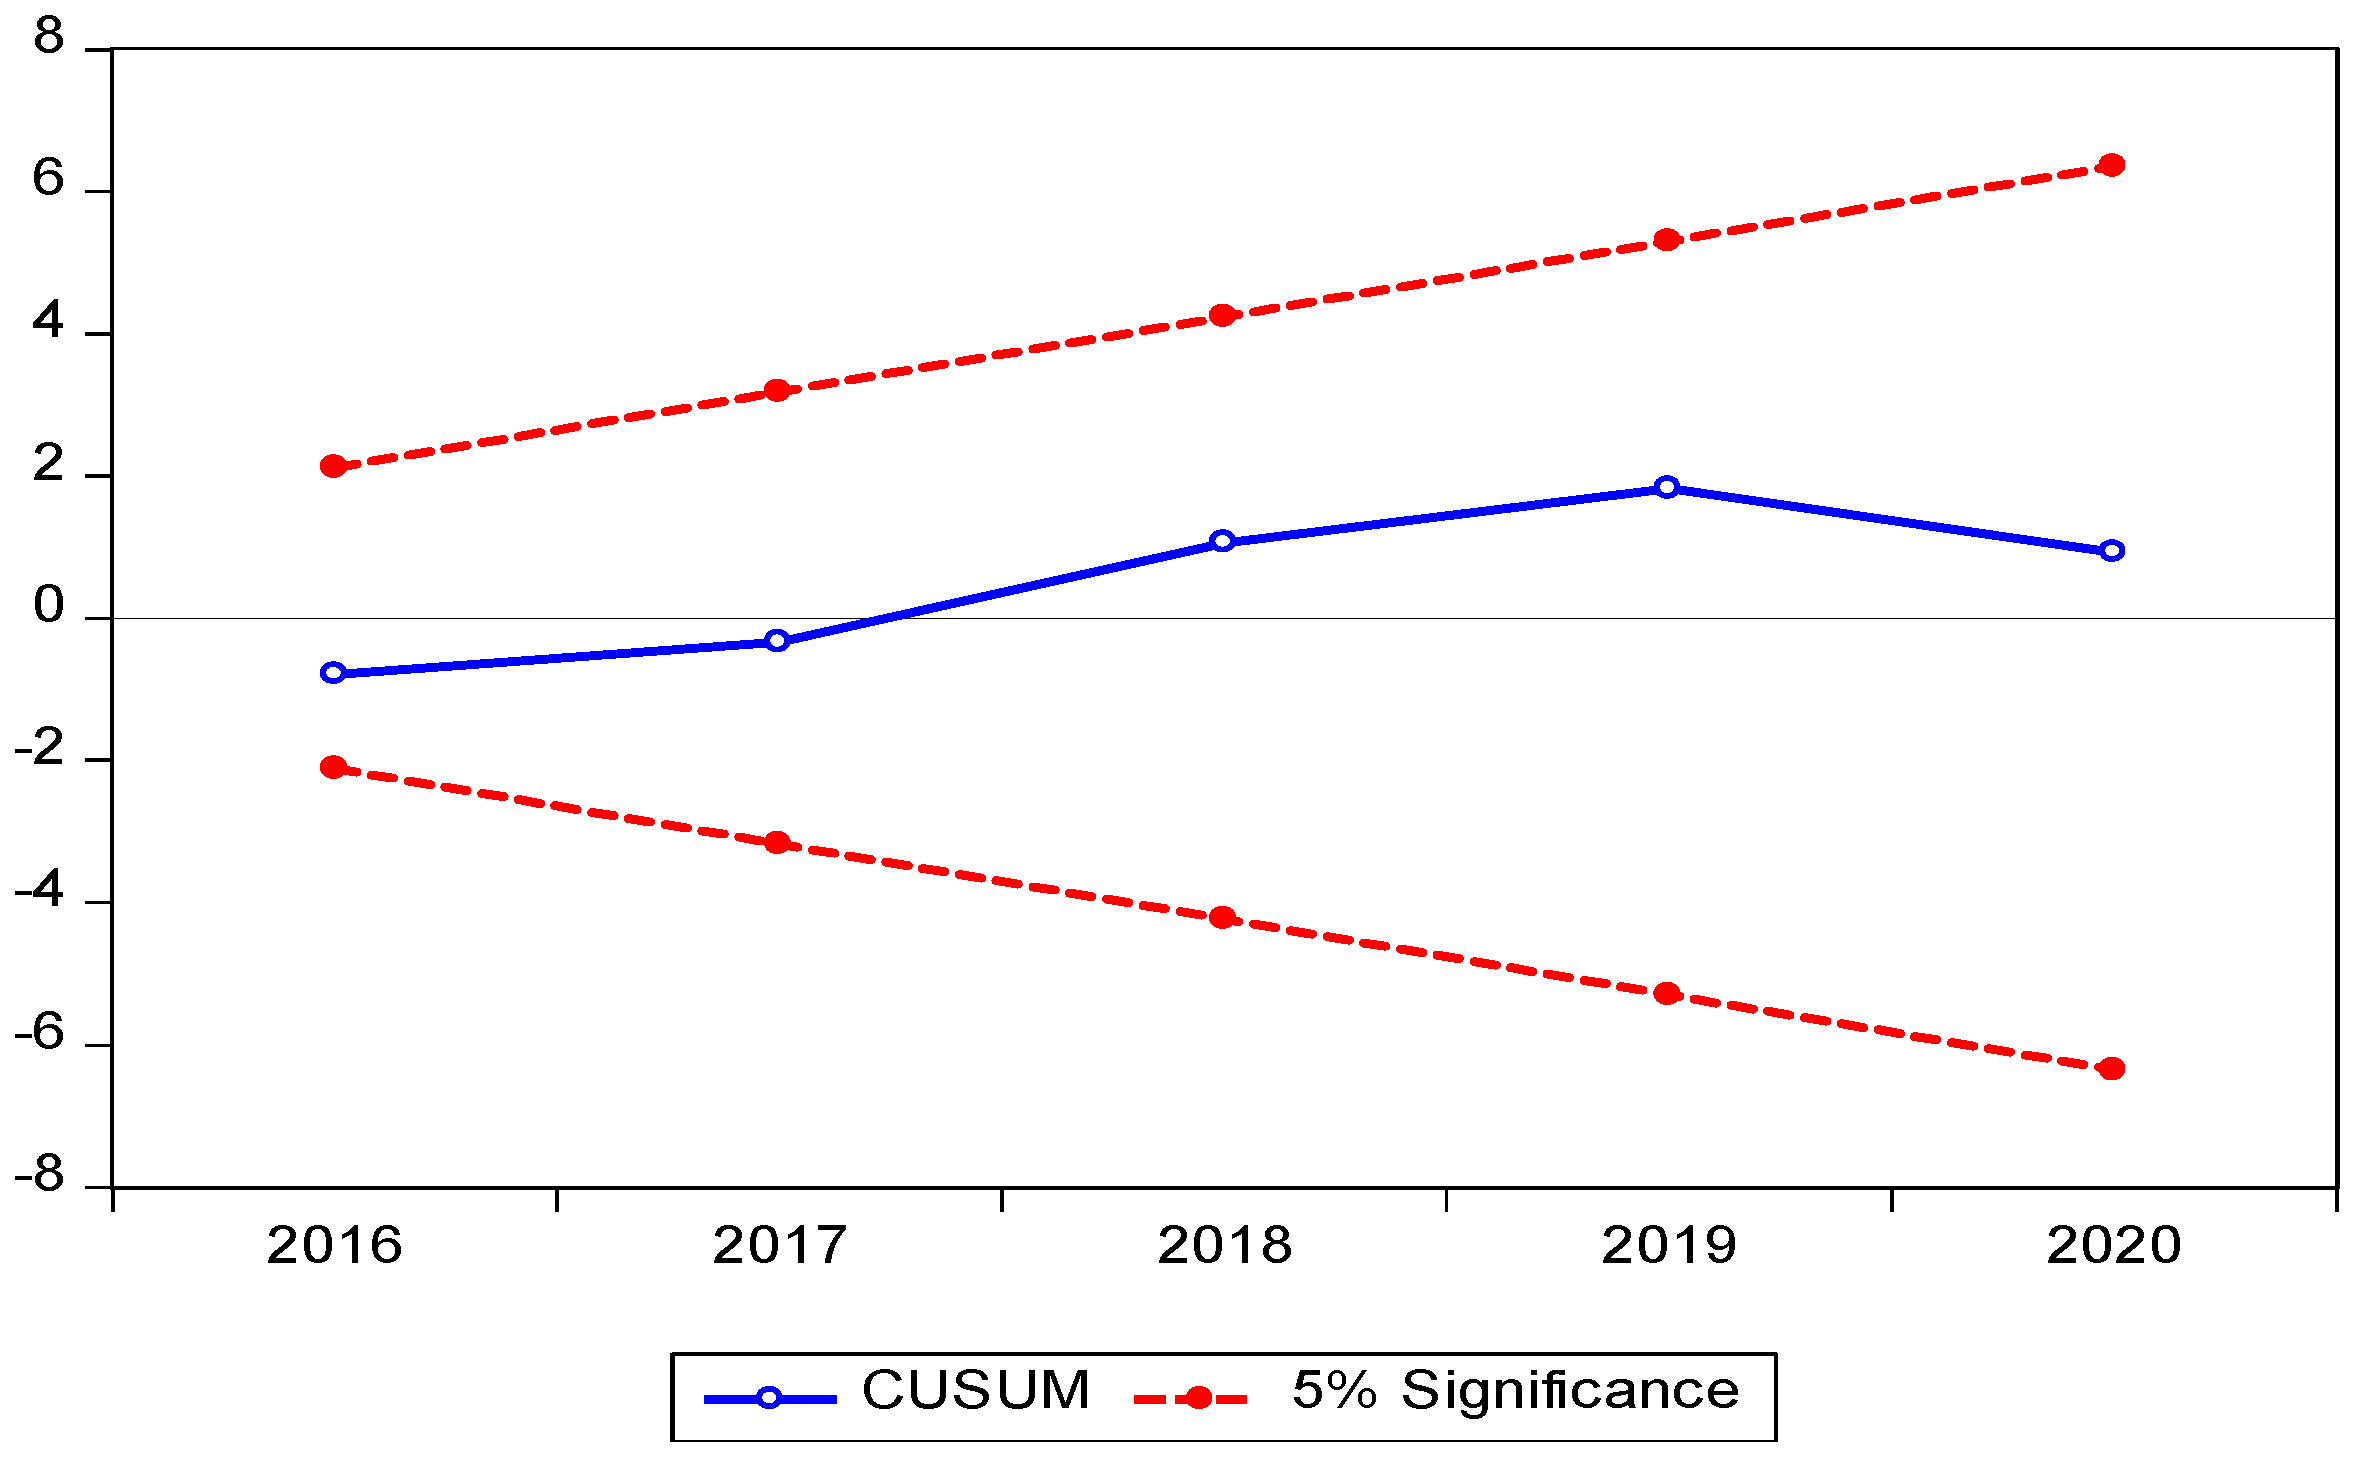
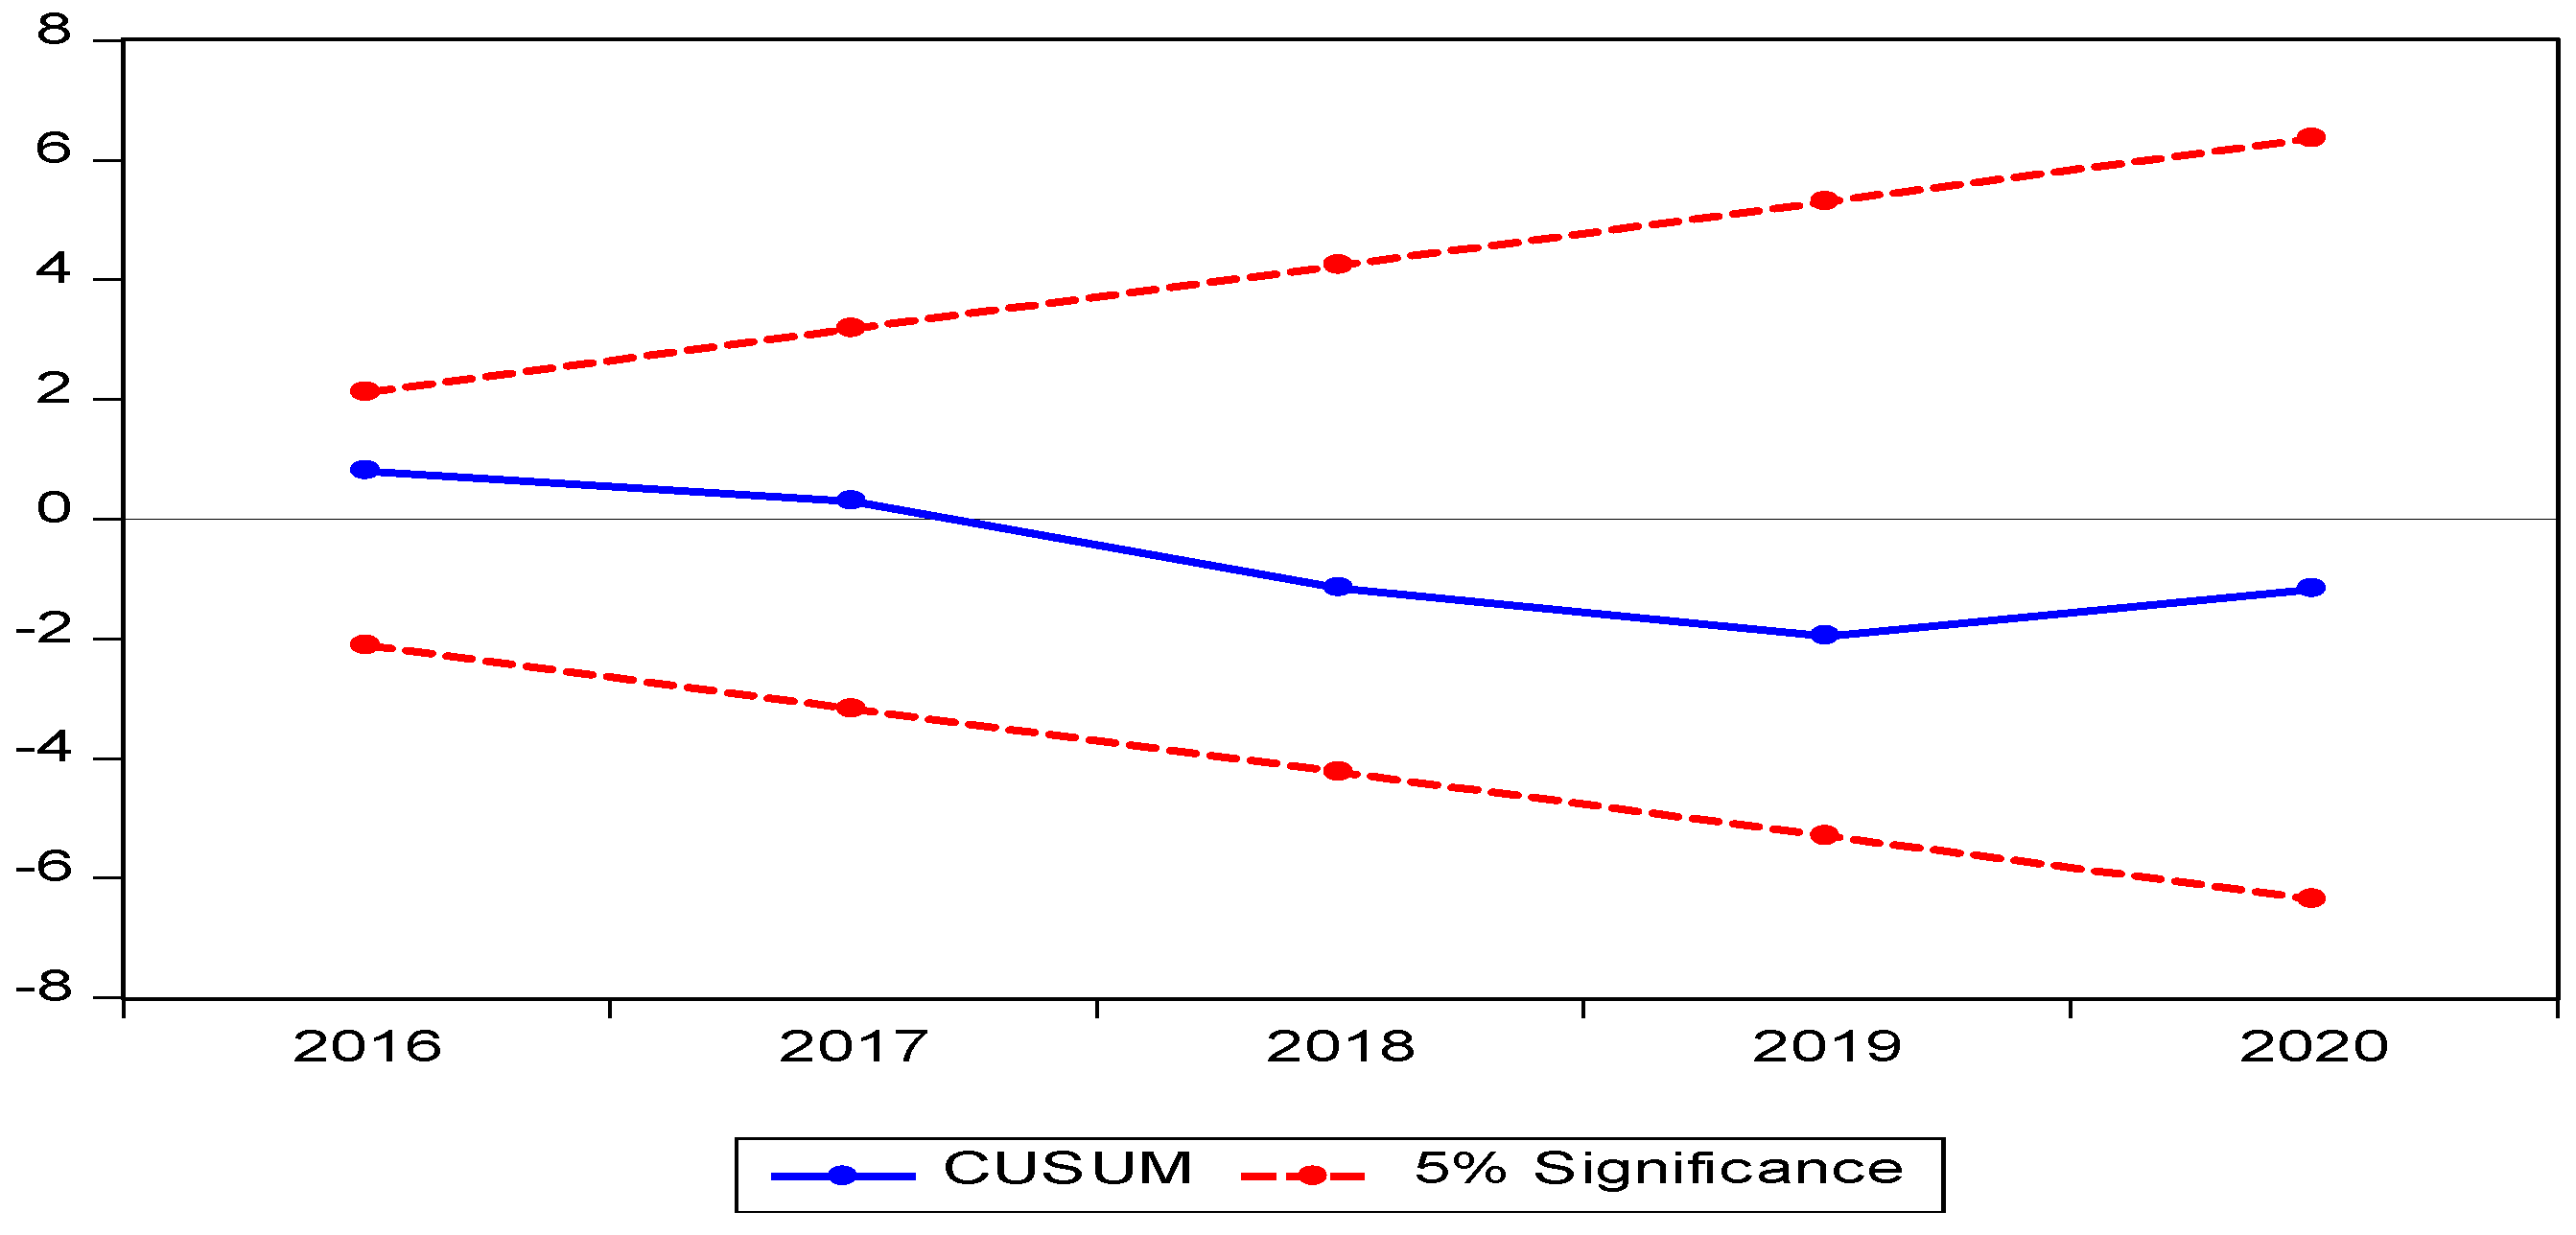
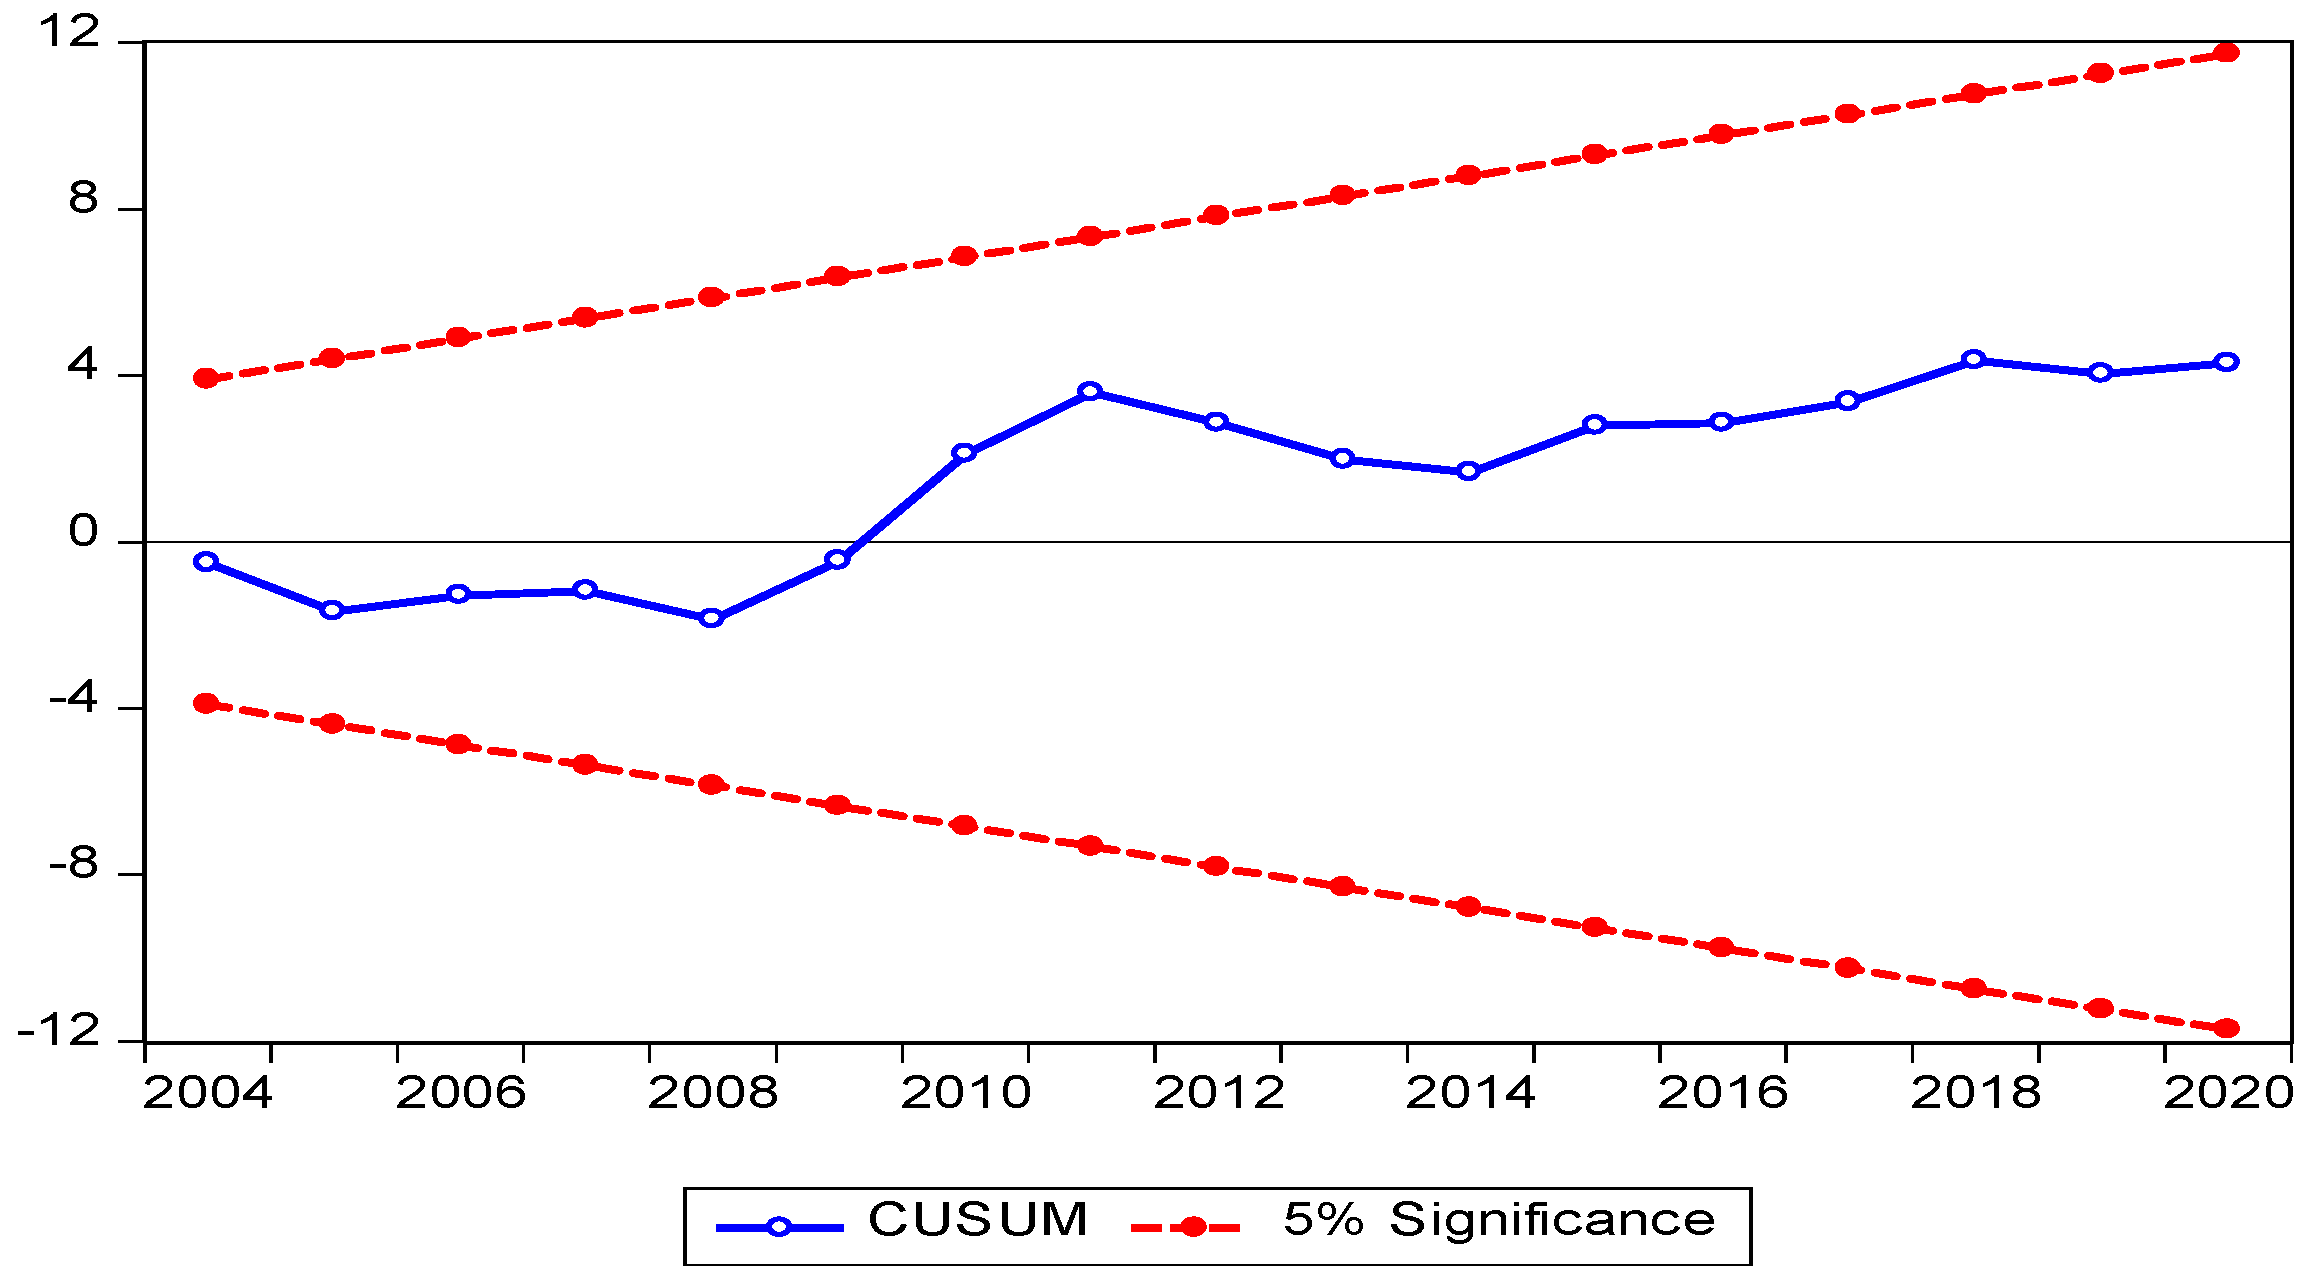
The results of ARDL tests are presented in Table 3. To assess the ARDL model suitability, residual diagnostics pointers were used. The serial correlation LM test, Breusch–Godfrey, Breusch–Pagan–Godfrey heteroscedasticity test, and Jarque–Bera test showed no serial correlation, no heteroscedasticity, and residual normal distribution, respectively. Likewise, a CUSUM test was run to examine stability diagnosis [67]. As can be seen in Figure 2 and Figure 3, the test showed the stability of the cumulative sum of the recursive residuals, confirming the strength of the model.

Table 3.
Results of ARDL tests.
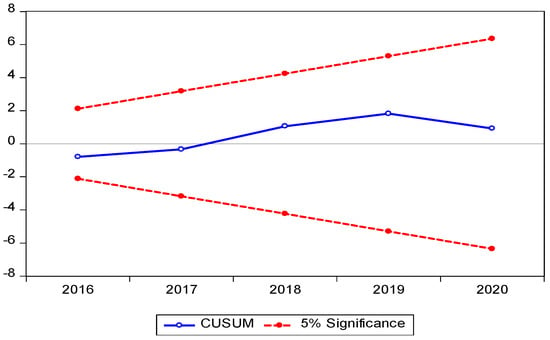
Figure 2.
Stability diagnostic (SU as dependent variable). Source: Author calculations based on collected data.
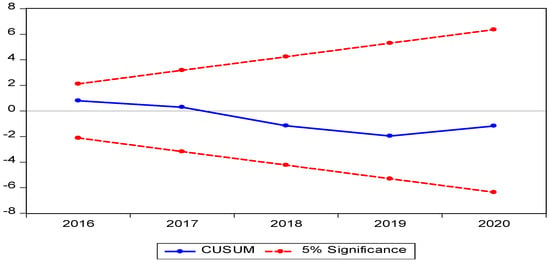
Figure 3.
Stability diagnostic (WU as dependent variable). Source: Author calculations based on collected data.
Table 4 shows the bound test outcomes for the ARDL models (1 and 2). In Model 1, the bound used was the F-test for the coefficients of KSA urea prices (one lag period) and world urea prices (independents variable). Similarly, in Model 2, the bound was the F-test for the coefficients of world urea prices (one lag periods) and KSA urea prices (independents variable). The F-statistics are 14.970 and 12.067 for Models 1 and 2, respectively, which are higher than upper bound of the bounded critical F-statistic (5.58) at 1%, signifying there is a long-run association between KSA urea prices and world urea prices throughout the period under study.

Table 4.
Results of bounds test: ARDL.
3.1.3. Long-Run Confirmation
To test the ARDL estimations, FMOLS and DOLS models were used. Table 5 and Table 6 show the results of the FMOLS and DOLS models, respectively. As can be seen in the tables, the residual diagnostics tests showed that the models are suitable.

Table 5.
Results of robustness test: FMOLS model.

Table 6.
Results of robustness test: DOLS model.
Table 7 documents that the outcomes of FMOLS and DOLS match the ARDL assessment. Long-run association was noted between Saudi urea prices and world urea prices. Numerous previous studies used FMOLS and DOLS to strengthen the results of ARDL model [41,62,68].

Table 7.
Long-run evidence.
3.1.4. Results of ECM
To reinforce the result of the long-run association (ARDL model) and to evaluate short-run correlation between the variables, ECM was applied. Table 8 shows lag length (lag 1), which must be known so as to perform ECM. As shown in Table 9, the coefficient of adjustment parameter for KSA urea prices (as dependent variable) proved positive (1.805) and insignificant (critical t-value = 2.218), confirming that the model was powerless to right its previous time instability, and this may be due to the short time interval of the series under study. Likewise, the results propose that the coefficient of adjustment parameter for world urea prices (as dependent variable) was positive (1.329) and statistically insignificant (critical t-value = −1.608); meaning that the model was able to right its earlier time instability and may require more than 12 months to return to long-run equilibrium. The model adequacy tests were run. The chi-sq. equaled 21.81 with prob. = 0.24, indicating no heteroscedasticity. The LM statistic (lag 1) equaled 2.97 with prob. = 0.56, demonstrating no serial correlation. These results of model adequacy confirm the null hypothesis, no heteroscedasticity, and no serial correlation of residuals.

Table 8.
Lag selection.

Table 9.
Results of ECM.
3.2. Cointegration Analysis Results (KSA DAP and World DAP)
3.2.1. The Results of Unit Root Tests
Using the unit root test, the stationarity of KSA and world DAP fertilizer prices were examined. The ADF statistics were noted significant at 1% level, indicating that the two series were stationary at 1(1) (Table 2). The two series possessed the same stationary order; accordingly, the Engle–Granger test was chosen to weigh the long-run association between the two series.
3.2.2. Results of Engle–Granger Test
The ADF statistics of DAP prices of the KSA and the world were significant at 1%. The two series possessed similar stationary order 1(1). Accordingly, the Engle–Granger test was picked to estimate the association among them. The ADF tests were performed on the residuals (zt1) and (zt2) in Equations (7) and (8), respectively (Table 10). The table shows that ADF statistics are 4.67 and –4.83 and statistically significant at 1% level of significance. The results direct us to adopt the alternative hypothesis of integration, signifying that the KSA DAP prices and world DAP prices have a long-run association.

Table 10.
Engle–Granger test results.
3.2.3. Results of ECM
Table 11 shows lag length (lag 1), which must be identified so as to execute ECM. Table 12 shows the results of ECM. To adopt the VECM results, residual diagnostic tests were applied. The LM statistic (lag 1) equaled 6.83 with prob.= 0.15, demonstrating no serial correlation. The VEC residual normality tests and Jarque–Bera statistics equal chi-sq. = 1.57 and 5.43, indicating the normal distribution of the residual. Accordingly, these results directed us to reject the null hypothesis, indicating no serial correlation, and normal distribution of residuals. From the Table, the coefficient of adjustment parameter for KSA DAP prices (as dependent variable) proved positive (at 0.040) and insignificant (critical t-value= 0.23), showing that the model was unable to right its previous time instability. Similarly, the coefficient of adjustment parameter for world DAP prices (as dependent variable) was positive (0.29) and statistically insignificant (critical t-value= 2.71); meaning that the model was unable to right its earlier time instability. These results show that the models might require more than one year (12 month) to correct a prior time imbalance.

Table 11.
Lag selection.

Table 12.
Results of ECM.
3.3. Regression Analysis Results
3.3.1. World Urea Exported Quantities (LWUQ—Independent Variable)
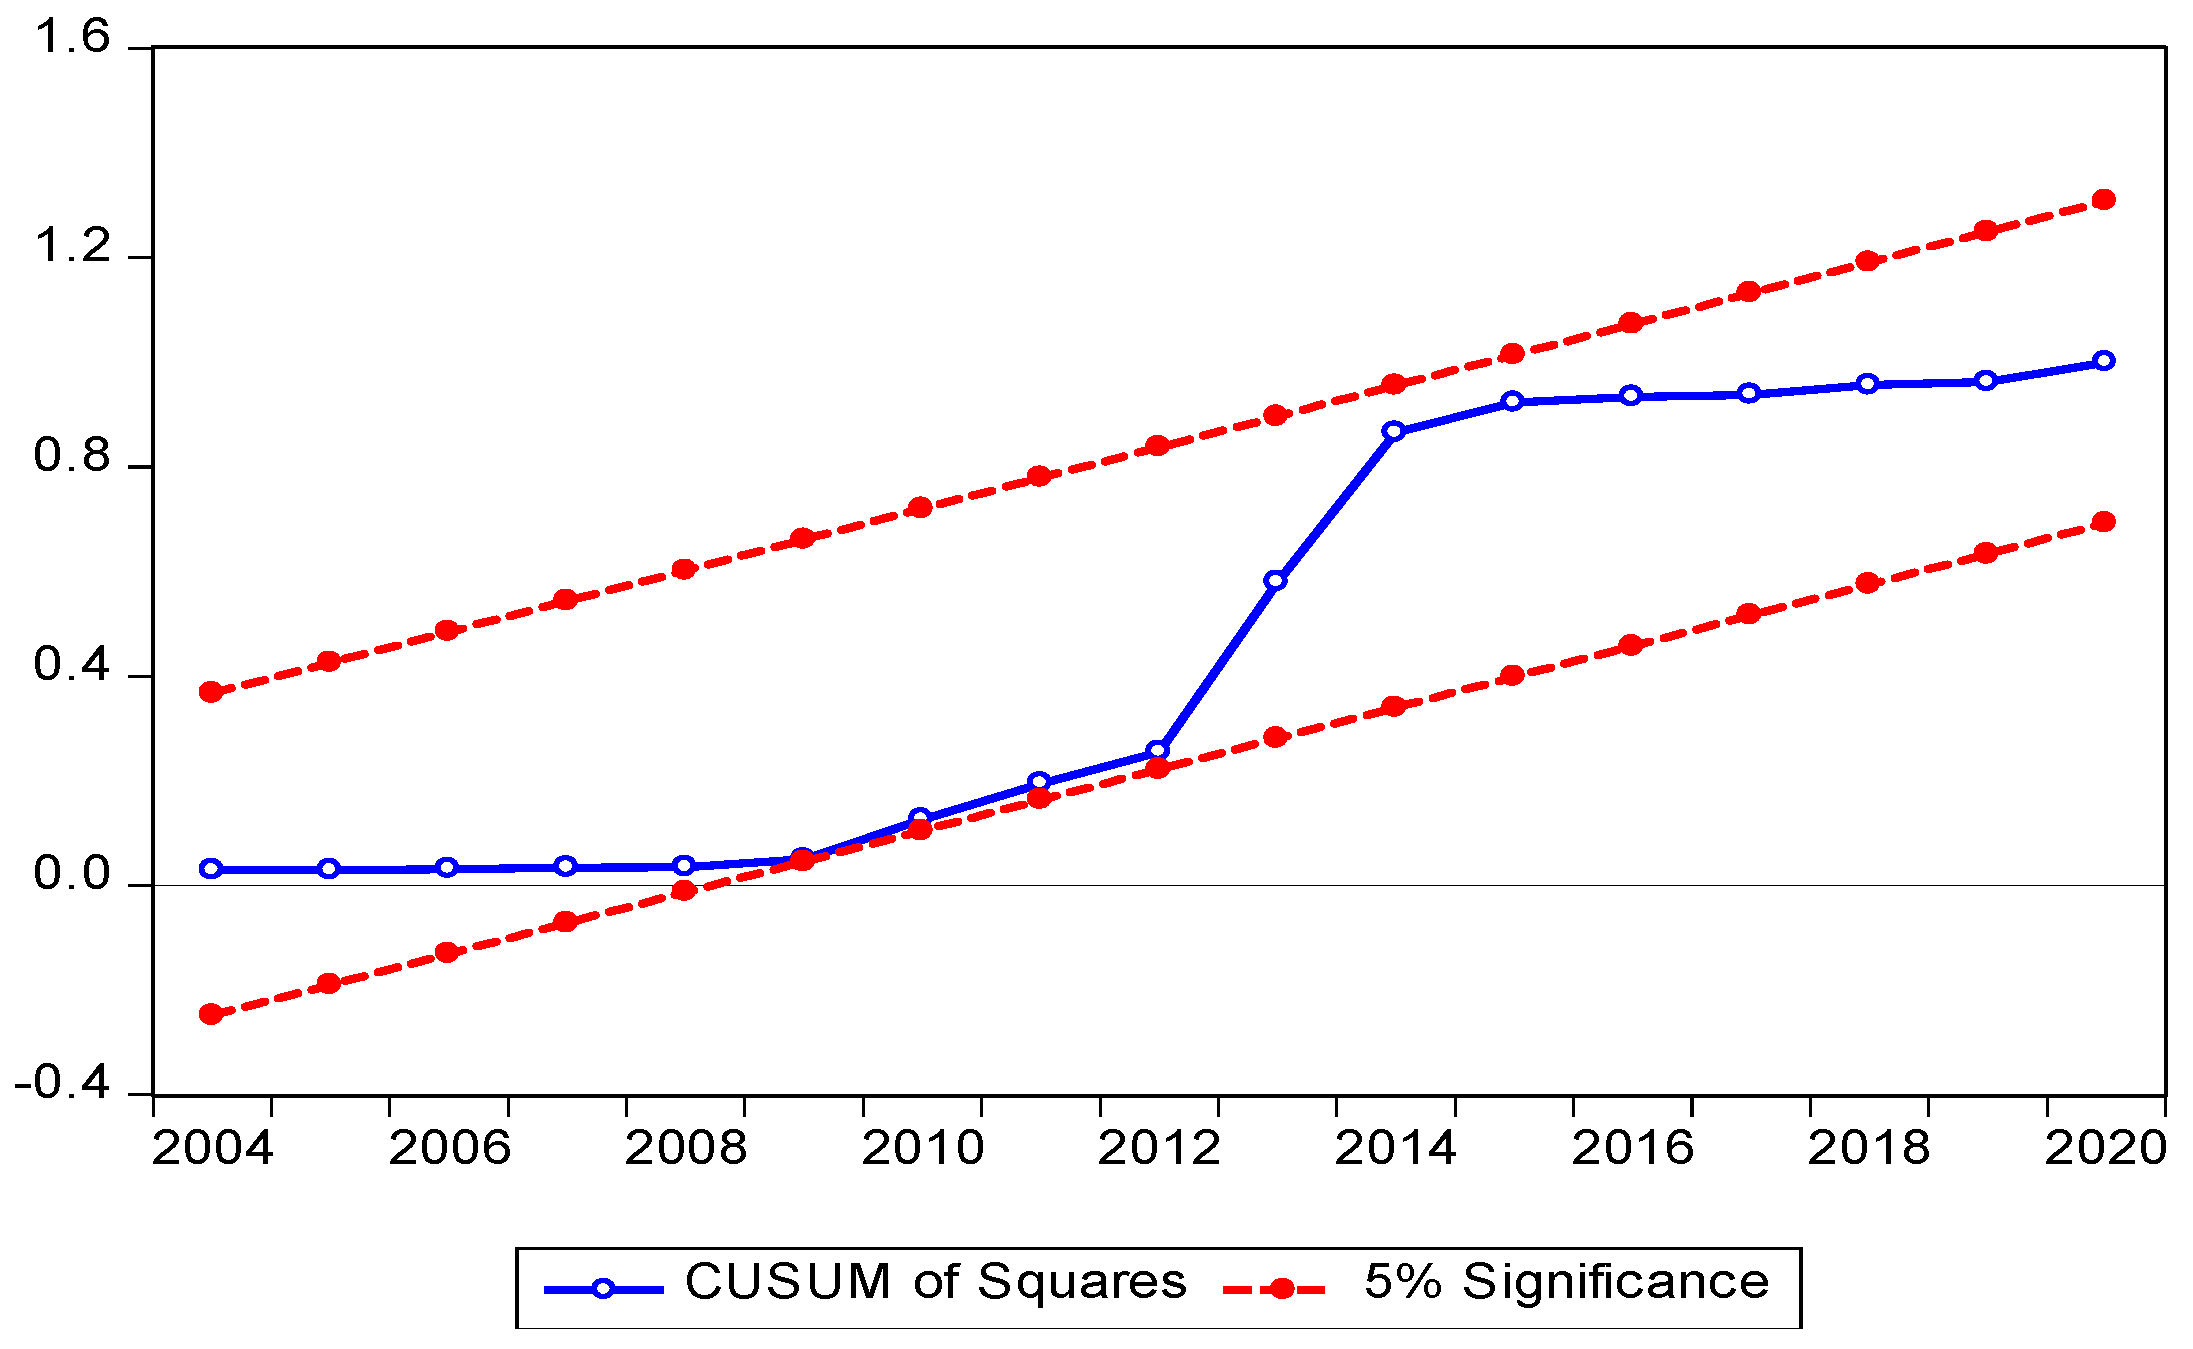
Table 13 records the regression analysis results. The stable model was picked through running various scenarios. The table showed no autocorrelation among subsequent values of the disturbance term, meaning it has a constant variance (homoscedastic). To test the model stability, the CUSUM square test was conducted. Since the cumulative sum of the recursive residuals is found inside the area between the two critical lines, the model is stable. Accordingly, the regression model was chosen (Figure 4). Consequently, regression model was picked and adopted to estimate the influences of KSA urea export quantities (independent variable) on world urea export quantities. The table shows that the R-squared value indicated that 76% of the variations in the world urea export quantities is interpreted by KSA urea export quantities. The value of F-statistics also demonstrates a highly significant level for the model, confirming that the independent variable is fundamental in explaining the variation of world urea export quantities. The coefficient of KSA urea export quantities (independent variables) is positive and highly significant in explaining the changeability of world urea export quantities. Based on Equation (13), an increase of 1% in of KSA urea export quantities will increase world urea export quantities by 0.82%.

Table 13.
Results of regression analysis (LWUQ as dependent variable).
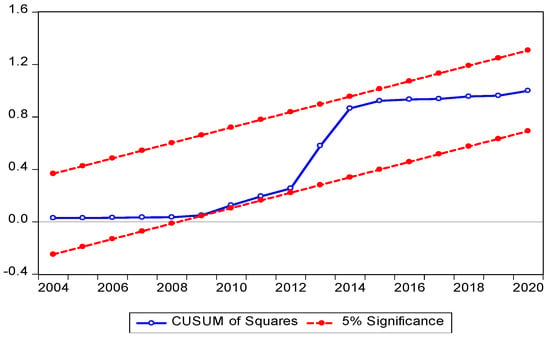
Figure 4.
CUCSUM test. Source: Constructed by author.
3.3.2. World DAP Export Quantities (LWDQ—Independent Variable)
Table 14 records the regression analysis results. The model showed no autocorrelation among consecutive values of the disturbance term (homoscedastic). The CUSUM square test showed that the model was stable (Figure 5). Consequently, the regression model was chosen and accepted to evaluate the impacts of KSA DAP export quantities (independent variable) on world DAP export quantities. In the table, the R-squared value shows that 76% of the variation in world DAP export quantities is interpreted by KSA DAP export quantities. Similarly, the F-statistics value reveals a highly significant level for the model, indicating that the independent variable is essential in explaining the disparity of world DAP export quantities. The coefficient of KSA DAP export quantities (independent variable) (1.95) is positive and highly significant in clarifying the changeability of the world DAP export quantities. Based on Equation (14), a one tonne increase of KSA DAP export quantities will increase world DAP export quantities by 1.95 tonnes.

Table 14.
Results of regression analysis (WDQ as dependent variable).
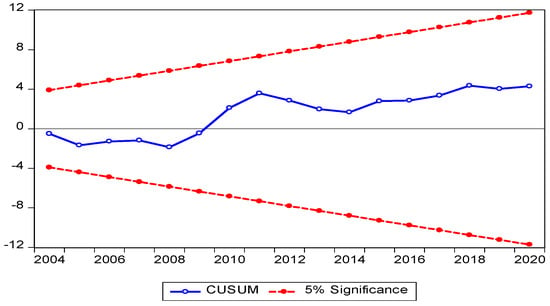
Figure 5.
CUCSUM test. Source: Constructed by author.
3.4. Forecasting Analysis Result
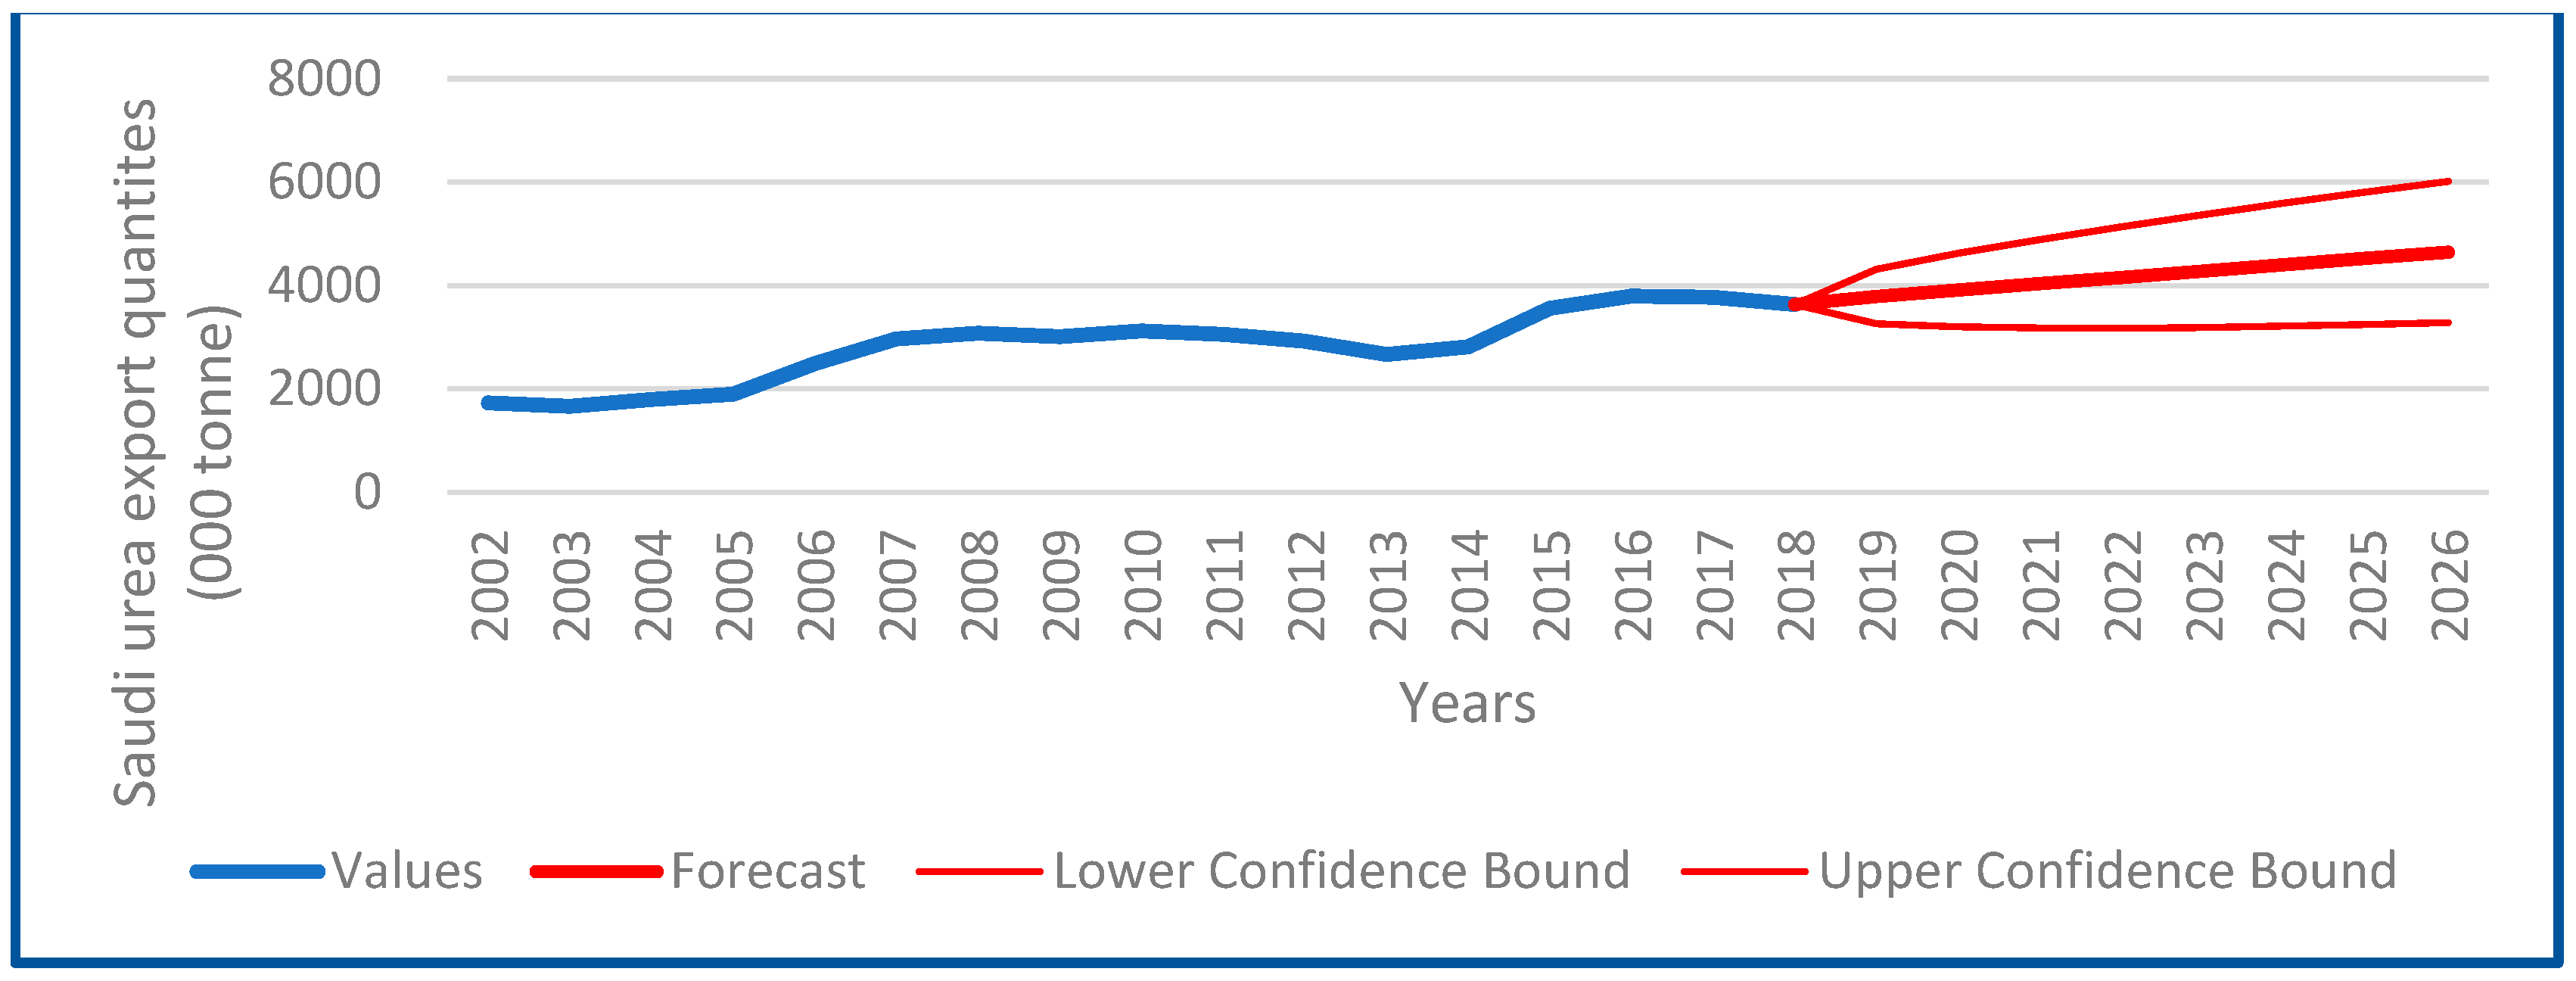
Figure 6 displays the forecasting graph of KSA urea export quantities; the blue and red parts reflect actual KSA urea export quantities for the period 2002 to 2018 and forecast for the period 2019 to 2026, respectively. The graph appeared valid as shown by different forecasting indicators: mean square error, alpha, beta, and gamma values equal 1.4, 0.9, 0.0, and 0.0, respectively. Likewise, the growth rates of urea exports equal 0.002 and 0.004 for the period 2002 to 2018 and forecast for the period 2019 to 2026, respectively, concluding that there will be an increase in urea export quantities by (0.003) from the KSA during the forecast period.
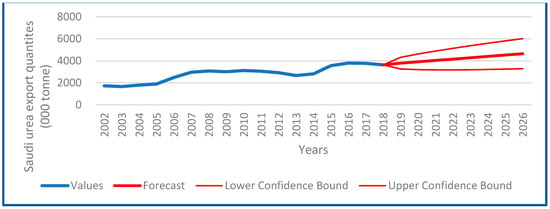
Figure 6.
Forecasting graph (KSA urea export quantities). Source: Author calculations based on collected data. Figure accuracy indicators: mean square error= 1.5, alpha= 0.9, beta= 0.0, gamma= 0.0.
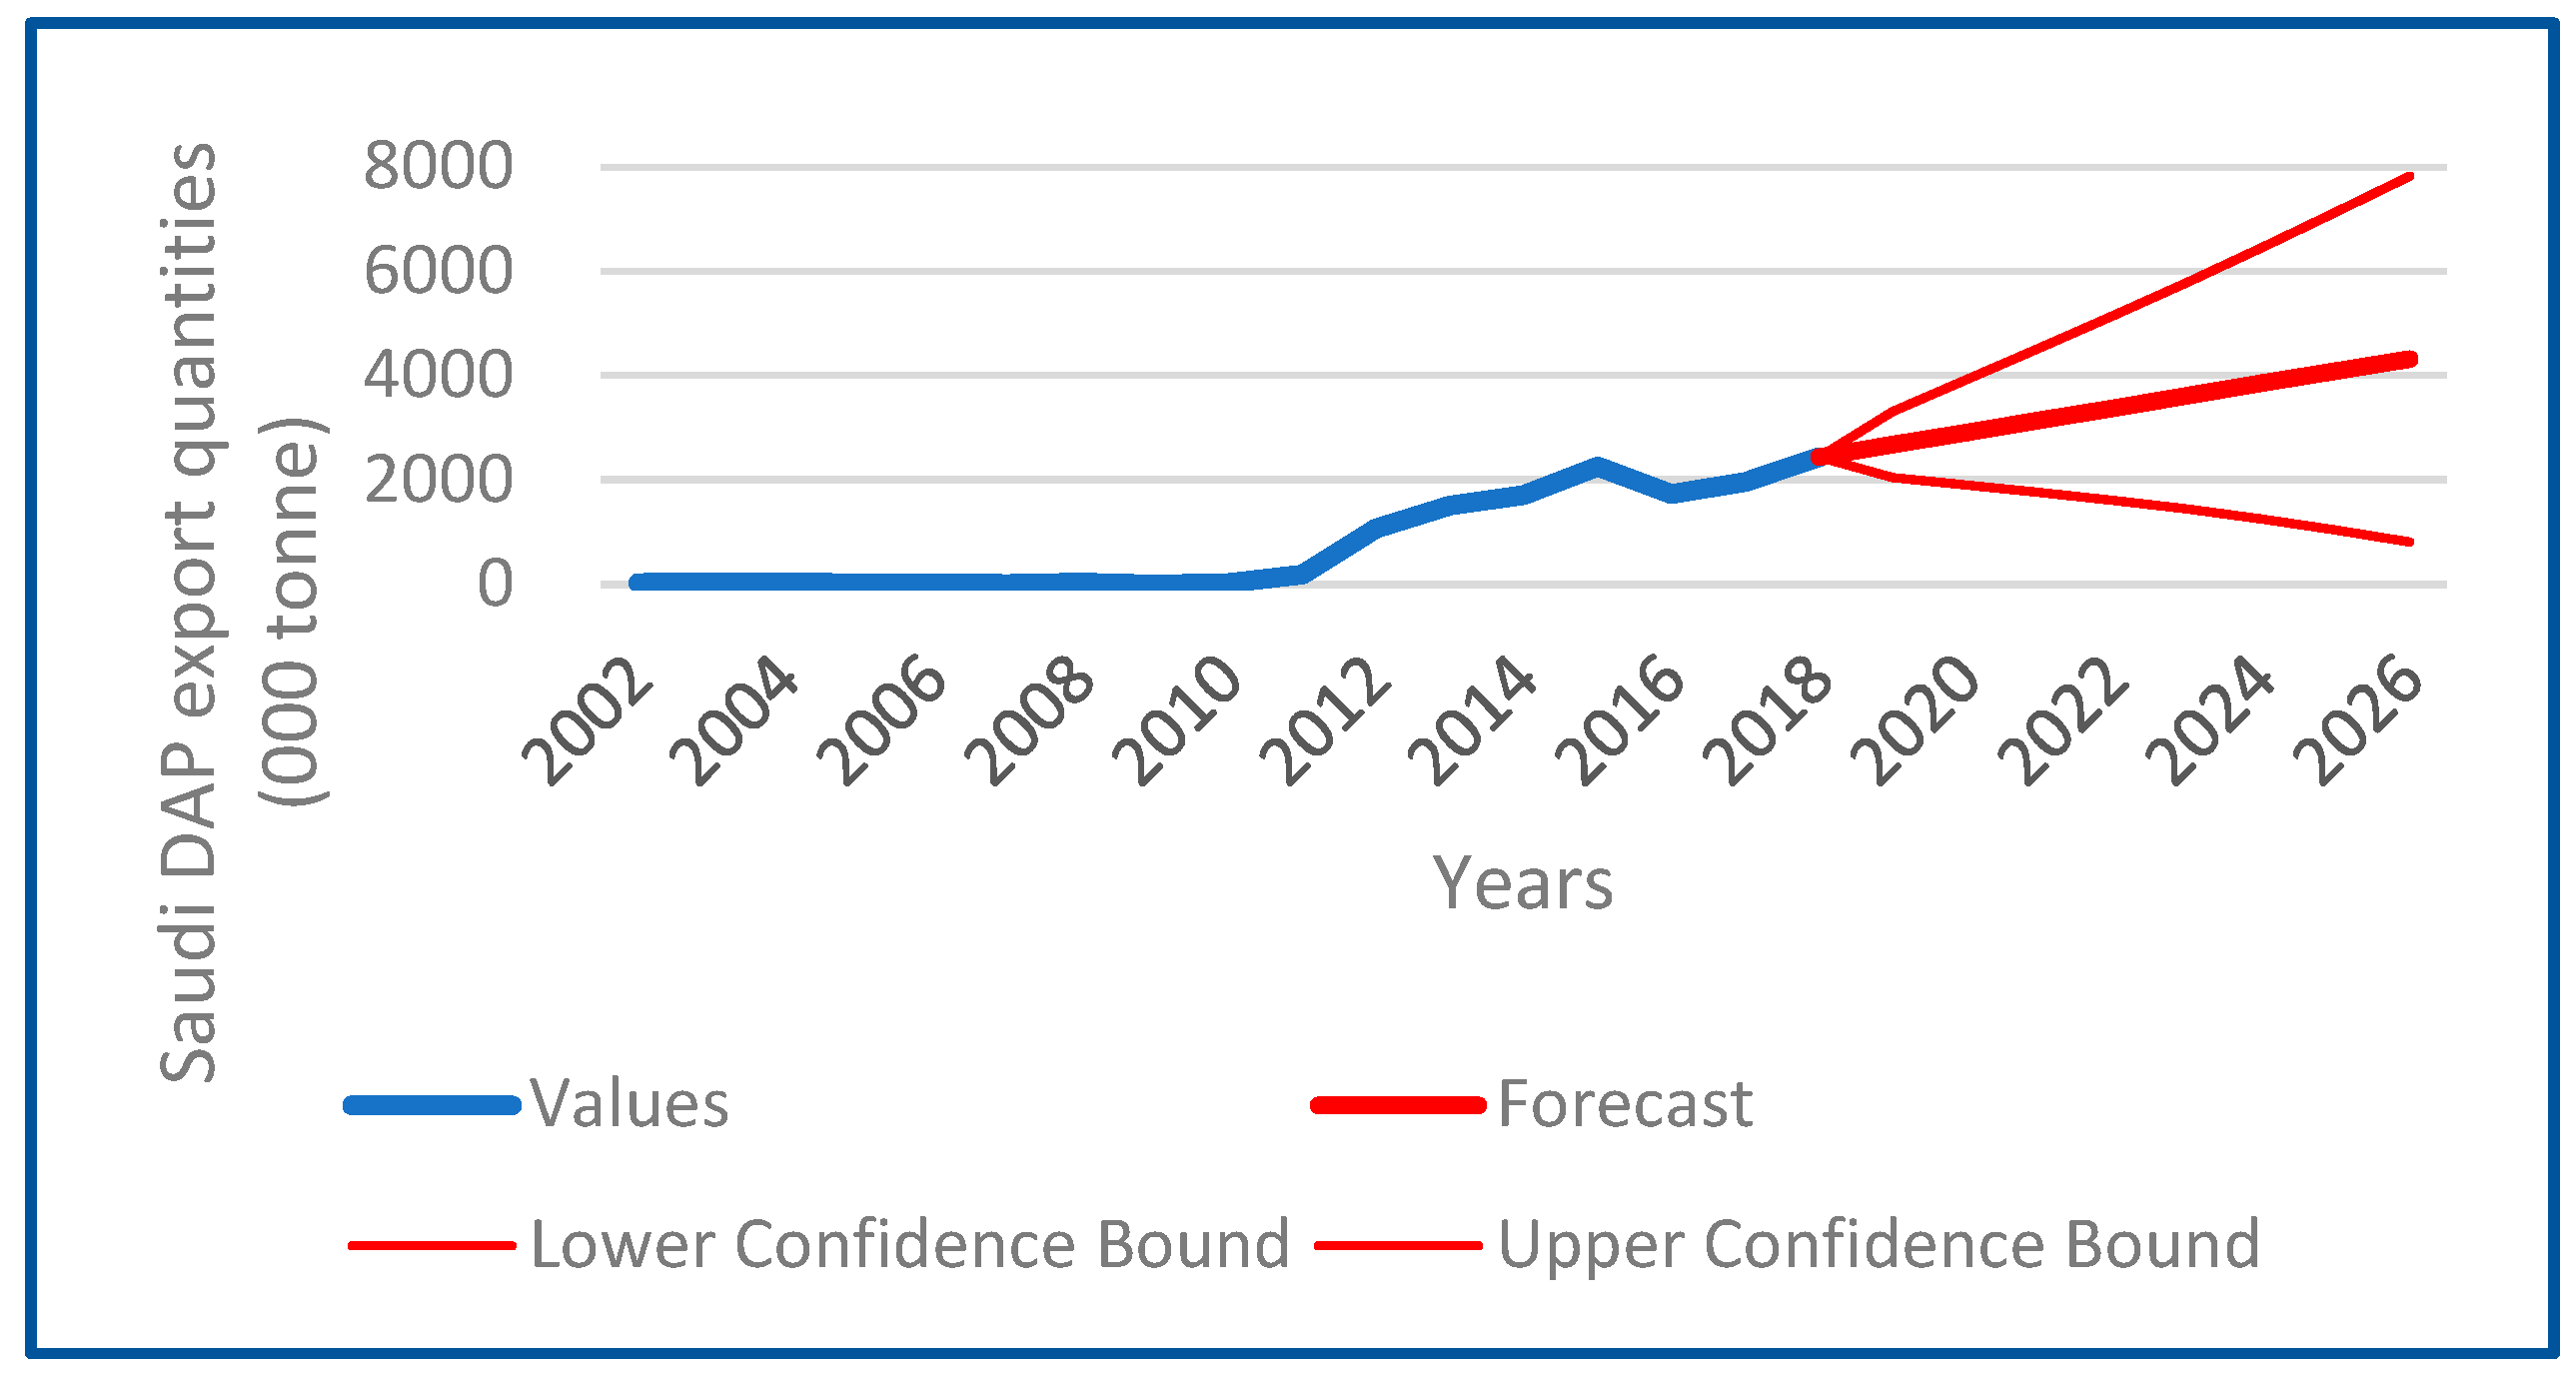
Similarly, Figure 7 illustrates the forecasting graph of KSA DAP export quantities; the blue and red parts reflect actual DAP fertilizer exports from the KSA for the period 2002 to 2018 and forecast exports for the period 2019 to 2026, respectively. The graph shows validity of different forecasting indicators: mean square error, alpha, beta, and gamma values equal 205, 1.0, 0.25, and 0.0, respectively. Similarly, the growth rates of DAP quantities equal 0.45 (000 tonne) and 0.07 (000 tonne) for the period 2002 to 2018 and the forecast period 2019 to 2026, respectively, concluding that there will be an increase in export quantities but at a lower rate (0.07 tonne (000)) during the forecast period.
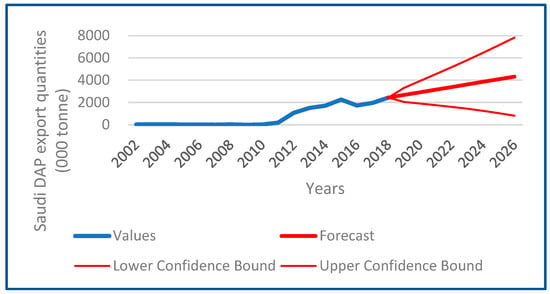
Figure 7.
Forecasting graph (KSADAP export quantities). Source: Author calculations based on collected data. Figure accuracy indicators: mean square error = 2.5, alpha = 1.0, beta = 0.25, gamma = 0.0.
3.5. The Impact of KSA Fertilizer on Global Food Security
The availability of food is a key element of food security [44]. In order for food to be available, agriculture production must be increased. Plants’ nutrients supply from chemical fertilizer is crucial to increase agriculture production by enhancing land productivity [47]. Fertilizer is considered an important tool to augment food production [48]. Food prices are a vital factor in food security [44]. Stable prices improve food security, while price variability and instability can contribute to worsening food crises. Instability of fertilizer prices leads to instability of food prices. The prerequisite of stability of food prices is the stability of agricultural production inputs; among them is fertilizer, which directly affects the food security situation. The market integration test is applied to assess the long-run association among the series. Thus, understanding market integration, or the joint movement of prices between different markets, can provide important insights into the issue of food security [44]. The mechanism of market integration tends to make the prices stable in market branches (log-run association). The results showed that there is a long-run association between KSA and world fertilizer (urea and DAP) exports, indicating that there is long-run equilibrium between the two markets. These results mean that the fertilizer markets change from surplus to deficit smoothly in the long run. In addition, with reference to regression analysis results (Equations (13) and (14)), KSA fertilizer export quantities (urea and DAP) are positive and highly significant in explaining the variably of world fertilizer export quantities (urea and DAP). The conclusion of these results is that the KSA fertilizer (urea and DAP) export quantities play a vital role and contribute to the global fertilizer trade.
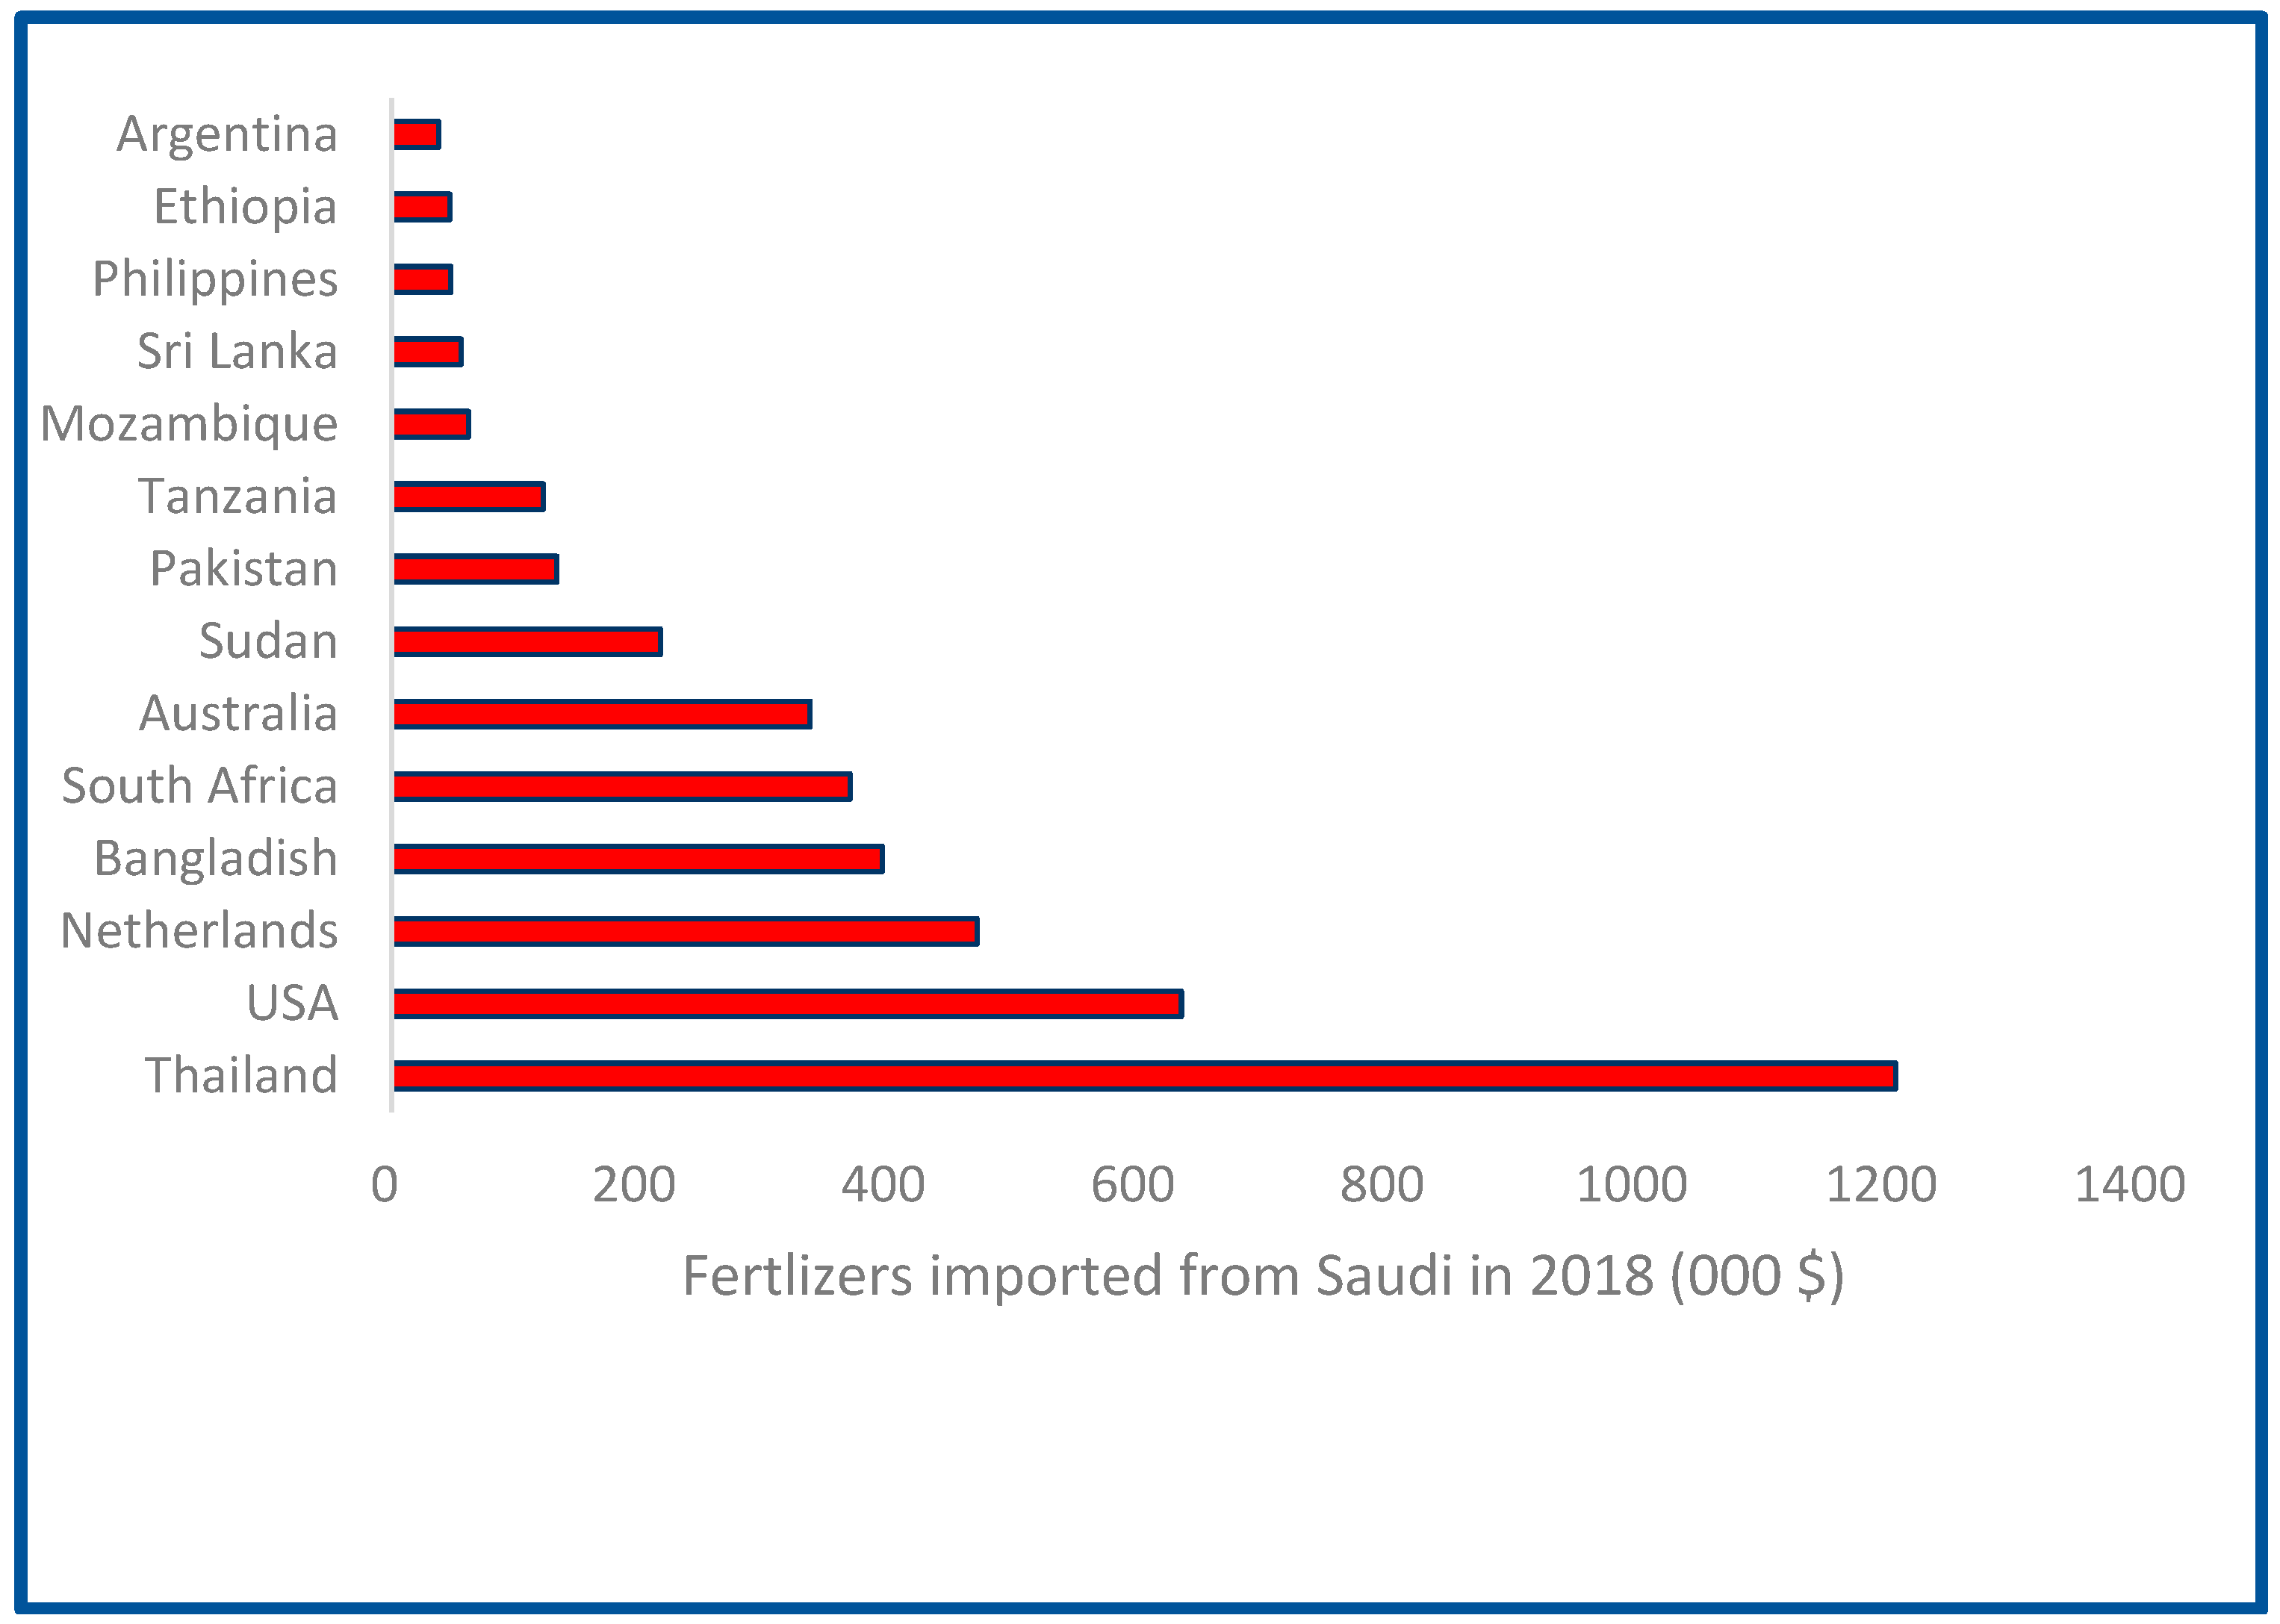
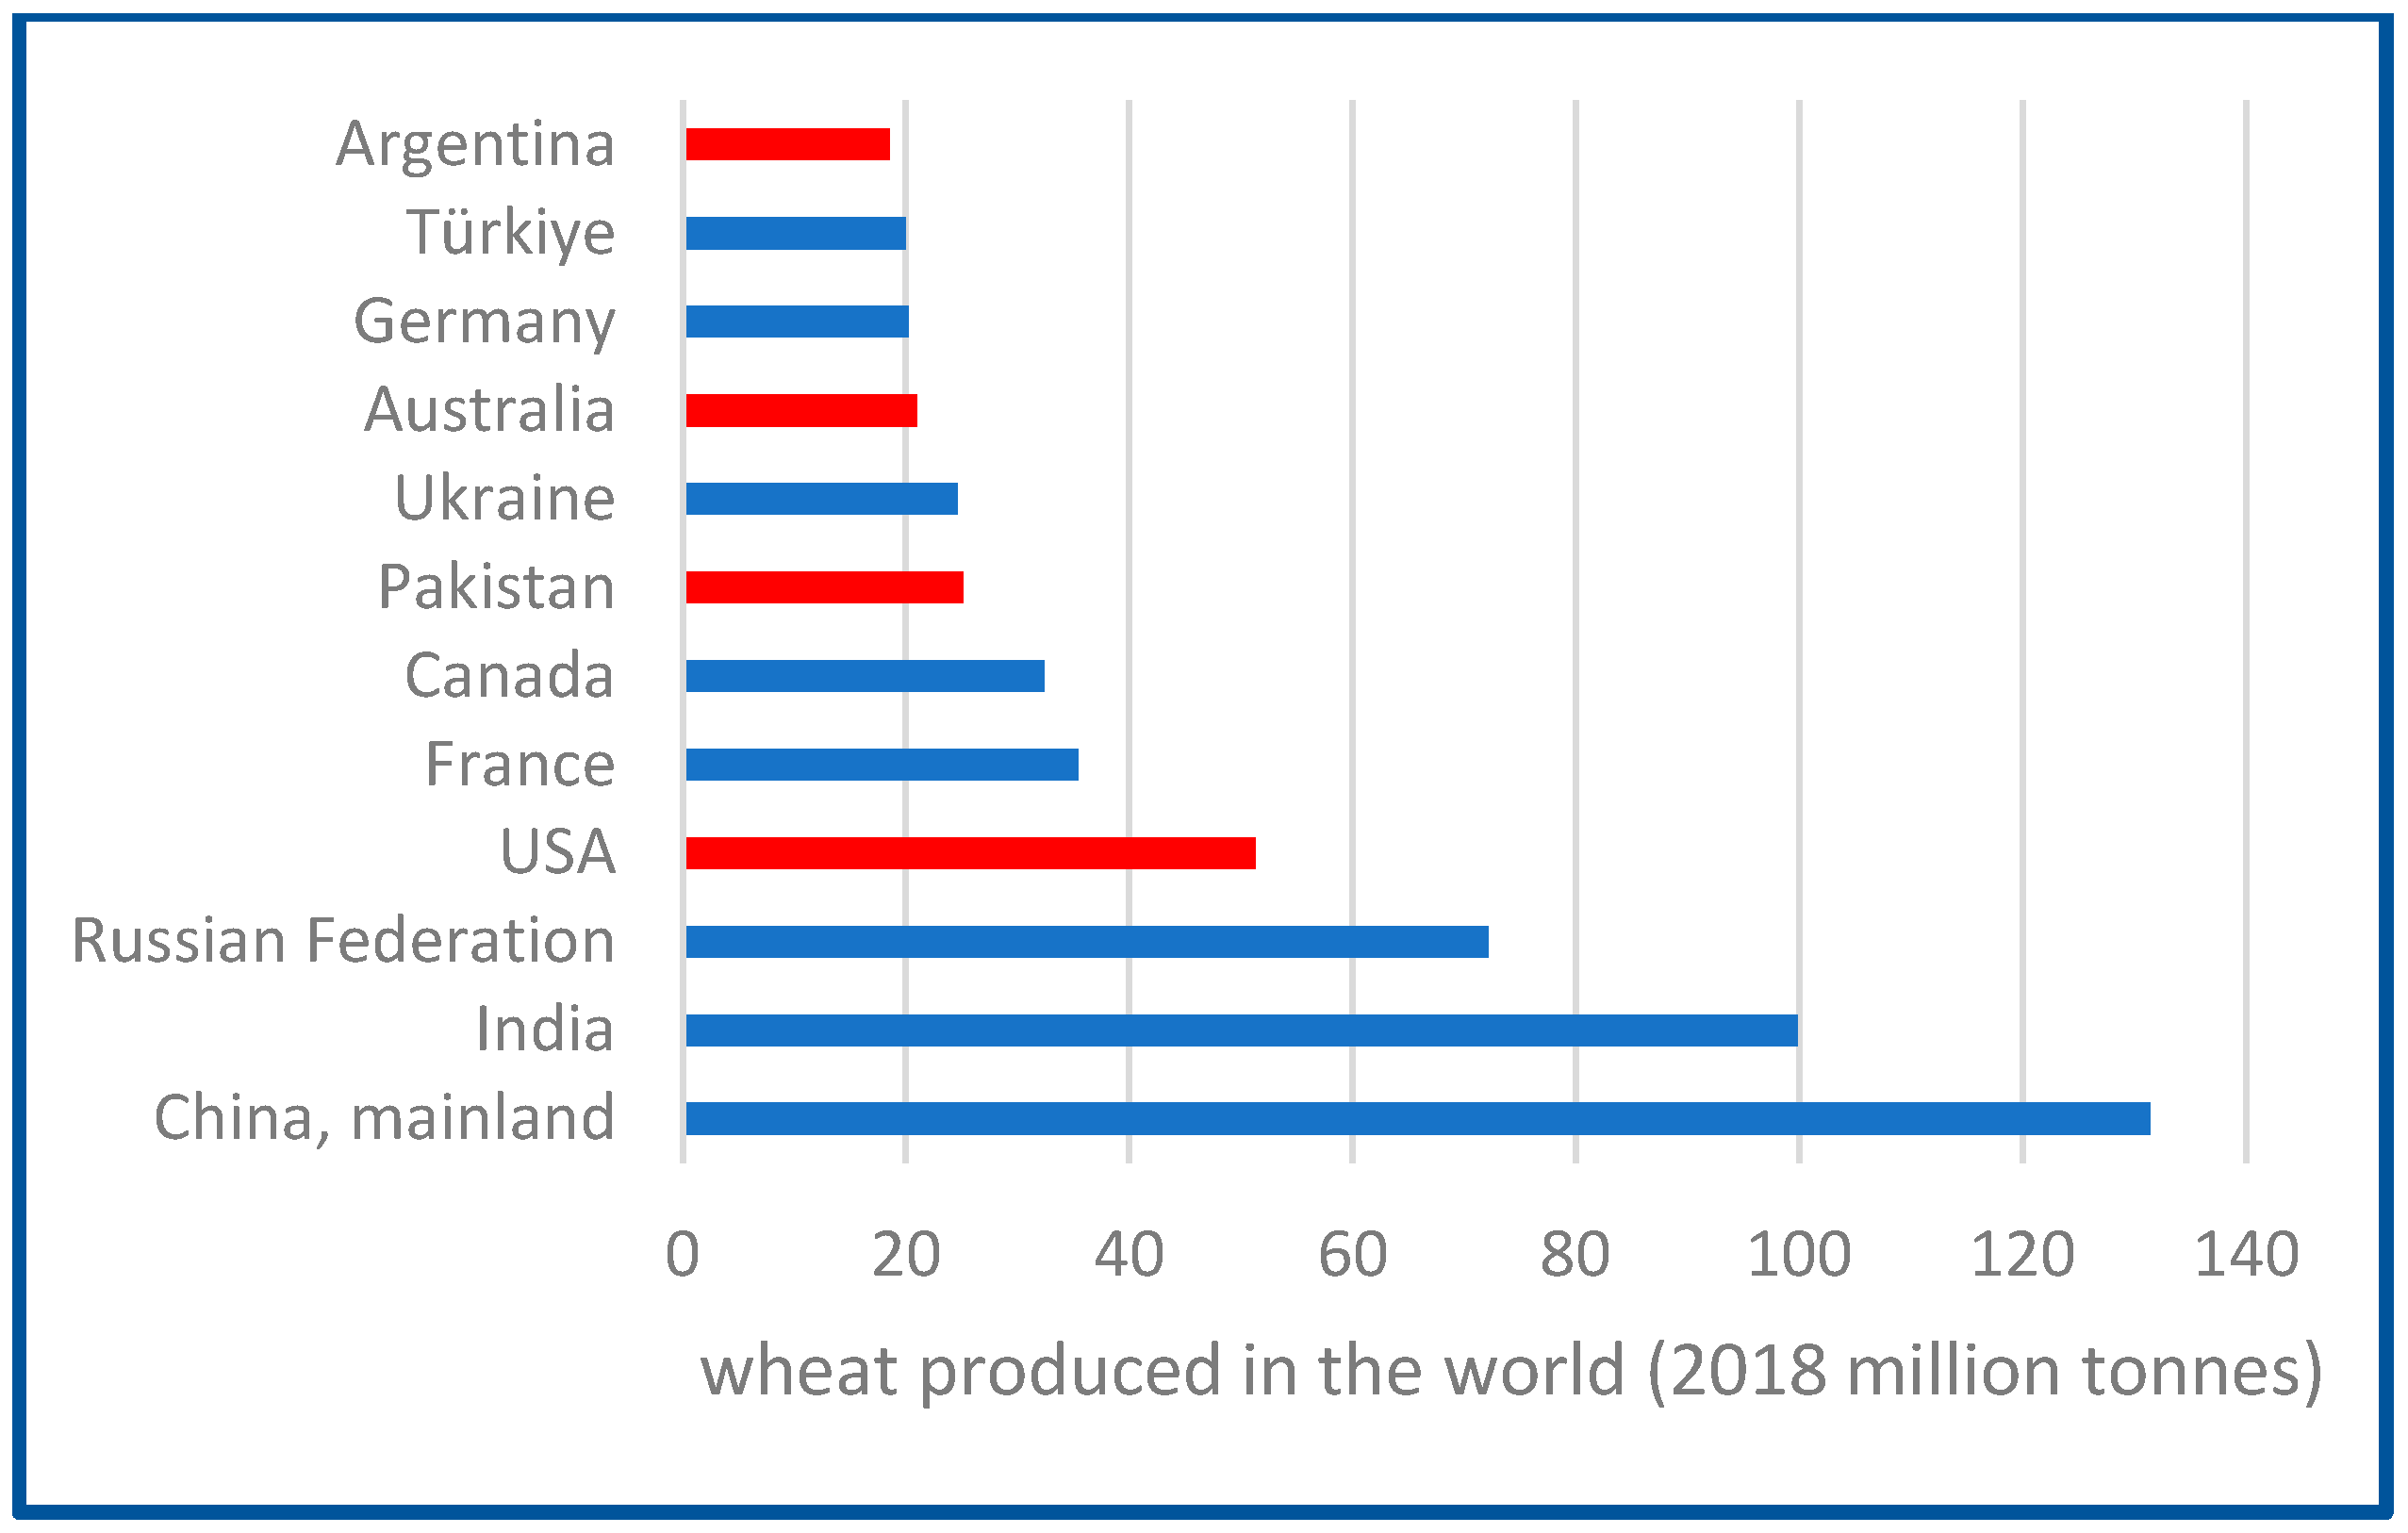
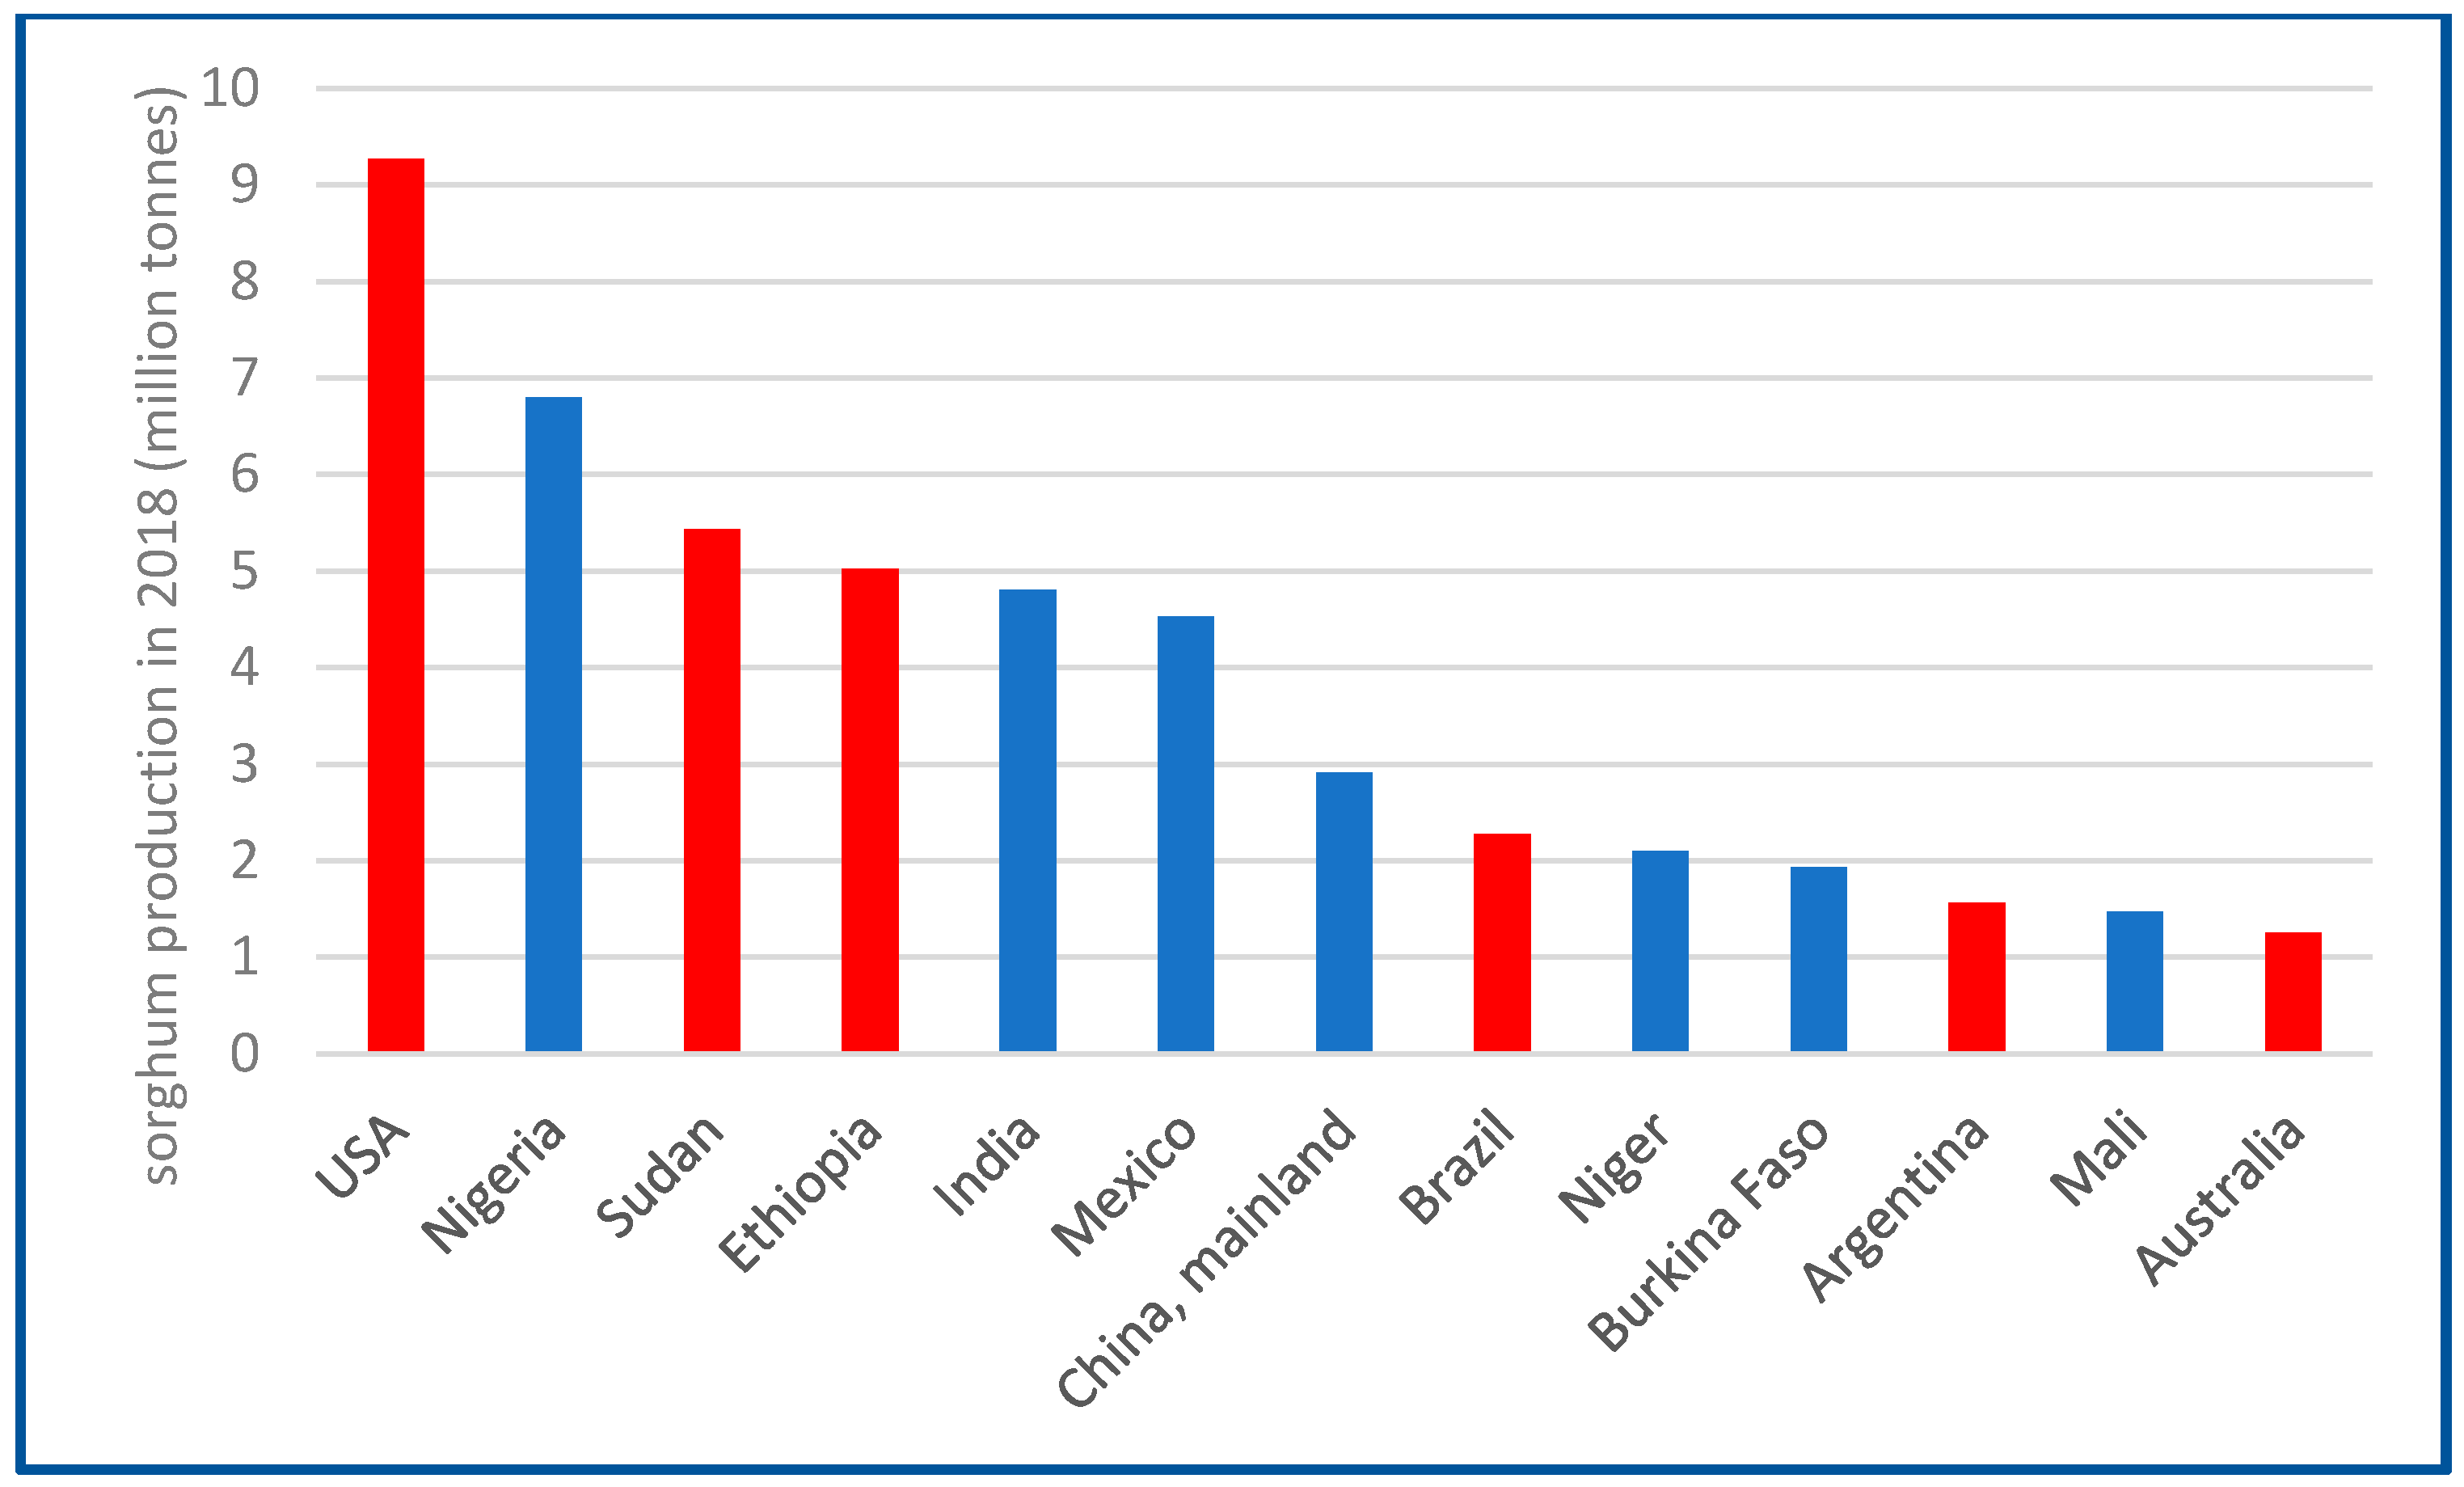
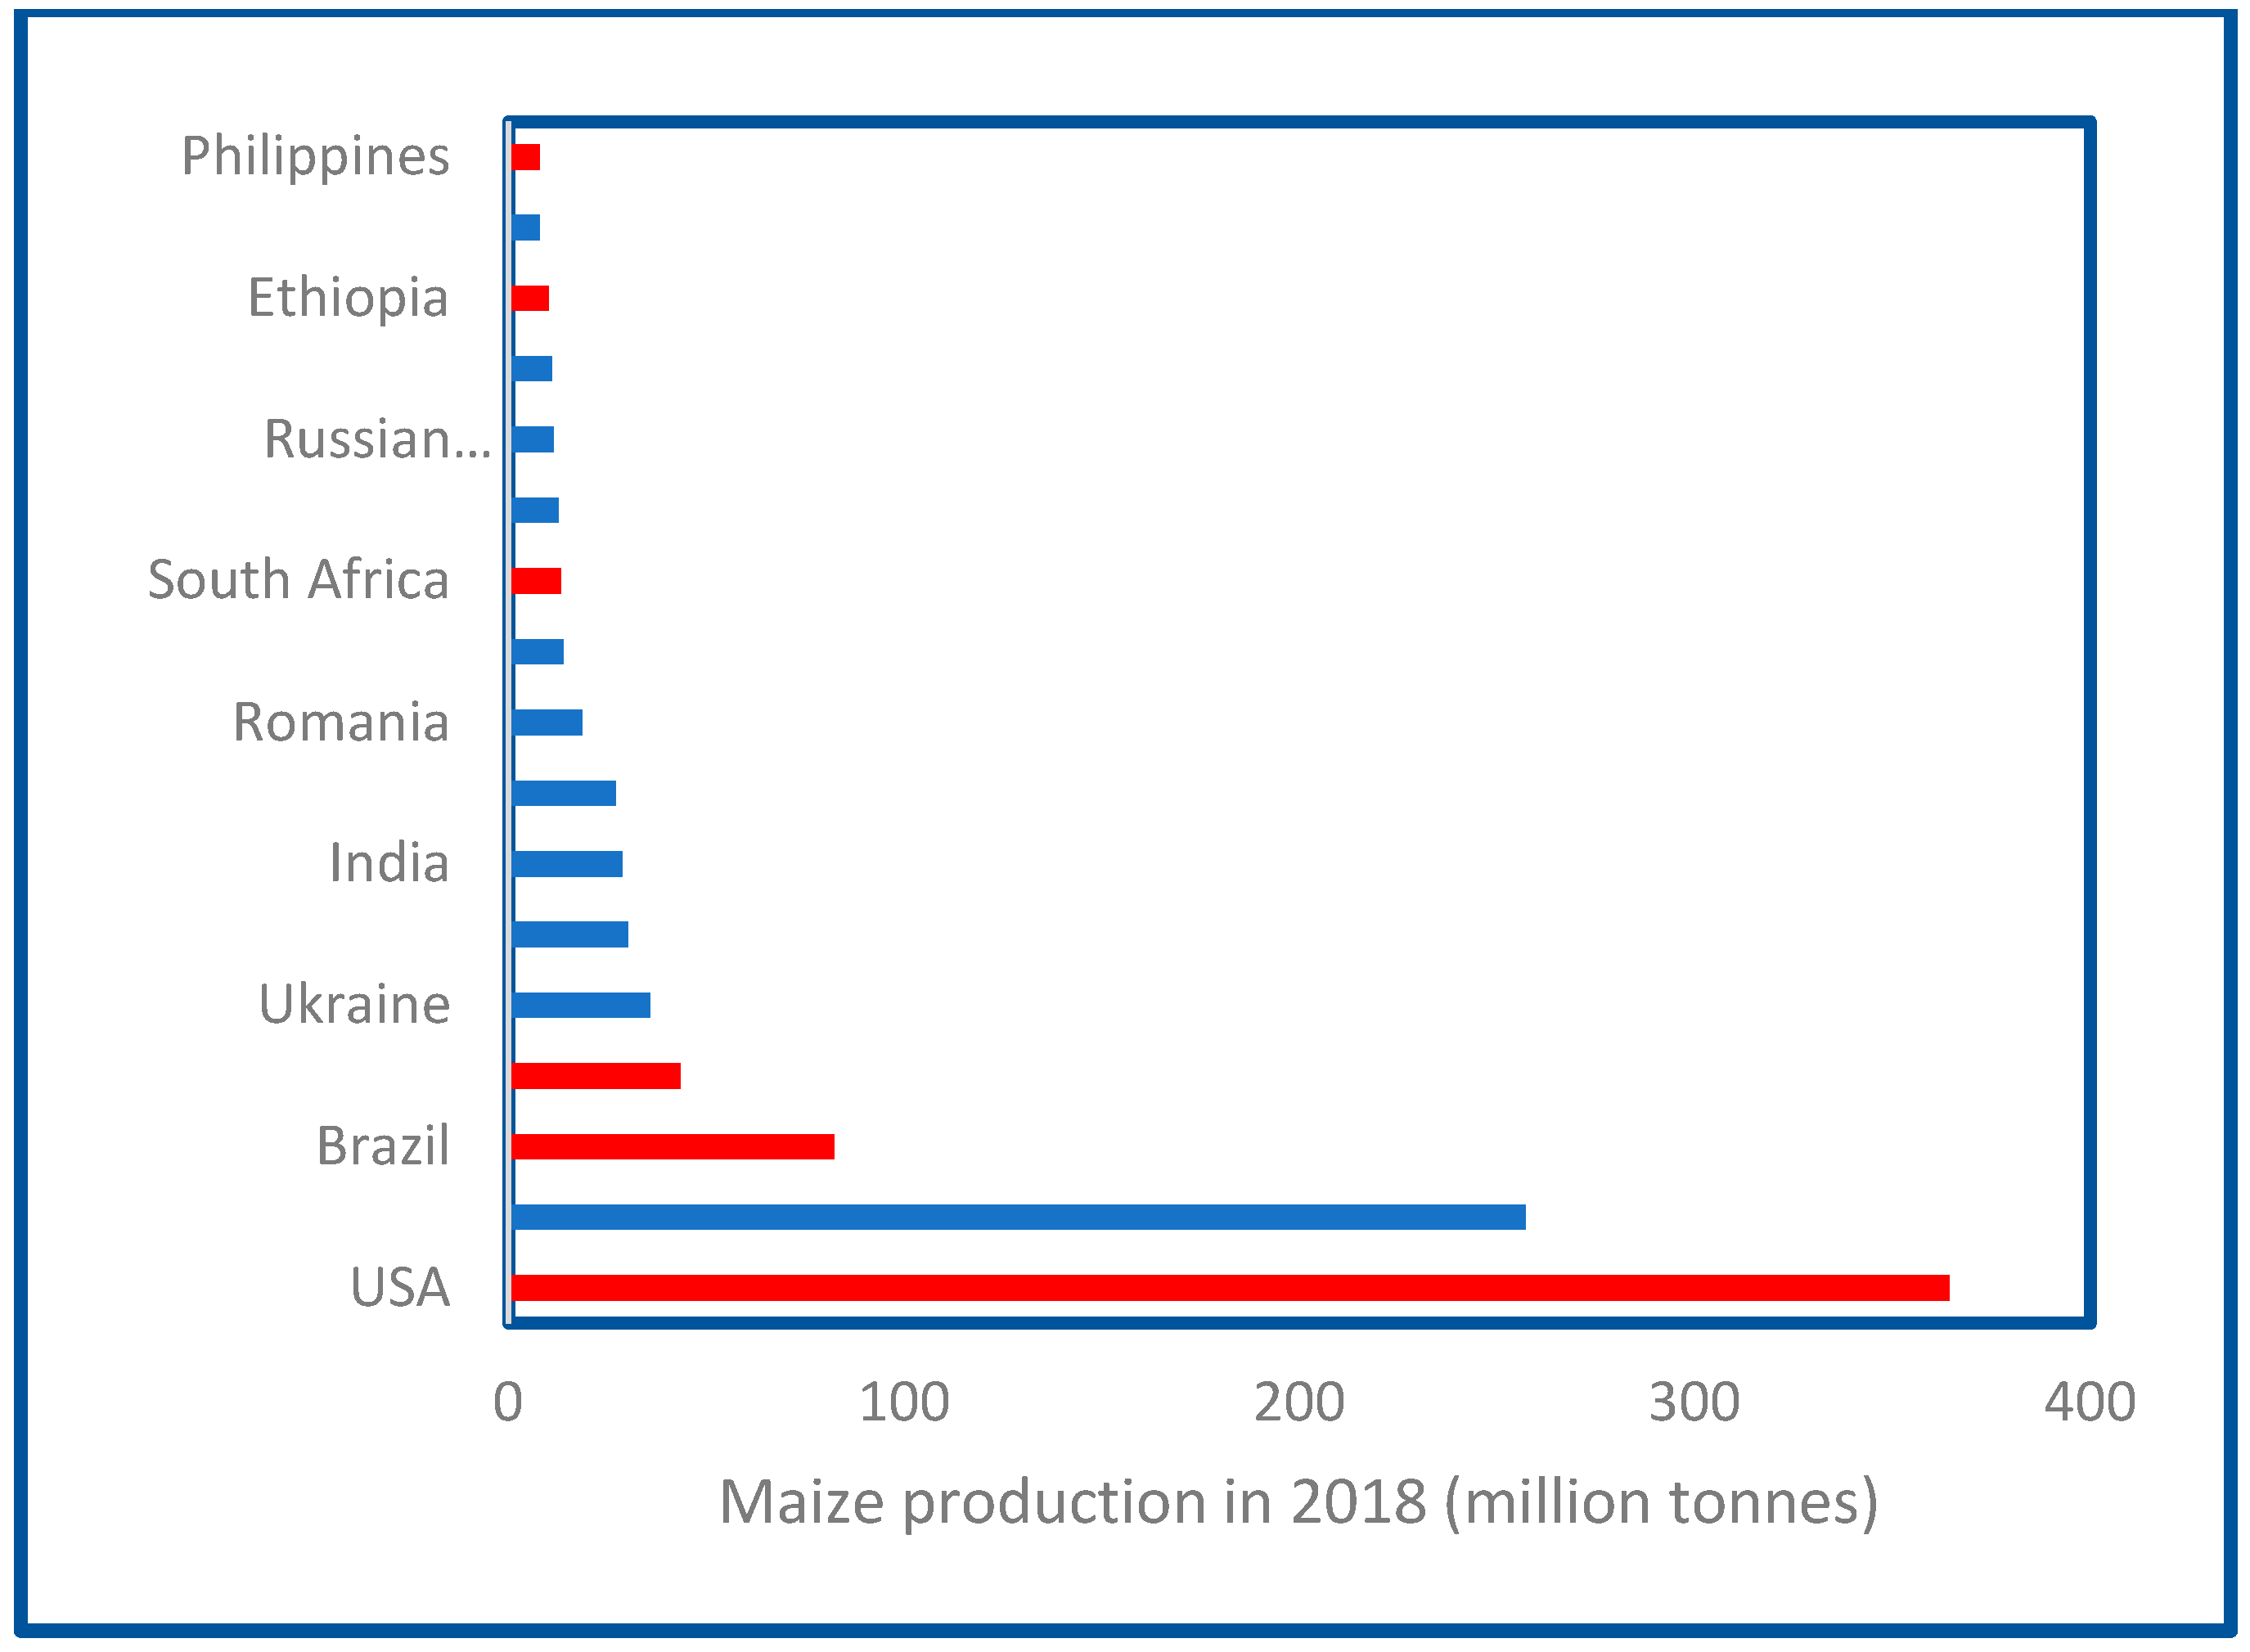
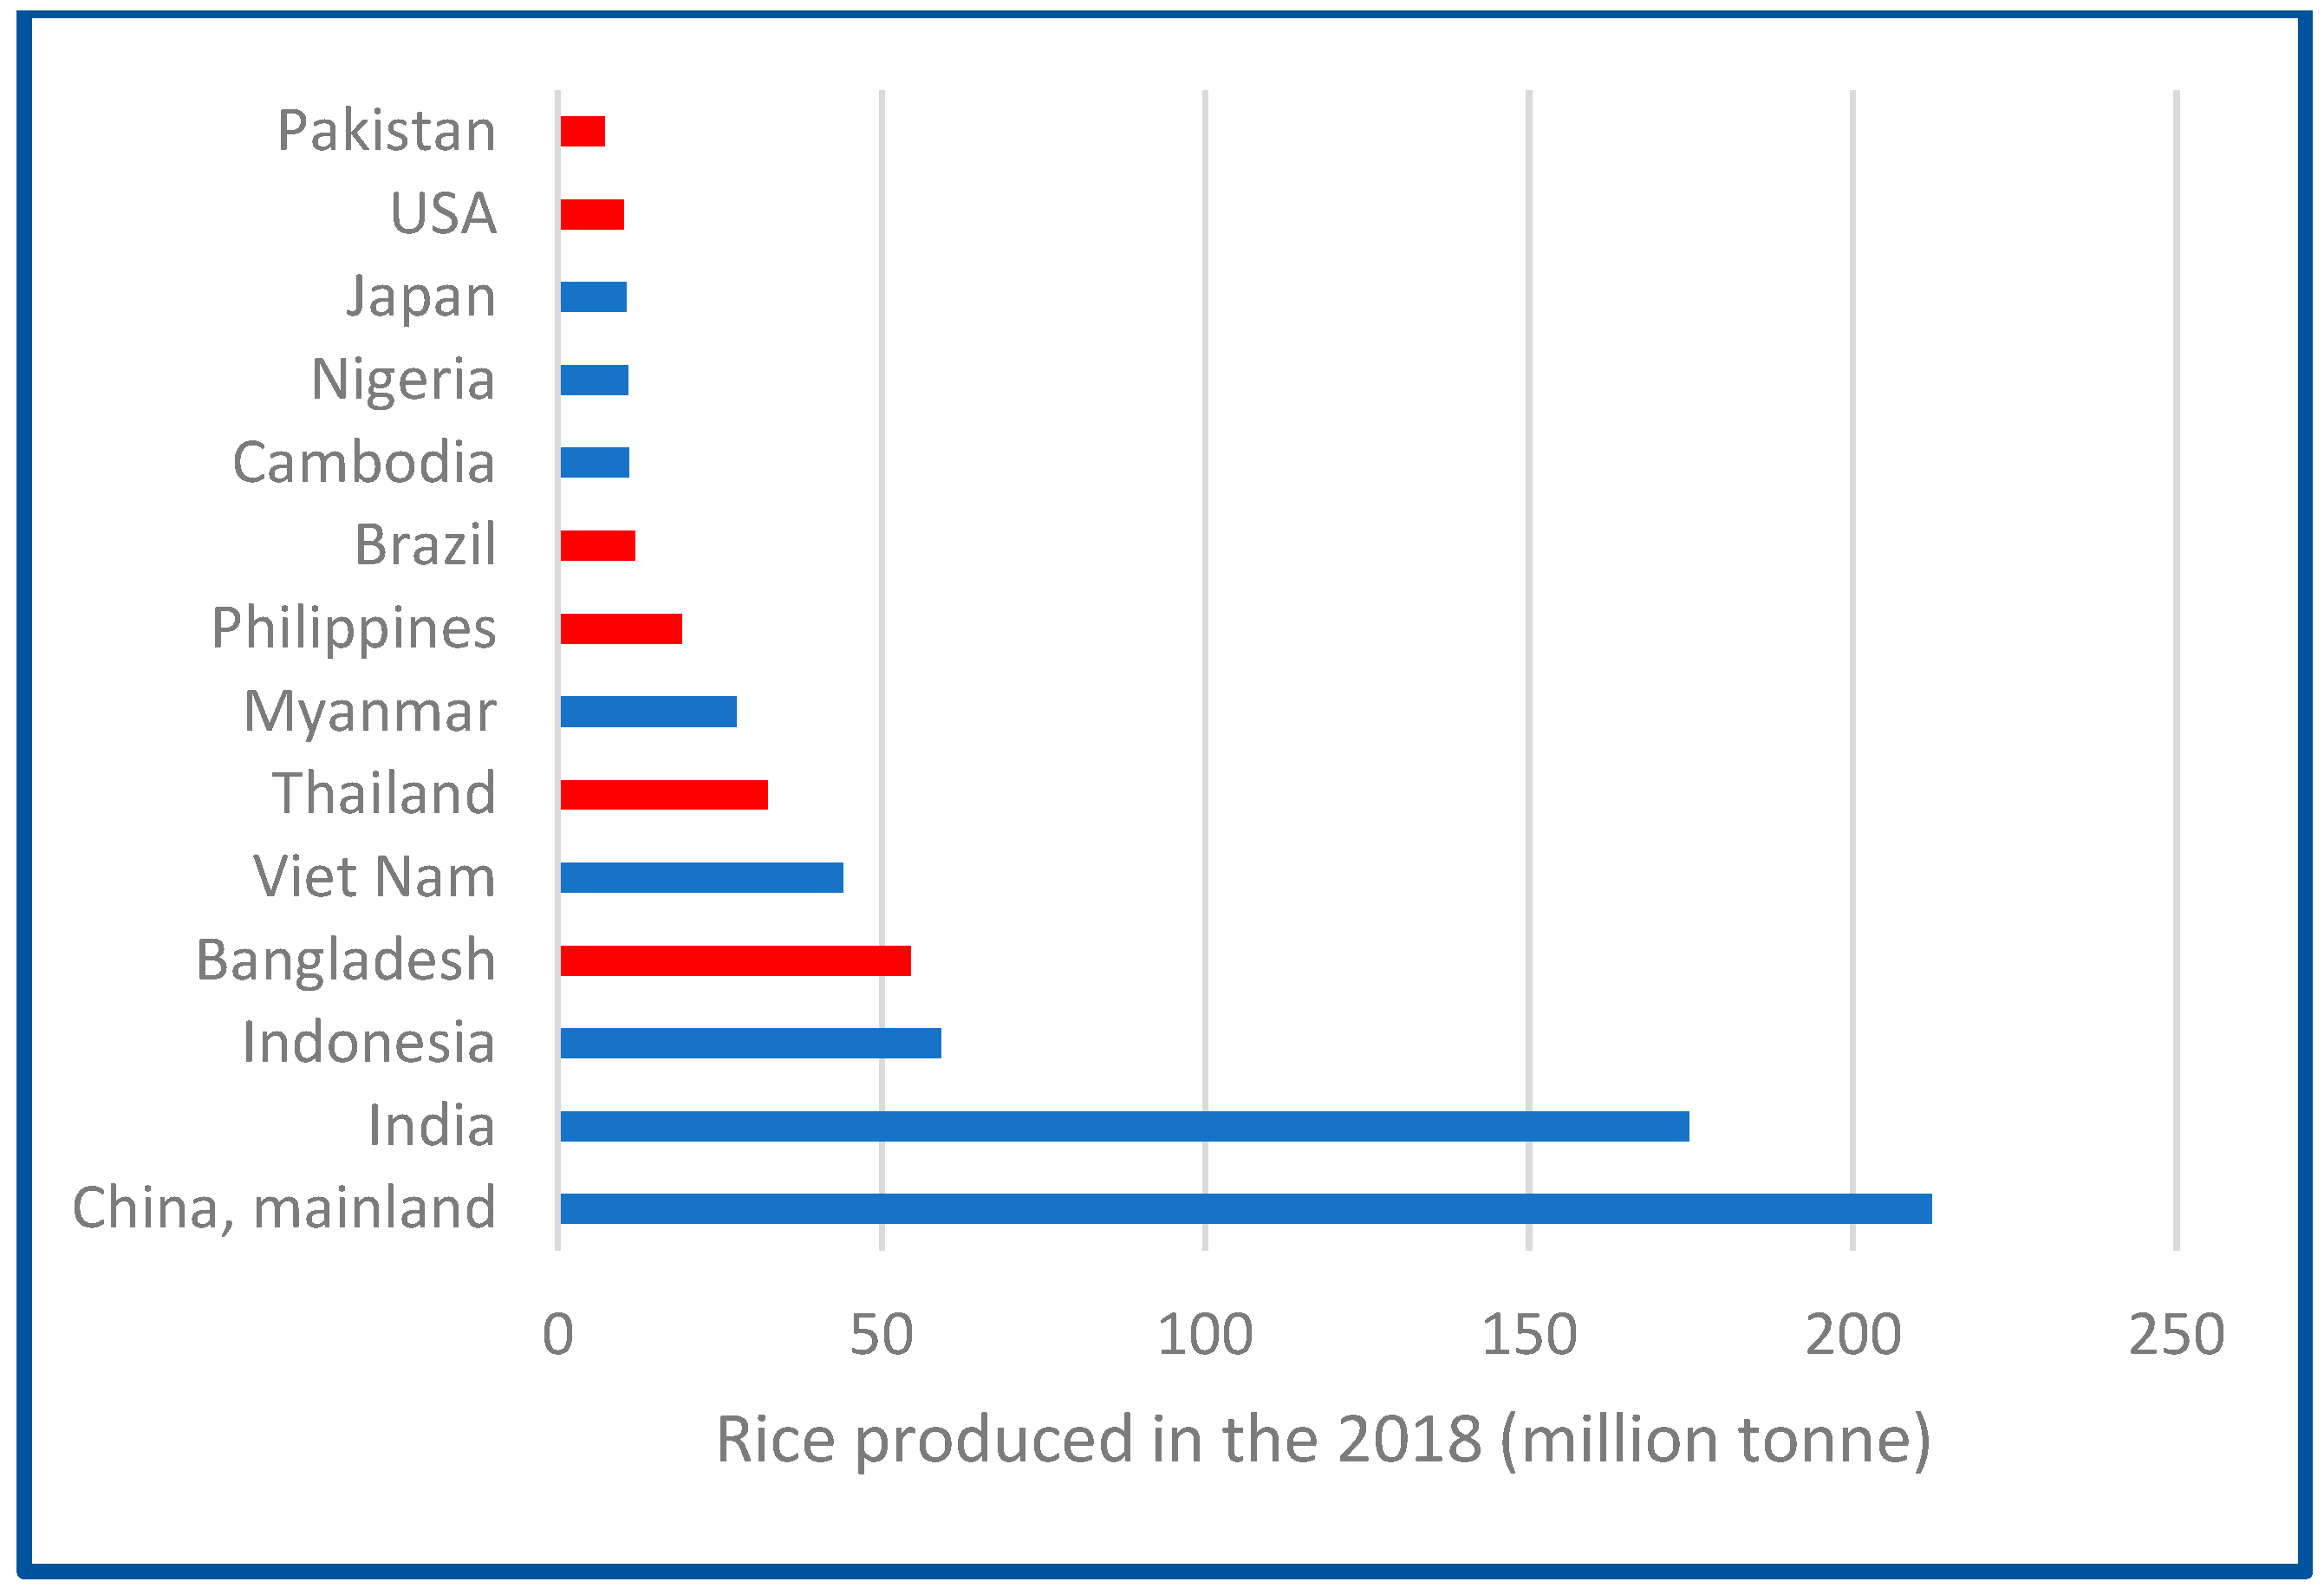
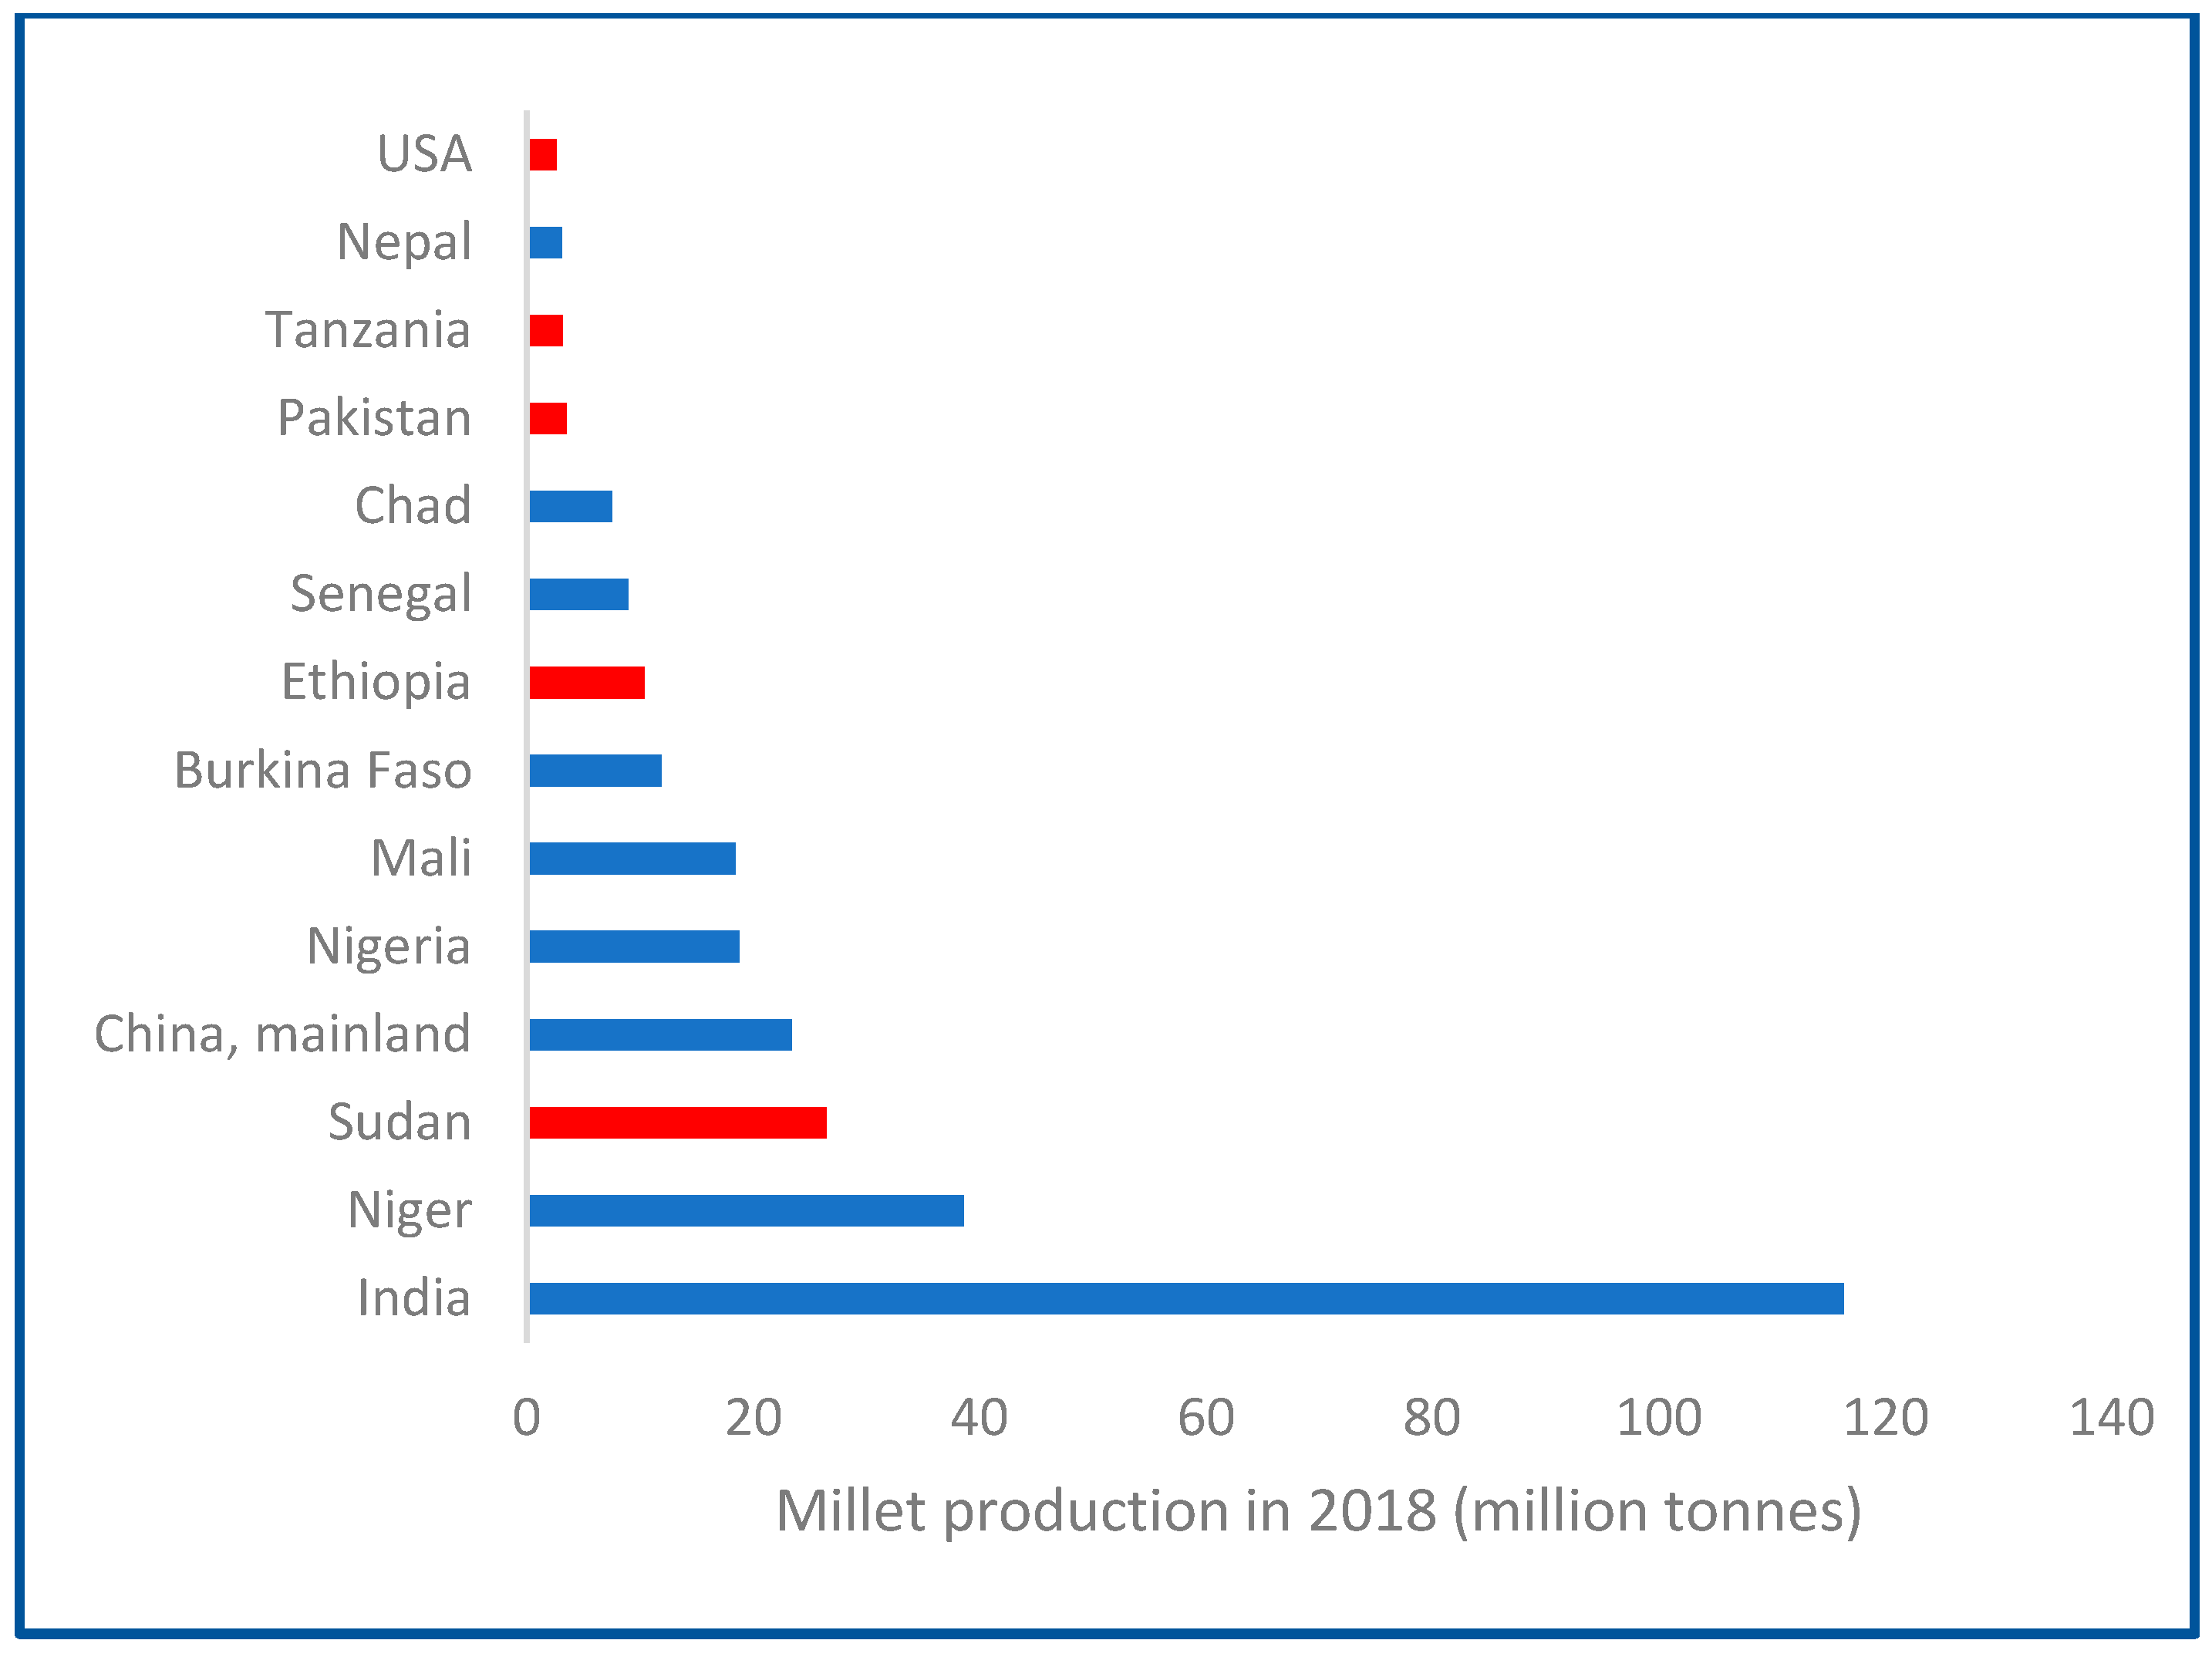
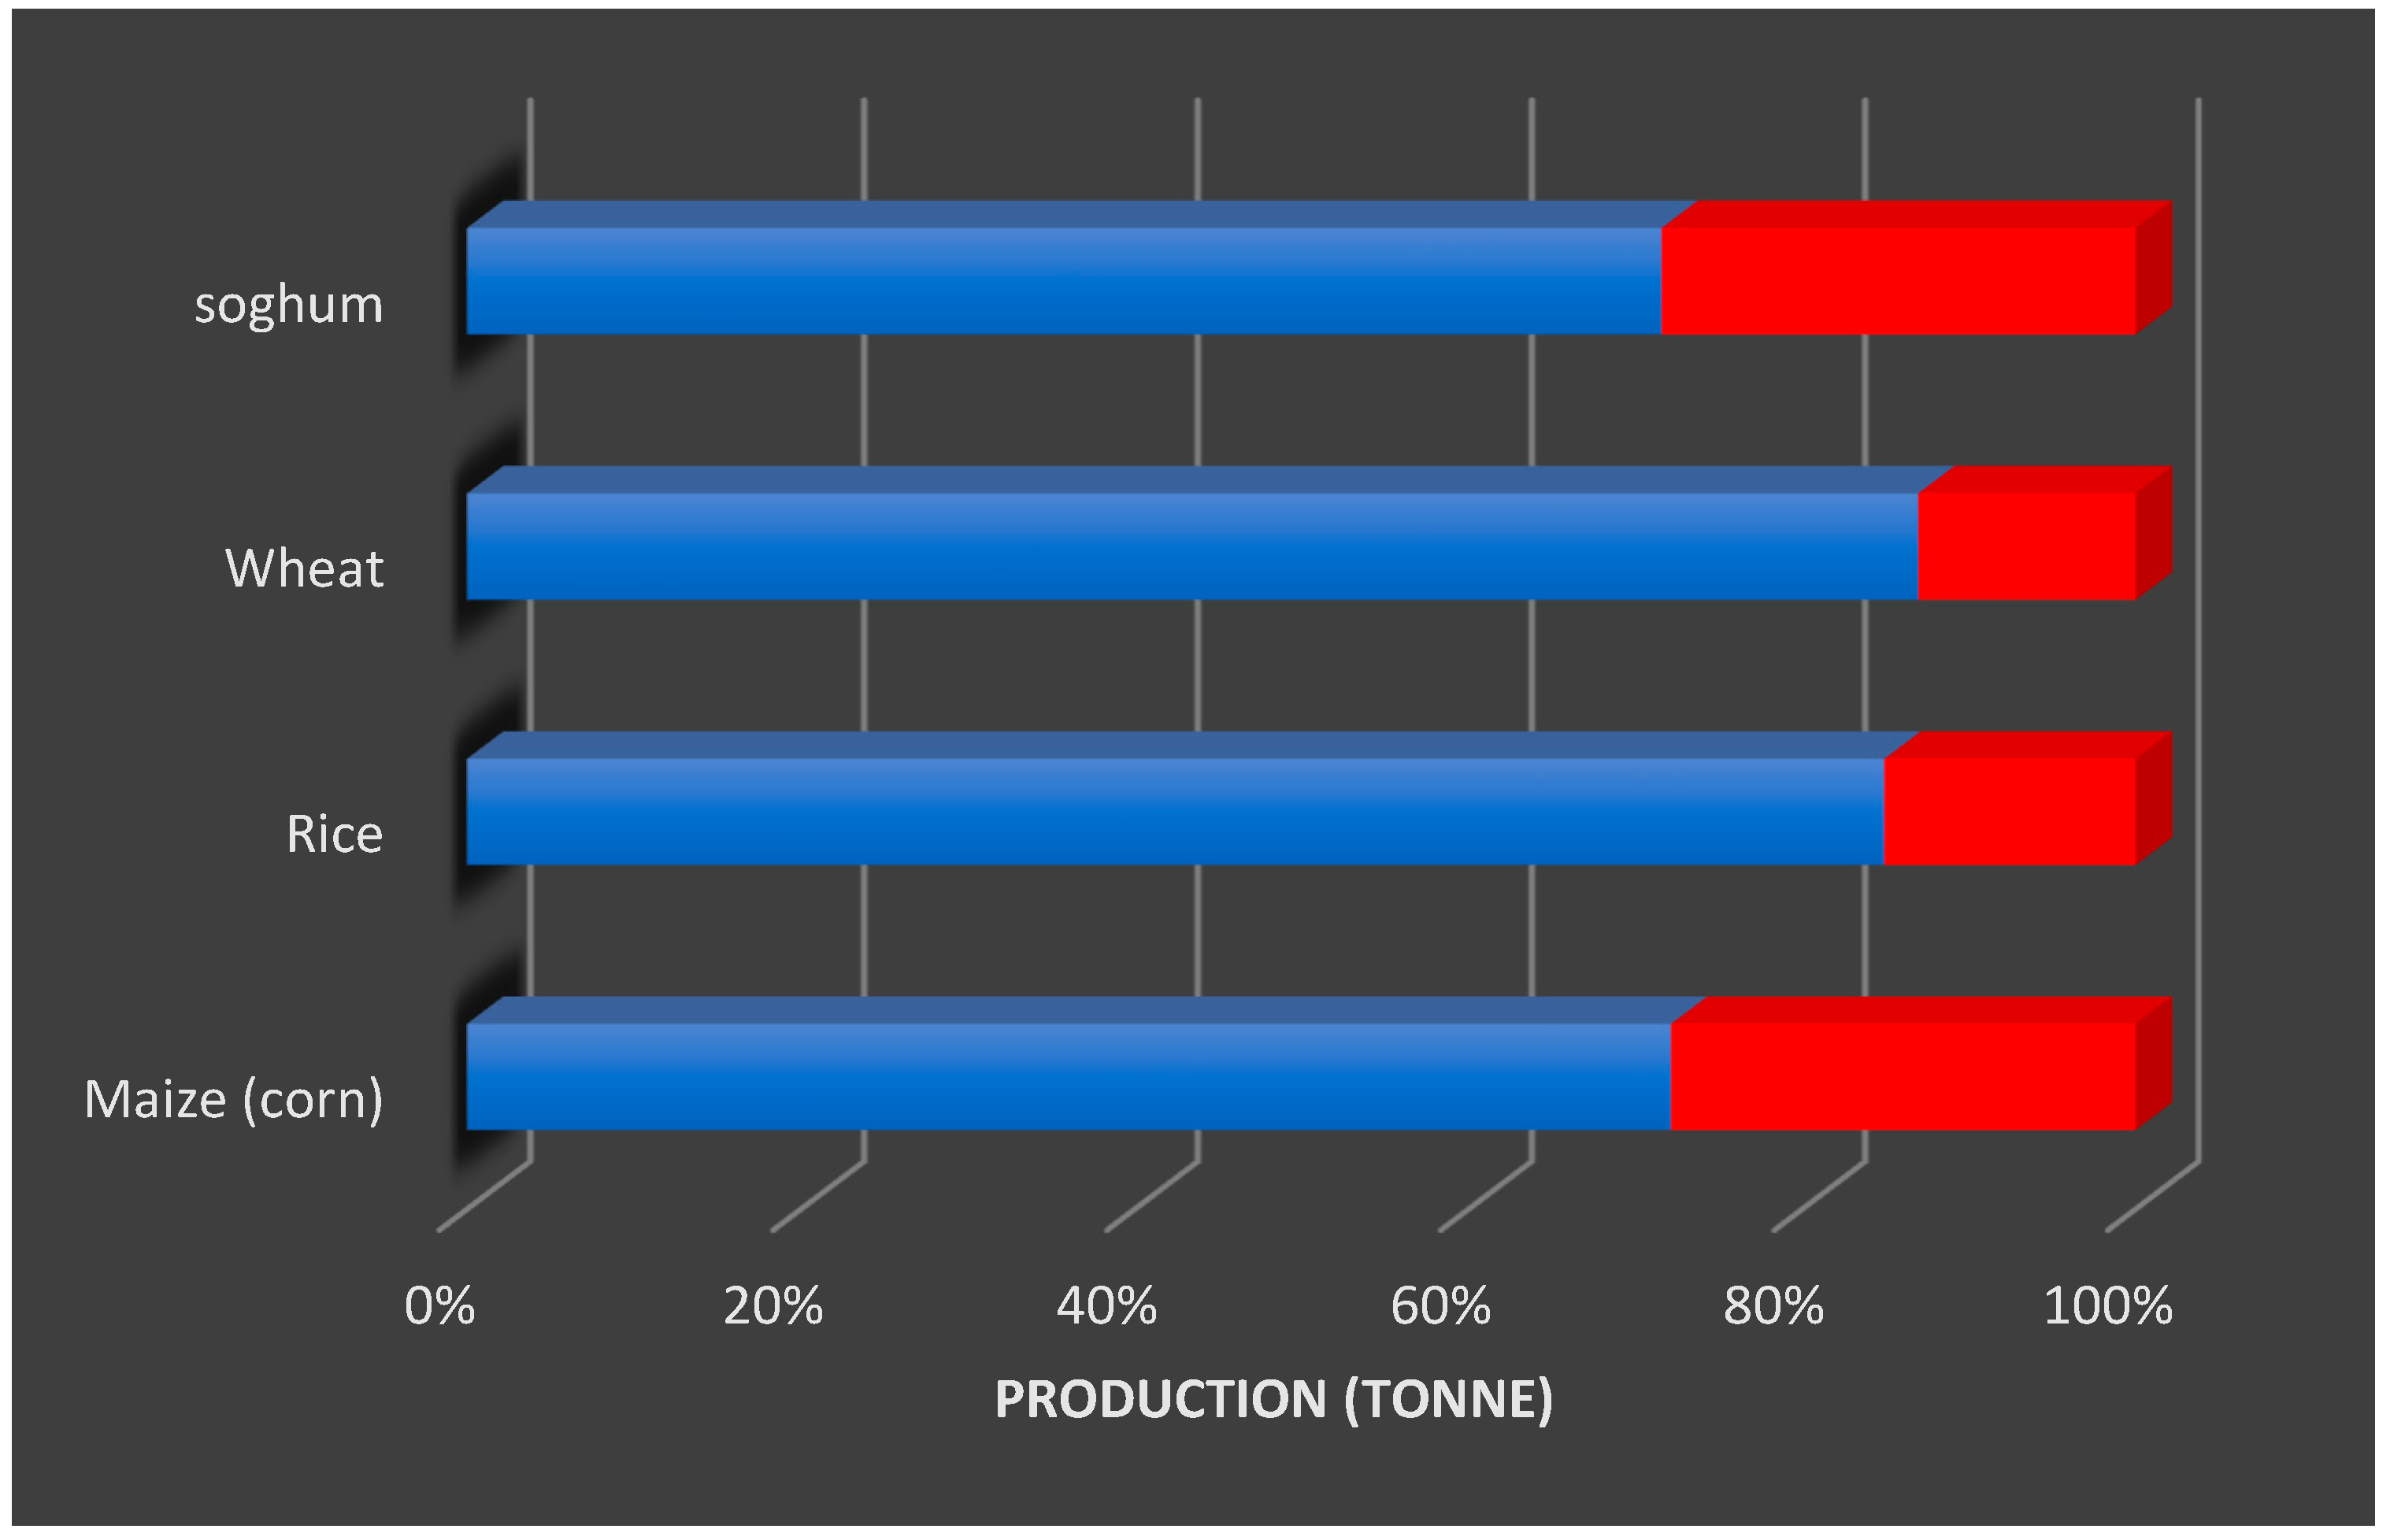
With reference to KSA fertilizer exports to the global market, Figure 8 shows the importer countries: Thailand, the United States of America, Netherlands, Bangladesh, South Africa, Australia, Sudan, Pakistan, Tanzania, Mozambique, Sir Lanka, Philippines, Ethiopia, and Argentina. These importer countries rank among the main producing countries of wheat, sorghum, maize, rice, and millet (staple cereal crops) in the world (Figure 9, Figure 10, Figure 11, Figure 12 and Figure 13). In addition, these countries have shares in global production of wheat, sorghum, maize, and rice of 15, 40, 39, and 18%, respectively, besides 17% of millet, concluding that KSA contributes to the availability of these staple grains globally (Figure 14).
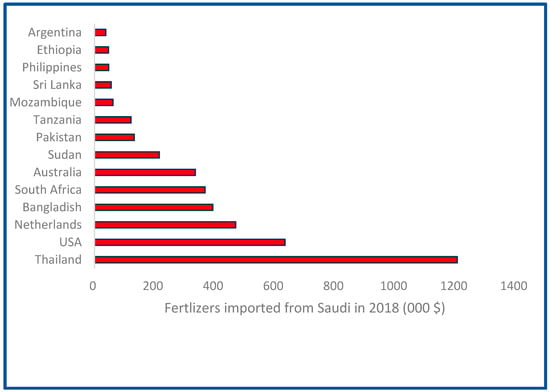
Figure 8.
Top countries importing fertilizer from KSA (000 USD) in 2018. Source: Constructed by author.
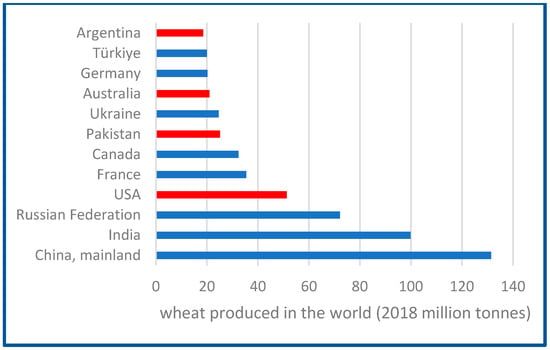
Figure 9.
Top counties producing wheat in the world (2018 million tonnes). Source: Author calculations based on collected data. Red color = country importing fertilizer from KSA.
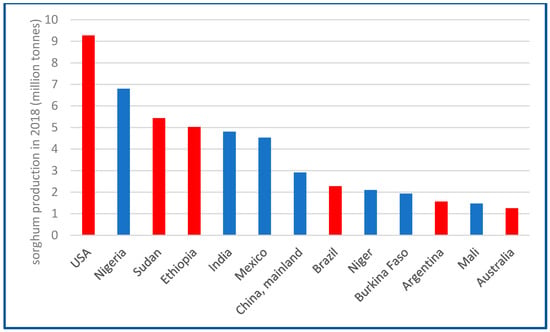
Figure 10.
Top countries producing sorghum in the world (2018 million tonnes). Source: Author calculations based on collected data. Red color = country importing fertilizer from KSA.
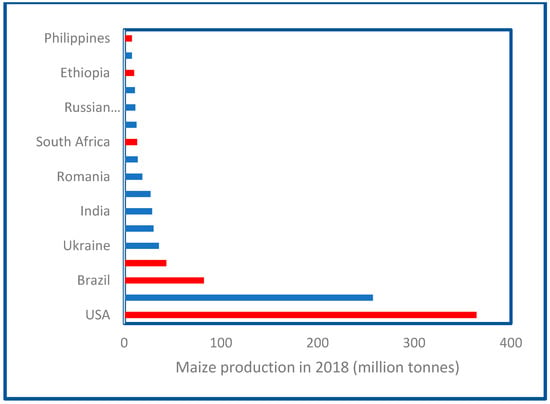
Figure 11.
Top countries producing maize in the world (2018 million tonnes). Source: Author calculations based on collected data. Red color = country importing fertilizer from KSA.
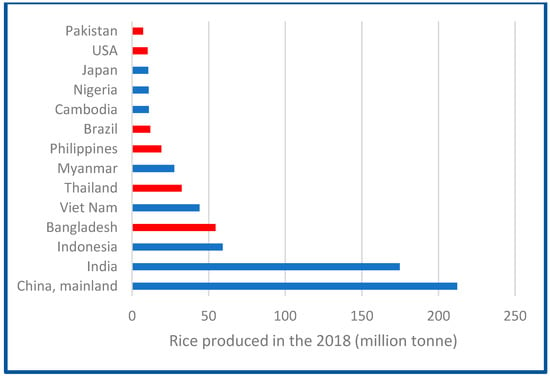
Figure 12.
Top countries producing rice in the world (2018 million tonnes). Source: Author calculations based on collected data. Red color = country importing fertilizer from KSA.
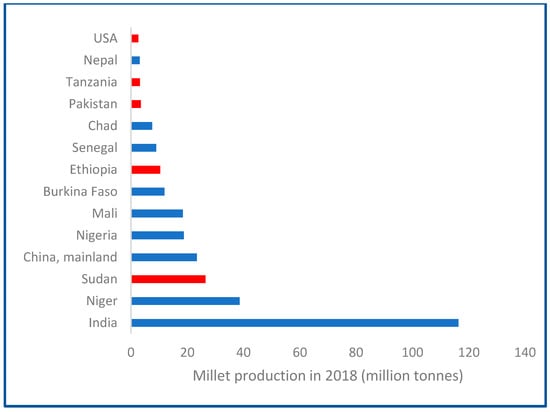
Figure 13.
Top countries producing millet in the world (2018 million tonnes). Source: Author calculations based on collected data. Red color = country importing fertilizer from KSA.
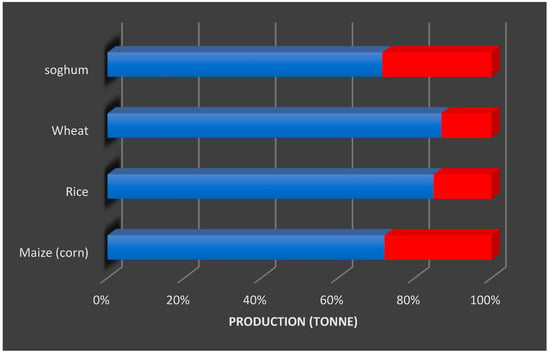
Figure 14.
Share of countries (importers of KSA fertilizers) to the total global production of main grains (percentage). Source: Author calculations based on collected data. Red color= the share of countries importing fertilizer from KSA.
Pearl millet is an important cereal globally and is the sixth-highest produced crop after maize, wheat, rice, barley, and sorghum [69]. These crops have an important role in achieving food security. Maize is the staple food crop in sub-Saharan Africa (SSA) followed by sorghum [70]. Globally, wheat, maize, and rice, are the primary cereal crops considered and consumed as staple foods by most of the population [71,72].
The final conclusion of these results is that KSA fertilizer (urea and DAP) export quantities contribute directly to global food security by fertilizer exportation and indirectly through the higher contribution of the importers countries of KSA fertilizers (urea and DAP) in the global grain production (wheat, sorghum, maize, rice and miller).
4. Discussion, Conclusions, and Recommendations
The study evaluates the long-run association between the KSA and world export fertilizer (urea and DAP) prices. It also aims to disclose the effect of KSA fertilizer export quantities on global food security. Fertilizer prices and quantities data from the KSA and across the world were collected from various sources for the period ranging from 2002 to 2020. The results from the ARDL bounds and Engle–Granger two-step procedure tests showed that there are long-run associations among KSA and world urea and DAP prices, respectively. The DOLS and FMOLS model results were well-matched with the results of the ARDL model. From the results of ECM, the coefficient of adjustment parameter for KSA urea and DAP prices (as dependent variable) proved positive and insignificant, concluding that the model was powerless to right its previous time instability, and this may be due to the short time interval of the series under study and mean it requires more than 12 months to return to its long-run equilibrium. Likewise, the results show that the KSA fertilizer (urea and DAP) export quantities have a positive, highly significant impact on world urea and DAP export quantities, concluding that KSA fertilizers (urea and DAP) make a considerable contribution to global food security. Additionally, the growth rate of urea was equal to 0.002 for the period 2002 to 2018 and forecast to be 0.004 for the period 2019 to 2026, respectively, indicating an increase in the urea export quantity (by 0.004) from the KSA during the forecast period. In addition, the growth rate of the DAP export quantity equaled 0.45 for the period 2002 to 2018 and will be 0.07 for the forecast period 2019 to 2026, respectively, concluding that there will be an increase in the export quantity of DAP (0.07) during the forecast period. In reference to KSA fertilizer exports to the global market, Thailand, the United States of America, Netherlands, Bangladesh, South Africa, Australia, Sudan, Pakistan, Tanzania, Mozambique, Sir Lanka, the Philippines, Ethiopia, and Argentina are importer countries and rank among the main producing countries of wheat, sorghum, maize, rice, and millet (staple food crops) in the world, concluding that KSA fertilizer (urea and DAP) export quantities contribute directly to global food security through fertilizer exportation and indirectly through the greater contribution of the importers countries of Saudi fertilizers in the world production of staple food crops. Recommendations were drawn from the results are that an increase in the contribution of the KSA to global food security should be encouraged through reducing the time needed to absorb KSA fertilizer price shocks in the world (less than one year) and by increasing the quantities of KSA fertilizer exported.
Funding
The author extends her appreciation to the Deputyship for Research & Innovation, Ministry of Education in Saudi Arabia for funding this research work through the project number INST118.
Institutional Review Board Statement
Not applicable.
Informed Consent Statement
Not applicable.
Data Availability Statement
The research depended on the following data: the fertilizer export prices of Saudi and the world (urea and DAP) were collected for the period extended from 2002 to 2020 from https://www.worldbank.org/en/research/commodity-markets (accessed on 16 August 2022). Also, the fertilizer export quantities (urea and DAP) from Saudi and the world were collected for the period of the study from https://www.fao.org/faostat/ar/#data/RFB (accessed on 17 August 2022).
Conflicts of Interest
The author declare no conflict of interest.
References
- World Food Summit. Declaration on World Food Security, Rome; FAO: Rome, Italy, 1996. [Google Scholar]
- Van Meijl, H.; Shutes, L.; Valin, H.; Stehfest, E.; van Dijk, M.; Kuiper, M.; Havlik, P. Modelling alternative futures of global food security: Insights from FOODSECURE. Glob. Food Secur. 2020, 25, 100358. [Google Scholar] [CrossRef]
- FAO. The State of Food and Agriculture. 1996. Available online: http://www.fao.org/3/w1358e/w1358e00.htm (accessed on 14 January 2023).
- Guiné, R.D.P.F.; Pato, M.L.D.J.; Costa, C.A.D.; Costa, D.D.V.T.A.D.; Silva, P.B.C.D.; Martinho, V.J.P.D. Food Security and Sustainability: Discussing the Four Pillars to Encompass Other Dimensions. Foods 2021, 10, 2732. [Google Scholar] [CrossRef]
- Béné, C. Resilience of local food systems and links to food security–A review of some important concepts in the context of COVID-19 and other shocks. Food Secur. 2020, 12, 805–822. [Google Scholar] [CrossRef]
- Magrini, E.; Vigani, M. Technology adoption and the multiple dimensions of food security: The case of maize in Tanzania. Food Secur. 2016, 8, 707–726. [Google Scholar] [CrossRef]
- Nosratabadi, S.; Khazami, N.; Abdallah, M.B.; Lackner, Z.; SBand, S.; Mosavi, A.; Mako, C. Social capital contributions to food security: A comprehensive literature review. Foods 2020, 9, 1650. [Google Scholar] [CrossRef] [PubMed]
- Oakley, A.R.; Nikolaus, C.J.; Ellison, B.; Nickols-Richardson, S.M. Food insecurity and food preparation equipment in US households: Exploratory results from a cross-sectional questionnaire. J. Hum. Nutr. Diet. 2019, 32, 143–151. [Google Scholar] [CrossRef]
- Houessou, M.D.; Cassee, A.; Sonneveld, B.G. The effects of the covid-19 pandemic on food security in rural and urban settlements in benin: Do allotment gardens soften the blow? Sustainability 2021, 13, 7313. [Google Scholar] [CrossRef]
- Allee, A.; Lynd, L.R.; Vaze, V. Cross-national analysis of food security drivers: Comparing results based on the Food Insecurity Experience Scale and Global Food Security Index. Food Secur. 2021, 13, 1245–1261. [Google Scholar] [CrossRef]
- Barrett, C.B. Measuring food insecurity. Science 2010, 327, 825–828. [Google Scholar] [CrossRef]
- Coates, J. Build it back better: Deconstructing food security for improved measurement and action. Glob. Food Secur. 2013, 2, 188–194. [Google Scholar] [CrossRef]
- Tendall, D.M.; Joerin, J.; Kopainsky, B.; Edwards, P.; Shreck, A.; Le, Q.B.; Six, J. Food system resilience: Defining the concept. Glob. Food Secur. 2015, 6, 17–23. [Google Scholar] [CrossRef]
- EIU. The Global Food Security Index 2019: Strengthening Food Systems and the Environment through Innovation and Investment. Economist Intelligence Unit. 2019. Available online: Global-Food-Security-Index-2019-report-1.pdf (accessed on 2 March 2023).
- IPC Global Partners. Integrated Food Security Phase Classification Technical Manual Version 3.0. Evidence and Standards for Better Food Security and Nutrition Decisions. IPC. 2019. Available online: http://www.ipcinfo.org/ipc/technical/manual/version3/ (accessed on 1 April 2023).
- Russell, J.; Lechner, A.; Hanich, Q.; Delisle, A.; Campbell, B.; Charlton, K. Assessing food security using household consumption expenditure surveys (HCES): A scoping literature review. Public Health Nutr. 2018, 21, 2200–2210. [Google Scholar] [CrossRef] [PubMed]
- Saint Ville, A.; Po JY, T.; Sen, A.; Bui, A.; Melgar-Quiñonez, H. Food security and the food insecurity experience scale (FIES): Ensuring progress by 2030. Food Secur. 2019, 11, 483–491. [Google Scholar] [CrossRef]
- UN General Assembly. Work of the Statistical Commission pertaining to the 2030 Agenda for Sustainable Development. Pub. L. No. A/RES/71/313. 2017. Available online: https://undocs.org/A/RES/71/313 (accessed on 1 April 2023).
- Smith, M.D.; Kassa, W.; Winters, P. Assessing food insecurity in Latin America and the Caribbean using FAO’s food insecurity experience scale. Food Policy 2017, 71, 48–61. [Google Scholar] [CrossRef]
- Smith, M.D.; Rabbitt, M.P.; Coleman-Jensen, A. Who is the World’s food insecure? New evidence from the food and agriculture Organization’s food insecurity experience scale. World Dev. 2017, 93, 402–412. [Google Scholar] [CrossRef]
- Park, J.Y.; Ville, A.S.; Schwinghamer, T.; Melgar-Quiñonez, H. Heterogeneous factors predict food insecurity among the elderly in developed countries: Insights from a multi-national analysis of 48 countries. Food Secur. 2019, 11, 541–552. [Google Scholar] [CrossRef]
- EIU. The Global Food Security Index 2016: An Annual Measure of the State of Global Food Security. Economist Intelligence Unit Limited. 2016. Available online: https://www.google.com/url?sa=t&rct=j&q=&esrc=s&source=web&cd=&ved=2ahUKEwjM0qLDitv-AhUEklYBHU7XCQgQFnoECAsQAQ&url=http%3A%2F%2Fwww.cold.org.gr%2Flibrary%2Fdownloads%2FDocs%2FEIU%2520Global%2520Food%2520Security%2520Index%2520-%25202016%2520Findings%2520%26%2520Methodology.pdf&usg=AOvVaw3Frwj8lNs-SHkjPMB7vHDS (accessed on 2 March 2023).
- Izraelov, M.; Silber, J. An assessment of the global food security index. Food Secur. 2019, 11, 1135–1152. [Google Scholar] [CrossRef]
- Richterman, A.; Azman, A.S.; Constant, G.; Ivers, L.C. The inverse relationship between national food security and annual cholera incidence: A 30-country analysis. BMJ Glob. Health 2019, 4, e001755. [Google Scholar] [CrossRef]
- Laborde, D.; Majeed, F.; Tokgoz, S.; Torero, M. Long-Term Drivers of Food and Nutrition Security (No. 1531; IFPRI Discussion Paper). International Food Policy Research Institute. 2016. Available online: https://ssrn.com/abstract=2801280 (accessed on 1 April 2023).
- Kidane, L.; Kejela, A. Food security and environment conservation through sustainable use of wild and semi-wild edible plants: A case study in Berek Natural Forest, Oromia Special Zone, Ethiopia. Agric. Food Secur. 2021, 10, 29. [Google Scholar] [CrossRef]
- Akbari, M.; Foroudi, P.; Shahmoradi, M.; Padash, H.; Parizi, Z.S.; Khosravani, A.; Cuomo, M.T. The evolution of food security: Where are we now, where should we go next? Sustainability 2022, 14, 3634. [Google Scholar] [CrossRef]
- Jambo, Y.; Alemu, A.; Tasew, W. Impact of small-scale irrigation on household food security: Evidence from Ethiopia. Agric. Food Secur. 2021, 10, 21. [Google Scholar] [CrossRef]
- Bagnall, D.K.; Shanahan, J.F.; Flanders, A.; Morgan, C.L.; Honeycutt, C.W. Soil health considerations for global food security. Agron. J. 2021, 113, 4581–4589. [Google Scholar] [CrossRef]
- UNDESA. World Family Planning; United Nations, Department of Economic and Social Affairs: New York, NY, USA, 2020; ISBN 9789211483482. [Google Scholar]
- Schiefer, J.; Lair, G.J.; Blum, W.E.H. Potential and limits of land and soil for sustainable intensification of European agriculture. Agric. Ecosyst. Environ. 2016, 230, 283–293. [Google Scholar] [CrossRef]
- Khanna, S.K. Food Availability, Food Security, and Maternal Mental Health. Ecol. Food Nutr. 2020, 59, 1–2. [Google Scholar] [CrossRef]
- Anghinoni, G.; Anghinoni FB, G.; Tormena, C.A.; Braccini, A.L.; de Carvalho Mendes, I.; Zancanaro, L.; Lal, R. Conservation agriculture strengthen sustainability of Brazilian grain production and food security. Land Use Policy 2021, 108, 105591. [Google Scholar] [CrossRef]
- Jenderedjian, A.; Bellows, A.C. Rural poverty, violence, and power: Rejecting and endorsing gender mainstreaming by food security NGOs in Armenia and Georgia. World Dev. 2021, 140, 105270. [Google Scholar] [CrossRef]
- Chen, L.; Chang, J.; Wang, Y.; Guo, A.; Liu, Y.; Wang, Q.; Xie, Z. Disclosing the future food security risk of China based on crop production and water scarcity under diverse socioeconomic and climate scenarios. Sci. Total Environ. 2021, 790, 148110. [Google Scholar] [CrossRef]
- Pakravan-Charvadeh, M.R.; Mohammadi-Nasrabadi, F.; Gholamrezai, S.; Vatanparast, H.; Flora, C.; Nabavi-Pelesaraei, A. The short-term effects of COVID-19 outbreak on dietary diversity and food security status of Iranian households (A case study in Tehran province). J. Clean. Prod. 2021, 281, 124537. [Google Scholar] [CrossRef]
- Nabuuma, D.; Ekesa, B.; Faber, M.; Mbhenyane, X. Community perspectives on food security and dietary diversity among rural smallholder farmers: A qualitative study in central Uganda. J. Agric. Food Res. 2021, 5, 100183. [Google Scholar] [CrossRef]
- Rosegrant, M.W.; Cline, S.A. Global food security: Challenges and policies. Science 2003, 302, 1917–1919. [Google Scholar] [CrossRef]
- Godfray, H.C.J.; Pretty, J.; Thomas, S.M.; Warham, E.J.; Beddington, J.R. Linking Policy on Climate and Food. Science 2011, 331, 1013–1014. [Google Scholar] [CrossRef]
- Wang, J.; Dai, C. Evolution of Global Food Trade Patterns and Its Implications for Food Security Based on Complex Network Analysis. Foods 2021, 10, 2657. [Google Scholar] [CrossRef] [PubMed]
- Wood, S.A.; Smith, M.R.; Fanzo, J.; Remans, R.; DeFries, R.S. Trade and the equitability of global food nutrient distribution. Nat. Sustain. 2018, 1, 34–37. [Google Scholar] [CrossRef]
- D’Odorico, P.; Carr, J.A.; Laio, F.; Ridolfi, L.; Vandoni, S. Feeding humanity through global food trade. Earths Future 2014, 2, 458–469. [Google Scholar] [CrossRef]
- Zhang, C.; Yang, Y.; Feng, Z.; Xiao, C.; Lang, T.; Du, W.; Liu, Y. Risk of Global External Cereals Supply under the Background of the COVID-19 Pandemic: Based on the Perspective of Trade Network. Foods 2021, 10, 1168. [Google Scholar] [CrossRef]
- Shin, M. A geospatial analysis of market integration: The case of the 2004/5 food crisis in Niger. Food Secur. 2010, 2, 261–269. [Google Scholar] [CrossRef]
- Singirankabo, U.A.; Ertsen, M.W. Relations between land tenure security and agricultural productivity: Exploring the effect of land registration. Land 2020, 9, 138. [Google Scholar] [CrossRef]
- Lu, D.; Wang, Y.; Yang, Q.; He, H.; Su, K. Exploring a moderate fallow scale of cultivated land in China from the perspective of food security. Int. J. Environ. Res. Public Health 2019, 16, 4329. [Google Scholar] [CrossRef]
- Jaga, P.K.; Patel, Y. An overview of fertilizers consumption in India: Determinants and outlook for 2020-a review. Int. J. Sci. Eng. Technol. 2012, 1, 285–291. Available online: https://www.indianjournals.com/ijor.aspx?target=ijor:ijset1&volume=1&issue=6&article=004 (accessed on 15 October 2022).
- Prasad, R. Efficient fertilizer use: The key to food security and better environment. J. Trop. Agric. 2009, 47, 1–17. [Google Scholar]
- Khalf, Y.S.; Mohammad, K.K. Measurement of Natural Radioactivity Level in Selected Phosphate Fertilizer Samples Collected from Iraqi Markets. Al-Nahrain J. Sci. 2021, 24, 43–49. Available online: https://mail.anjs.edu.iq/index.php/anjs/article/view/2413 (accessed on 1 April 2023).
- Emam, A.A.; Kamel, H. Co-integration and Market Integration: An Application to Millet Markets in Darfur States, Sudan. J. Agric. Sci. 2002, 10, 277–289. [Google Scholar]
- Emam, A.A. The Impacts of Covid-19: An Econometric Analysis of Crude Oil Prices and Rice Prices in the World. J. Agric. Sci. 2020, 35, 137–143. [Google Scholar] [CrossRef]
- Monke, E.; Petzel, T. Market integration: An application to international trade in cotton. Am. J. Agric. Econ. 1984, 66, 481–487. [Google Scholar] [CrossRef]
- Emam, A.A. Agricultural Marketing; Book in Arabic Language; Ministry of Education: Khartoum, Sudan, 2002. [Google Scholar]
- Hamieh, A.; Rowaihy, F.; Al-Juaied, M.; Abo-Khatwa, A.N.; Afifi, A.M.; Hoteit, H. Quantification and analysis of CO2 footprint from industrial facilities in Saudi Arabia. Energy Convers. Manag. 2022, 16, 100299. [Google Scholar] [CrossRef]
- KSA Vision 2030. Strategic Objectives and Vision Realization Programs, Saudi Vision 2030. 2019. Available online: https://www.my.gov.sa/wps/portal/snp/content/saudivision/?lang=en (accessed on 10 October 2022).
- Capital, S.H. KSA Petrochemical Sector: Feedstock Advantage and Expansion Efforts Drive Growth; Saudi Hollandi Capital: Riyadh, Saudi Arabia, 2012. [Google Scholar]
- Sabic. Sabic-Agrinutrients. 2023. Available online: https://www.sabic.com/en/products/agri-nutrients/agri-nutrients/granular-urea (accessed on 5 January 2023).
- Sabic. Sabic-Agrinutrients. 2023. Available online: https://www.sabic.com/en/products/agri-nutrients/agri-nutrients/granular-DAP (accessed on 5 January 2023).
- FAO. 2021. Available online: https://www.fao.org/faostat/ar/#data/RFB (accessed on 17 August 2022).
- World Bank. 2021. Available online: https://www.worldbank.org/en/research/commodity-markets (accessed on 16 August 2022).
- Dickey, D.A.; Fuller, W.A. Distribution of the estimators for autoregressive time series with a unit root. J. Am. Stat. Assoc. 1979, 74, 427–431. [Google Scholar] [CrossRef]
- Emam, A.A. Present and Future: Does agriculture affect economic growth and environment in the Kingdom of Saudi Arabia? J. Agric. Econ. Czech Acad. Agric. Sci. 2022, 68, 361–370. [Google Scholar] [CrossRef]
- Pesaran, M.; Hashem, Y.S.; Richard, J.S. Bounds testing approaches to the analysis of level relationships. J. Appl. Econom. 2001, 16, 289–326. [Google Scholar] [CrossRef]
- Peseran, M.H.; Peseran, B. Working with Microfit 4.0: Interactive Econometric Analysis; Oxford University Press: Oxford, UK, 1997. [Google Scholar]
- Ahmad, N.; Liangsheng, D.; Jiye, L.; Jianlin, W.; Hong-Zhou, L.; Muhammad, Z.H. Modelling the CO2 emissions and economic growth in Croatia: Is there any environmental Kuznets curve? Energy 2017, 123, 164–172. [Google Scholar] [CrossRef]
- Venujayakanth, B.; Swaminathan Dudhat, A.; Swaminathan, B.; Ardeshana, N.J. Price integration analysis of major groundnut domestic markets in India. Econ. Aff. 2017, 62, 233–241. [Google Scholar] [CrossRef]
- Zhai, X.; Zhongyuan, G.; Xue, Z. Two-Stage Dynamic Test of The Determinants of the Long-Run Decline of China’s Monetary Velocity. Chin. Econ. 2013, 46, 23–40. [Google Scholar] [CrossRef]
- Doğan, N. The impact of agriculture on CO2 emissions in China. Panoeconomicus 2018, 66, 257–271. [Google Scholar] [CrossRef]
- Hassan, Z.M.; Sebola, N.A.; Mabelebele, M. The nutritional use of millet grain for food and feed: A review. Agric. Food Secur. 2021, 10, 16. [Google Scholar] [CrossRef]
- Raheem, D.; Dayoub, M.; Birech, R.; Nakiyemba, A. The contribution of cereal grains to food security and sustainability in Africa: Potential application of UAV in Ghana, Nigeria, Uganda, and Namibia. Urban Sci. 2021, 5, 8. [Google Scholar] [CrossRef]
- Neupane, D.; Adhikari, P.; Bhattarai, D.; Rana, B.; Ahmed, Z.; Sharma, U.; Adhikari, D. Does climate change affect the yield of the top three cereals and food security in the world? Earth 2022, 3, 45–71. [Google Scholar] [CrossRef]
- Wang, J.; Vanga, S.K.; Saxena, R.; Orsat, V.; Raghavan, V. Effect of climate change on the yield of cereal crops: A review. Climate 2018, 6, 41. [Google Scholar] [CrossRef]
Disclaimer/Publisher’s Note: The statements, opinions and data contained in all publications are solely those of the individual author(s) and contributor(s) and not of MDPI and/or the editor(s). MDPI and/or the editor(s) disclaim responsibility for any injury to people or property resulting from any ideas, methods, instructions or products referred to in the content. |
© 2023 by the author. Licensee MDPI, Basel, Switzerland. This article is an open access article distributed under the terms and conditions of the Creative Commons Attribution (CC BY) license (https://creativecommons.org/licenses/by/4.0/).

