Article

Snow Cover Temporal Dynamic Using MODIS Product, and Its Relationship with Precipitation and Temperature in the Tropical Andean Glaciers in the Alto Santa Sub-Basin (Peru)

1
Escuela Profesional de Ingeniería Topográfica y Agrimensura, Facultad de Ciencias Agrarias, Universidad Nacional del Altiplano, Puno 21001, Peru
2
Programa de Doctorado en Recursos Hídricos (PDRH), Universidad Nacional Agraria La Molina, Av. La Molina, S.N., Lima 15012, Peru
3
Escuela Profesional de Ingeniería Agrícola, Facultad de Ingeniería Agrícola, Universidad Nacional del Altiplano, Puno 21001, Peru
4
Escuela Profesional de Ingeniería Agronómica, Facultad de Ciencias Agrarias, Universidad Nacional del Altiplano, Puno 21001, Peru
5
Escuela Profesional de Ingeniería Civil, Grupo en Investigación en Ingeniería Civil, Universidad Nacional de Moquegua, Moquegua 18001, Peru
6
Servicio Nacional de Sanidad Agraria—SENASA, Av. La Molina Este Nº 1915, Lima 15026, Peru
7
Facultad de Industrias Alimentarias, Universidad Nacional Agraria La Molina, Av. La Molina s/n, Ap. 12-056, Lima 15012, Peru
8
Carrera Profesional de Ingeniería de Minas, Universidad Nacional Micaela Bastidas de Apurímac, Abancay 03001, Peru
*
Author to whom correspondence should be addressed.
Sustainability 2023, 15(9), 7610; https://doi.org/10.3390/su15097610
Submission received: 15 February 2023 / Revised: 29 April 2023 / Accepted: 2 May 2023 / Published: 5 May 2023
(This article belongs to the Special Issue Water Availability under Climate Change)

Abstract

:
The retreats of the planet’s tropical glaciers are natural indicators of the variation of precipitation, temperature, and other variables. The glaciers of the Alto Santa sub-basin are sources of freshwater storage for consumptive and non-consumptive use for different sectors. As a result of climatic variations, it is essential to analyze the dynamics of the snow cover area (SCA). The methodology consisted of processing 6578 MODIS Snow Cover MOD10A1 product images and generating 18-year time series using the Platform Google Earth Engine (GEE). Normalized Difference Snow Index (NDSI) was used to estimate the extent of snow cover, and to validate the MODIS snow cover product, we used the same overlapping date of Landsat 5 and 8 Surface Reflectance Tier 1, to examine the relationships between daily precipitation and temperature. The standardized correlation results gave good results with stations over 4500 m.a.s.l., such as Artesonraju AP2 (4828 m.a.s.l.) of −0.84 and −0.74, precipitation, and temperature. These results show coherent behaviors of the retreat due to the variation of the climatological variables. In some years, there were anomalies in the conduct of the three variables, but these originated from events of natural weather phenomena. Regarding the dynamics of the SCA in 18 years, it decreased from 649 km2 to 311.6. km2 between 2000 and 2017, representing a retreat of 41%; we can conclude and confirm that the glacier retreat is imminent due to the consequences of climate change, which would affect the security of freshwater from the tropical glaciers of the Peruvian Andes.

1. Introduction

Glaciers are one of the essential components of the Earth’s climate system and the most sensitive to climate change, which significantly impacts ecosystems, the environment, and social and economic development [1,2]. Glaciers are vital components of the cryosphere, and they store around 70% of freshwater resources on the entire planet [3].
Of the entire planet’s tropical glaciers present, approximately 99% are in the Andes Mountains range of South America, and 71% of these tropical glaciers are in Peru, most of them in the Cordillera Blanca, belonging to the Santa River basin [4]. The tropical glaciers of the Peruvian Andes are significant indicators of climate change. These glaciers are rapidly retreating, indicating that the region is experiencing substantial global warming [5]. Global warming has caused a decrease in precipitation and an increase in temperature in different parts of the planet, and this means a large amount of reduction in the area and volume of tropical glaciers, increasing surface runoff in several watersheds, especially in watersheds with tropical glaciers in Peru [6]. Several tropical glaciers in the Andes of Peru and Bolivia are buffers that reduce rainfall during dry months. Of the 99% of tropical glaciers located in the Andes Mountains of the Southern Hemisphere, several countries extend in the following order Venezuela, Colombia, Ecuador, Peru, Bolivia, Chile, and Argentina [7].
These glaciers, in general, are very sensitive due to the climate change that is happening today and are also indicators of the effect of global warming [8,9]. The reduction in the Tropical Andean Glaciers (TAG) is a significant concern due to its potential economic and environmental impacts. The decrease in the glacier area may lead to negative consequences for the use of water resources in the region. This could impact people who live in the tropical Andes, who depend on these water resources for various purposes, including human consumption, agriculture, livestock, and electricity generation [10,11].
Some methodologies and techniques are applied to determine the monitoring of the dynamics of snow cover area and glaciers in the tropical Andes, to understand the relationships with climatological variables in these and other regions of the world [12,13]. For this case and other studies, the MODIS product was launched on 18 December 1999, and the Terra satellite was established, including the moderate-resolution imaging spectroradiometer (MODIS). Most of these geophysical products were obtained from MODIS data, including snow cover area products around the globe. These products have been available at the National Snow and Ice Data Center (NSIDC) since 13 September 2000 [14]. Many snow cover maps have been obtained in the last two decades using MODIS products. This information is essential because it has a very high temporal resolution of (1 day) and a spatial resolution of (500 m) [15,16]. Therefore, taking advantage of the high temporal resolution of the MODIS images, it is necessary to know the snow cover area (SCA) of the Cordillera Blanca on a daily scale to know its dynamics of change and its relationship with the main climatic forcing, which is different from previous studies that consider mainly an evaluation of the dynamics of snow cover loss at annual time steps. The layers of the MODIS product’s snow cover area (SCA) have several advantages that make them well-suited for use at the hemispheric scale. One of the key advantages is the availability of information, which has improved over time due to the effective spatial resolution of the product [14]. The snow cover area acquisition, time series of MODIS, and Landsat 5 Surface Reflectance Tier 1 and Landsat 8 Surface Reflectance Tier 1 images were used, from 2000 to 2017, these images were processed and classified in the cloud platform Google Earth Engine [5]. The Google Earth Engine platform was designed to perform geospatial analysis of data from different sensors on a planetary scale, based on the massive computing capabilities of Google itself, in order to analyze various environmental, social, and economic problems, such as natural disasters, deforestation, diseases, food security, climate change, water management, among others [17].
First, this investigation aims to determine and analyze the time series of the snow cover area from January 2000 to 2017 using images from the MODIS sensor with daily temporal resolution and 500 m spatial resolution, processed on the Google Earth Engine (GEE) platform to analyze the dynamics of the glacier area. Second, examining the consistency of the historical daily series of climatological variables of precipitation and daily temperature is an essential step in understanding the impacts of climate change on tropical glaciers. Correlating this information with snow cover area data using the standardization method can help to identify the relationship between these variables and the potential impacts on the glaciers, and finally, the snow cover trend analysis.

2. Materials and Methods

2.1. Study Area

The Alto Santa River sub-basin is part of the basin of the same name. It is located in the tropical Andes and includes the western flank of the Cordillera Blanca (Figure 1). It is situated politically between the Ancash and La Libertad regions, belonging to the mountain range region of Peru [6]. Peru’s tropical glaciers, specifically the Cordillera Blanca, represent the planet’s highest and most extensive extension [18]. It has approximately 35% of the total area of glaciers found in the Peruvian Andes [19]. The total area of the Alto Santa sub-basin is 5334 km2 and has an average altitude of 4087 m.a.s.l. The climate is humid and cold, with annual maximum temperatures between 18 and 24 °C and minimum temperatures between 16 and −4 °C. Precipitation increases from west to east, reaching a multiannual average of 500 mm, and is above 2500 m. The most intense rainfall occurs in the border area of La Libertad, exceeding 3500 m; its variation is from 400 to more than 900 mm, annually [6].
Most Alto Santa River basin is supplied by glacial and non-glacial meltwater. The statement suggests that the resource being referred to is crucial for the population living in the basin, which has an estimated population of approximately 453,950 inhabitants. The resource is also used for all economic activities mostly downstream of the Alto Santa sub-basin [20,21]. One of the main activities found and carried out above 5000 m is tourism due to the mountains, lakes, glaciers, and mountain ecosystems, which make this sub-basin attractive. These are found throughout the entire sub-basin and below 2000 m. There are also dams for hydroelectric and agricultural irrigation purposes [20,21,22].

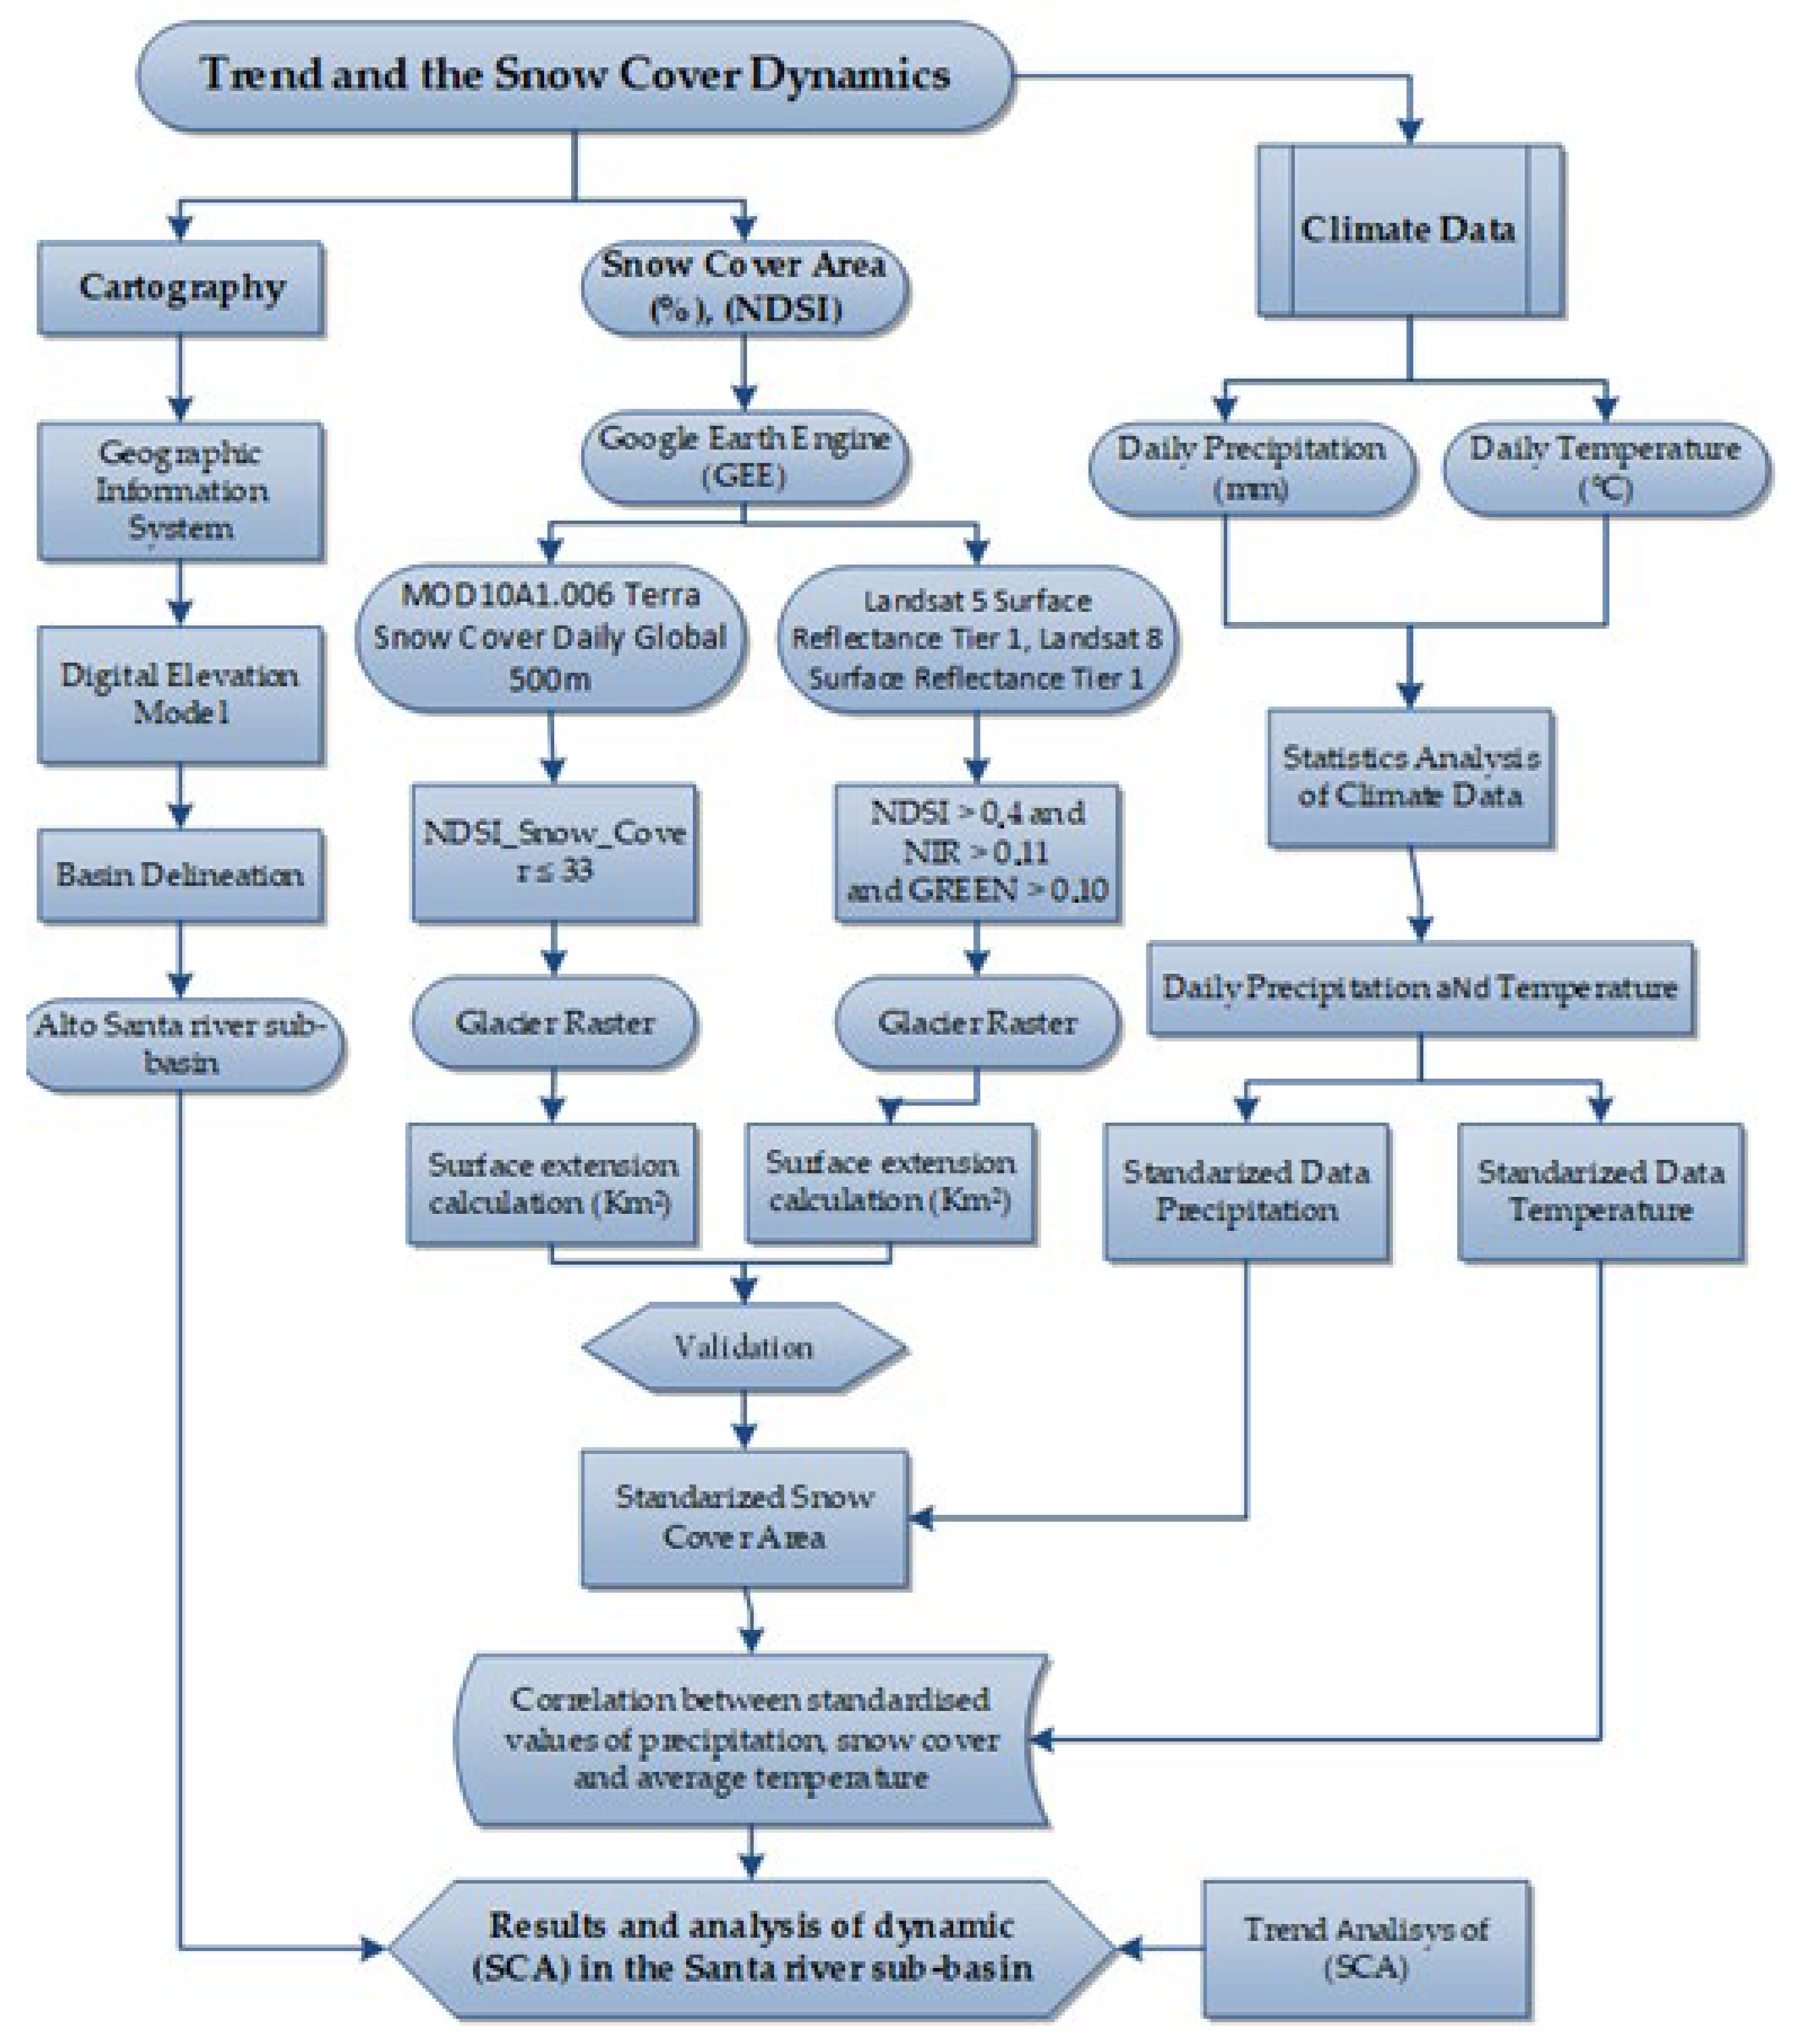
2.2. MODIS and Climatic Data Processing Workflow

The data were processed to determine the snow cover area, precipitation, and temperature. The methodology flowchart is shown in (Figure 2).

2.3. MODIS Snow Cover MOD10A1 Product Processing

The procedure for generating and analyzing time series of snow and ice cover area was performed using the Moderate-Resolution Imaging Spectroradiometer (MODIS) sensor images from 2000 to 2017. We processed approximately 6578 images using the Google Earth Engine (GEE) platform, which is designed for the geospatial analysis of data from different sensors on a planetary scale. The GEE platform analyzed social, economic, and environmental problems such as natural disasters, deforestation, diseases, food security, and climate change. The analysis results showed coherent behaviors of the retreat of snow and ice cover area due to the variation of climatological variables.
In some years, there were anomalies in the behavior of the three variables attributed to natural weather phenomena. The snow and ice cover area dynamics in 18 years have important implications for water management and other related fields. However, providing a more detailed response without more specific information about the analysis and results presented in the original research is challenging [17].
MODIS products have different types of spatial resolutions, and these are between 250 m and 1 km at the nadir [14]. In the case of this research, MODIS images with a spatial resolution of 500 m have been used. It is possible to map the dynamics of snow cover area on a global scale, regional, or local scale because the worldwide extent of snow cover has a 500 m spatial resolution, and the MODIS moderate resolution imaging spectroradiometer [23]. To map the snow cover area with the MODIS product, automated algorithms of satellite reflectance in bands 4 (0.545–0.565 µm) and band 6 (1.628–1.652 µm) are used to determine the normalized difference snow index (NDSI). It uses Equation (1) [24].
We used the Snow Cover MOD10A1 product, to remove the cloud cover from the MODIS product, and a cloud masking algorithm was applied. The cloud masking algorithm in the MOD10A1 product uses a combination of spectral and spatial filtering to identify cloud and cloud-shadow pixels. The algorithm utilizes multiple spectral bands and indices, including the visible and near-infrared bands, as well as the normalized difference snow index (NDSI) and the thermal band. The algorithm applies a set of thresholds to these bands and indices to differentiate between cloud and snow cover, pixels with high values in the visible and near-infrared bands are likely to be clouds, while pixels with high NDSI values and low thermal band values are likely to be snow-covered. Once the cloud and cloud-shadow pixels are identified, they are masked out of the Snow Cover product MOD10A1 (Figure 3).
NDSI = (band 4 − band 6)/(Band 4 + band 6)

2.4. Historical Climate Data

Daily climatological data for precipitation and temperatures were obtained from the Servicio Nacional de Meteorologia e Hidrologia (SENAMHI) and the Autoridad Nacional del Agua–Unidad de Glaciología y Recursos Hídricos (UGRH)–Huaraz, Ancash, the historical information provided corresponds from 2000 to 2017 [6].
For the statistical analysis, to complete, extend, and validate daily precipitation and daily maximum and minimum temperature data, see Table 1; several steps can be taken belonging to the direct and indirect area of the Alto Santa sub-basin. However, for the standardized correlation analysis with the snow cover area in (km2), only two climate stations were used—Artesonraju AP2 and Yanamarey—because their altitude has been considered because both are above 4500 m.a.s.l., and they are also stations that are very close to the glaciers of the area under study. However, those two stations do not have the complete information that is required, namely the information from 2000 to 2017. For such reasons, the six climate stations of the direct and indirect area have been used to perform the data consistency analysis of data from the two main stations for the study with the snow cover area in (km2), according to the procedure established in Section 2.5 and Table 1. The UGRH-Huaraz stations have less historical information, varying from 12 to 18 years, while the SENAMHI stations mostly have a historical record of 60 years of historical data.

2.5. Processing Daily Climate Data of Precipitation and Temperature

Using RStudio for statistical analysis of daily climatological variables is an excellent choice as it is powerful open-source software that is widely used for data analysis and visualization. The following steps can be taken to utilize the Climdex and Climatol packages in RStudio. However, these tools only integrate some of the calculations required to detect and correct anomalies in the series. Therefore, a need arose to incorporate them into a free access and easy-to-use interface called RClim Tool V. 2.0 [25].
The RMAWGEN package was used to fill in missing data, which, based on model estimation vectorial autoregressive (VAR), simultaneously uses information from nearby climatological stations to statistically analyze and complete the missing information at each station, using Equation (2) [26].
RMAWGEN–multi-site autoregressive weather generator. (VAR (K, p)):
Xt = A1 × Xt−2 +…+ Ap × Xt-p + C × dt + ut
where Xt is a K-dimensional vector representing the set of endogenous variables at time t. A1, A2, …, Ap are K × K matrices representing the auto-regression coefficients of the endogenous variables in the previous periods. dt is a K-dimensional vector representing the set of exogenous variables at time t, which is known and is not subject to prediction errors. C is a K × K matrix representing the coefficients of the exogenous variables. Ut is a K-dimensional vector of prediction errors, which are assumed to be white noise and have zero mean and constant variance. P is the auto-regression order, which indicates the number of previous periods included in the model.
Based on the data obtained from the six climate stations, an analysis of precipitation (mm) and the maximum and minimum daily temperature. This analysis involved examining the data’s patterns, trends, and variations to identify any significant findings and draw conclusions. The statistical methods that we have applied using Rclimtool include correlation analysis, trend analysis, time-series analysis, and extreme value analysis. These methods were used to identify patterns and trends in climate data and assess the impact of climate change. Overall, Rclimtool is a useful tool for researchers, analysts, and decision-makers who are interested in studying climate data and its potential impacts.
The collected information was prepared for insertion into the program RClimTool V. 2.0. Approximately 39,420 data were processed from January 2000 to December 2017. The information on daily precipitation, and daily maximum and minimum temperature of the stations with missing data were analyzed, completed, extended, and statistically validated.
To assess the homogeneity of the data, the authors used formal statistical tests. These tests are commonly used to identify changes in the statistical properties of a data series, such as the mean or variance, which can indicate changes in the underlying climate system. Some tests are the Mann–Kendall Test, Man–Whitney U Test, F Test, T-Test, and formal tests to detect normality [25].

3. Results

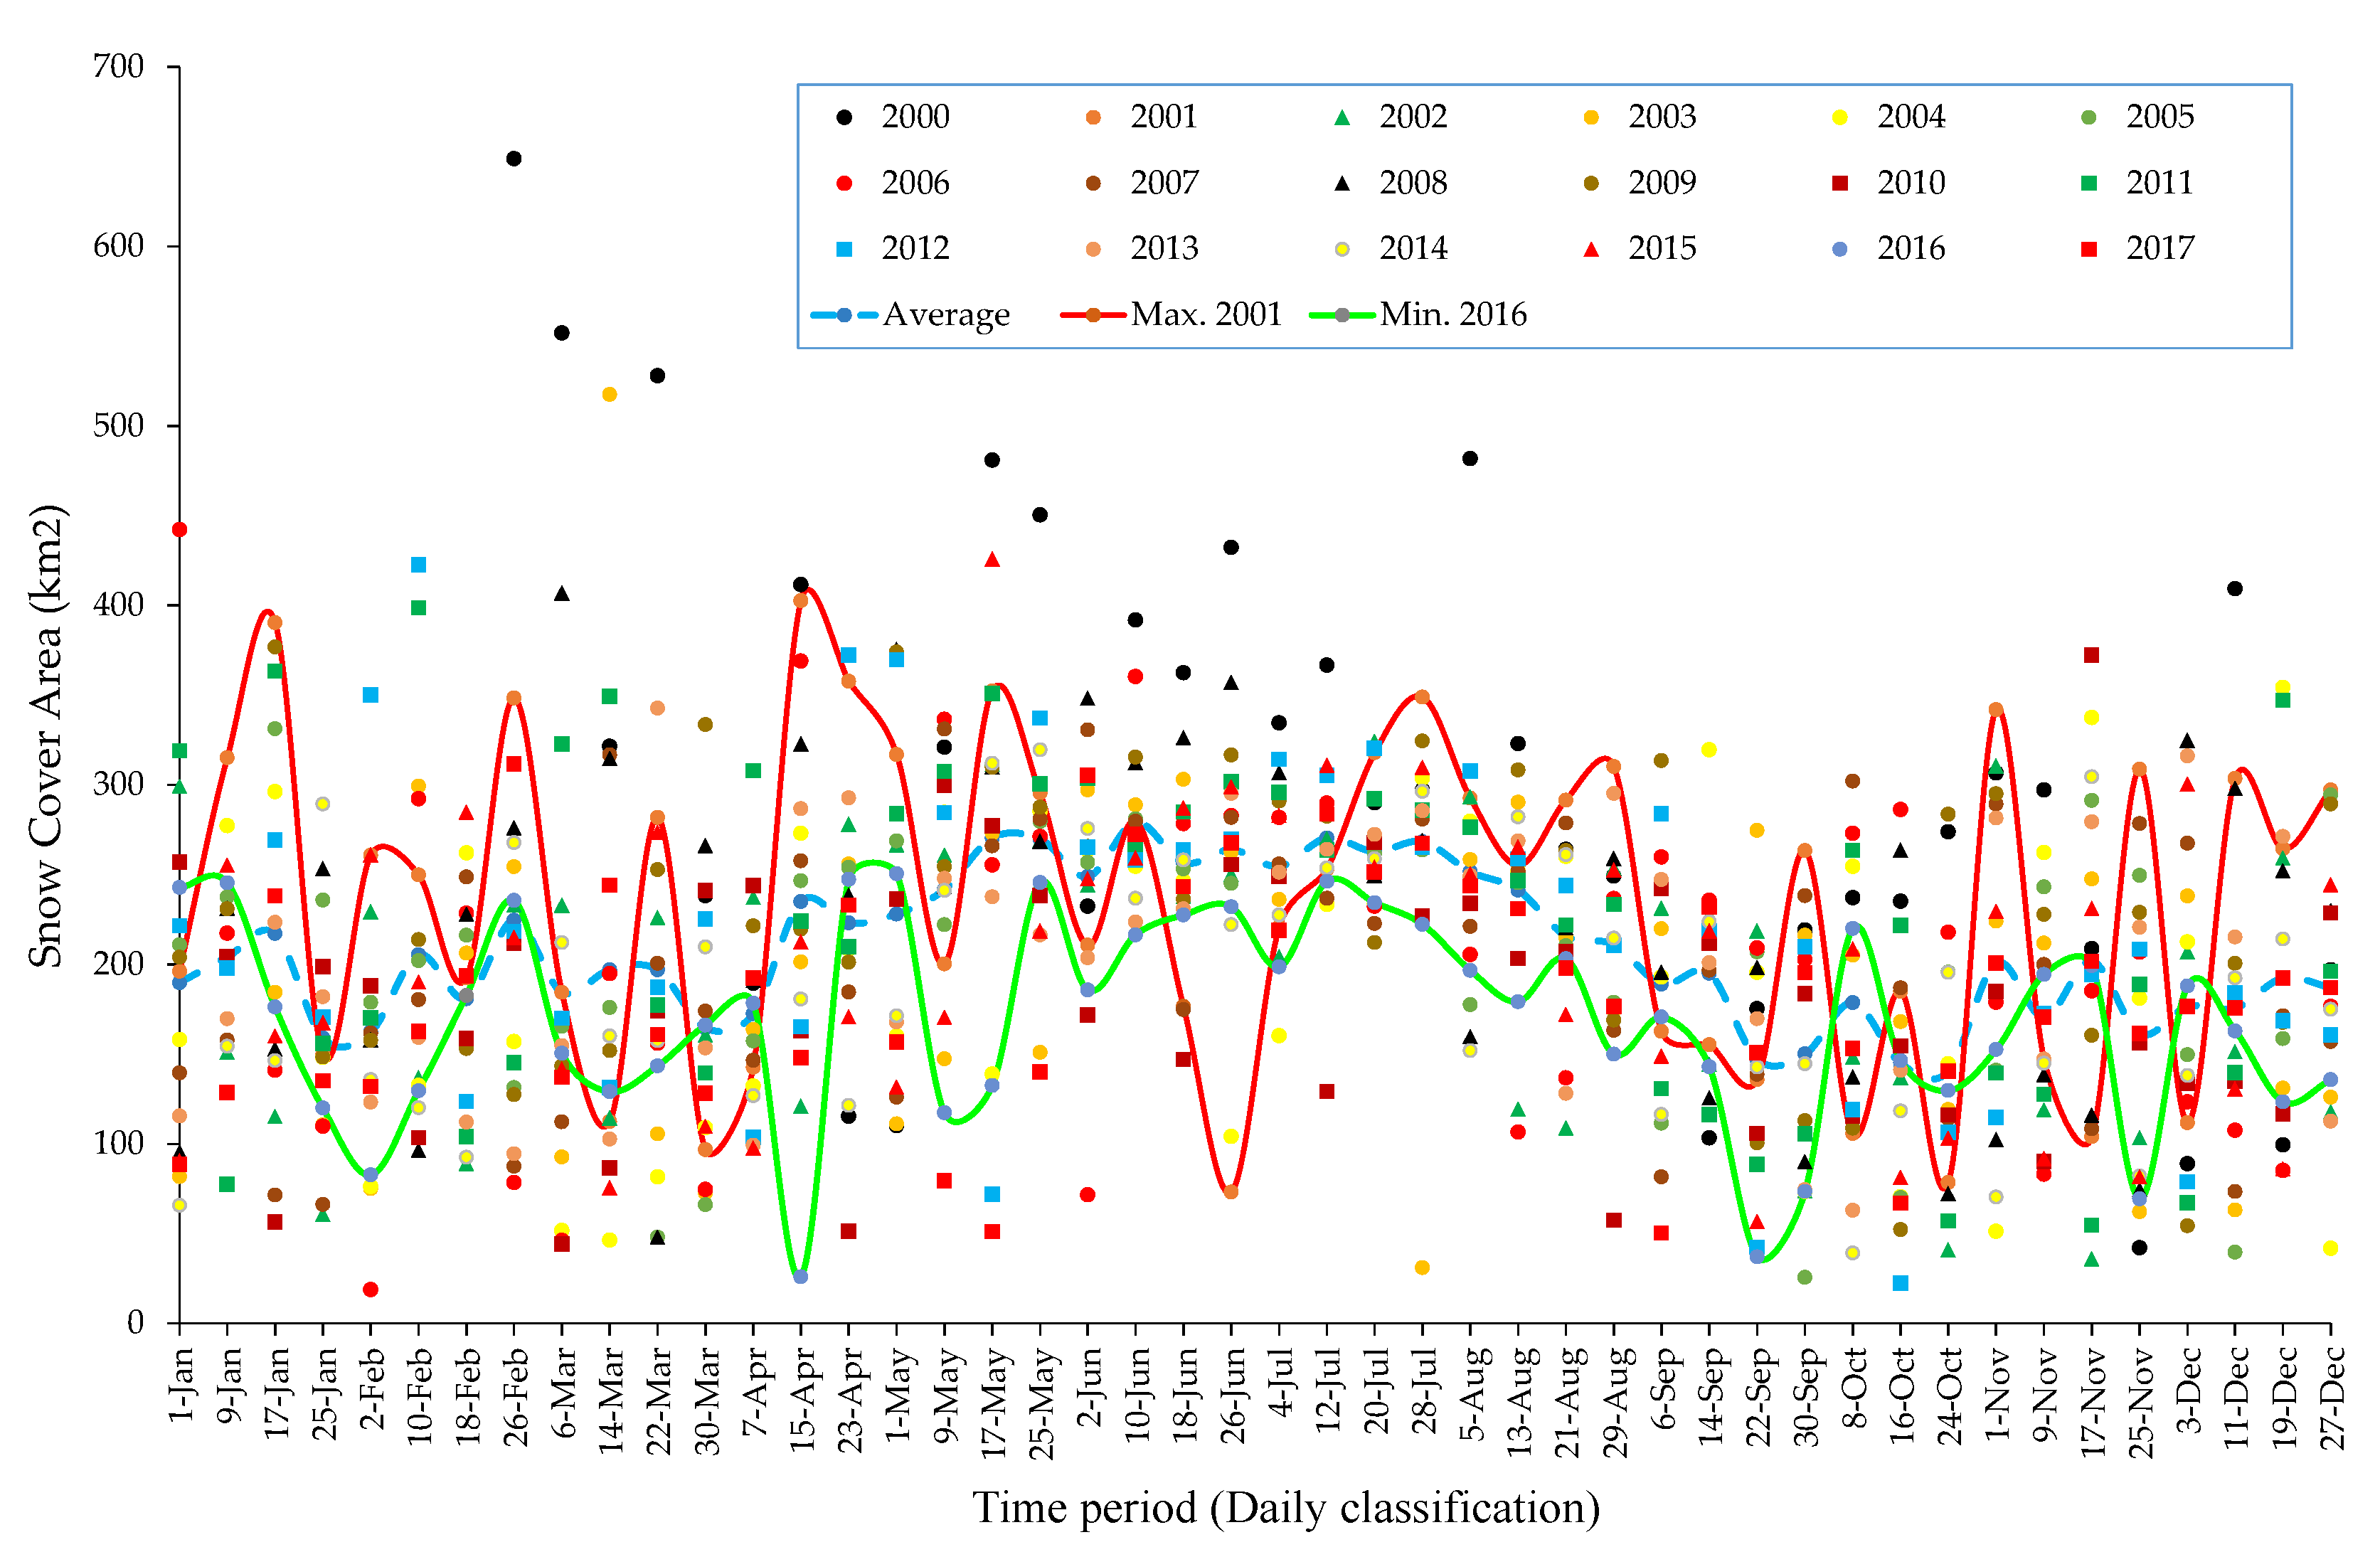
3.1. MODIS Snow Cover MOD10A1 Product Variation

The snow cover area analysis was conducted using the Google Earth Engine (GEE) platform on 18 years of record from 2000 to 2017. The results show two distinct seasonal patterns in the sub-basin located in the Cordillera Blanca. Specifically, the report indicates in summer, there is a decrease in snow cover of 1.8%, while during the winter months, there is a snow accumulation of over 6%. These results apply to the total area of the sub-basin, which is 5334 km2. The authors note that these results are consistent with the natural behavior of seasons in the Cordillera Blanca. This type of analysis is essential for understanding the behavior of snow cover and its response to changes in environmental conditions. Using remote sensing data and algorithms such as the SCA can provide a comprehensive view of snow dynamics, which is essential for predicting future changes and developing effective management strategies.

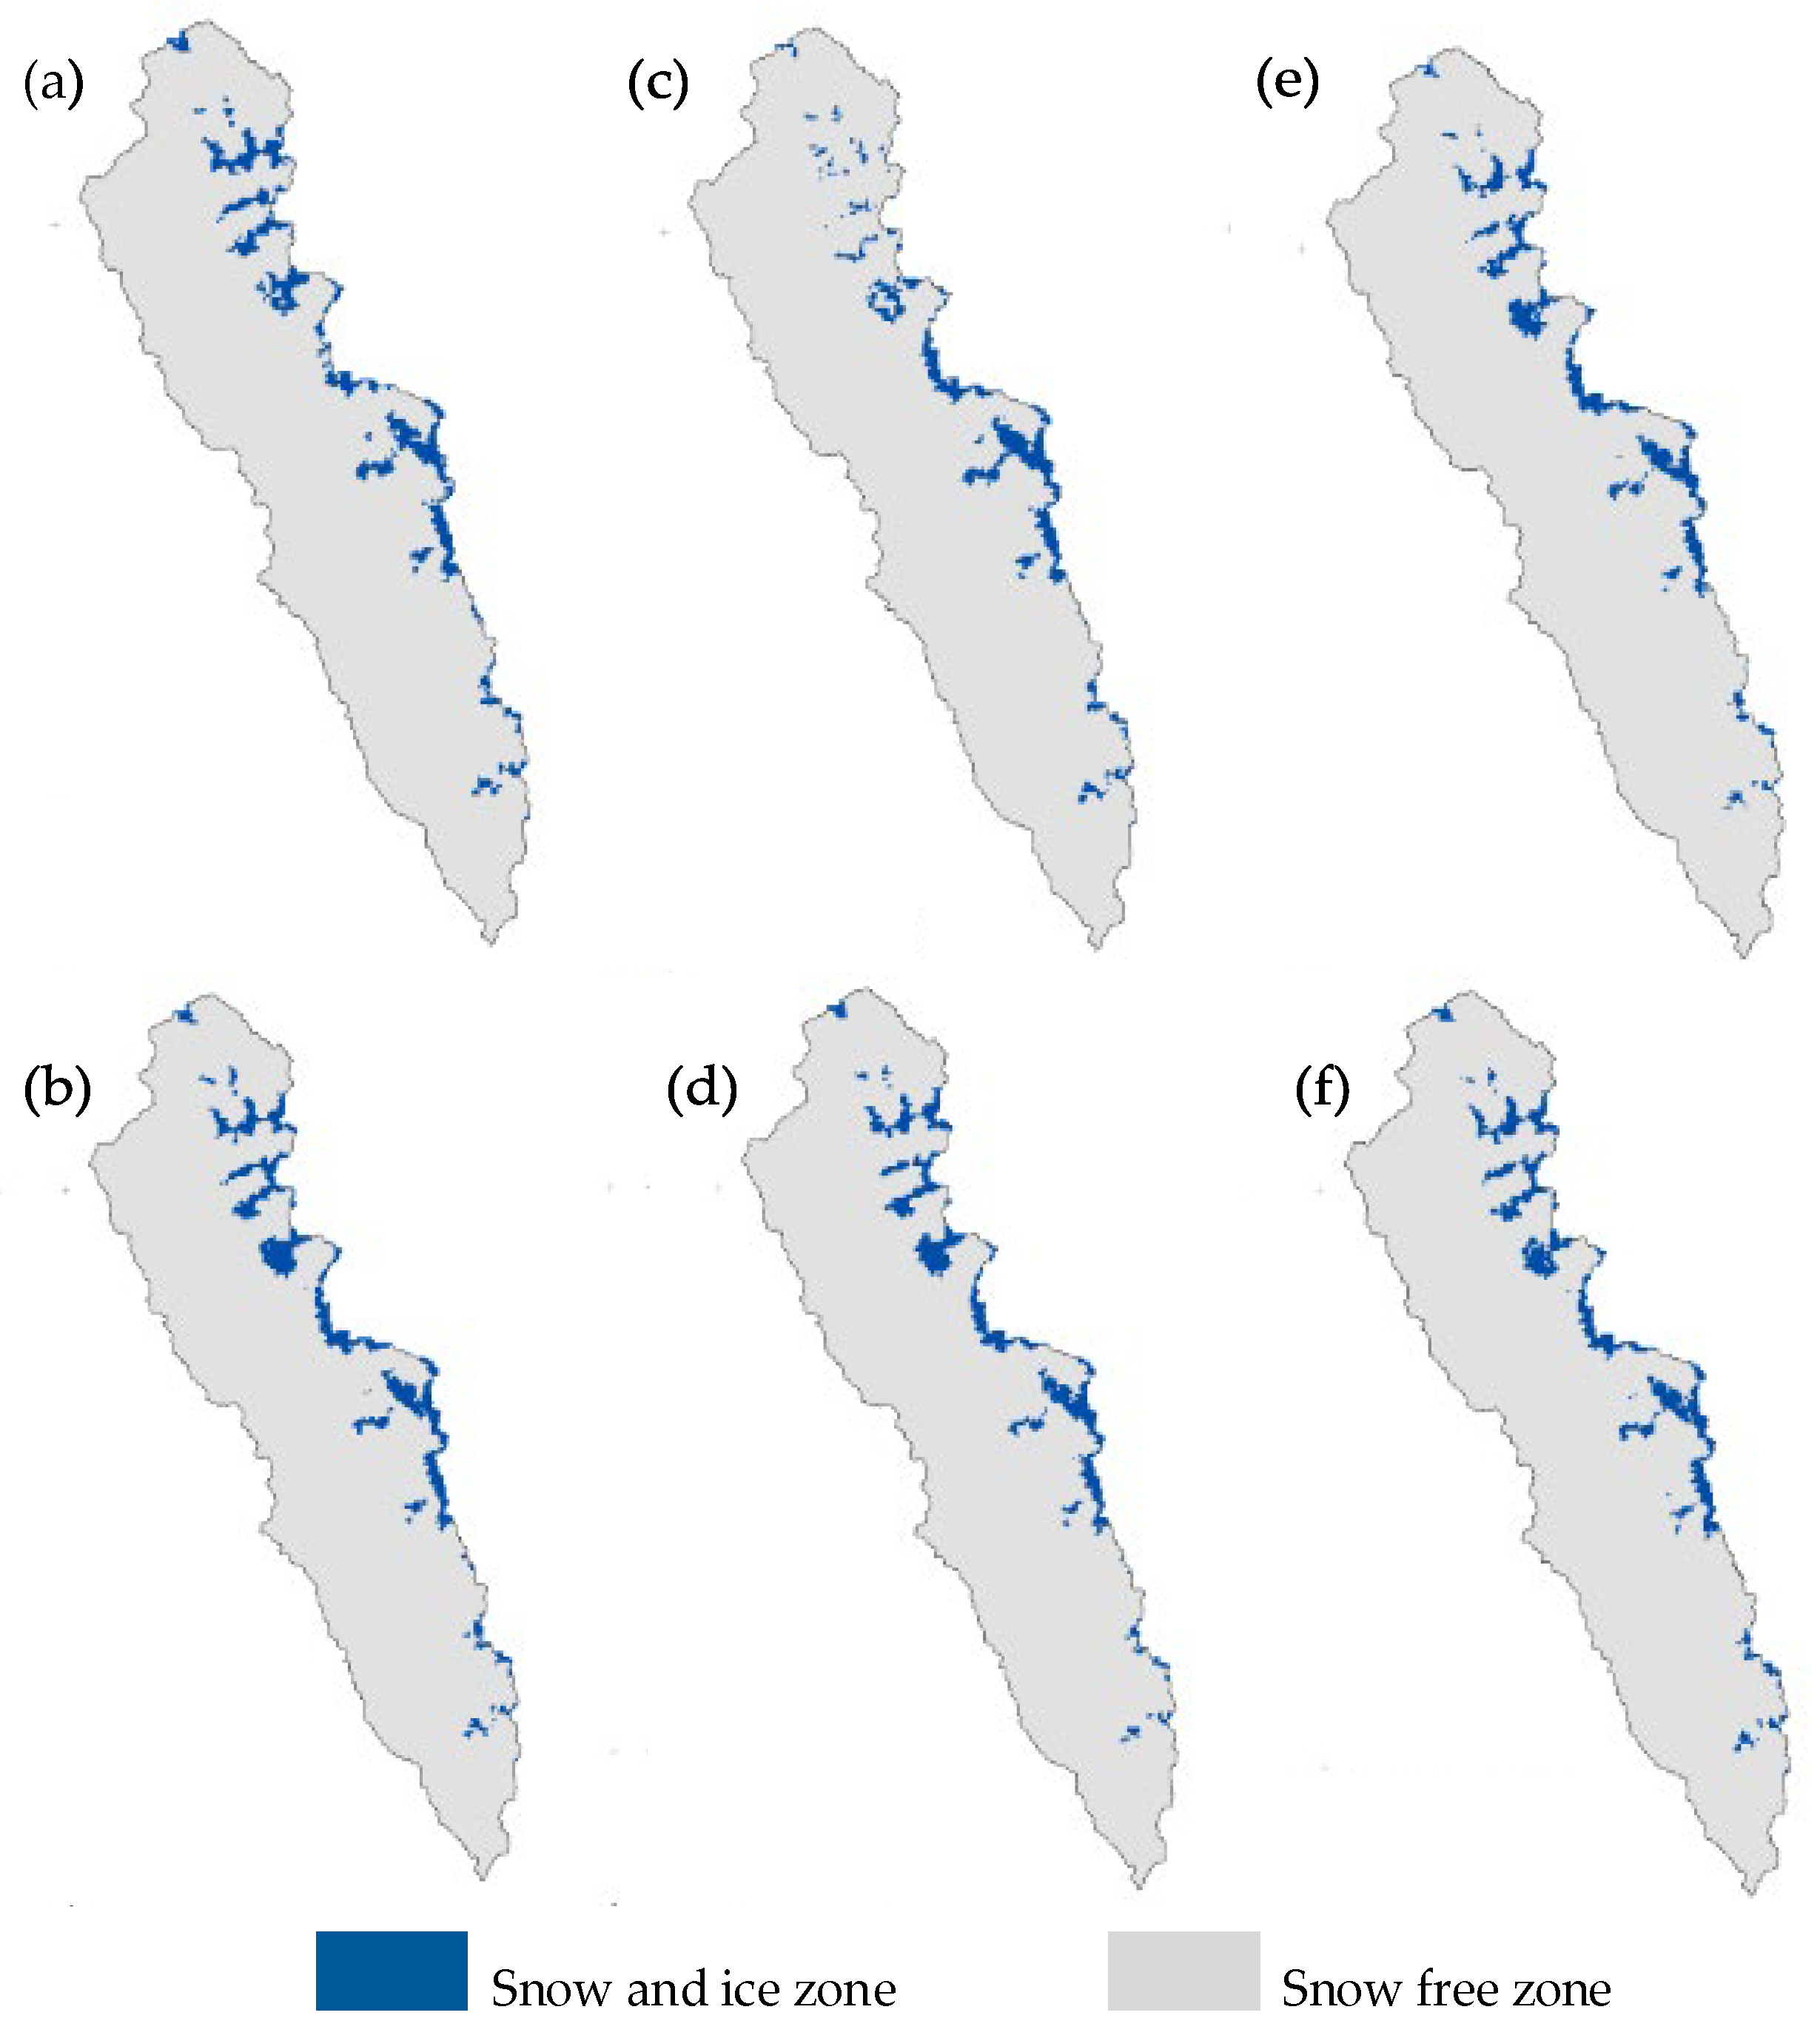
3.2. MODIS Snow Cover MOD10A1 Product and Landat Snow Cover Validation

Table 2 show the percentage of snow cover area (SCA), products, and the data obtained from MODIS and Landsat on the same coincident date and different resolutions. The highest snow cover percentage (6.9%) was reported in 2009, and the lowest was obtained in 2016 (4.6%) from MODIS data. However, for Landsat data, in 2003 and 2008, the maximum value was presented (6.5%), and the minimum was reached in 2015 (5.1%). Likewise, Figure 4 shows the results of the spatial distribution of the SCA for the years 2003, 2004, 2006, 2008, 2009, 2010, 2011, 2014, 2015, and 2016 for both products [6].

3.3. Statistical Analysis of Climatic Data

Various statistical methods have been used to analyze the consistency of the 06 stations of 39,420 data points of precipitation, maximum, and minimum daily temperature. The data were divided into groups of three or four stations according to their geographical location (Figure 1). The result (Figure 5) displays the result of the Yanamarey station’s original series with missing and completed data. This figure could show the impact of the data completion process on the Yanamarey station’s time series data, which is essential for ensuring the accuracy and reliability of the data used for analysis. It may be helpful to review the specific results and any associated studies or conclusions to better understand the significance of this station’s data completion process. Most climatological data are non-parametric because they do not have a normal distribution.

3.4. Monthly Climate Data Variation Analysis

The Cordillera Blanca, the highest mountain range in the tropics, is located on the eastern flank of the Santa River basin and is dominated by the perpetual snow climate of taller mountains, from 4800 m above sea level. The Cordillera Blanca to the east and the Cordillera Negra to the west encase an Interandean Valley, also known as Callejón de Huaylas or the Santa River valley, and the climate is predominantly dry in the fall, winter, and spring, and temperate and humid in the summer. In the Yungay Valley area at 2496 masl, maximum temperatures are higher than 24 °C, the same as in the lower parts of the basin. Meanwhile, the Huaraz and Recuay are located in the south of the sub-basin; the maximum temperature averages from 9 °C to 16 °C and from 4000 m above sea level. The average temperature ranges from 0.52 °C to 6 °C.
In comparison, the multiannual average minimum temperature varies between 14–16 °C in the lower part of the basin, adjacent to the sea. Based on the results, we can make the following observations about the climatological variables in the study area: the minimum temperature in the valley ranges between 4–14 °C. At the same time, in the headwaters of the Santa River and the glacial regions, it is less than 4 °C. This suggests that the temperature decreases as the elevation increases. This is a common phenomenon known as the altitude effect. The precipitation increases from west to east, with places above 2500 masl, such as Yungay, Recuay, and Huaraz, receiving more than 500 mm of rainfall annually. This could be due to the orographic effect, where moist air is forced to rise as it encounters mountain ranges, resulting in increased precipitation on the windward side of the mountains.
The most intense precipitation occurs in the northern border zone and above 3500 masl. Rainfall accumulates less than 400 mm per year to the southwest of the basin, while to the east of the exact location of Milpo, accumulated rainfall is between 1000 and 1200 mm per year. (Figure 6 and Figure 7).

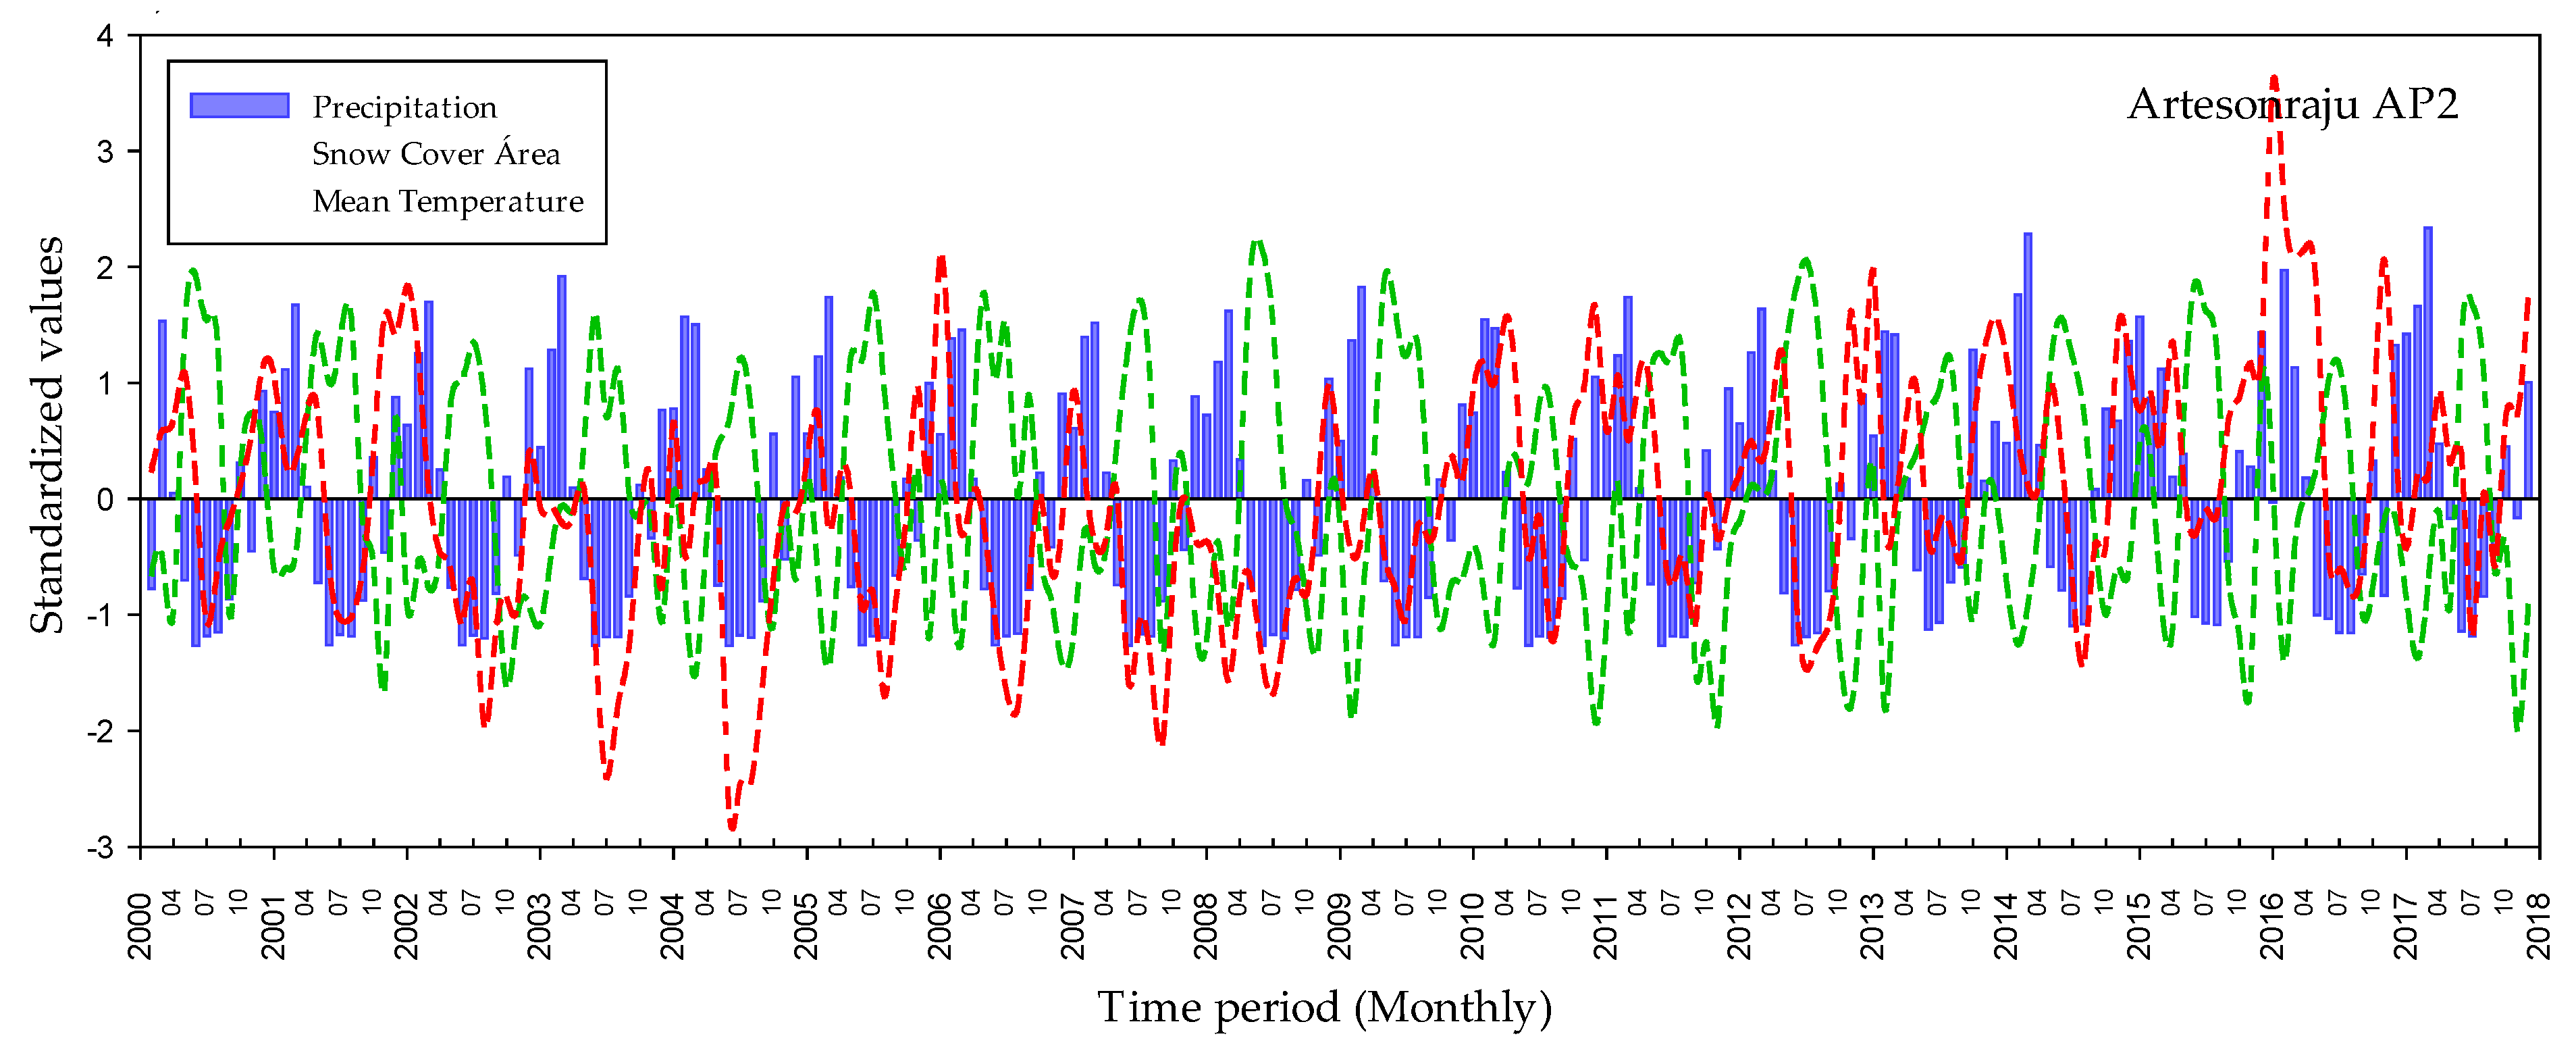
3.5. Standardized Correlation Analysis between Precipitation, Temperature, and SCA

In such systems, the interactions between different components can be highly nonlinear and complex, and it can be difficult to distinguish cause-and-effect relationships from other types of correlations or associations such as the Earth system [27].
Table 3 summarizes the results of a standardized correlation analysis between precipitation, temperature, and snow cover area using three methods: detrended cross-correlation analysis (DCCA) [28] and Kendall and Spearman [29]. The investigation used 18 years of data and involved six other weather stations inside and outside the study area. DCCA method provided the research question’s most meaningful and valuable correlations. In the correlation analysis, the Artesonraju AP2 stations with −84 R2 and −72 R2, and Yanamarey with −62 R2 and 64 R2 for both variables. These two stations were used because they are above 4500 m.a.s.l. In contrast, the results in the other stations are unreliable and have a low correlation. The DCCA methodology applies the method of cross-correlation between non-stationary time series [28]. Precipitation and temperature were analyzed as the main climatic forcing factors of SCA loss.
Figure 8 presents the time series of the snow cover area and the climatic variables precipitation and temperature registered at the Artesonraju AP2 station. The existence of a significant inverse relationship between the SCA and precipitation is observed, a smaller SCA is observed in the rainy season and vice versa in the dry season. Similarly, a strong inverse relationship between the average temperature and the SCA is observed, since in the winter (June–September) when temperatures reach negative values, the highest values of SCA are evident. This behavior is repetitive for the period between 2000 and 2017. Figure 9 shows the time series of the SCA, precipitation, and temperature, the latter two corresponding to the Yanamarey station, the existence of an important inverse relationship between the SCA and precipitation is observed, registering the lowest SCA values in the rainy season and the highest SCA values in the dry season. Likewise, the existence of a median direct relationship between the SCA and the average temperature is observed, a behavior that is repeated for the entire period of analysis. These results suggest that precipitation is the main force for SCA changes, while temperature is a modulator of SCA changes.

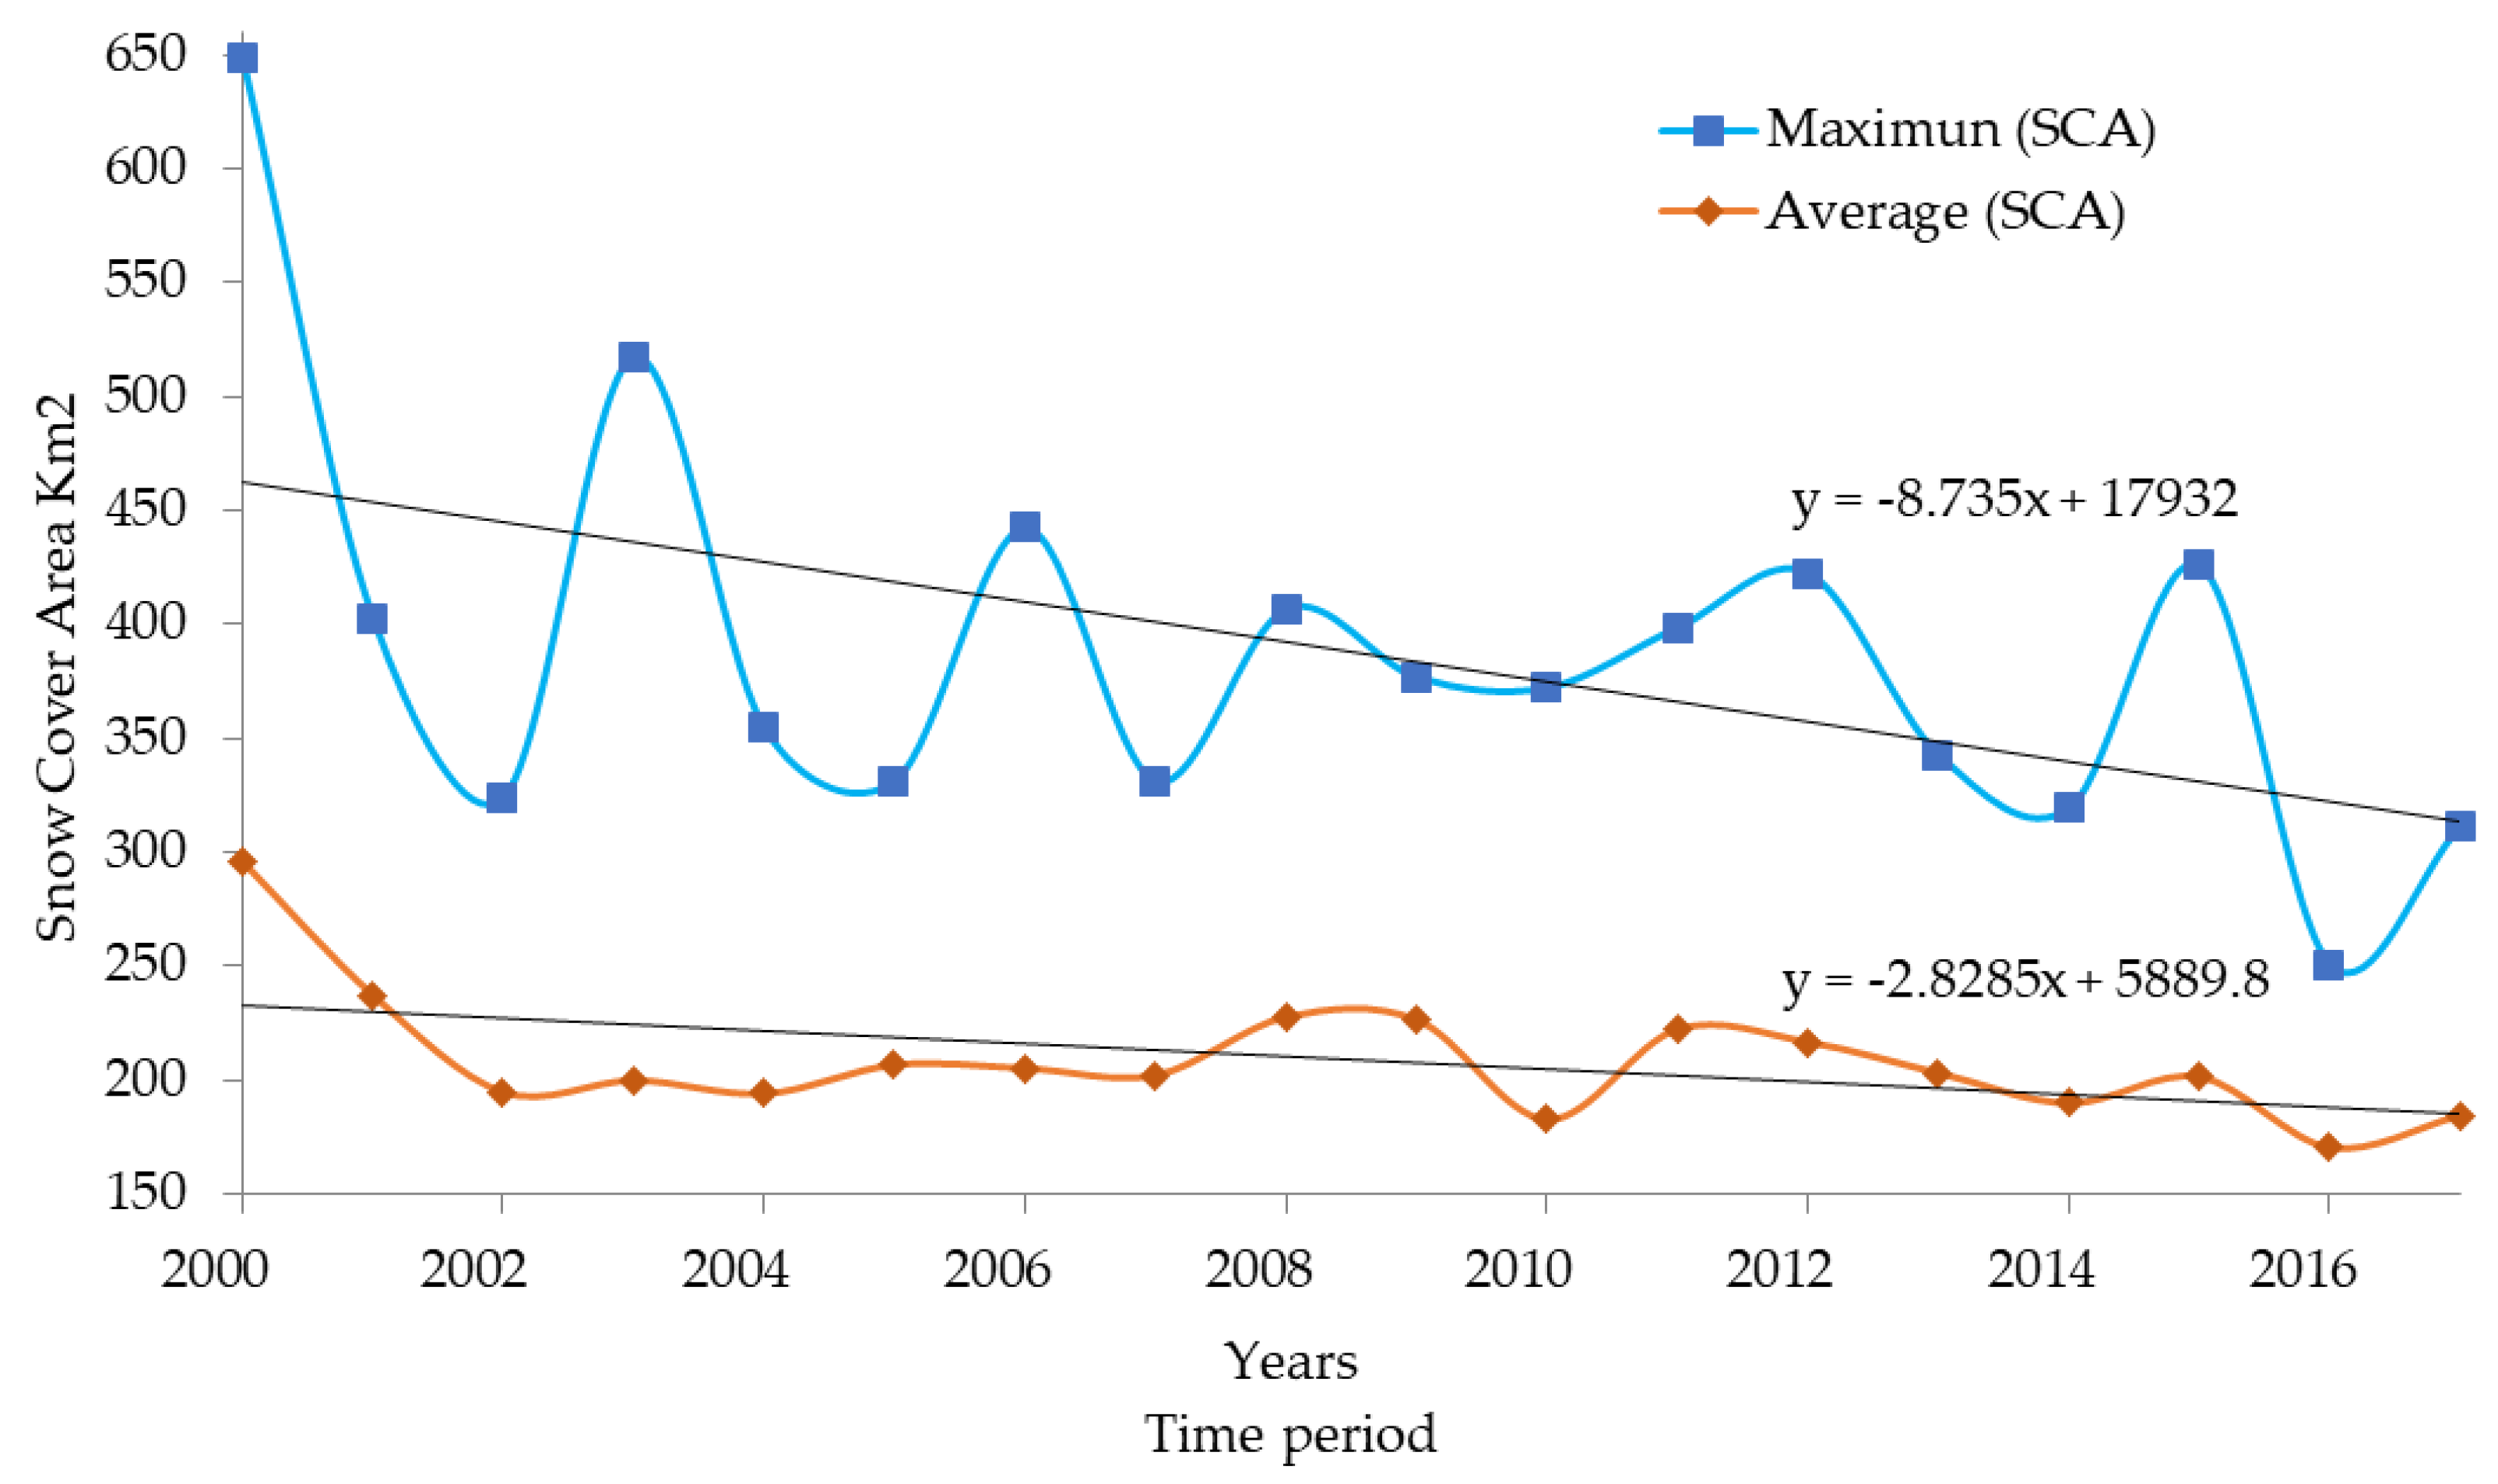
3.6. Trend Analysis of the Snow Cover Variation

The moderate resolution imaging spectroradiometer (MODIS) snow cover MOD10A1 product and the extent of snow cover is an essential component of the cryosphere and plays a critical role in the climatology of the planet. It is necessary to determine the trend of glacier retreat or increase, as changes in snow cover can significantly impact regional and global climate patterns, hydrology, and ecosystems. Therefore, developing accurate and reliable snow cover maps is crucial for understanding the changes in the cryosphere and their implications for the ’Earth’s climate [30]. According to the results obtained at the beginning of the year 2000, in the months of accumulation of snow cover area reached a maximum of 649 km2 and in 2001, has decreased to 403 km2; in only one year, there has been a reduction of 37% of the glacier cover area. In the following years, the behavior of the time series was of decrease and increases in snow cover area, but the trend of the 18 years of record is negative, decreasing in 2018 to 311 km2 at most. These temporal variations of snow cover in km2 are classic behavioral or climatological variables. Regarding the average results of the snow cover area in the year 2000, there was an annual average of about 298 km2 of snow cover, and in the other following months, this decreased due to different climate change factors, such as temperature and precipitation; in 2009, it dropped to a 226 km2 average in the area, and for the year 2017, it had a 184 km2 average glacier area. With these results and temporal analysis, we can conclude that the snow cover area continues to decrease in these last years. Figure 9 shows the trend of glacial retreat from 2000 to 2017 is an essential piece of information for understanding the impact of climate change on the cryosphere. Over time, the decreasing trend of snow cover area is an alarming signal that the temperature is increasing at both national and global levels, leading to glacial retreat. The reduction in snow cover area due to the increase in temperature can have significant consequences on the water cycle, including changes in streamflow, water availability, and water quality.
The latest reports of the Intergovernmental Panel on Climate Change (IPCC) indicate that glacial retreat has been a widespread phenomenon worldwide, with a loss between 2000 and 2017 of 41%. This loss is higher in small glacier areas than in larger ones, which is consistent with the understanding that smaller glaciers are more sensitive to climate change. The dynamics of glacial retreat are a critical indicator of climate change and serve as a measure of the global temperature increase. Therefore, monitoring the changes in the cryosphere, including snow cover and glacier extent, is essential to understanding the impacts of climate change on the natural environment and human societies. Furthermore, with these results, the retreat of the snow cover area in the Santa sub-basin would be confirmed.

4. Discussion

4.1. Snow Cover Dynamics in the Alto Santa River Sub-Basin

Glaciers in the Cordillera Blanca of the tropical Andes in Peru are experiencing an accelerated retreat, generating significant impacts on the hydrology of the Santa River basin [31]. MODIS products are used to determine and analyze the snow-cover area by detecting changes in the spectral properties of the land surface between snow-covered and snow-free conditions. The MODIS snow cover products are widely used in climate and hydrological studies, as well as in snowmelt runoff forecasting, water resource management, and other applications [32,33,34]. Generally, MODIS products cannot distinguish directly between ice and snow, so it is essential to continue monitoring snow and glacier dynamics because they may increase the amount of snow by contributing meltwater to rivers. However, they may also reduce it by retreating and decreasing in size due to climatic changes [35]. Snow accumulates in the mountains during winter and gradually melts during spring and summer, sustaining rivers and aquifers that are the water source for many regions and local communities [36]. This happened the same way in the Santa sub-basin snow cover. Multitemporal imagery is a helpful tool to visualize how climate and environmental change affect land cover changes [37]. Moreover, the normalized difference snow index (NDSI) threshold is an effective technique for extracting ice and snow cover information on the land surface [38]. By evaluating glacier trends concerning snow cover areas in different subregions, a complete understanding of how glacier changes affect and impact freshwater availability, especially in the tropical glaciers of the Peruvian Andes, can be obtained.
Glacier melting is a global phenomenon that significantly impacts many regions, including the Cordillera Blanca. The reduction of the snow cap and the disappearance of glaciers in the future could have severe consequences for the water cycle and availability. It can endanger and cause landslides, specifically in the cities located along the upper Santa sub-basin. The MODIS MOD10A1 remote sensing cryosphere product is indeed a valuable tool for monitoring changes in the cryosphere (snow and ice) over time, which are important variables for hydrological and climate modeling. Moreover, the fact that it is freely available makes it accessible to a wide range of users, including researchers, policymakers, and the general public in the Alto Santa sub-basin and other remote sub-catchments.
By analyzing the MODIS MOD10A1 product over a long time period, it is possible to track changes in the cryosphere, such as changes in snow cover extent and duration, which can have important implications for the dynamic of SCA. Therefore, using MODIS MOD10A1 product can help improve climate modeling predictions in remote areas and inform decision-making for sustainable resource management, especially in the Alto Santa sub-basin.
The change in the geometry of a glacier can be an important indicator of changes in its dynamics over the last 50 years and can be a sign of an increase in air temperature [39]. Snow melts on glaciers directly respond to air temperature, and the decrease in extent and mass may reflect the general trend of increasing global temperature. What we describe appears in previous studies that aimed to validate daily MODIS products of cloud-free snow cover. These studies used snow cover area data at the exact location to evaluate the accuracy of the MODIS products [40], i.e., the validation results were a combination of clear sky and cloudy conditions, and the evaluation accuracy of these products varied remarkably from different studies.
Figure 10 shows the trends of glacial retreat from 2000 to 2017 in the study area. The analysis results indicate a negative trend as the snow area decreases over time. Understanding the drivers of glacial retreat and snow cover changes is essential to developing effective strategies for mitigating the impacts of climate change. Remote sensing tools, such as the MODIS products mentioned earlier, provide valuable data to monitor changes in snow cover area and other cryospheric variables over time. In addition, the global temperature increase was 1.5 C in 2018, according to the Technical Summary of the Intergovernmental Panel on Climate Change (IPCC) [41]. The snow cover area (SCA) loss result from 2000 to 2017 was 41%, with a higher reduction in small glacier areas. In a study conducted on the dynamics of tropical glaciers in the Andes from 1990 to 2022 using Google Earth Engine (GEE), 42% of the glacier area was lost [5]. Sixty-five percent of the glaciers show a moderate to critical recession index, with glaciers larger than 1 km2 being the least recessed [19]; these studies confirm the retreat of the snow cover area (SCA) in the Alto Santa River sub-basin. For these and other reasons, monitoring the dynamics of the snow cover area (SCA), in the long term, provides and predicts the evolution of glaciers in a climate that is constantly changing in the high mountains [42]. Performing trend analysis of climatological data, such as temperature, is critical [43] because it shows us the behavior of the increase affecting the melting of snow cover area, which is related to global warming and climate change. Continuous and accurate monitoring of glaciers is essential for several reasons [44,45].
In the Cordillera Blanca tourism can impact the retreat behavior of the snow cover area, as in the case of the Pastoruri glacier in the Cordillera Blanca, but the extent of this impact depends on various factors. One of the ways tourism can affect snow cover that could affect tourism would be when the water level in some lagoons like Llanganuco, and Paron will increase and this could generate landslides and floods, restricting tourist access and places in the Cordillera Blanca. However, this effect is typically limited to small areas and does not have a significant impact on the overall retreat behavior of snow cover.

4.2. Impact of Climate Data on Snow Cover Dynamics

Temperature and precipitation are crucial and vital factors affecting biodiversity and the cryosphere because climate change influences the temperature and precipitation patterns in many parts of the world, which may harm the retreat of the snow cover area [46,47]. Therefore, the reduction in precipitation influences the accumulation rate of snow cover and also affects the availability of ablation energy, so the acceleration of the melting of tropical glaciers is expected. For this reason, water availability is very unsustainable, and there may be shortages in the future for any consumptive and non-consumptive use [48]. This is consistent with the results obtained in the climate data; those changes in air temperature can affect tropical glaciers because of the increase in ablation rates and the jump in the location of the 0 °C isotherm, which determines the form of precipitation (rain or snow), which conditions the accumulation and ablation processes. Therefore, it refers that the main factors that control changes in the mass balance in tropical glaciers are temperature and precipitation. Similarly, the loss of glacier cover is conditioned by precipitation and temperature acts as a modulator of glacier loss rates. In this investigation, both climatic variables were considered as the main climatic forcing factors of the snow cover dynamics.
In a 2015 study, they revealed that future rainfall in the central Andes or Cordillera Blanca could decrease and reach minimal amounts because they related wind conditions with precipitation in the wet months. These could be reduced between 19% and 33% by the end of the 21st century [49].
The standardized correlation is a widely applied statistical method to analyze climatological variables with different units; according to the results, there is a high correlation between precipitation and mean temperature with snow cover. In the results obtained, the correlations in Yanamarey stations were R2—0.62 and Artesonraju AP2 with R2—0.84. A study of annual and seasonal snow cover suggests that snow cover change has a highly inverse correlation with mean summer temperatures in the basin, resulting in a large amount of surface flow [50]. Precipitation is a complex variable to simulate, and its assimilation into hydrological models can be complicated [51]. However, other observable data, such as temperature and humidity, can help improve the accuracy of simulating climatological data. It is essential to remember that forecast models are not perfect, and there will always be uncertainty in the predictions. However, following a careful approach and using advanced analysis and 17 modelling techniques can improve precipitation predictions and reduce tension.
In a moist area, decreased air humidity can lead to a loss of glacier mass. Additionally, when precipitation decreases, the amount of snow and ice accumulating on the glacier decreases, reducing the glacier’s total mass and increasing the melting rate [52].
Increasing temperature, precipitation, and humidity are important factors contributing to the glacier recession. In addition, other factors have contributed to an accelerated glacier recession since the 1980s [4,52]. Moreover, one of them is climate change, which is due to the emission of greenhouse gases into the atmosphere. For these reasons, the temperature increase negatively affects tropical glaciers, causing a decrease in snow cover. It should be noted that glacial lakes are accumulations of water that form on the surface or inside glaciers; however, glacial lakes are also susceptible to climate change [53].
A consequence of glacier melting In the upper Santa sub-basin is causing the increase of glacial lakes, increasing considerably in the last 60 years, from 223 in 1953 to more than 800 at present, approximately in the Cordillera Blanca [54]. The sea surface temperature anomaly (SSTA) is often related to the El Niño Southern Oscillation (ENSO). ENSO is a natural climate pattern that involves changes in ocean temperatures and circulation in the tropical Pacific region [55]. The sea surface temperature anomalies in the tropical Pacific region may be significantly higher than usual. Similarly, the result and temperature analysis presented the same abnormalities in some years. Global warming significantly impacts the cryosphere, including snow, glaciers, ice caps, and permafrost. As the Earth’s temperature rises, the cryosphere is melting at an accelerating pace, leading to significant changes in the global hydrological cycle [56]
In the study area, the high elevation and proximity to the equator mean that the region receives a high amount of solar radiation, this can lead to higher surface temperatures and increased energy available for surface processes to increase the melting of snow and ice and vapor pressure deficit (VPD) is often high due to the region’s dry climate. This can lead to higher rates of evapotranspiration and lower surface temperatures due to the cooling effect of evaporation, the interplay between solar radiation, VPD, and other factors, such as temperature and precipitation, can have complex effects on the snow cover area in the tropical glaciers of the Cordillera Blanca. As temperatures continue to rise due to climate change, these processes are likely to become even more important in shaping the future of this region.

5. Conclusions

Using MODIS Snow Cover MOD10A1 product images and remote sensing technologies, along with applying algorithms like the normalized difference snow index (NDSI), can provide important insights into the impacts of climate change on glaciers and snow cover. The results described, which indicate a 41% retreat of glaciers between 2000 and 2017 and a reduction in maximum snow cover areas by 311.6 km2, are significant and suggest ongoing trends that are cause for concern. It’s worth noting that higher spatial resolution sensors, such as the Landsat TM 5, can help validate and refine the results obtained through the MODIS sensor and other lower-resolution sensors. However, it’s essential to acknowledge that satellite-based remote sensing has limitations and may not capture all aspects of glacier retreat and snow cover reduction, such as changes in glacier thickness or the extent of ice loss beneath the surface.
In the same way, the trend of the average snow cover area over 18 years is negative, and there is a decrease in snow cover area from 300 km2 to 184 km2 between 2000 and 2017. This could indicate a significant reduction in the amount of snow cover in the region over time. This trend could have important implications for local hydrology and ecosystems, including changes in the timing and amount of water in the Alto Santa sub-basin, we could say it is important to note that trends in snow cover area can be influenced by a variety of factors, including changes in temperature and precipitation patterns. Moreover, it is important to keep monitoring the dynamics in the snow cover area over a longer time period to determine if the observed trend is part of a longer-term pattern or if it is a short-term fluctuation. Long-term monitoring can help to better understand the underlying drivers of changes in the snow cover area and can inform decision-making for sustainable resource management in the Alto Santa sub-basin.
The detrended cross-correlation analysis method (DCCA) helps analyze the correlation between non-stationary time series, such as precipitation, temperature, and snow cover area. DCCA works by first removing the trend from the time series, which makes it possible to compare the fluctuations in the time series over time.
We can admit that glacier melt is a fundamental problem that can have severe consequences for the safety of human communities near or downstream of the glaciers. Sudden glacial lake outbursts can cause floods and natural disasters that endanger life and property. Urban relocation can be a solution to protect human communities. However, it is a politically complicated process that requires the cooperation and support of various stakeholders, including affected communities, local authorities, and interest groups. One of the most important mitigation measures is constantly monitoring the glacial system. This involves regular measurements of glacier thickness, mass ice balance, and the rate of ice melt, as well as monitoring downstream hydrological changes, such as water flow and quality. Such monitoring helps to identify potential hazards, such as glacial lake outbursts or flooding, and allows for the timely implementation of emergency response plans. Finally, ensuring the security of water resources in areas vulnerable to melting glaciers is crucial. The development of water management strategies that consider the potential impacts of glacier melt and identify alternative water sources to reduce reliance on glacial meltwater. It is vital to focus on this in areas that rely on melting snow cover and tropical glaciers, such as the upper Santa sub-basin. It is important to consider other factors that may be influencing the snow cover area, these could include solar radiation, VPD, wind, and other climatological variables but we have some limitations for example data collection in remote areas such as the Cordillera Blanca can be challenging, and there may be limitations in the amount and quality of data available in the study area.
In addition, monitoring the dynamics of the snow cover area (SCA) also helps to identify the risks associated with ice slides and landslides in the areas surrounding the glaciers, which allows local communities to take preventive measures. In summary, glacier monitoring is a crucial tool for understanding and preparing for the effects of climate change and best using MODIS sensor imagery and Google Earth Engine (GEE) spatial analysis tools.

Author Contributions

Conceptualization, E.C., W.L. and F.C.; Investigation, E.C., W.L., W.H. and O.C.; Methodology, E.C., W.L., S.S. and J.C.; Formal analysis, E.C., W.H. and W.L.; Data curation, E.C., W.L., S.S., F.C. and J.C.; Validation, E.C., S.S., J.C. and O.C.; Project administration, E.C., W.L., C.M. and O.C.; Visualization, E.C., W.L., F.C., C.M., W.H. and O.C.; Resources, E.C., S.S., F.C., C.M. and J.C.; Software, E.C., W.L. and J.C.; Supervision, E.C., W.L., S.S. and F.C.; Funding acquisition, E.C., W.L., S.S., F.C., O.C., C.M., J.C. and W.H.; Writing—original draft, E.C., W.L., W.H. and S.S.; Writing—review and editing, E.C., W.L., S.S., F.C., O.C., C.M., J.C., W.H. and W.H. All authors have read and agreed to the published version of the manuscript.

Funding

This investigation was funded by Universidad Nacional del Altiplano–Puno (UNA-PUNO) and Universidad Nacional Agraria La Molina (UNALM–LIMA).

Institutional Review Board Statement

Not applicable.

Informed Consent Statement

Not applicable.

Data Availability Statement

Not applicable.

Acknowledgments

The authors would like to thank Servicio Nacional de Meteorología e Hidrología–Perú (SENAMHI), Autoridad Nacional del Agua–Peru (ANA), the National Snow and Ice Data Center (NSIDC), and the Google Earth Engine (GEE) platform. Additionally, it is always important to acknowledge the contributions and support of individuals and organizations who have helped to complete a research project or manuscript. The authors have appreciated the Universidad Nacional del Altiplano–Puno (UNA-PUNO) and the Universidad Nacional Agraria La Molina (UNALM–LIMA) for their support. Finally, the authors have expressed their gratitude to the main author’s father, Benigno Gregorio Calizaya Ticona, who passed away on 26 January 2020.

Conflicts of Interest

The authors declare no conflict of interest.

References

  1. Qin, D.; Ding, Y. Cryospheric Changes and Their Impacts: Present, Trends and Key Issues. Available online: https://d.wanfangdata.com.cn/periodical/ChlQZXJpb2RpY2FsQ0hJTmV3UzIwMjMwMTEyEhFxaGJoeWpqejIwMDkwNDAwMRoIYzk4cmRxN2Y%253D (accessed on 5 February 2023).
  2. Tang, Z.; Wang, X.; Deng, G.; Wang, X.; Jiang, Z.; Sang, G. Spatiotemporal Variation of Snowline Altitude at the End of Melting Season across High Mountain Asia, Using MODIS Snow Cover Product. Adv. Space Res. 2020, 66, 2629–2645. [Google Scholar] [CrossRef]
  3. Qin, D.; Yao, T.; Ding, Y.; Ren, J. Establishment and Significance of the Scientific System of Cryospheric Science. Available online: https://kns.cnki.net/kcms/detail/detail.aspx?doi=10.16418/j.issn.1000-3045.20200331001 (accessed on 5 February 2023).
  4. Kaser, G.; Osmaston, H. Tropical Glaciers; Cambridge University Press: New York, NY, USA, 2002. [Google Scholar]
  5. Cayo, E.Y.T.; Borja, M.O.; Espinoza-Villar, R.; Moreno, N.; Camargo, R.; Almeida, C.; Hopfgartner, K.; Yarleque, C.; Souza, C.M. Mapping Three Decades of Changes in the Tropical Andean Glaciers Using Landsat Data Processed in the Earth Engine. Remote Sens. 2022, 14, 1974. [Google Scholar] [CrossRef]
  6. Calizaya, E.; Mejía, A.; Barboza, E.; Calizaya, F.; Corroto, F.; Salas, R.; Vásquez, H.; Turpo, E. Modelling Snowmelt Runoff from Tropical Andean Glaciers under Climate Change Scenarios in the Santa River Sub-Basin (Peru). Water 2021, 13, 3535. [Google Scholar] [CrossRef]
  7. Veettil, B.K.; Kamp, U. Global Disappearance of Tropical Mountain Glaciers: Observations, Causes, and Challenges. Geosciences 2019, 9, 196. [Google Scholar] [CrossRef]
  8. Zemp, M.; Huss, M.; Thibert, E.; Eckert, N.; McNabb, R.; Huber, J.; Barandun, M.; Machguth, H.; Nussbaumer, S.U.; Gärtner-Roer, I.; et al. Global Glacier Mass Changes and Their Contributions to Sea-Level Rise from 1961 to 2016. Nature 2019, 568, 382–386. [Google Scholar] [CrossRef]
  9. Emmer, A.; Allen, S.K.; Carey, M.; Frey, H.; Huggel, C.; Korup, O.; Mergili, M.; Sattar, A.; Veh, G.; Chen, T.Y.; et al. Progress and Challenges in Glacial Lake Outburst Flood Research (2017–2021): A Research Community Perspective. Nat. Hazards Earth Syst. Sci. 2022, 22, 3041–3061. [Google Scholar] [CrossRef]
  10. Escanilla-Minchel, R.; Alcayaga, H.; Soto-Alvarez, M.; Kinnard, C.; Urrutia, R. Evaluation of the Impact of Climate Change on Runoff Generation in an Andean Glacier Watershed. Water 2020, 12, 3547. [Google Scholar] [CrossRef]
  11. Bradley, R.S.; Vuille, M.; Diaz, H.F.; Vergara, W. Threats to Water Supplies in the Tropical Andes. Science 2006, 312, 1755–1756. [Google Scholar] [CrossRef]
  12. Veettil, B.K.; Wang, S.; Florêncio de Souza, S.; Bremer, U.F.; Simões, J.C. Glacier Monitoring and Glacier-Climate Interactions in the Tropical Andes: A Review. J. S. Am. Earth Sci. 2017, 77, 218–246. [Google Scholar] [CrossRef]
  13. Chen, Y.; Zhou, C.; Ai, S.; Liang, Q.; Zheng, L.; Liu, R.; Lei, H. Dynamics of Dalk Glacier in East Antarctica Derived from Multisource Satellite Observations since 2000. Remote Sens. 2020, 12, 1809. [Google Scholar] [CrossRef]
  14. Hall, D.K.; Riggs, G.A.; Salomonson, V.V.; Digirolamo, N.E.; Bayr, K.J. MODIS Snow-Cover Products. Remote Sens. Environment. 2002, 83, 181–194. [Google Scholar] [CrossRef]
  15. Tahir, A.A.; Chevallier, P.; Arnaud, Y.; Ahmad, B. Snow Cover Dynamics and Hydrological Regime of the Hunza River Basin, Karakoram Range, Northern Pakistan. Hydrol. Earth Syst. Sci. 2011, 15, 2275–2290. [Google Scholar] [CrossRef]
  16. di Marco, N.; Avesani, D.; Righetti, M.; Zaramella, M.; Majone, B.; Borga, M. Reducing Hydrological Modelling Uncertainty by Using MODIS Snow Cover Data and a Topography-Based Distribution Function Snowmelt Model. J. Hydrol. 2021, 599, 126020. [Google Scholar] [CrossRef]
  17. Gorelick, N.; Hancher, M.; Dixon, M.; Ilyushchenko, S.; Thau, D.; Moore, R. Google Earth Engine: Planetary-Scale Geospatial Analysis for Everyone. Remote Sens. Environ. 2017, 202, 18–27. [Google Scholar] [CrossRef]
  18. Rosales, A.G.; Junquas, C.; da Rocha, R.P.; Condom, T.; Espinoza, J.C. Valley–Mountain Circulation Associated with the Diurnal Cycle of Precipitation in the Tropical Andes (Santa River Basin, Peru). Atmosphere 2022, 13, 344. [Google Scholar] [CrossRef]
  19. Zapata, M.; Arnaud, Y.; Gallaire, R. Inventario de Glaciares de La Cordillera Blanca. In Proceedings of the 13th IWRA World Water Congress, Montpellier, France, 1–4 September 2008. [Google Scholar]
  20. Chevallier, P.; Pouyaud, B.; Suarez, W.; Condom, T. Climate Change Threats to Environment in the Tropical Andes: Glaciers and Water Resources. Reg. Environ. Change 2011, 11, 179–187. [Google Scholar] [CrossRef]
  21. Condom, T.; Escobar, M.; Purkey, D.; Pouget, J.C.; Suarez, W.; Ramos, C.; Apaestegui, J.; Tacsi, A.; Gomez, J. Simulating the Implications of Glaciers’ Retreat for Water Management: A Case Study in the Rio Santa Basin, Peru. Water Int. 2012, 37, 442–459. [Google Scholar] [CrossRef]
  22. Lynch, B.D. Vulnerabilities, Competition and Rights in a Context of Climate Change toward Equitable Water Governance in Peru’s Rio Santa Valley. Glob. Environ. Change 2012, 22, 364–373. [Google Scholar] [CrossRef]
  23. Riggs, G.; Hall, D.; Vuyovich, C.; DiGirolamo, N. Development of Snow Cover Frequency Maps from MODIS Snow Cover Products. Remote Sens. 2022, 14, 5661. [Google Scholar] [CrossRef]
  24. Hall, D.K.; Riggs, G.A.; Salomonson, V.V. Development of Methods for Mapping Global Snow Cover Using Moderate Resolution Imaging Spectroradiometer Data. Remote Sens. Environ. 1995, 54, 127–140. [Google Scholar] [CrossRef]
  25. Llanos, H.L. RClimTool Manual de Usuario. Clima y Sector Agropecuario Colombiano. 2015. Volume 1. Available online: https://cgspace.cgiar.org/bitstream/handle/10568/63482/RClimTool_Manual_V01_FINAL.pdf?sequence=3&isAllowed=y (accessed on 4 February 2023).
  26. Cordano, E.; Eccel, E. RMAWGEN: Multi-Site Auto-Regressive Weather GENerator; Free Software Foundation: Boston, MA, USA, 2017. [Google Scholar]
  27. Runge, J.; Nowack, P.; Kretschmer, M.; Flaxman, S.; Sejdinovic, D. Detecting and Quantifying Causal Associations in Large Nonlinear Time Series Datasets. Sci. Adv. 2019, 5, eaau4996. [Google Scholar] [CrossRef] [PubMed]
  28. Zebende, G.F. DCCA Cross-Correlation Coefficient: Quantifying Level of Cross-Correlation. Phys. A Stat. Mech. Its Appl. 2011, 390, 614–618. [Google Scholar] [CrossRef]
  29. Ahmad, I.; Tang, D.; Wang, T.; Wang, M.; Wagan, B. Precipitation Trends over Time Using Mann-Kendall and Spearman’s Rho Tests in Swat River Basin, Pakistan. Adv. Meteorol. 2015, 2015, 431860. [Google Scholar] [CrossRef]
  30. Dong, C.; Menzel, L. Producing Cloud-Free MODIS Snow Cover Products with Conditional Probability Interpolation and Meteorological Data. Remote Sens. Environ. 2016, 186, 439–451. [Google Scholar] [CrossRef]
  31. Baraer, M.; Mark, B.G.; Mckenzie, J.M.; Condom, T.; Bury, J.; Huh, K.I.; Portocarrero, C.; Gómez, J.; Rathay, S. Glacier Recession and Water Resources in Peru’s Cordillera Blanca. J. Glaciol. 2012, 58, 134–150. [Google Scholar] [CrossRef]
  32. Huang, Y.; Liu, H.; Yu, B.; Wu, J.; Kang, E.L.; Xu, M.; Wang, S.; Klein, A.; Chen, Y. Improving MODIS Snow Products with a HMRF-Based Spatio-Temporal Modeling Technique in the Upper Rio Grande Basin. Remote Sens. Environ. 2018, 204, 568–582. [Google Scholar] [CrossRef]
  33. Tahir, A.A.; Chevallier, P.; Arnaud, Y.; Neppel, L.; Ahmad, B. Modeling Snowmelt-Runoff under Climate Scenarios in the Hunza River Basin, Karakoram Range, Northern Pakistan. J. Hydrol. 2011, 409, 104–117. [Google Scholar] [CrossRef]
  34. Tekeli, A.E.; Akyürek, Z.; Şorman, A.A.; Şensoy, A.; Şorman, A.Ü. Using MODIS Snow Cover Maps in Modeling Snowmelt Runoff Process in the Eastern Part of Turkey. Remote Sens. Environ. 2005, 97, 216–230. [Google Scholar] [CrossRef]
  35. Fugazza, D.; Manara, V.; Senese, A.; Diolaiuti, G.; Maugeri, M. Snow Cover Variability in the Greater Alpine Region in the Modis Era (2000–2019). Remote Sens. 2021, 13, 2945. [Google Scholar] [CrossRef]
  36. Marchane, A.; Jarlan, L.; Hanich, L.; Boudhar, A.; Gascoin, S.; Tavernier, A.; Filali, N.; le Page, M.; Hagolle, O.; Berjamy, B. Assessment of Daily MODIS Snow Cover Products to Monitor Snow Cover Dynamics over the Moroccan Atlas Mountain Range. Remote Sens. Environ. 2015, 160, 72–86. [Google Scholar] [CrossRef]
  37. Ernesto, M.; Huayaney, A.; Felipe Meléndez De La Cruz, J. Aplicación de La Teledetección Para El Análisis Multitemporal de La Regresión Glaciar En La Cordillera Blanca Application of Teledetection to the Multitemporary Analysis of the Glacier Regression in La Cordillera Blanca. Investig. Soc. 2009, 13, 71–83. [Google Scholar]
  38. Zhang, J.; Jia, L.; Menenti, M.; Zhou, J.; Ren, S. Glacier Area and Snow Cover Changes in the Range System Surrounding Tarim from 2000 to 2020 Using Google Earth Engine. Remote Sens. 2021, 13, 5117. [Google Scholar] [CrossRef]
  39. Kavan, J.; Tallentire, G.D.; Demidionov, M.; Dudek, J.; Strzelecki, M.C. Fifty Years of Tidewater Glacier Surface Elevation and Retreat Dynamics along the South-East Coast of Spitsbergen (Svalbard Archipelago). Remote Sens. 2022, 14, 354. [Google Scholar] [CrossRef]
  40. Yuan, Y.; Li, B.; Gao, X.; Liu, W.; Li, Y.; Li, R. Validation of Cloud-Gap-Filled Snow Cover of MODIS Daily Cloud-Free Snow Cover Products on the Qinghai-Tibetan Plateau. Remote Sens. 2022, 14, 5642. [Google Scholar] [CrossRef]
  41. Simpson, N.P. Technical Summary: Climate Change 2022: Impacts, Adaptation, and Vulnerability. Contribution of Working Group II to the Sixth Assessment Report of the Intergovernmental Panel on Climate Change. Res. Gate 2022. [Google Scholar] [CrossRef]
  42. Wendleder, A.; Friedl, P.; Mayer, C. Impacts of Climate and Supraglacial Lakes on the Surface Velocity of Baltoro Glacier from 1992 to 2017. Remote Sens. 2018, 10, 1681. [Google Scholar] [CrossRef]
  43. Chand, M.B.; Chandra Bhattarai, B.; Pradhananga, N.S.; Baral, P. Trend Analysis of Temperature Data for the Narayani River Basin, Nepal. Sci 2021, 3, 1. [Google Scholar] [CrossRef]
  44. Sood, V.; Tiwari, R.K.; Singh, S.; Kaur, R.; Parida, B.R. Glacier Boundary Mapping Using Deep Learning Classification over Bara Shigri Glacier in Western Himalayas. Sustainability 2022, 14, 3485. [Google Scholar] [CrossRef]
  45. Sun, Z.; Zhang, R.; Zhu, T. Simulating the Impact of the Sustained Melting Arctic on the Global Container Sea–Rail Intermodal Shipping. Sustainability 2022, 14, 2214. [Google Scholar] [CrossRef]
  46. Zha, X.; Niu, B.; Li, M.; Duan, C. Increasing Impact of Precipitation on Alpine-Grassland Productivity over Last Two Decades on the Tibetan Plateau. Remote Sens. 2022, 14, 3430. [Google Scholar] [CrossRef]
  47. Chen, Y.; Sharma, S.; Zhou, X.; Yang, K.; Li, X.; Niu, X.; Hu, X.; Khadka, N. Spatial Performance of Multiple Reanalysis Precipitation Datasets on the Southern Slope of Central Himalaya. Atmos. Res. 2021, 250, 105365. [Google Scholar] [CrossRef]
  48. Kronenberg, M.; Schauwecker, S.; Huggel, C.; Salzmann, N.; Drenkhan, F.; Frey, H.; Giraáldez, C.; Gurgiser, W.; Kaser, G.; Juen, I.; et al. The Projected Precipitation Reduction over the Central Andes May Severely Affect Peruvian Glaciers and Hydropower Production. Energy Procedia 2016, 97, 270–277. [Google Scholar] [CrossRef]
  49. Neukom, R.; Rohrer, M.; Calanca, P.; Salzmann, N.; Huggel, C.; Acuña, D.; Christie, D.A.; Morales, M.S. Facing Unprecedented Drying of the Central Andes? Precipitation Variability over the Period AD 1000-2100. Environ. Res. Lett. 2015, 10, 084017. [Google Scholar] [CrossRef]
  50. Tahir, A.A.; Chevallier, P.; Arnaud, Y.; Ashraf, M.; Bhatti, M.T. Snow Cover Trend and Hydrological Characteristics of the Astore River Basin (Western Himalayas) and Its Comparison to the Hunza Basin (Karakoram Region). Sci. Total Environ. 2015, 505, 748–761. [Google Scholar] [CrossRef]
  51. Zhang, Q.; Körnich, H.; Holmgren, K. How Well Do Reanalyses Represent the Southern African Precipitation? Clim. Dyn. 2013, 40, 951–962. [Google Scholar] [CrossRef]
  52. Kaser, G. A Review of the Modern Fluctuations of Tropical Glaciers. Glob. Planet. Change 1999, 22, 93–103. [Google Scholar] [CrossRef]
  53. Bazilova, V.; Kääb, A. Mapping Area Changes of Glacial Lakes Using Stacks of Optical Satellite Images. Remote Sens. 2022, 14, 5973. [Google Scholar] [CrossRef]
  54. Ponce, V.M. Efecto Del Cambio Climático Sobre La Cordillera Blanca Del Perú. 2015. Available online: https://ponce.sdsu.edu/cordillera_blanca_peru.html (accessed on 4 February 2023).
  55. Kos, A.; Amann, F.; Strozzi, T.; Osten, J.; Wellmann, F.; Jalali, M.; Dufresne, A. The Surface Velocity Response of a Tropical Glacier to Intra and Inter Annual Forcing, Cordillera Blanca, Peru. Remote Sens. 2021, 13, 2694. [Google Scholar] [CrossRef]
  56. Meng, X.; Liu, Y.; Qin, Y.; Wang, W.; Zhang, M.; Zhang, K. Adaptability of MODIS Daily Cloud-Free Snow Cover 500 m Dataset over China in Hutubi River Basin Based on Snowmelt Runoff Model. Sustainability 2022, 14, 4067. [Google Scholar] [CrossRef]
Figure 1. Location of tropical glaciers in the Alto Santa sub-basin and climatological stations.
Sustainability 15 07610 g001
Figure 2. Workflow of methodology steps of MODIS Snow Cover MOD10A1 product and climate data processing in Google Earth Engine.
Sustainability 15 07610 g002
Figure 3. Snow cover area processing, in Google Earth Engine (GEE) from 2000–2017, was calculated by analyzing 6578 MODIS Snow Cover MOD10A1 product images in km2 in the Alto Santa sub-basin.
Sustainability 15 07610 g003
Figure 4. Percentage of snow cover area (SCA) calculated by analyzing 6578 MODIS satellite images. Of the area of 5328 km2 in the Alto Santa river sub-basin.
Sustainability 15 07610 g004
Figure 5. Snow coverage MODIS and Landsat overlapping data in the Alto Santa sub-basin: (a) MODIS (18 October 2003); (b) LandSat (18 October 2003); (c) MODIS (18 August 2010); (d) Landsat (18 August 2010); MODIS (e) MODIS (22 November 2016); (f) LandSat (22 November 2016).
Sustainability 15 07610 g005
Figure 6. Statistical analysis of climate data Yanamarey station: (a) original and quality control data; (b) missing data; (c) boxplot: (d) plots and histograms.
Sustainability 15 07610 g006
Figure 7. (a) Monthly variation of precipitation Artesonraju AP2 station; (b) Monthly variation of mean temperature Artesonraju AP2 station; (c) Monthly variation of precipitation Yanamarey station; (d) Monthly variation of mean temperature Yanamarey station.
Sustainability 15 07610 g007
Figure 8. Correlation between standardized values of precipitation, average temperature (Artesonraju AP2), and snow cover area in the Alto Santa sub-basin (2000–2017). All the correlation values are significant, with a significance level of p < 0.05.
Sustainability 15 07610 g008
Figure 9. Correlation between standardized values of precipitation, average temperature (Yanamarey), and snow cover area in the Alto Santa sub-basin (2000–2017). All the correlation values are significant, with a significance level of p < 0.05.
Sustainability 15 07610 g009
Figure 10. Trend analysis of the snow cover area (SCA) at the Alto Santa sub-basin (2000–2017).
Sustainability 15 07610 g010
Table 1. Characteristics of the climate station in the Santa River sub-basin.
Name of Station.Lat.Long.Alt. (m.a.s.l.)Time (Years)CodeDep.Prov.Dist.
Recuay9°43′45.1′′77°27′13.15′′343118109017AncashRecuayRecuay
Yungay9°8′30.79′′77°44′59.91′′246618109018AncashYungayYungay
Artesonraju AP28°58′0.86′′77°38′12.69′′482416UHGAncashHuaylasCaraz
Querococha9°43′21.32′′77°19′57.18′′401314UHGAncashRecuayCatac
Yanamarey9°39′22.3′′77°16′41.32′′460615UHGAncashRecuayCatac
Huaraspaca9°52′20.82′′77°11′1.24′′502112UHGAncashRecuayCatac
Table 2. MODIS Snow Cover MOD10A1 product and Landsat imagery to estimate the snow coverage in (%) in the Santa River sub-basin.
Date of ImagesSnow Coverage (%)
MODIS (500 m)Landsat (30 m)
18 October 20036.16.5
13 May 20046.86.2
9 June 20086.36.5
15 August 20096.96.4
18 August 20105.45.7
17 September 20155.75.1
23 January 20164.85.6
22 November 20164.65.2
Table 3. Monthly correlation coefficients between snow cover area, precipitation, and temperature (2000–2017) with a significance level of p < 0.05.
Climate StationsSnow Cover Area (SCA)
Correlation Methods
Monthly Precipitation DCCAKendallSpearman
Recuay−0.51−0.28−0.38
Yungay−0.49−0.29−0.38
Querococha0.80−0.20−0.28
Yanamarey−0.62−0.24−0.34
Artesonraju AP2−0.84−0.28−0.40
Huarapasca0.76−0.12−0.17
Monthly Temperature
Recuay−0.32−0.20−0.30
Yungay0.74−0.03−0.05
Querococha−0.45−0.06−0.08
Yanamarey0.640.080.12
Artesonraju AP2−0.72−0.08−0.12
Huarapasca0.15−0.04−0.06
Disclaimer/Publisher’s Note: The statements, opinions and data contained in all publications are solely those of the individual author(s) and contributor(s) and not of MDPI and/or the editor(s). MDPI and/or the editor(s) disclaim responsibility for any injury to people or property resulting from any ideas, methods, instructions or products referred to in the content.

