Article

Investment Decision of Blockchain Technology in Fresh Food Supply Chains Considering Misreporting Behavior

1
School of Business, Ningbo University, Ningbo 315211, China
2
College of Finance & Information, Ningbo University of Finance & Economics, Ningbo 315175, China
*
Author to whom correspondence should be addressed.
Sustainability 2023, 15(9), 7421; https://doi.org/10.3390/su15097421
Submission received: 1 April 2023 / Revised: 21 April 2023 / Accepted: 28 April 2023 / Published: 29 April 2023

Abstract

:
Effectively managing fresh food supply chains (FFSCs) has long been a big challenge owing to the complexity in practice. Adoption of innovative technologies, blockchain traceability (BT), and cold-chain preservation (CP) technology to improve the efficiency of FFSC management has attracted much attention practically and academically. Distinct from existing studies, this paper provides a specific insight into the application of these two technologies by taking into account their functions in restraining misreporting behavior with BT technology due to its traceability and transparency and improving the freshness with CP technology based on the investment in fresh preservation equipment. With this in mind, this paper develops game theoretic models to identify the conditions under which technologies are the optimal selection for the supplier/retailer. It assumes that the retailer is the Stackelberg leader and the supplier is the follower. The key findings show that: (1) with the foci to eliminate suppliers’ misreporting behavior and minimize the incentive fees, BT investment can increase prices and promote order quantities and demand; (2) only when the consumers demonstrate “appropriate” sensitivity to freshness, a win–win situation can be achieved without adoption of BT technology; and (3) suppliers are not keen to invest in BT or CP technology when the circulation time is short, while retailers prefer to invest in CP technology when the circulation time is long.

1. Introduction

Food loss and waste are considered serious issues in many developed countries, whereas food shortage and famine exist in many African countries. This contradiction is rife in unbalanced development worldwide. According to the World Food Program [1] report, almost 135 million people were identified with severe food shortages in 2019 [2]. Further, the United Nations Environment Program [3] estimated that around 931 million tons of food were wasted in the downstream FSC in 2019. In reality, there are two main root causes for the high rate of spoilage. First, food loss and waste can be significantly increased when there is over-ordering by retailers [4]. Second, fresh foods deteriorate severely owing to short shelf life, complex transportation procedures, and difficulties in preservation [2,5]. Given the high deterioration rate, consumers now place a premium on the freshness of fresh food [5].
Information asymmetry in fresh food supply chains (FFSCs) is considered to account for the over-ordering issue [6]. Particularly, this information asymmetry can incite the food supplier to lie to the retailer by misreporting the freshness of the food products in order to gain extra profit from defrauding when retailers order more [7]. In recent years, source tracing of fresh agricultural products on blockchain traceability (BT) is a concern for consumers. For firms selling fresh agricultural products, whether or not to join the BT platform to disclose product freshness is a thorny problem [8]. Considering the characteristics of BT technology, e.g., traceability and transparency, the supplier has to report the real lead time from beginning to end. Therefore, to restrain the supplier’s misreporting behavior, one of the solutions for the retailer is the introduction of BT technology. In terms of the nature of this technology—authenticity, traceability, and transparency—BT has been widely applied in the agricultural field, drug traceability systems, and vaccine information tracing systems [9,10,11]. Further, BT technology has been forwarded as an innovation to address pressing sustainability challenges in food supply chains [12,13,14]. As the data in a blockchain are immutable and rely on the consensus of the network, unauthorized changes are not possible, which can assist in reducing fraud and corruption by ensuring the authenticity of agricultural products [13]. In our study, the adoption of BT can track and trace the entire processes and timeline of the food products from “farm to fork”, which provides a solution to eliminate the misreporting issue.
Although BT technology can identify the authentic quality level, suppliers need to consider whether to adopt cold-chain preservation (CP) technology to fulfill the demand by reducing the deterioration rate of high-quality fresh food products [15]. Therefore, this paper considers three scenarios: first, an FFSC without any technologies; second, the retailer invests in BT technology to restrain misreporting behavior, i.e., an FFSC with BT technology; third, if the retailer chooses to invest in BT technology, the supplier invests in CP technology, i.e., an FFSC with BT and CP technologies. We compare the first and second scenarios to discuss the motivation for investing in BT technology considering the supplier’s misreporting behavior, and we further examine the dynamic changes in firms’ decisions with a comparative analysis of the three scenarios.
In reality, suppliers may choose to misreport products’ lead time to increase the quality level indicated by the freshness in an FFSC, which can incite retailers to order more fresh food [6,16], e.g., fresh food that will be only 10 days out of date is misreported as having 20 days left in order to attract more consumers to buy. However, experienced consumers can identify the authentic quality level and freshness when consuming fresh food products [7,17]. As a result, there will be redundant order quantities by the retailer and wastage of fresh food among consumers.
BT technology is a common technique restraining suppliers’ misreporting behavior to help ensure the authenticity of information [18,19]. However, a trade-off between the investment cost and its effectiveness needs to be carefully considered by the retailer. Additionally, when the supplier is restrained from misreporting with the adoption of BT technology, another issue may be raised as whether to invest in CP technology to improve the freshness level of fresh food [15,20], thereby increasing profit.
Existing literature mainly considers the value of CP technology investment but ignores the joint effect of different types of technologies, particularly the effect on the elimination of misreporting behavior. Therefore, the above behavioral phenomena and scenarios stimulate our research by focusing on the joint effect and investment decisions of the two types of technologies.
The aim of this study is to analyze the influence mechanisms for investing in BT technology considering the supplier’s misreporting behavior and to examine the dynamic changes in firms’ decisions. To the best of our knowledge, this research is one of only a few studies that consider the two technologies and misreporting behaviors for optimizing operations in the FFSC context.
To achieve the above aims, this paper develops Stackelberg game theoretic models to study the selected technologies. It assumes that the freshness of food is related to the circulation time and lead time. The retailer invests in BT technology to restrain suppliers’ misreporting behavior about lead time, and the supplier invests in CP technology to improve the freshness of food. Both technologies may be constrained by investment cost and its investment effect.
The remainder of the paper is organized as follows. Section 2 reviews the related literature, and Section 3 introduces the method and model setup. Section 4 provides an equilibrium analysis of the two scenarios. Section 5 compares an alternative model with the basic model. Section 6 offers managerial insights and future research directions.

2. Literature Review

Three streams of research are closely related to our study: food loss and waste and CP technology, misreporting behavior in an FFSC, and application of BT technology in an FFSC.

2.1. Food Loss and Waste and CP Technology

Food loss and waste in FFSCs are mainly generated in transport or storage processes, which lead to an adverse effect on freshness. This wastage is also considered as the loss of value and the loss of effective supply [20,21]. For example, Wang and Li [20] use a pricing model to track the shelf life of food products and describe the quantity loss and quality degradation of fresh agricultural products in the circulation process. Their findings show that improvements in visibility and traceability in FFSCs facilitated by tracking and tracing technologies have great potential to improve operational efficiency. In addition to natural disasters and related epidemics, freshness and retail price are the two most important factors affecting the order quantities and demand of fresh food in daily life [22]. To improve freshness, i.e., to reduce lead time or extend shelf life, the supplier or retailer invests in cold-chain/preservation technology or equipment at the transport and storage stages [15,23,24,25]. For example, Qian and Olsen [24] explore the coordination of operational and financial decisions of proportional investment agricultural marketing cooperatives, where members’ (farmers’) equity is required to be in proportion to their patronage (i.e., produce supplied). Yu et al. [15] study the price and cold-chain service decisions in FFSCs with competing retailers and explore the impacts of (horizontal/vertical) integration on decisions and profits.

2.2. Misreporting Behavior in an FFSC

As one of the two main factors affecting the order quantities and demand for fresh food, freshness particularly concerns the retailer [15,20]. The supplier often misrepresents the lead time, i.e., the exact production time of the fresh food, which is similar to the traditional two-level supply chain, and the situation of unilateral information asymmetry resulting in misreporting behavior [16]. Furthermore, the supplier’s misreporting or lying behavior in the FFSC leads the retailer to order more quantities, which results in food loss and waste of agricultural products [7,17]. For example, Feng and Liu [17] study the cost of misreporting in a three-echelon FFSC with the supplier as the leader, a third-party logistic (TPL) service provider, and a retailer as followers by assuming the market demand depends on the logistics service level and retail prices. They find the system’s profit in unilateral misreporting is greater than that in bilateral misreporting; however, the system’s profit in unilateral misreporting and bilateral misreporting is not necessarily lower than that in the system without misreporting.

2.3. Application of BT Technology in an FFSC

BT technology has been widely used in drug traceability systems [10], vaccine information tracing systems [11], agricultural product circulation [9], etc., indicating the technological characteristics of authenticity, traceability, and transparency [26] or reducing the retailer’s appetite for risk [27]. In order to deal with the supplier’s misreporting behavior, BT technology is adopted by the retailer for agriculture or fresh food. Practices and theories have proved that BT technology can effectively deal with the supplier’s misreporting behavior by improving traceability [7,28,29]. For example, Chen et al. [7] study the influence of the application of blockchain technology on the producer’s misreporting behavior and find that within a certain threshold of technology investment cost, the application of blockchain technology can inhibit producers from misrepresenting the activity information and not only improve the total profit of the supply chain, but also increase the stability of the supply chain.

2.4. Summary of Knowledge Gaps

After scrutinizing the existing literature, some knowledge gaps have been identified. First, most studies only focus on the loss of perishable products and investment in cold-chain technology [20,24], and the application of BT technology in the FFSC context remains scant. Second, much attention has been paid to the role, opportunities, and challenges of the technologies in the FFSC [7,30,31], and only a few studies compare the two types of investments, that is, weighing which one is more valuable [5]. These gaps motivate the theoretical research aim of this paper. A comparison between this paper and relevant literature is shown in Table 1.
The innovation of this paper is reflected in the research perspective and model setting. First, from the perspective of whether there are and which kind of technologies to be invested in, we study the internal mechanism of the Stackelberg game in the process of BT/CP technology investment. Second, model settings have been optimized compared to previous studies: (1) Previous studies mainly linked freshness with the circulation time for fresh food while ignoring the improvement by the CP investment level; (2) We relax the assumption that order quantities and demand are consistent [7] and combine the imbalance between order quantities and demand in reality with misreporting; and (3) We design the cost of BT technology as fixed costs and describe the cost of CP technology as the quadratic concave function cost, which is closely related to freshness.

3. Method and Model Setup

3.1. Problem Description

This paper develops a game theoretic model with one supplier and one retailer in an FFSC considering the supplier’s misreporting behavior. It assumes that the retailer is the Stackelberg leader and the supplier is the follower. As per the example of small-scale farmers and Wal-Mart, and Freshippo with smallholders, two players work in an FFSC. As the supplier shows misreporting behavior, the retailer can choose a strategy of investing in blockchain traceability (BT) to counteract the behavior with the fixed cost and incentive fee paid to the supplier. Or, the retailer can do nothing but has to face additional order quantities because of the misreporting behavior. In particular, the retailer sells food to consumers. Consumers also take part in the FFSC by deciding whether and in what quantities to buy food based on prices and freshness. In alternative models (Section 5), this paper considers an extended case where the supplier invests in cold-chain preservation (CP) technology to increase the freshness of food. Figure 1 describes the framework for FFSC in our problem context.
In line with the emerging supplier–retailer–consumer interaction framework, our model incorporates all three parties and the interactions between them. Furthermore, it shows the BT and CP technology used in the FFSC practice. Table 2 provides a summary of all parameters and variables used in the research.

3.2. Assumptions

Assumption 1.
The freshness of food decreases with the lead time.
The freshness of food decreases with the lead time t and 0 t T , where T represents the circulation time of fresh food [20]. We assume the freshness function for food is K ( t ) = 1 t 2 / T 2 without BT or CP technology [34,35].
Assumption 2.
There exists waste fresh food due to supply–demand uncertainty.
The supplier produces fresh food and sells it to the retailer at wholesale price w with the unit production cost c . According to the wholesale price w of fresh food and its freshness, the retailer orders quantities Q from the supplier and then sells them to the consumers [32].
The market demand for fresh food is also deeply affected by the retailer’s price and freshness; thus, we assume the demand function is as follows.
D ( p , t ) = α β p + γ K ( t )
where α represents the market size, β represents the sensitivity coefficient of retailer price for food, and γ represents the sensitivity coefficient of freshness of food [15,22].
Due to the supply–demand uncertainty scenario (i.e., Q D because Q = D ( p , δ t ) > D ( p , t ) ), there exists waste fresh food, and we assume the salvage value for waste fresh food is s , where 0 < s < c [32].
Assumption 3.
When the supplier’s misreporting behavior occurs, the retailer will meet the unveracious lead time.
When the supplier’s misreporting behavior occurs, the retailer will meet the unveracious lead time δ t , where 0 < δ < 1 [33]. As misreporting can falsely increase the freshness of food, the supply–demand uncertainty becomes more serious.
Assumption 4.
BT technology can counteract the misreporting behavior.
To counteract the supplier’s misreporting behavior, the retailer can choose a strategy of investing in BT technology with the fixed cost F and incentive fee f paid to the supplier [28,29]. After observing the BT equipment or investment, the supplier reports the real lead time t [26].
Assumption 5.
A proportion of fresh food was misreported by the supplier.
In order to show the supplier’s preference for misreporting behavior, we assume the proportion of misreported lead time for fresh food is k ; therefore, the proportion of real lead time for fresh food is 1 k .
Given the above assumptions, the supplier’s and the retailer’s profits in the scenario without any technology (denoted as N) are:
π s N = ( w c ) · D + k · ( w c ) · ( Q D )
where ( w c ) · D is the wholesale revenue of sales food, and k · ( w c ) · ( Q D ) is the wholesale revenue of surplus food due to the misreporting behavior.
π r N = ( p w ) · D k · ( w s ) · ( Q D )
where ( p w ) · D is the sale revenue of sales food, k · ( w c ) · ( Q D ) are the losses of surplus food due to the misreporting behavior, and Q > D .
Similarly, the supplier’s and the retailer’s profits in the scenario with BT technology (denoted as B) are:
π s B = ( w c + f ) · D
π r B = ( p w ) · D F
where F is the fixed cost of BT technology, f is the incentive fee paid to the supplier, and Q = D .
Under Scenario N, the sequence of decisions in the game is:
(1) 
The supplier announces the warehouse price w with misreporting behavior;
(2) 
Observing the warehouse price w , the retailer decides the sales price  p .
Under Scenario B, the sequence of decisions in the game is:
(1) 
The retailer selects BT technology;
(2) 
Observing it, the supplier announces the warehouse price w without misreporting behavior;
(3) 
Observing the warehouse price w , the retailer decides the sales price p .
Here, this paper follows a common assumption in recent work on the misreporting behavior literature in FFSC management that assumes the retailer has a right to select either investing in BT technology or not (e.g., [5,27]). This paper’s objective in the basic model is to determine the motivation and impact mechanisms for investing in BT technology. Using backwards induction, firms can obtain equilibrium decisions.

4. Equilibrium Analysis

4.1. A FFSC without any Technology Scenario (N)

According to Equations (2) and (3), we obtain Lemma 1.
Lemma 1.
Assuming c < min { c ^ 1 , c ^ 2 } and s > s ^ 1 . The equilibrium analysis decisions are w N = M 1 / ( 2 β T 2 ) and p N = { M 1 + 2 [ ( α + γ ) T 2 γ t 2 ] } / ( 4 β T 2 ) . Furthermore, we can obtain Q N = { 2 [ ( α + γ ) T 2 + ( 1 2 δ 2 ) γ t 2 ] M 1 } / ( 4 T 2 ) , D N = { 2 [ ( α + γ ) T 2 γ t 2 ] M 1 } / ( 4 T 2 ) , π s N = ( M 1 2 β T 2 c ) 2 8 β T 4 , and π r N = { 2 [ ( α + γ ) T 2 γ t 2 ] M 1 } 2 8 k ( M 1 2 β T 2 s ) ( 1 δ 2 ) γ t 2 16 β T 4 , where M 1 = ( α + c β + γ ) T 2 [ 1 2 k ( 1 δ 2 ) ] γ t 2 , c ^ 1 = { ( α + γ ) T 2 [ 1 2 k ( 1 δ 2 ) ] γ t 2 } / ( β T 2 ) , c ^ 2 = { ( α + γ ) T 2 2 k ( 1 δ 2 ) γ t 2 } / ( β T 2 ) , and s ^ 1 = M 1 2 β T 2 { 2 [ ( α + γ ) T 2 γ t 2 ] M 1 } 2 16 β T 2 k ( 1 δ 2 ) γ t 2 .
Proof of Lemma 1.
From β > 0 , the second-order condition of π r N over p is derived as 2 π r N / p 2 = 2 β < 0 , which ensures the existence and uniqueness of the optimal decisions. Solving conditions of π r N / p = 0 for p , we have p ( w ) . Then, inserting p ( w ) into π s N , the second-order condition of π s N over w is derived as 2 π s N / w 2 = β < 0 . Solving conditions of π s N / w = 0 for w , we have w N . Inserting w N into p ( w ) , we can obtain p N . Further, inserting w N and p N into Q , D , π s N , and π r N , we can obtain Q N , D N , π s N , and π r N . From c < min { c ^ 1 , c ^ 2 } and s > s ^ 1 , we have p N > w N > c , Q N > D N > 0 , π r N > 0 , and π s N > 0 . □
Note that the assumption of c < min { c ^ 1 , c ^ 2 } and s > s ^ 1 ensures the existence and uniqueness of the optimal decisions. Specifically, c < c ^ 1 guarantees w N > c ; c < c ^ 2 guarantees 2 [ ( α + γ ) T 2 γ t 2 ] M 1 > 0 , and therefore, we have p N > w N > 0 and Q N > D N > 0 ; and s > s ^ 1 guarantees π r N > 0 .
Further, min { 1 2 ( 1 δ 2 ) ( α + γ ) T 2 2 ( 1 δ 2 ) γ t 2 , 0 } < k < ( α + γ ) T 2 2 ( 1 δ 2 ) γ t 2 should be satisfied to ensure c ^ 1 > 0 and c ^ 2 > 0 . Firstly, min { 1 2 ( 1 δ 2 ) ( α + γ ) T 2 2 ( 1 δ 2 ) γ t 2 , 0 } < ( α + γ ) T 2 2 ( 1 δ 2 ) γ t 2 because 1 2 < ( α + γ ) γ T 2 t 2 ; Secondly, a sufficiently high proportion of fresh food with misreporting behavior (i.e., k ( α + γ ) T 2 2 ( 1 δ 2 ) γ t 2 ) makes the decision or profit negative.
From Lemma 1, we can derive Corollaries 1 and 2.
Corollary 1.
Assuming Δ = Q N D N = ( 1 δ 2 ) γ t 2 / T 2 , when t , γ , T , δ , we have Δ .
Proof of Corollary 1.
From Lemma 1, γ > 0 , 0 < δ < 1 , and 0 < t < T , we have Δ = Q N D N = ( 1 δ 2 ) γ t 2 / T 2 , further, we have Δ / t = 2 ( 1 δ 2 ) γ t / T 2 > 0 , Δ / γ = ( 1 δ 2 ) t 2 / T 2 > 0 , Δ / T = ( 1 δ 2 ) γ t 2 / T 3 < 0 , and Δ / δ = 2 δ γ t 2 / T 2 < 0 . □
No matter in the presence of a longer lead time (i.e., t ) or a shorter circulation time (i.e., T ) for fresh food, or with a more serious misreporting behavior (i.e., δ ) or more sensitivity to freshness (i.e., γ ), more waste fresh products will be generated (i.e., Δ ). This reveals that the misreporting behavior referring to the false lead time has a great impact on the loss and waste of fresh food as it leads to excessive orders, especially for some foods with high freshness sensitivity, such as some seasonal fruits and vegetables, grapes, kale, salad greens, etc.
Corollary 2.
The supplier’s misreporting behavior will increase prices, reduce demand and order quantities, and benefit its own profits.
Proof of Corollary 2.
From Lemma 1, γ , β , k , α , c > 0 , 0 < δ < 1 , and 0 < t < T , we have w N / k = ( 1 δ 2 ) γ t 2 / ( β T 2 ) > 0 , p N / k = ( 1 δ 2 ) γ t 2 / ( 2 β T 2 ) > 0 , D N / k = ( 1 δ 2 ) γ t 2 / ( 2 T 2 ) < 0 , Q N / k = ( 1 δ 2 ) γ t 2 / ( 2 T 2 ) < 0 , π s N / k = ( M 1 2 β T 2 c ) ( 1 δ 2 ) γ t 2 / ( 2 β T 4 ) > 0 , and π r N / k = ( 1 δ 2 ) γ t 2 { 2 [ ( α + γ ) T 2 γ t 2 ] M 1 + 4 k ( 1 δ 2 ) γ t 2 } / ( 4 β T 4 ) < 0 . □
A higher proportion of fresh food with misreporting behavior leads to higher prices (i.e., w N / k > 0 and p N / k > 0 ) and lower order quantities and demand for fresh food (i.e., D N / k < 0 and Q N / k < 0 ), which benefits the supplier and shows the disadvantage for the retailer (i.e., π s N / k > 0 and π r N / k < 0 ). Combined with Corollary 1, it is known that the difference between the order quantities and demand becomes larger, which potentially indicates a more significant reduction in demand, which is very unfavorable for retailers.

4.2. A FFSC with BT Technology Scenario (B)

According to Equations (4) and (5), we obtain Lemma 2.
Lemma 2.
Assuming c < c ^ 3 and F < M 2 2 / ( 16 β T 4 ) . The equilibrium analysis decisions are w B = M 2 2 β T 2 + c f , p B = 3 M 2 4 β T 2 + c f . Furthermore, we can obtain Q B = D B = M 2 4 T 2 , π s B = M 2 2 8 β T 4 , and π r B = M 2 2 16 β T 4 F , where M 2 = [ α ( c f ) β + γ ] T 2 γ t 2 and c ^ 3 = ( α + γ ) T 2 γ t 2 β T 2 + f .
Proof of Lemma 2.
Similar to Lemma 1, the proof can be completed. □
Similar to Lemma 2, the assumption of c < c ^ 3 and F < M 2 2 / ( 16 β T 4 ) ensures the existence and uniqueness of the optimal decisions. Specifically, c < c ^ 3 guarantees M 2 > 0 , and therefore, we have w B > c f , p B > w B > 0 , Q B = D B > 0 , and π s B > 0 ; and F < M 2 2 / ( 16 β T 4 ) guarantees π r B > 0 .
Corollary 3.
The incentive fee paid to the supplier will increase prices, reduce demand and profits, and benefit the supplier more than the retailer.
Proof of Corollary 3.
From Lemma 2, and f , β > 0 , and 0 < t < T , we have w B f = 1 2 < 0 , p B f = 1 4 < 0 , Q B f = D B f = β 4 > 0 , π s B f = M 2 4 T 2 > 0 , π r B f = M 2 8 T 2 > 0 , and π s B f π r B f = M 2 8 T 2 > 0 . □
The more the incentive fee paid to the supplier without misreporting behavior, the lower the prices (i.e., w B / f < 0 and p B / f < 0 ) and the higher the demand and profits (i.e., Q B / f = D B / f > 0 , π s B / f > 0 , and π r B / f > 0 ) obtained. Further, the supplier benefits more than the retailer from the incentive fee (i.e., π s B / f > π r B / f ). This result indicates that although BT technology cuts off the way for suppliers to obtain additional profits through misreporting behavior, the incentive fees to some extent motivate or compensate the supplier to prefer BT technology.
Corollary 4.
Without misreporting behavior, the supplier is more profitable than the retailer (i.e., π r B < π s B ).
Proof of Corollary 4.
From Lemma 2 and F < M 2 2 / ( 16 β T 4 ) , we have π s B π r B = M 2 2 16 β T 4 + F > 0 . □
In the case when the order quantities and demand are consistent, the supplier’s margin profit is higher than the retailer’s (i.e., π r B < π s B ). In the future, to incentivize retailers to adopt blockchain technology in food traceability, sharing with a percentage of BT technology costs (e.g., γ ( 0 , 1 2 + M 2 2 32 β T 4 F ) ) for the supplier might be a good choice.

4.3. Comparison of Equilibrium Decisions and Profits

This section compares the equilibrium decisions (Propositions 1–3) of models based on Lemmas 1 and 2, conducts several numerical studies to compare the profits of models, and then analyzes the motivations and impact mechanisms for investing in BT technology.
Proposition 1.
When f < f ^ 1 , we have D B = Q B < D N < Q N (we delete this situation as f ^ 1 < 0 ); when max { f ^ 1 , 0 } f < f ^ 2 , we have D N D B = Q B Q N ; when f f ^ 2 , we have D N < Q N < D B = Q B .
Proof of Proposition 1.
From Lemmas 1 and 2, γ , β , k , α , c > 0 , 0 < δ < 1 , and 0 < t < T , we have Q B = D B , Q N , D N . Solving D N = D B for f gives f = f ^ 1 = 2 k ( 1 δ 2 ) ] γ t 2 / ( β T 2 ) < 0 . Further, if f < f ^ 1 , we have D B < D N , as it contradicts the assumption, we delete this situation; Otherwise, we have D N D B . Solving Q B = Q N for f gives f ^ 2 = 2 ( 2 k ) ( 1 δ 2 ) γ t 2 / ( β T 2 ) . Further, if f < f ^ 2 , we have Q B Q N ; otherwise, we have Q N < Q B . □
If the incentive fee paid to the supplier without misreporting behavior is sufficiently low (i.e., 0 f < f ^ 2 ), order quantities generated by misreporting behavior than that with BT technology investments, i.e., the supplier will continue to choose misreporting behavior judging from the order quantities. However, when the incentive fee is high enough (i.e., f f ^ 2 ), the amount of orders under BT technology investment exceeds those with misreporting behavior. With the increase in the incentive fee, it is possible to create more order quantities or demand, but hurt the retailer’s profit as the amount of incentive fee paid is too much. Therefore, the impact of incentive fee on profits needs to be further discussed, as shown in Proposition 2.
Proposition 2.
When f > f ^ 3 , we have π s B > π s N ; otherwise, we have π s B π s N .
Proof of Proposition 2.
From Lemmas 1 and 2, γ , β , k , α , c > 0 , 0 < δ < 1 , and 0 < t T , we have π s B π s N = [ M 2 + M 1 2 β T 2 c ] [ M 2 M 1 + 2 β T 2 c ] / ( 8 β T 4 ) . Solving π s B π s N = 0 for f gives f = f ^ 3 = 2 k ( 1 δ 2 ) γ t 2 / ( β T 2 ) . Further, if f > f ^ 3 = 2 k ( 1 δ 2 ) γ t 2 / ( β T 2 ) , we have π s B > π s N ; otherwise, we have π s B π s N . □
When the incentive fee paid to the supplier is sufficiently high (i.e., f > f ^ 3 ), the supplier prefers BT technology. Interestingly, although the order quantities are less than those with misreporting behavior; when the incentive fee is at a certain interval ( f ^ 3 , f ^ 2 ) , the supplier is also profitable, which potentially means that the incentive fee from the retailer compensates for the shortfall in order quantities. As predicted in Proposition 1, the higher the incentive fee is, the greater the order quantities and the supplier’s profit are, but it is impossible for the retailer to blindly increase this incentive fee in reality.
Proposition 3.
When F < F ^ 2 and k > k ^ 2 , we have π r B > π r N ; otherwise, we have π r B π r N .
Proof of Proposition 3.
From Lemmas 1 and 2, γ , β , k , α , c > 0 , 0 < δ < 1 , and 0 < t T , we have π r B π r N = M 2 2 16 β T 4 F { 2 [ ( α + γ ) T 2 γ t 2 ] M 1 } 2 8 k ( M 1 2 β T 2 s ) ( 1 δ 2 ) γ t 2 16 β T 4 . Solving π r B π r N = 0 for F gives k = k ^ 2 = { 2 [ ( α + γ ) T 2 γ t 2 ] M 1 } 2 M 2 2 8 ( M 1 2 β T 2 s ) ( 1 δ 2 ) γ t 2 and F = F ^ 2 = M 2 2 16 β T 4 { 2 [ ( α + γ ) T 2 γ t 2 ] M 1 } 2 8 k ( M 1 2 β T 2 s ) ( 1 δ 2 ) γ t 2 16 β T 4 . Further, if k > k ^ 2 and F < F ^ 2 , we have π r B > π r N ; otherwise, we have π r B π r N . □
The motivation of the retailer to select/introduce BT technology is the fixed cost of investing in BT technology should be not too high (i.e., F < F ^ 2 ), and the proportion of fresh food with misreporting behavior should be high (i.e., k > k ^ 2 ). For the retailer, it is more important to consider the blockchain investment cost and the proportion of fresh food with misreporting behavior rather than the amount of incentive fee. As a result, less cost and a reduced proportion can significantly improve the retailer’s profit.
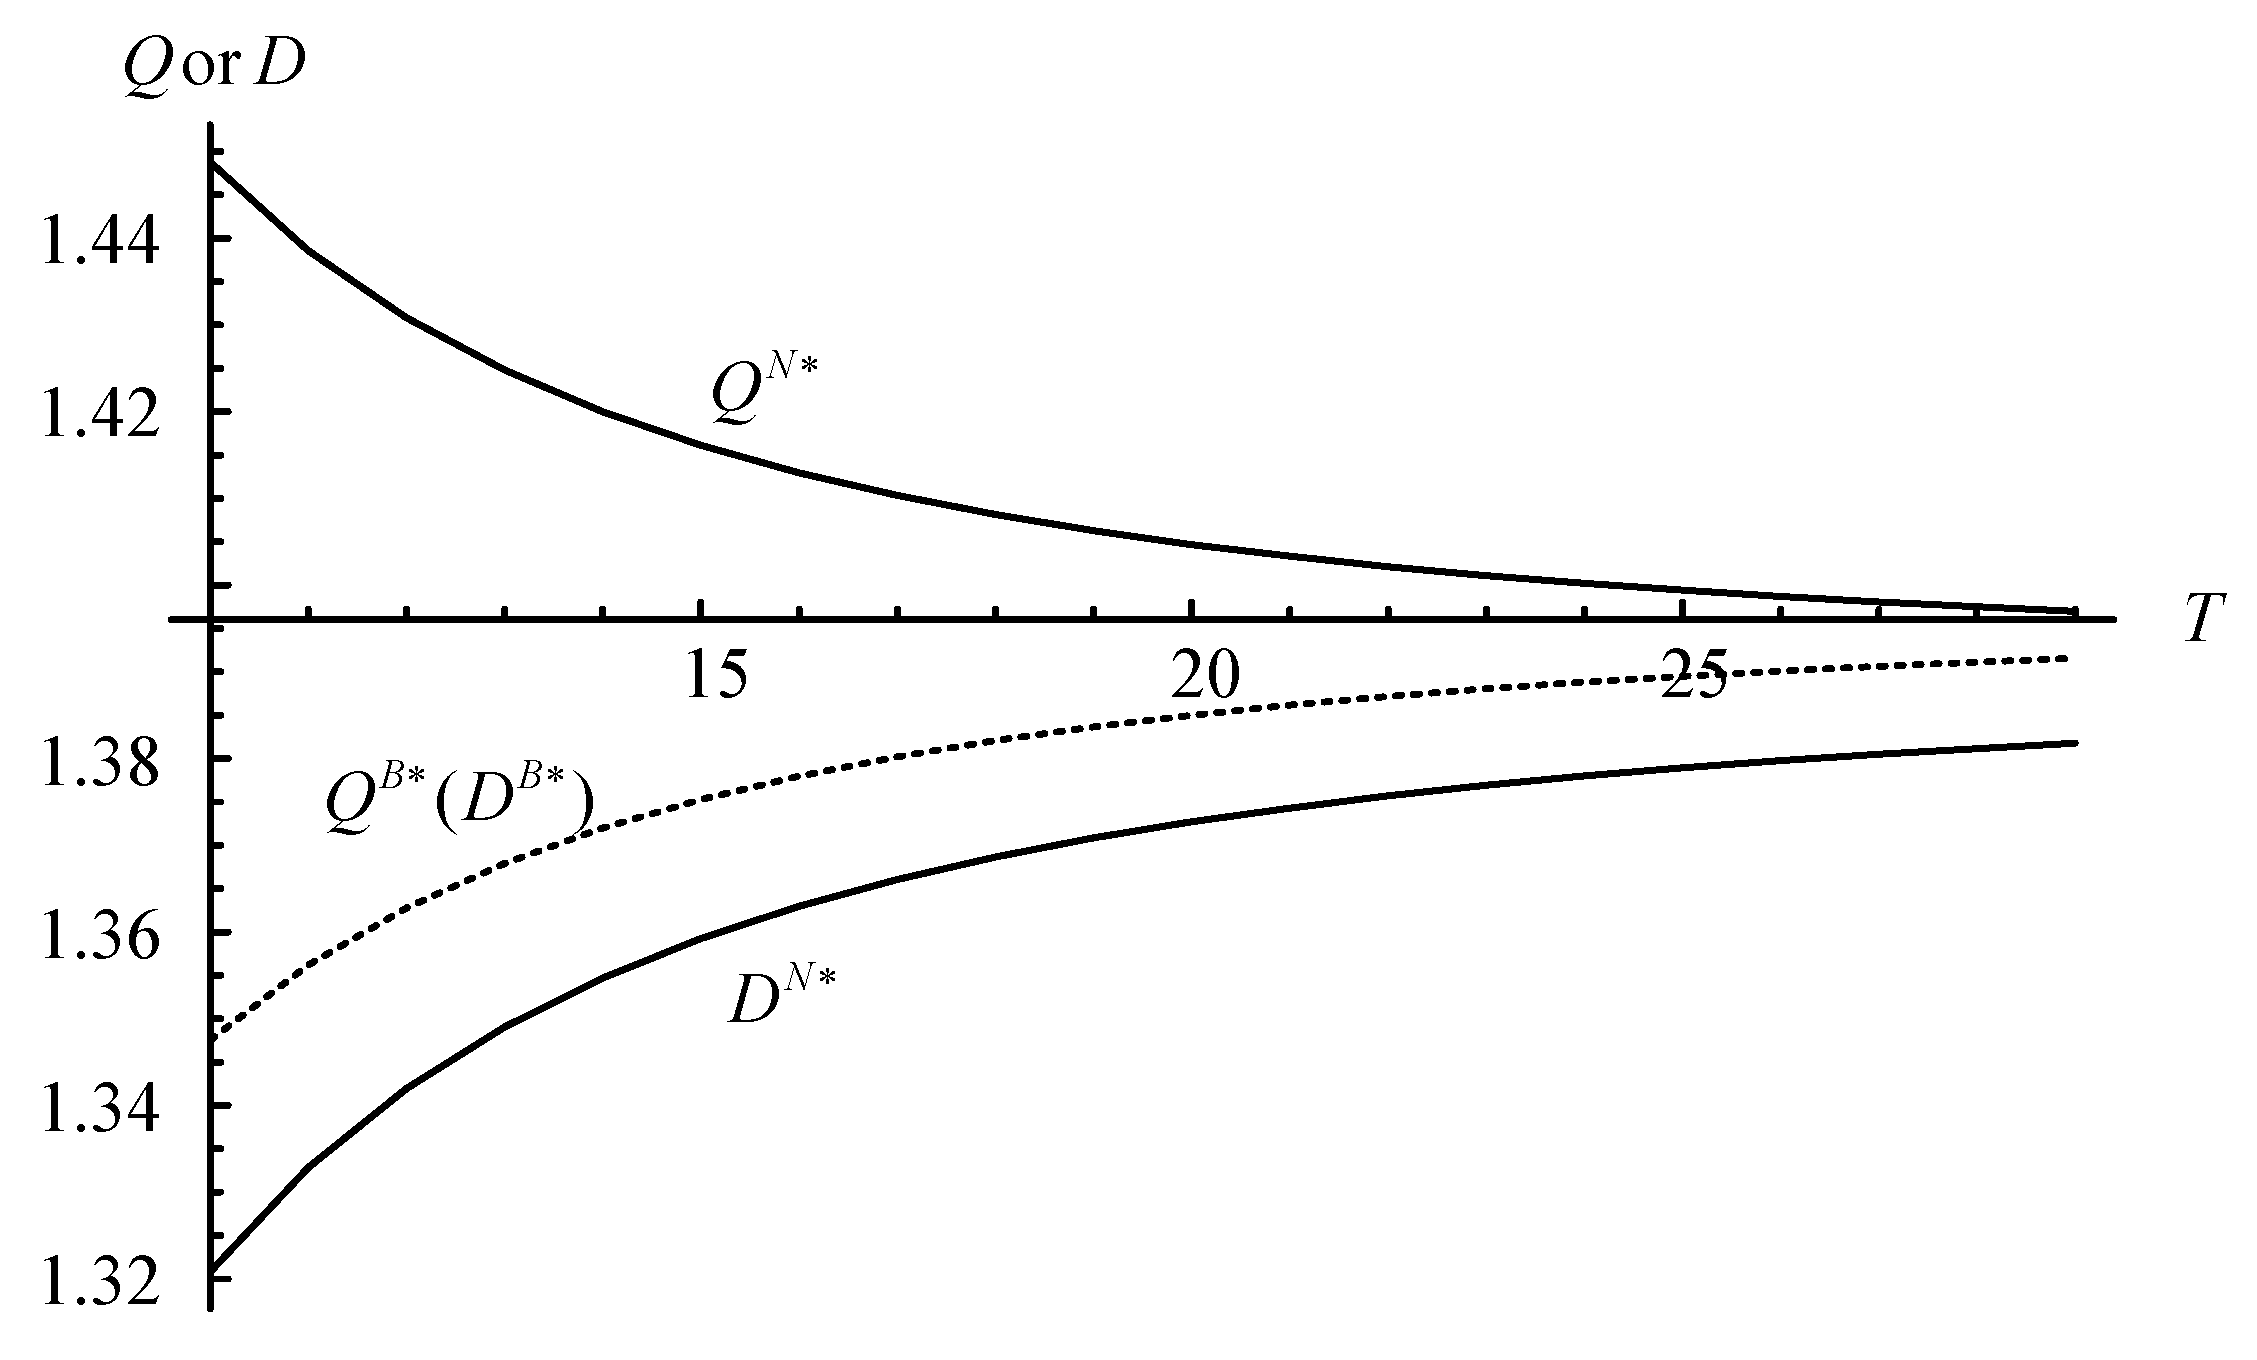
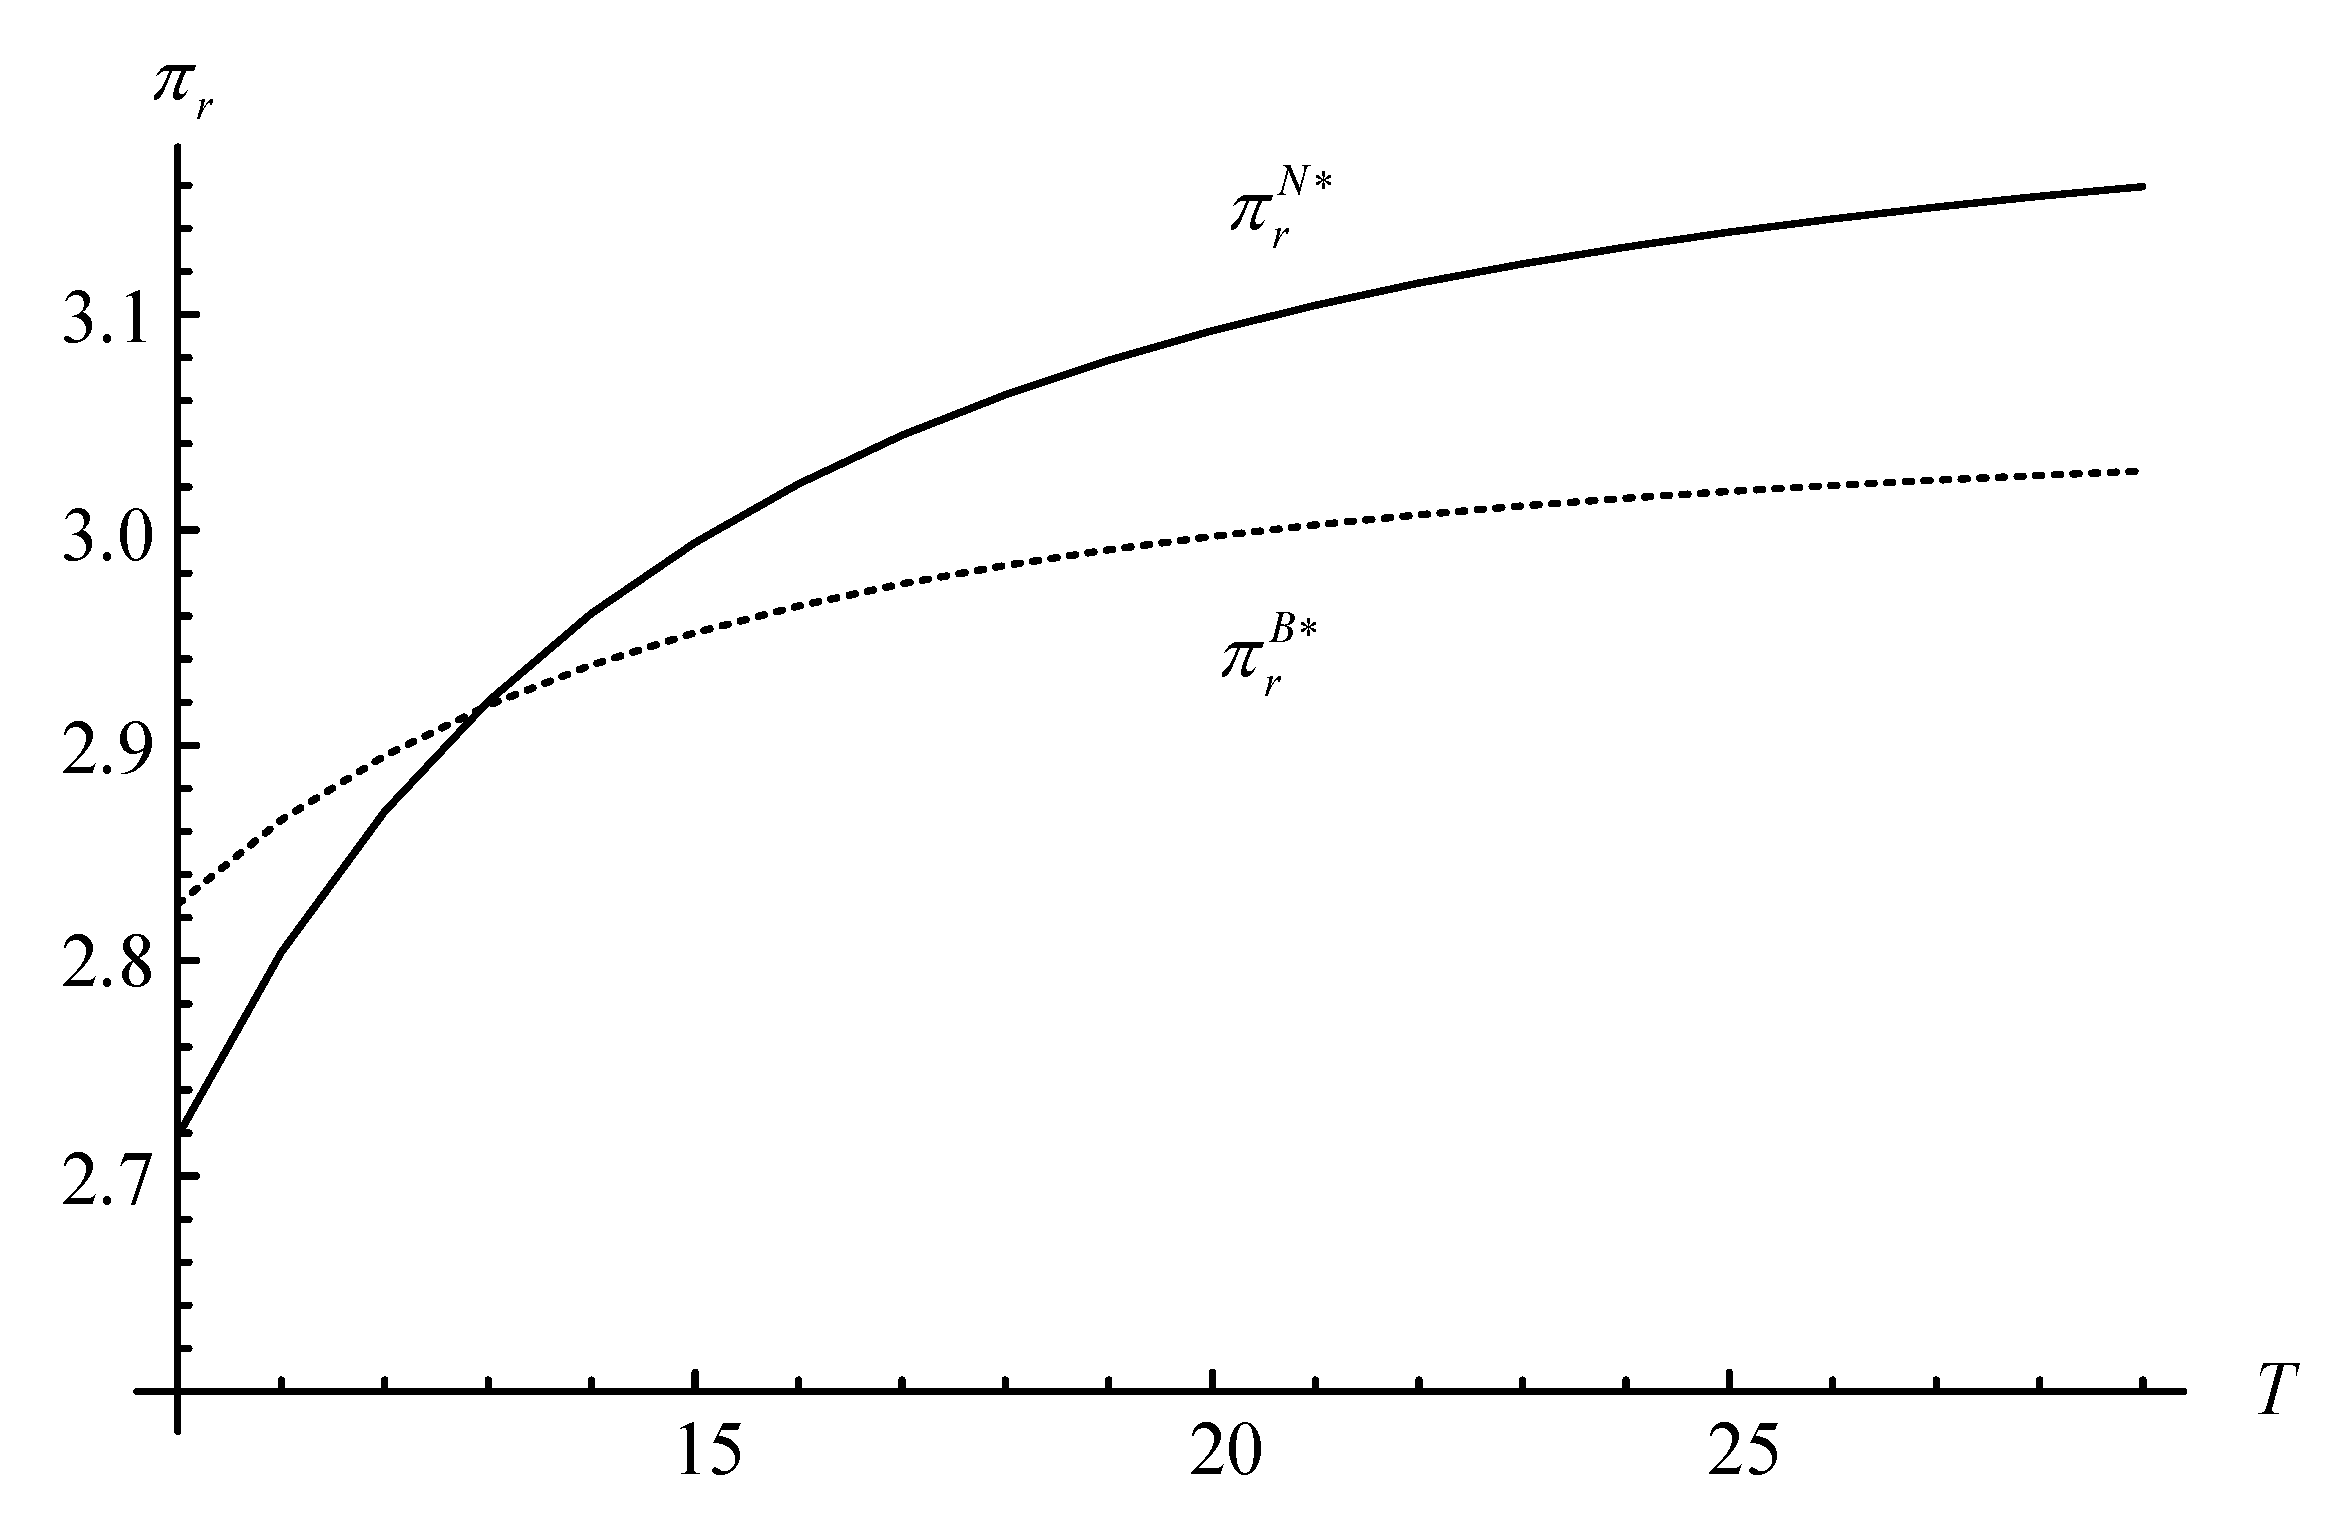
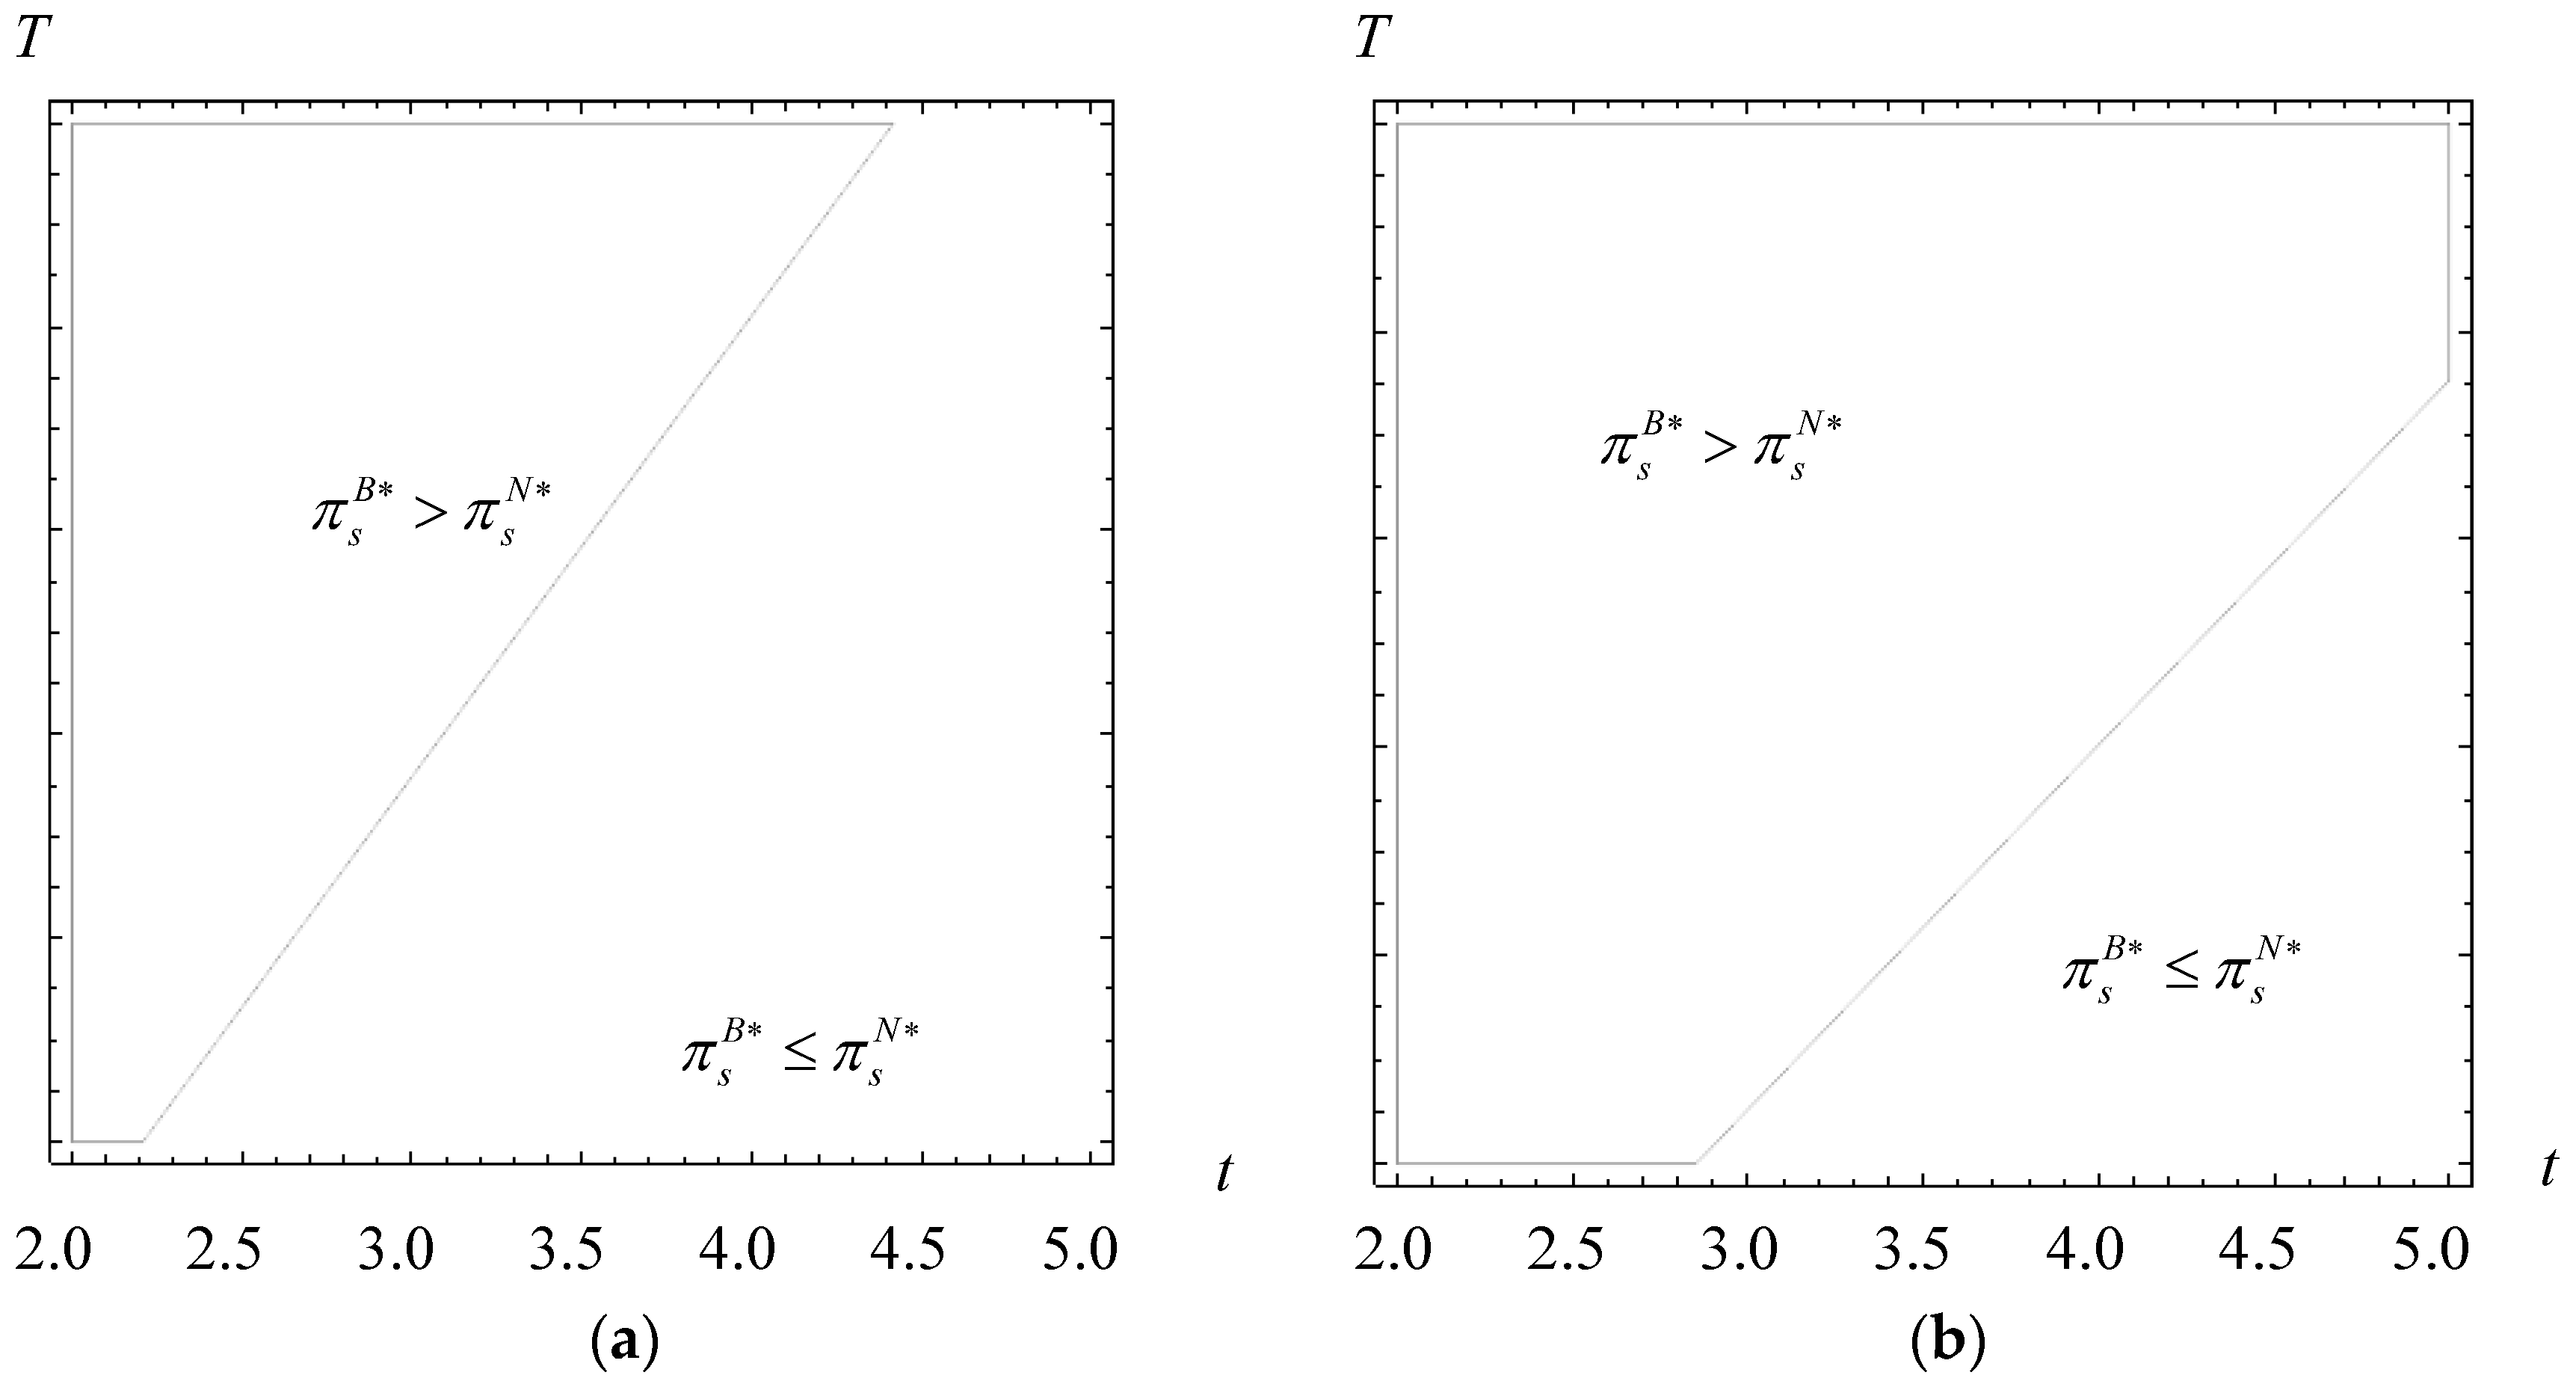
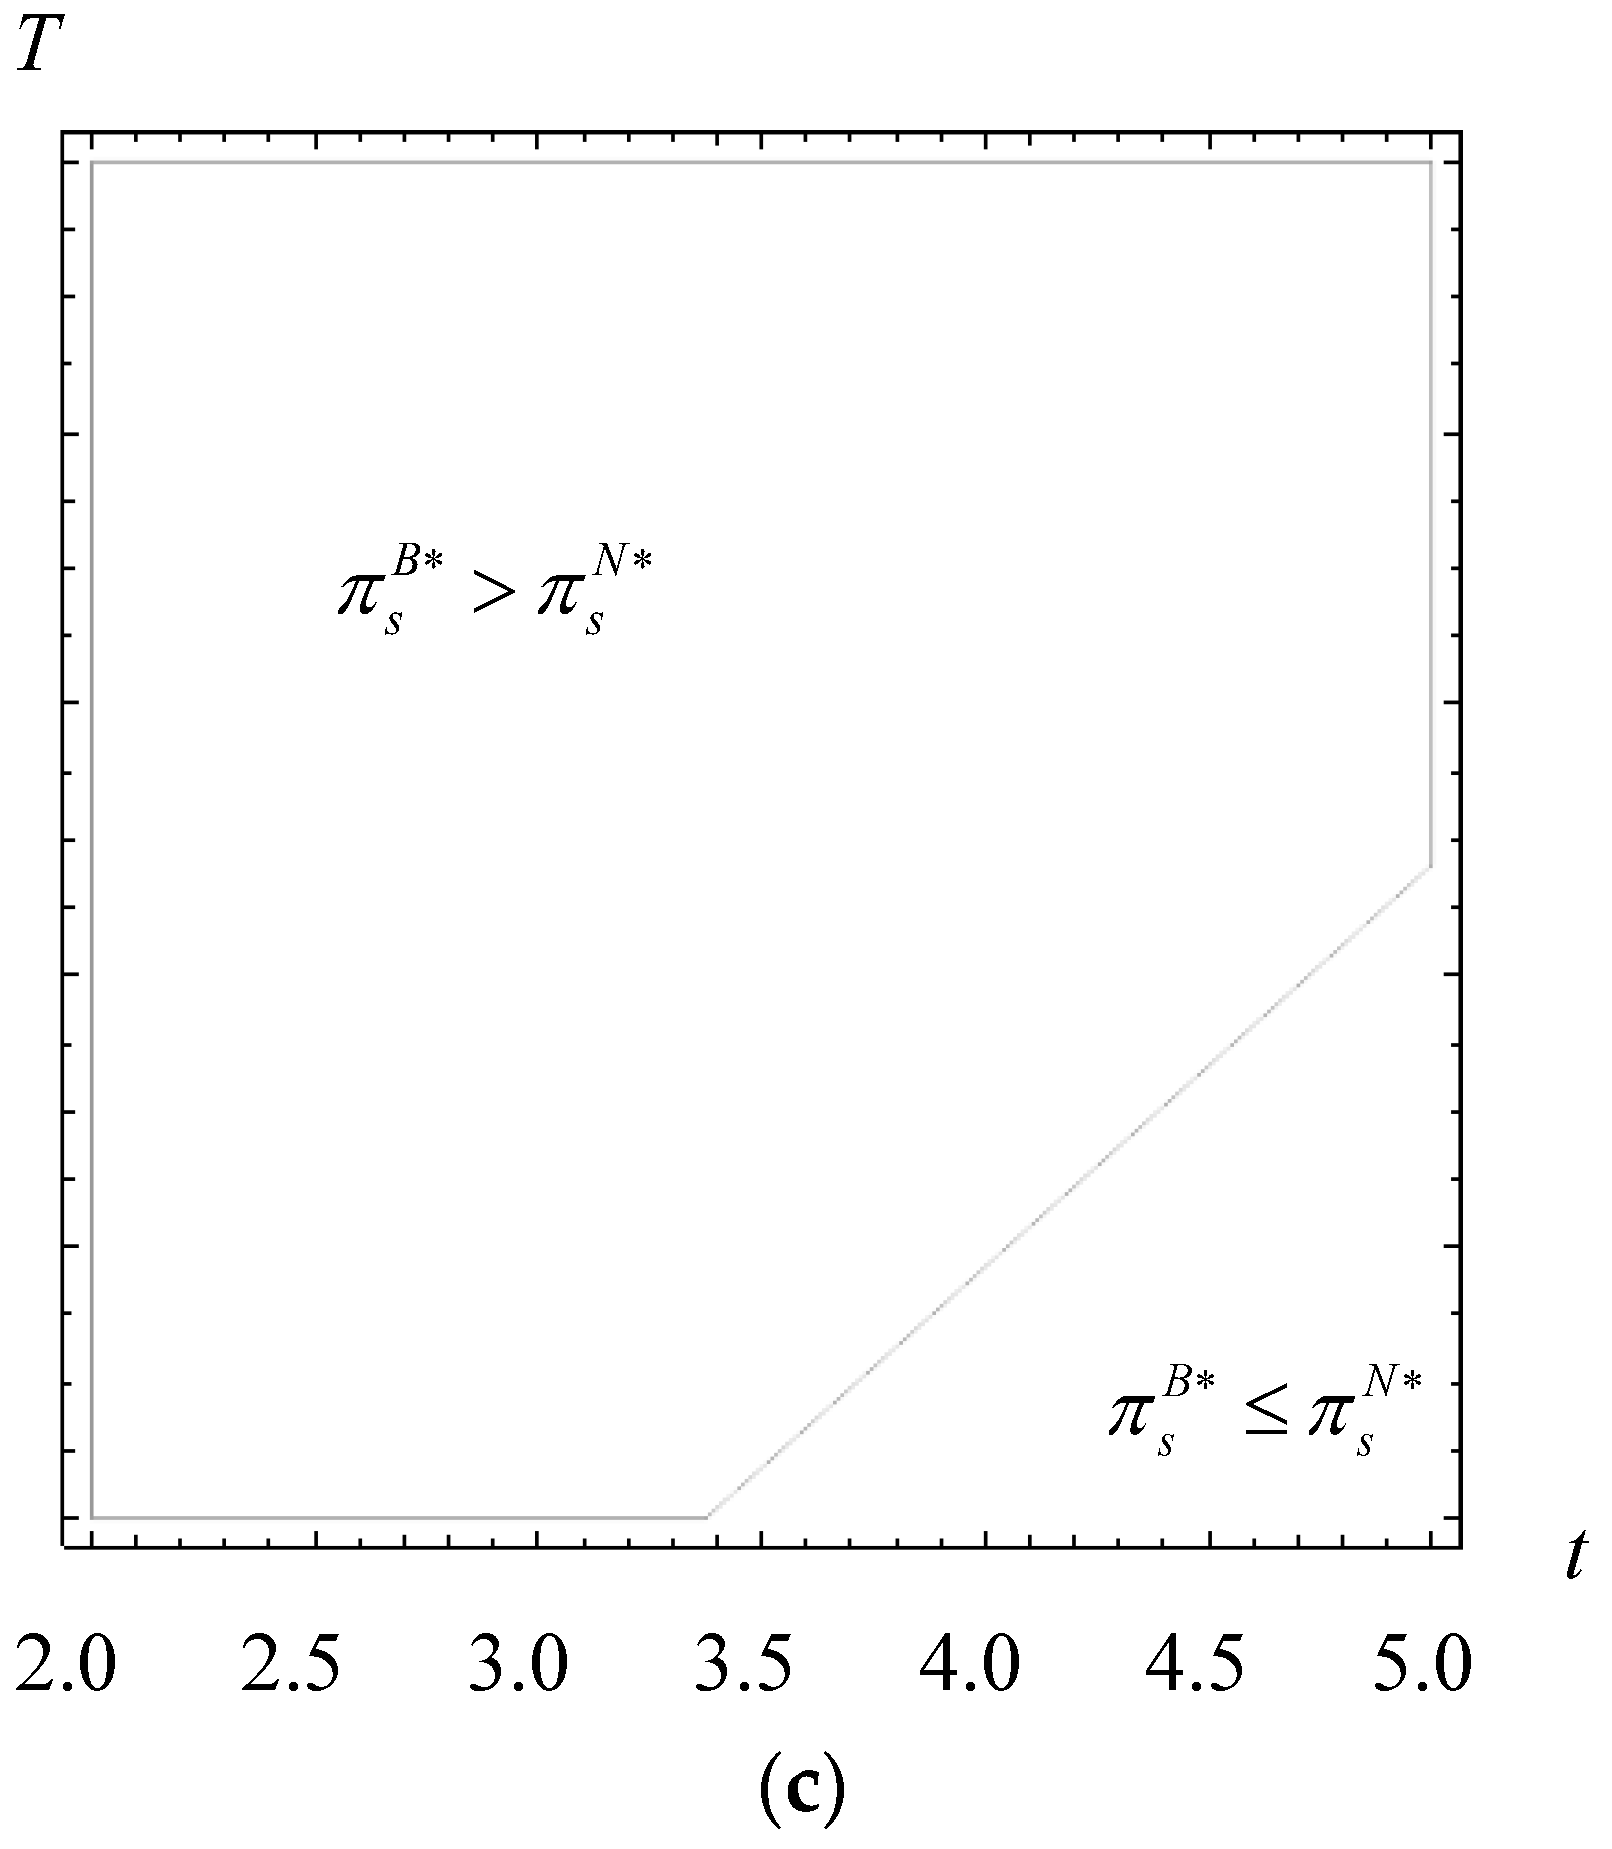
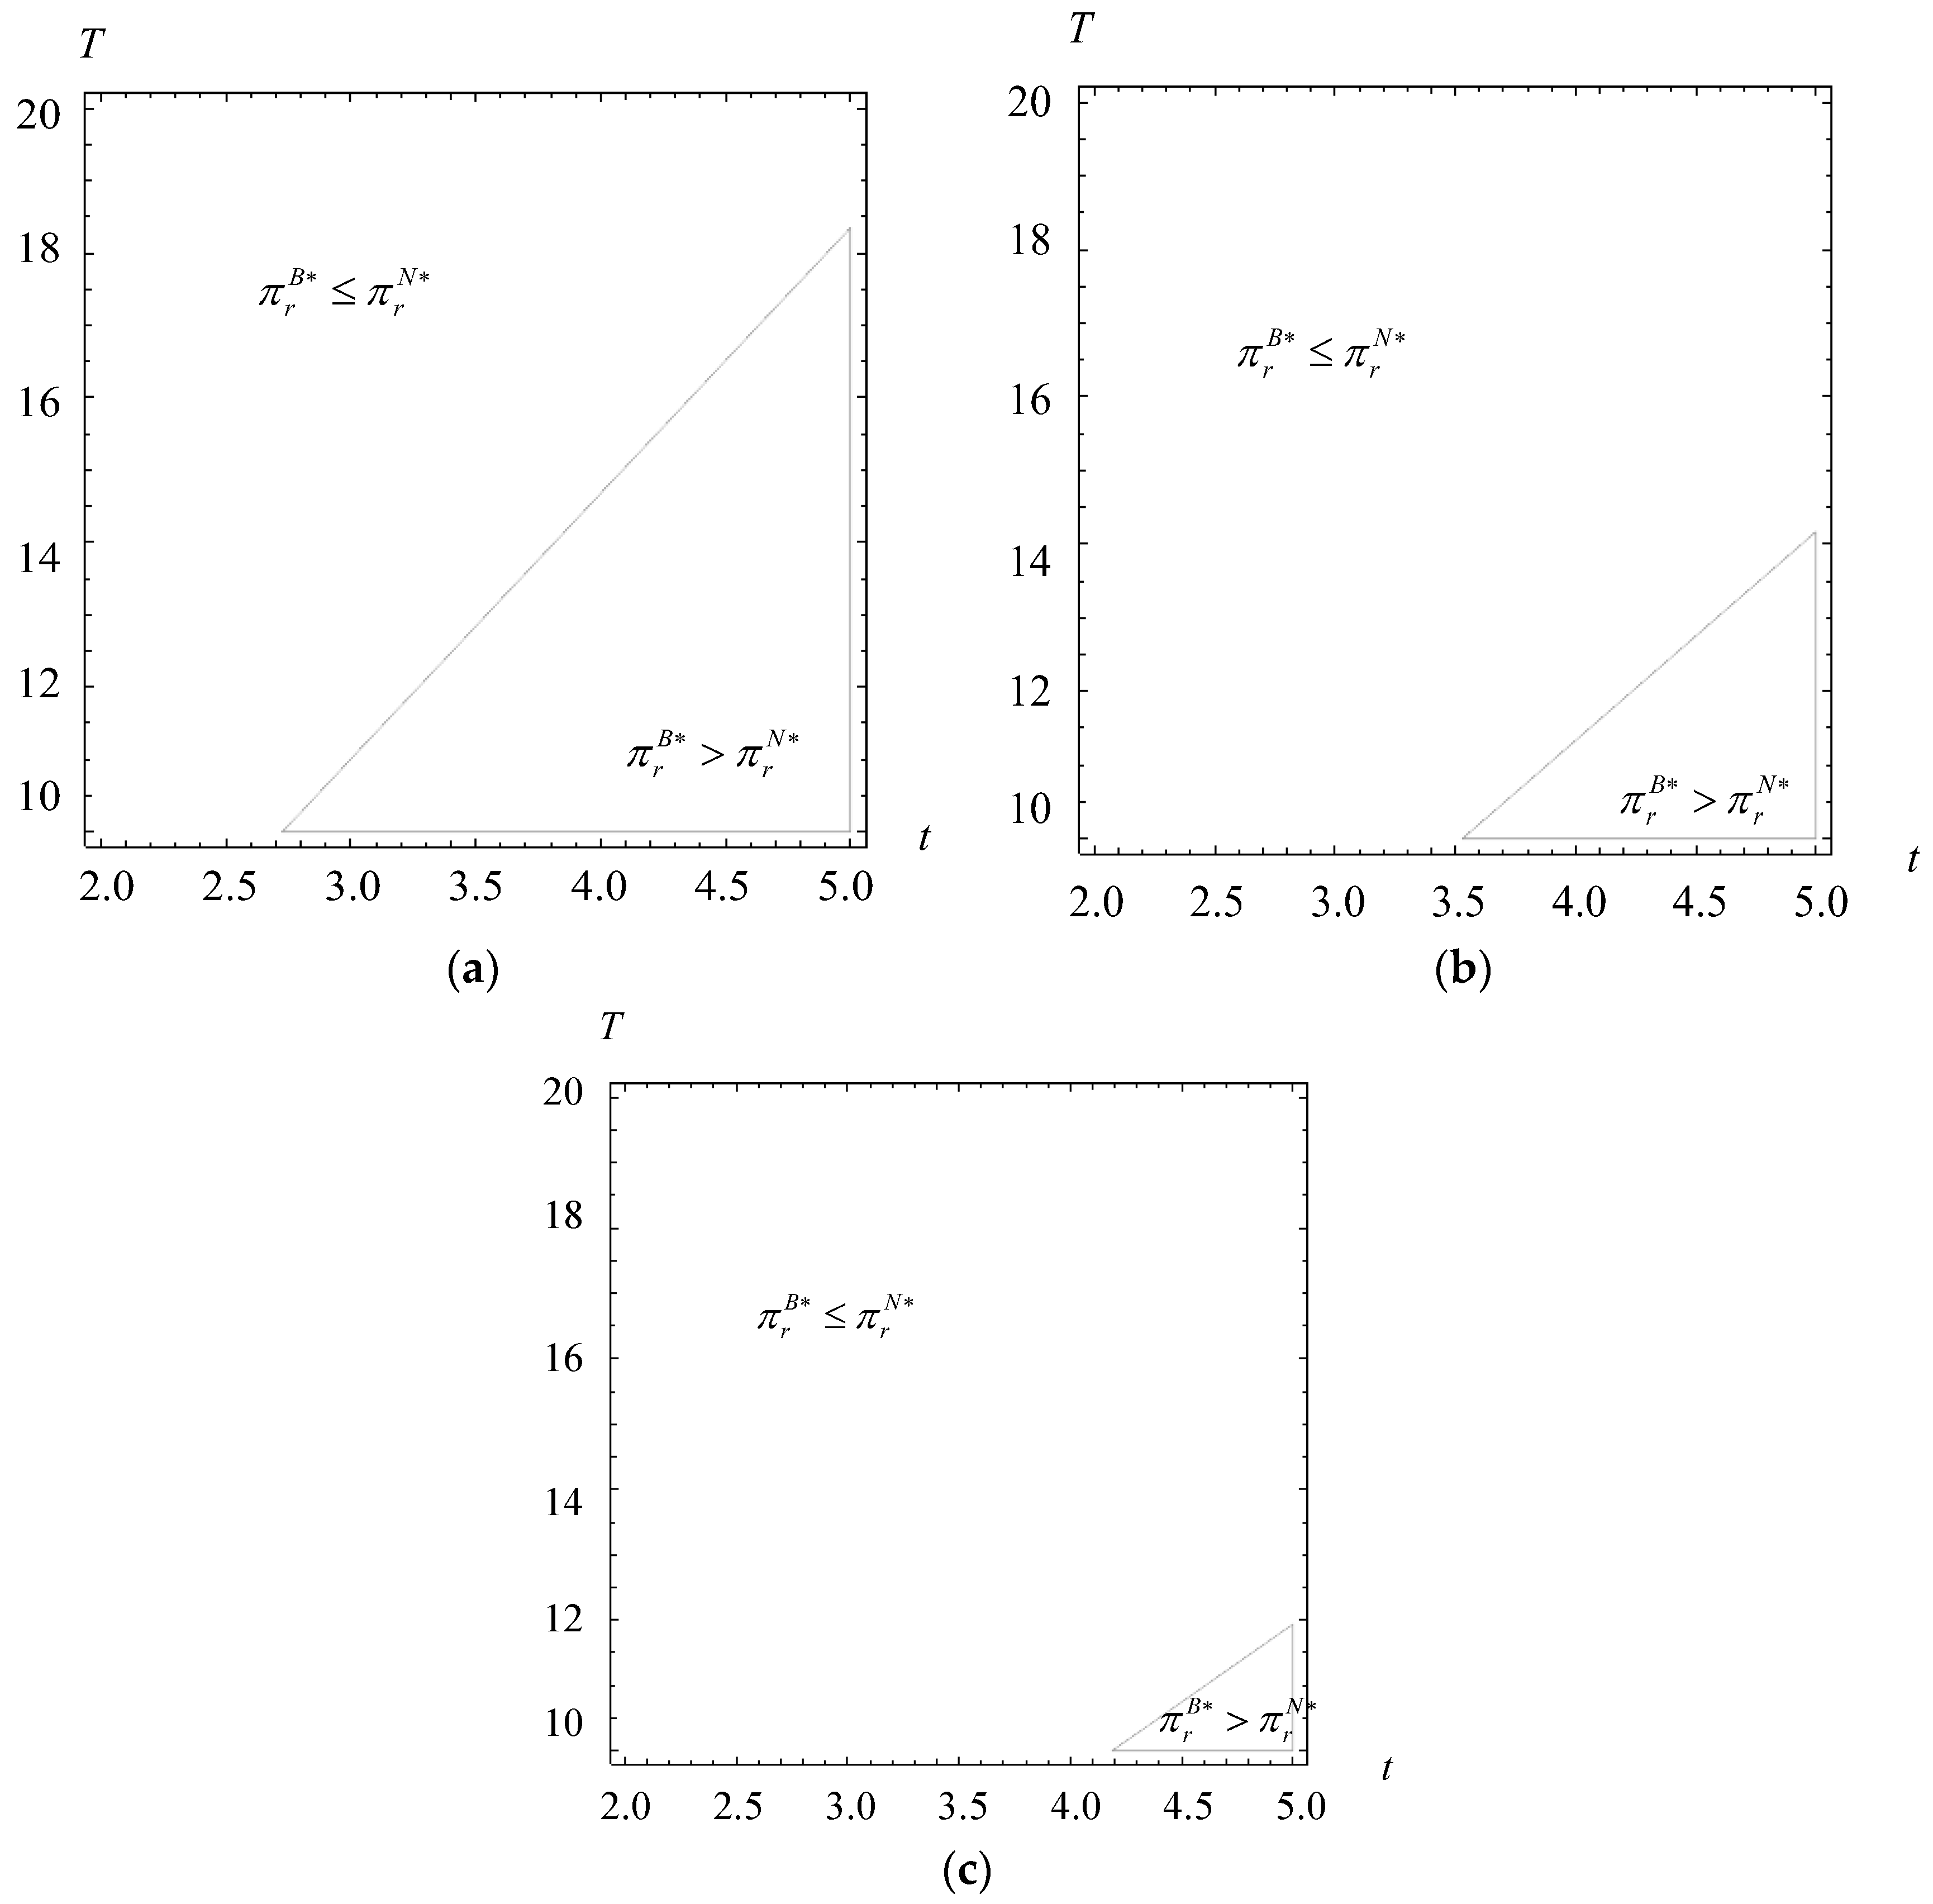
Propositions 1–3 discuss the impact of parameters f , F , and k on the motivation, and next, we conduct several numerical studies to complement the aforementioned analysis to illustrate how other parameters affect the motivation. In each numerical study, several parameters are held constant, while the value of another parameter is changed to determine its impact on prices and profits. The default values are as follows: T = 10 , t = 5 , δ = 0.6 , α = 5 , γ = 0.8 , c = 0.4 , f = 0.05 , s = 0.01 , F = 0.2 , k = 0.3 , β = 0.6 . These values ensure all assumptions are satisfied in the experiment. Figure 2, Figure 3, Figure 4, Figure 5, Figure 6, Figure 7 and Figure 8 illustrate the impacts of T , t , β , γ on the firm’s profits.
Intuitively, we have Q N > Q B = D B > D N , i.e., the waste of fresh food caused by misreporting is serious, and the lower the circulation time (i.e., T ), the larger the difference between Q N and D N is, which verifies Corollary 2.
From Figure 3 and Figure 4, we find when the circulation time for fresh food is high (e.g., T > 16 ), the supplier prefers BT technology (i.e., π s B > π s N ); otherwise, it does not prefer BT technology (i.e., π s B π s N ). However, the preference of the retailer is opposite to the supplier (i.e., if T 13 , π r B > π r N ; otherwise, π r B π r N ). There are obvious differences in the sensitivity of the circulation time for fresh food, and the supplier is more sensitive to BT technology than the retailer (i.e., π s B / T > π s N / T and π r B / T < π r N / T ). Although the supplier and retailer have different sensitivities and preferences for the circulation time of fresh food, for some foods whose circulation time is neither long nor short (e.g., 13 < T 16 ), it may not be necessary for the supplier to misreport and for the retailer to invest in BT technology. Therefore, suppliers and retailers can reach a consensus preference and choose not to invest in BT technology.
Figure 5 and Figure 6 verify the results in Figure 3 and Figure 4, that is, only when T is high, the supplier prefers BT technology, and the preference of the retailer is opposite to the supplier. The impact of the lead time for fresh food from the farm to consumers (i.e., t ) on the supplier’s and retailer’s profits is opposite to the impact of the circulation time for fresh food (i.e., T ). Further, with the increase in the sensitivity coefficient of retailer price for food in demand (i.e., β ), the BT technology investment is more significant to the supplier and discourages the retailer. For high-price-sensitive food, such as kiwi fruit of Zespri, cherry from Chile, etc., it is valuable to invest in BT technology, and its effect is gradually significant with higher price sensitivity.
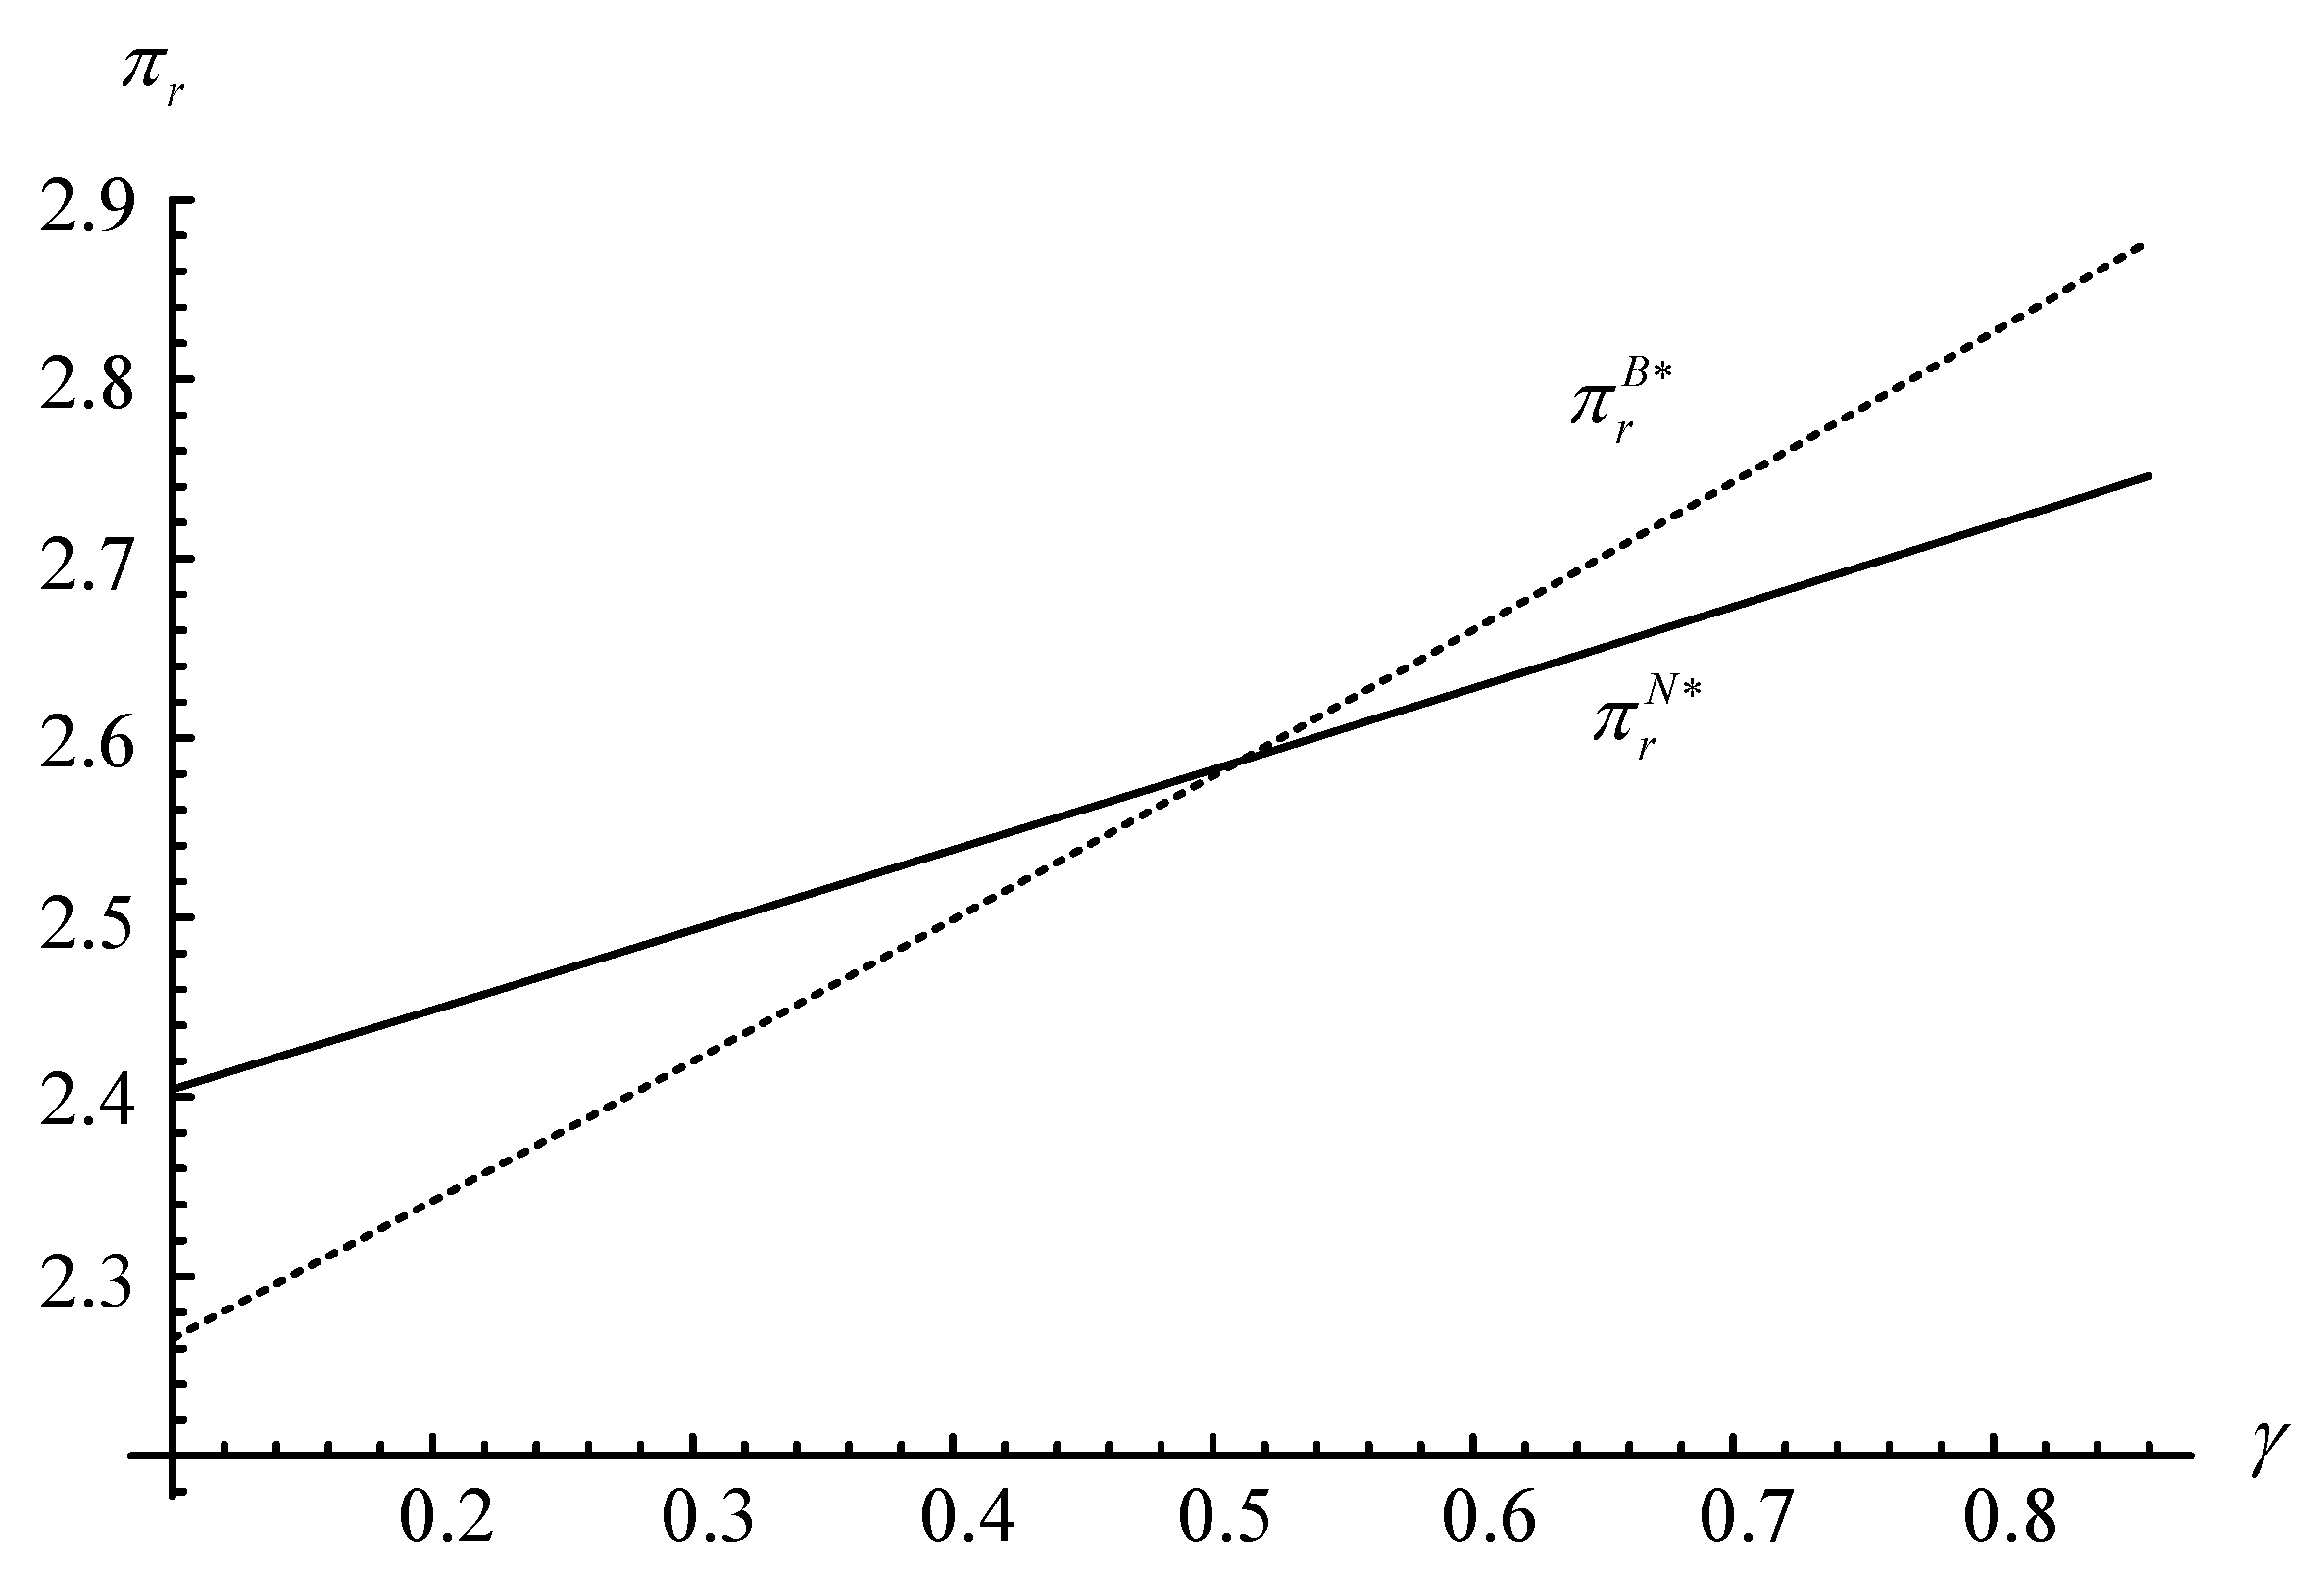
From Figure 7 and Figure 8, we find some results: (1) when the sensitivity coefficient of freshness of food in demand is high (e.g., γ > 0.32 ), the supplier does not prefer BT technology (i.e., π s B < π s N ); otherwise, the supplier prefers BT technology (i.e., π s B π s N ), while the preference of the retailer is opposite to the preference of the supplier (i.e., if γ > 0.5 , π r B > π r N ; otherwise, π r B π r N ). Although their preferences are not consistent, they still can reach an agreement to prefer not to adopt the BT technology scenario within a certain range (e.g., 0.32 < γ < 0.5 ). (2) There is also a significant difference in the sensitivity coefficient of freshness of food after introducing BT technology; the supplier decreases with γ , while the retailer becomes more sensitive (i.e., π s B / γ < π s N / γ and π r B / γ > π r N / γ ). In the presence of the high sensitivity of freshness of food, such as green leafy vegetables and seasonal fruits (strawberries, watermelon, peach, etc.), it is more valuable for retailers to invest in BT technology.

5. Alternative Models

This section considers an alternative model: an FFSC with the cold-chain preservation technology scenario based on BT technology invested by the retailer. As CP technology can increase the freshness of food, we modify Assumptions 6 and 7 as follows.
Assumption 6.
The freshness of food decreases with the lead time and increases with the CP investment level.
The freshness of food decreases with the lead time t and 0 t T , where T represents the circulation time of fresh food [20]. With the CP investment (CP investment level incurs a quadratic fixed cost as C λ = η λ 2 / 2 , where η represents the sensitivity coefficient of the CP investment level) gradually increased, the freshness of food also increases [15,25,36], i.e., CP technology can increase the freshness of food. We assume the freshness function of food is k ( t , λ ) = 1 t 2 / T 2 + θ λ with CP technology, where θ represents the sensitivity coefficient of CP investment level of the freshness of food [5,34,35,37].
Assumption 7.
There exists waste fresh food due to supply–demand uncertainty, and the demand function is as follows.
D ( p , t , λ ) = α β p + γ k ( t , λ )
where α represents the market size, β represents the sensitivity coefficient of retailer price for food, and γ represents the sensitivity coefficient of freshness of food [15,22].
Other assumptions are consistent with the basic model.
Given the above updated assumptions, the supplier’s and the retailer’s profits in the scenario with CP technology (denote as C) are:
π s C = ( w c + f ) · D η λ 2 / 2
π r C = ( p w ) · D F
Under Scenario C, the sequence of decisions in the game is:
(1) 
The retailer selects BT technology;
(2) 
Observing it, the supplier announces the warehouse price w without misreporting behavior and decides the CP investment level λ ;
(3) 
Observing the warehouse price w and the CP investment level λ , the retailer decides the sales price p .
Using backwards induction, firms can obtain the equilibrium decisions in Lemma 3 as follows.
Lemma 3.
Assuming c < c ^ 3 , F < M 2 2 β η 2 N 1 2 T 4 , and θ < 2 β η / γ . The equilibrium analysis decisions are w C = 2 M 2 η N 1 T 2 + c f , λ C = γ M 2 θ N 1 T 2 , and p C = 3 M 2 η N 1 T 2 + c f . Furthermore, we can obtain Q C = D C = M 2 β η N 1 T 2 , π s C = M 2 2 η 2 N 1 T 4 , and π r C = M 2 2 β η 2 N 1 2 T 4 F , where N 1 = 4 β η γ 2 θ 2 .
Proof of Lemma 3.
From β > 0 , the second-order condition of π r C over p is derived as 2 π r C / p 2 = 2 β < 0 , which ensures the existence and uniqueness of the optimal decisions. Solving the conditions of π r C / p = 0 for p , we have p ( w , λ ) . Then, inserting p ( w , λ ) into π s C , the Hessian matrix of π s C over ( w , λ ) is derived as follows:
H = β η η γ θ / 2
From β > 0 and θ < 2 β η / γ , we have H 1 = β < 0 and H 2 = β η γ 2 θ 2 / 4 > 0 , which is jointly concave on ( w , λ ) . Solving the conditions of π r C ( w , λ ) / w = 0 and π r C ( w , λ ) / λ = 0 for ( w , λ ) , we have w C and λ C . Further, inserting w C and λ C into p ( w , λ ) , we can obtain p C . Further, inserting w C , λ C , and p C into Q , D , π s C , and π r C , we can obtain Q C , D C , π s C , and π r C . From c < c ^ 3 , F < M 2 2 β η 2 / ( N 1 2 T 4 ) , and θ < 2 β η / γ , we have p C > w C > c , Q C = D C > 0 , π r C > 0 , and π s C > 0 . □
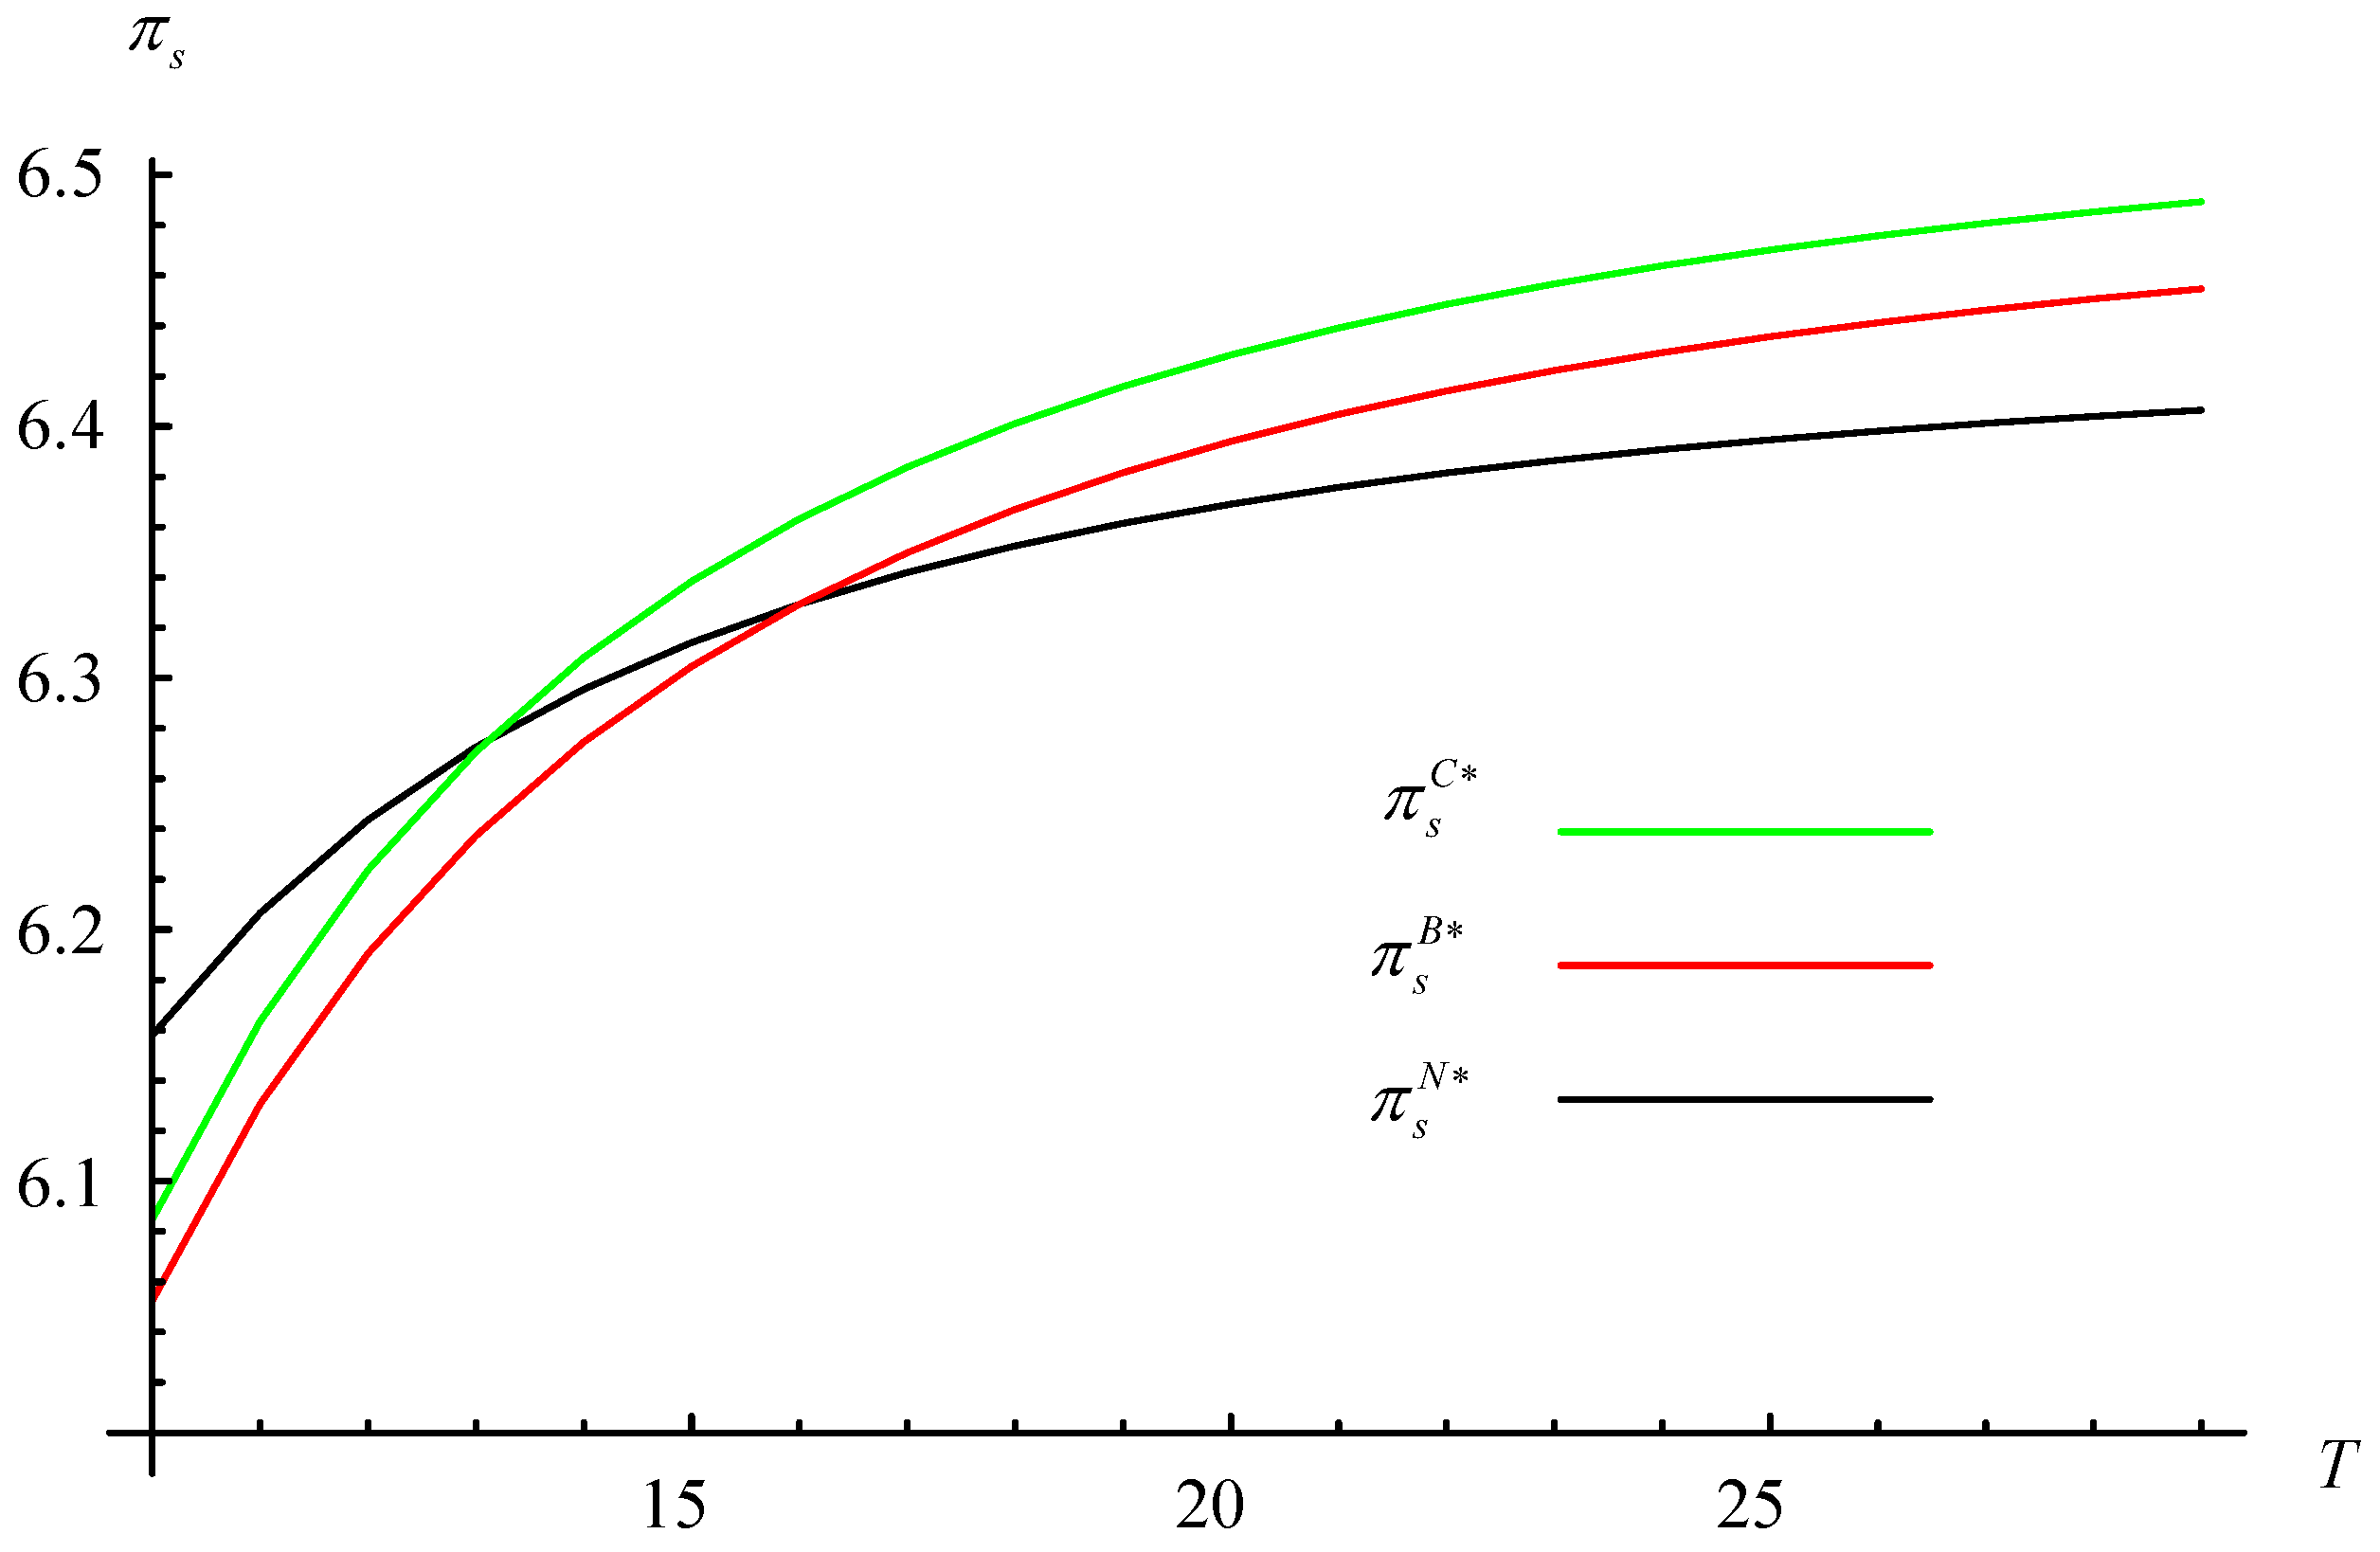
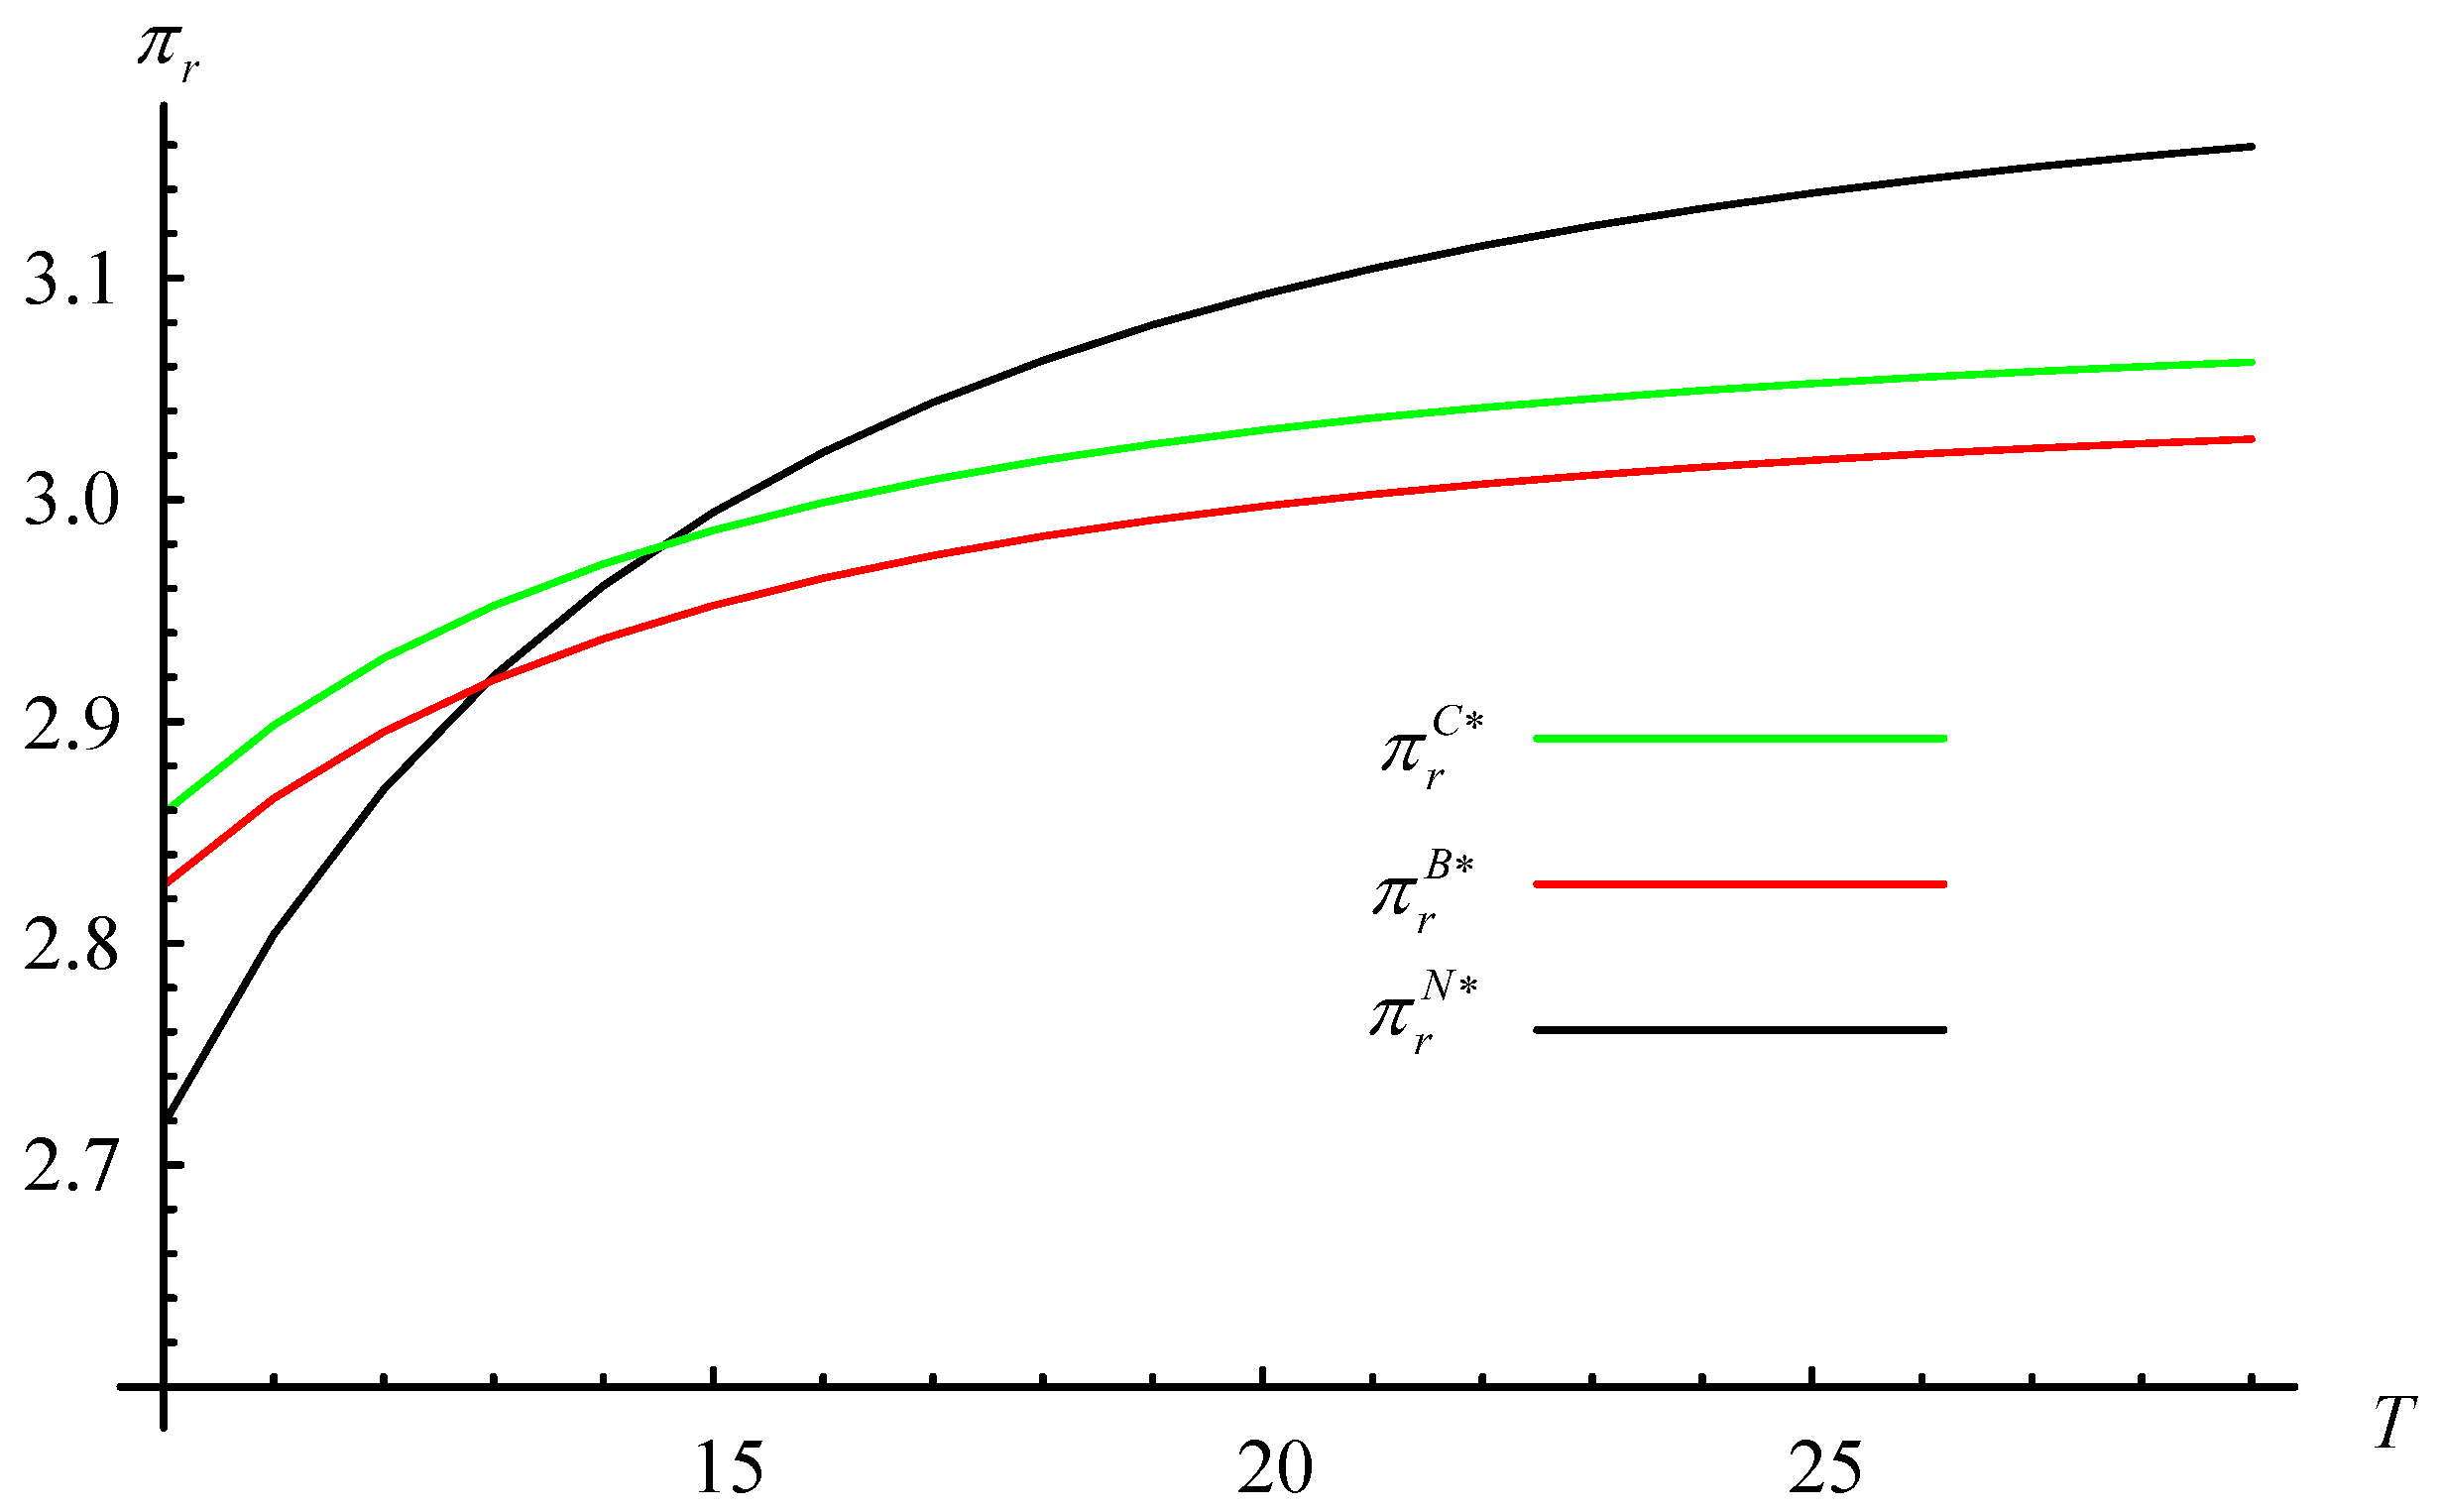
The default values are θ = 0.8 , η = 2 , and other default values are consistent with the basic model. Figure 9 and Figure 10 illustrate the impacts of T , t , β , γ on the firm’s profits.
Figure 9 and Figure 10 show that Scenario C is obviously dominant compared with Scenario B (i.e., π s B C > π s B and π r B C > π r B ). However, compared to the scenario of investing in no technology (i.e., Scenario N), BT or CP technology depends on the influence of key factors. For example, when T is low, the supplier does not prefer any investment scenario, while the retailer prefers the investment scenario when T is large. The longer the circulation time for fresh food, especially those requiring long-distance transportation such as potatoes, onions, garlic, etc., the more valuable it is for the supplier to invest in CP technology. Furthermore, the effect of superimposing with BT technology is more significant.

6. Discussion and Conclusions

Owing to the acute conflict between food shortage and food loss and waste, and with the increasing awareness of consumers in noticing suppliers’ misreporting behavior, many suppliers or retailers are willing to invest in emerging technologies such as cold-chain preservation and blockchain traceability technologies and apply these technologies in storage, transportation, and other processes to reduce the quantity and quality loss of fresh food. With this in mind, this paper develops game theoretic models to identify the conditions under which technology is the optimal selection for the supplier/retailer in the FFSC context.

6.1. Managerial Insights

The results have practical implications for retailers who are debating whether they should invest in BT technology to restrain suppliers’ misreporting behavior. The results reveal that the circulation time and lead time of fresh food, the fixed cost of investing in BT technology, and the misreporting behavior can determine the prices and the order quantities/demand. In particular, this paper obtains the following managerial insights:
  • The higher the degree of misreporting behavior is, the more fresh food is wasted, thereby introducing blockchain traceability technology can be more effective;
  • With the foci to eliminate suppliers’ misreporting behavior and minimize the incentive fees, blockchain BT investment can increase prices, promote order quantities and demand, and promote the freshness level with a joint effect of CT investment;
  • Only when the consumers demonstrate “appropriate” sensitivity to freshness, a win–win situation can be achieved between suppliers and retailers;
  • The misreporting behavior has a great impact on the loss and waste of fresh food as it leads to excessive orders, especially for some foods with high freshness sensitivity, such as some seasonal fruits and vegetables;
  • When both BT and CP technologies are available, the suppliers are not keen to invest in any technologies when the circulation time for fresh food is short, while the retailer prefers to invest when the circulation time is long.
These findings are significant for environmental sustainability and food conservation. For example, suppliers/retailers may obtain economic benefits from blockchain traceability technology or cold-chain preservation as the technology restrains suppliers’ misreporting behavior or improves the freshness of food. As a result, more suppliers would be encouraged to avoid displaying misrepresentations of freshness, and less food will be wasted.

6.2. Limitations and Directions for Further Research

Several directions could be taken in future research. First, one may consider the scenario of cold-chain preservation without blockchain technology and compare the four scenarios accordingly. Second, we touched on BT investment as a fixed cost, but we did not consider the cost based on levels of blockchain traceability, which could be explored in the future. Other directions include consideration of carbon emission policies to facilitate the investigation of sustainability affects FFSC operations. Finally, additional insights might be gathered if analyzing BT/CP adoption by modeling it as an evolutionary game in the FFSC.

Author Contributions

Formal analysis, Z.F.; Funding acquisition, G.L.; Methodology, Z.F.; Project administration, G.L.; Visualization, P.J.; Writing—original draft, Z.F. All authors have read and agreed to the published version of the manuscript.

Funding

This research was funded by the National Natural Science Foundation of China, grant numbers 72202110 and 72172069.

Institutional Review Board Statement

Not applicable.

Informed Consent Statement

Not applicable.

Data Availability Statement

Data are contained within the article.

Acknowledgments

The authors would like to thank the editors and anonymous reviewers for their thoughtful and constructive comments.

Conflicts of Interest

The authors declare no conflict of interest.

References

  1. The World Food Program. Global Report on Food Crises. Available online: https://docs.wfp.org/api/documents/WFP-0000114546/download/?_ga=2.244462725.1817522913.1601099339-266302079.15927929%2019 (accessed on 27 March 2023).
  2. Luo, N.; Olsen, T.; Liu, Y.; Zhang, A. Reducing food loss and waste in supply chain operations. Transp. Res. Part E Logist. Transp. Rev. 2022, 162, 102730. [Google Scholar] [CrossRef]
  3. United Nations Environment Programme (UNEP). UNEP Food Waste Index Report 2021. Available online: https://www.unep.org/resources/report/unep-food-waste-index-report-2021 (accessed on 27 March 2023).
  4. Yang, S.; Xiao, Y.; Kuo, Y.-H. The supply chain design for perishable food with stochastic demand. Sustainability 2017, 9, 1195. [Google Scholar] [CrossRef] [Green Version]
  5. Zhang, X.; Li, Z.; Li, G. Impacts of blockchain-based digital transition on cold supply chains with a third-party logistics service provider. Transp. Res. Part E Logist. Transp. Rev. 2023, 170, 103014. [Google Scholar] [CrossRef]
  6. Yan, B.; Wang, T.; Liu, Y.-P.; Liu, Y. Decision analysis of retailer-dominated dual-channel supply chain considering cost misreporting. Int. J. Prod. Econ. 2016, 178, 34–41. [Google Scholar] [CrossRef]
  7. Chen, H.; Jia, X.; Jiang, M. Research on deision-making of fresh agricultural supply chain with blockchain under behavior of misreporting. Comput. Eng. Apps. 2019, 55, 265–270. (In Chinese) [Google Scholar]
  8. Xu, Y.; Wang, J.; Cao, K. Interaction between joining platform blockchain technology and channel encroachment for fresh agricultural product firms. Int. Trans. Oper. Res. 2023. [Google Scholar] [CrossRef]
  9. Kyzy, I.E.; Song, H.; Vajdi, A.; Wang, Y.; Zhou, J. Blockchain for consortium: A practical paradigm in agricultural supply chain system. Expert Syst. Appl. 2021, 184, 115425. [Google Scholar] [CrossRef]
  10. Liu, X.; Barenji, A.V.; Li, Z.; Montreuil, B.; Huang, G.Q. Blockchain-based smart tracking and tracing platform for drug supply chain. Comput. Ind. Eng. 2021, 507, 120235. [Google Scholar] [CrossRef]
  11. Cui, L.; Xiao, Z.; Wang, J.; Chen, F.; Pan, Y.; Dai, H.; Qin, J. Improving vaccine safety using blockchain. ACM Trans. Internet Technol. 2021, 21, 38. [Google Scholar] [CrossRef]
  12. Chen, H.; Yin, L. Research on the coordination of fresh food supply chain based on the perspective of blockchain and low carbon. Discret. Dyn. Nat. Soc. 2023, 2023, 6156039. [Google Scholar] [CrossRef]
  13. Friedman, N.; Ormiston, J. Blockchain as a sustainability-oriented innovation? Opportunities for and resistance to blockchain technology as a driver of sustainability in global food supply chains. Technol. Forecast. Soc. Chang. 2022, 175, 121403. [Google Scholar] [CrossRef]
  14. Menon, S.; Jain, K. Blockchain technology for transparency in agri-food supply chain: Use cases, limitations, and future directions. IEEE Trans. Eng. Manag. 2021. [Google Scholar] [CrossRef]
  15. Yu, Y.; Xiao, T.; Feng, Z. Price and cold-chain service decisions versus integration in a fresh agri-product supply chain with competing retailers. Ann. Oper. Res. 2020, 287, 465–493. [Google Scholar] [CrossRef]
  16. Çakanyıldırım, M.; Feng, Q.; Gan, X.; Sethi, S.P. Contracting and coordination under asymmetric production cost information. Prod. Oper. Manag. 2012, 2, 345–360. [Google Scholar] [CrossRef]
  17. Feng, Y.; Liu, Z. Analysis of cost misreporting in a fresh agri-products supply chain with TPL’s participation. Soft Sci. 2017, 31, 133–137. (In Chinese) [Google Scholar]
  18. Cant, J. Study: Blockchain Can Reduce Food Fraud by 31 Billion within 5 Years. Available online: https://cointelegraph.com/news/study-blockchain-can-reduce-food-fraud-by-31-billion-within-5-years (accessed on 27 March 2023).
  19. Behnke, K.; Janssen, M. Boundary conditions for traceability in food supply chains using blockchain technology. Int. J. Inf. Manag. 2020, 52, 101969. [Google Scholar] [CrossRef]
  20. Wang, X.; Li, D. A dynamic product quality evaluation based pricing model for perishable food supply chains. Omega-Int. J. Manag. Sci. 2012, 40, 906–917. [Google Scholar] [CrossRef]
  21. Zheng, Q.; Ieromonachou, P.; Fan, T.; Zhou, L. Supply chain contracting coordination for fresh products with fresh-keeping effort. Ind. Manag. Data Syst. 2017, 117, 538–559. [Google Scholar] [CrossRef]
  22. Qin, Y.; Wang, J.; Wei, C. Joint pricing and inventory control for fresh produce and foods with quality and physical quantity deteriorating simultaneously. Int. J. Prod. Econ. 2014, 152, 42–48. [Google Scholar] [CrossRef]
  23. Li, G.; He, X.; Zhou, J.; Wu, H. Pricing, replenishment and preservation technology investment decisions for non-instantaneous deteriorating items. Omega 2019, 84, 114–126. [Google Scholar] [CrossRef]
  24. Qian, X.; Olsen, T. Operational and financial decisions within proportional investment cooperatives. Manuf. Serv. Oper. Manag. 2020, 22, 546–561. [Google Scholar] [CrossRef]
  25. Besik, D.; Nagurney, A.; Dutta, P. An integrated multitiered supply chain network model of competing agricultural firms and processing firms: The case of fresh produce and quality. Eur. J. Oper. Res. 2023, 307, 364–381. [Google Scholar] [CrossRef]
  26. KÖhler, S.; Pizzol, M. Technology assessment of blockchain-based technologies in the food supply chain. J. Clean Prod. 2020, 269, 122193. [Google Scholar] [CrossRef]
  27. Liu, S.; Hua, G.; Kang, Y.; Cheng, T.E.; Xu, Y. What value does blockchain bring to the imported fresh food supply chain? Transp. Res. Part E Logist. Transp. Rev. 2022, 165, 102859. [Google Scholar] [CrossRef]
  28. Bettín-Díaz, R.; Rojas, A.E.; Mejía-Moncayo, C. Methodological approach to the definition of a blockchain system for the food industry supply chain traceability. In Computational Science and Its Applications—ICCSA 2018; Springer: Cham, Switzerland, 2018; pp. 19–33. [Google Scholar]
  29. Baralla, G.; Ibba, S.; Marchesi, M.; Tonelli, R.; Missineo, S. A Blockchain based system to ensure transparency and reliability in food supply chain. In Euro-Par 2018: Parallel Processing Workshops; Springer: Cham, Switzerland, 2018; pp. 379–391. [Google Scholar]
  30. Dutta, P.; Choi, T.-M.; Somani, S.; Butala, R. Blockchain technology in supply chain operations: Applications, challenges and research opportunities. Transp. Res. Part E Logist. Transp. Rev. 2020, 142, 102067. [Google Scholar] [CrossRef]
  31. Dong, L.; Jiang, P.; Xu, F. Impact of traceability technology adoption in food supply chain networks. Manag. Sci. 2023, 69, 1323–1934. [Google Scholar] [CrossRef]
  32. Wu, X.; Nie, L.; Xu, M.; Yan, F. A perishable food supply chain problem considering demand uncertainty and time deadline constraints: Modeling and application to a high-speed railway catering service. Transp. Res. Part E Logist. Transp. Rev. 2018, 111, 186–209. [Google Scholar] [CrossRef]
  33. Liu, L.; Li, F. Investment decision and coordination of blockchain technology in fresh supply chain considering retailers’ risk aversion. J. Ind. Eng. Eng. Manag. 2022, 36, 159–171. (In Chinese) [Google Scholar]
  34. Wang, Y. Joint pricing-production decisions in supply chains of complementary products with uncertain demand. Oper. Res. 2006, 54, 1110–1127. [Google Scholar] [CrossRef]
  35. Lodree, E.J., Jr.; Uzochukwu, B.M. Production planning for a deteriorating item with stochastic demand and consumer choice. Int. J. Prod. Econ. 2008, 116, 219–232. [Google Scholar] [CrossRef]
  36. Yang, X.; Cai, G.; Ingene, C.A.; Zhang, J. Manufacturer strategy on service provision in competitive channels. Prod. Oper. Manag. 2020, 29, 72–89. [Google Scholar] [CrossRef]
  37. Yang, L.; Tang, R. Comparisons of sales modes for a fresh product supply chain with freshness-keeping effort. Transp. Res. Part E Logist. Transp. Rev. 2019, 125, 425–448. [Google Scholar] [CrossRef]
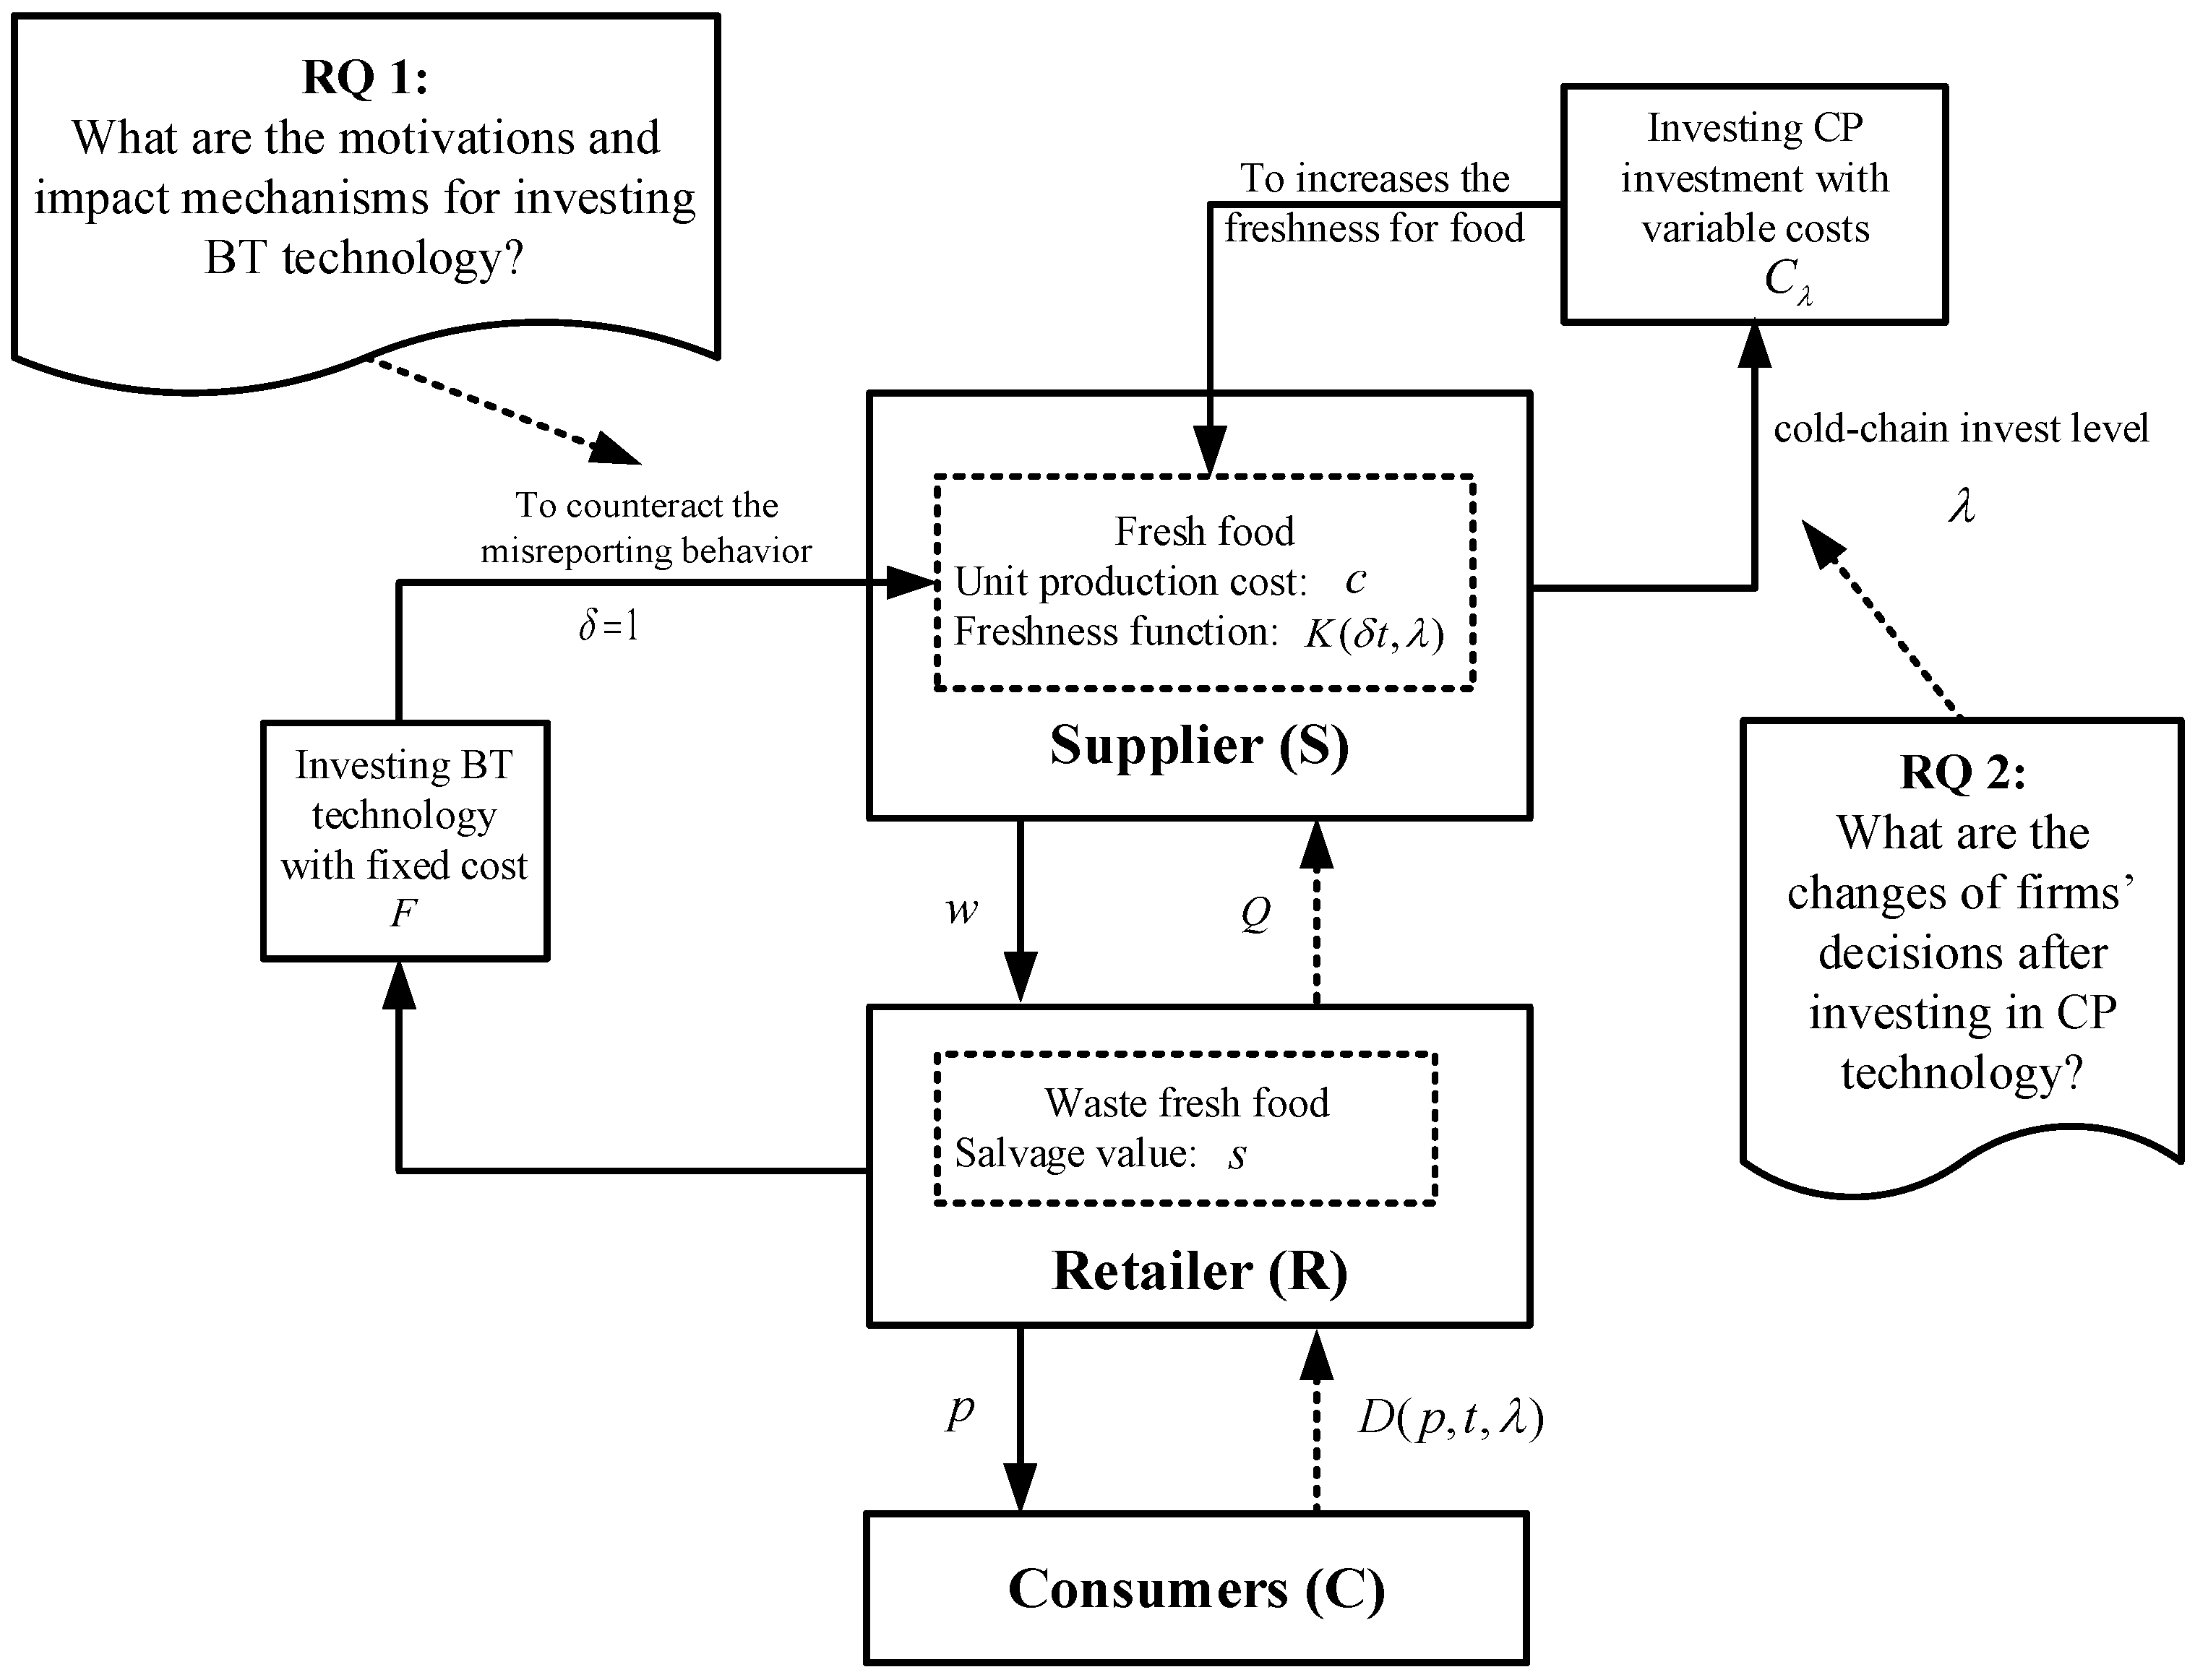
Figure 1. The framework in the FFSC with BT/CP technology.
Sustainability 15 07421 g001
Figure 2. The order quantities for fresh food vs. T .
Sustainability 15 07421 g002
Figure 3. The supplier’s profit vs. T .
Sustainability 15 07421 g003
Figure 4. The retailer’s profit vs. T .
Sustainability 15 07421 g004
Figure 5. The supplier’s profit vs. T , t , β . (a) β = 0.3 ; (b) β = 0.5 ; (c) β = 0.7 .
Sustainability 15 07421 g005aSustainability 15 07421 g005b
Figure 6. The retailer’s profit vs. T , t , β . (a) β = 0.3 ; (b) β = 0.5 ; (c) β = 0.7 .
Sustainability 15 07421 g006
Figure 7. The supplier’s profit vs. γ .
Sustainability 15 07421 g007
Figure 8. The retailer’s profit vs. γ .
Sustainability 15 07421 g008
Figure 9. The supplier’s profit vs. T in three scenarios.
Sustainability 15 07421 g009
Figure 10. The retailer’s profit vs. T in three scenarios.
Sustainability 15 07421 g010
Table 1. Comparison between this paper and relevant literature.
ArticleResearch
Object
Research MethodBT
Technology
CP TechnologyMain Content
Wang and Li [20]A perishable food supply chainDynamic quality evaluationNot consideredNot consideredReduce food waste and maximize profit through a pricing approach
Yu et al. [15]A fresh agri-product supply chainStackelberg game and numerical examplesNot consideredConsideredStudy the price and cold-chain service decisions and explores the impacts of (horizontal/vertical) integration on profits
Chen et al. [7]A fresh agricultural supply chainStackelberg game and numerical examplesConsideredNot consideredStudy the influence of the application of blockchain technology on
the producer’s activity information misreporting behavior
Zhang et al. [5]A cold supply chainGame and numerical analysisConsideredConsideredImpacts of blockchain-based digital transition on cold invests
Wu et al. [32]A perishable food supply chainOptimizationNot consideredConsideredStudy demand uncertainty and time deadline constraints
Liu and Li [33]A fresh supply chainAsymmetric Nash equilibrium negotiationConsideredNot consideredInvestment decision and coordination of blockchain technology considering retailers’ risk aversion
Liu et al. [27]A fresh food supply chainStackelberg gameConsideredNot consideredStudy the role blockchain plays in imported fresh food supply chains
This paperFresh food supply chainStackelberg gameConsideredConsideredInvestigating the influence of BT/CP adoption on misreporting behavior
Table 2. All parameters and variables used in this research.
SymbolDefinition
Model parameters
T The circulation time for fresh food
t The lead time for fresh food from farm to consumers, 0 < t T
c The unit production cost for fresh food
s The salvage value for waste fresh food, 0 < s < c
α The market size
β The sensitivity coefficient of retailer price for food in demand
γ The sensitivity coefficient of freshness of food in demand
δ The factor for lead time due to misreporting behavior, 0 < δ < 1
f The incentive fee paid to supplier without misreporting behavior
F The fixed cost of investing in BT technology
k The proportion of fresh food with misreporting behavior, 0 < k < 1
Functions
K ( t ) The freshness function for food, K ( t ) = 1 t 2 / T 2
D The demand for fresh food from consumers to retailer
Q The order quantities for fresh food from retailer to supplier
Decision variables
w The warehouse price of fresh food
p The retailer price of fresh food
Extensions
η The sensitivity coefficient of CP investment level
λ The CP investment level
C λ The CP technology investment
θ The sensitivity coefficient of CP investment level of the freshness of food
Disclaimer/Publisher’s Note: The statements, opinions and data contained in all publications are solely those of the individual author(s) and contributor(s) and not of MDPI and/or the editor(s). MDPI and/or the editor(s) disclaim responsibility for any injury to people or property resulting from any ideas, methods, instructions or products referred to in the content.