Article

Trifolium pratense and the Heavy Metal Content in Various Urban Areas

1
Department of Ecology and Environmental Protection, Faculty of Environmental and Mechanical Engineering, Poznań University of Life Sciences, Piątkowska 94C, 60-649 Poznań, Poland
2
Department of Trace Analysis, Faculty of Chemistry, Adam Mickiewicz University, Uniwersytetu Poznańskiego 8, 61-614 Poznań, Poland
*
Author to whom correspondence should be addressed.
Sustainability 2023, 15(9), 7325; https://doi.org/10.3390/su15097325
Submission received: 15 March 2023 / Revised: 25 April 2023 / Accepted: 26 April 2023 / Published: 28 April 2023
(This article belongs to the Section Environmental Sustainability and Applications)

Abstract

:
Effective biomonitoring strategies are essential for identifying and assessing the sources and levels of contamination of heavy metal pollutants in urban areas, given their negative impacts on human health and the environment. This study aimed to assess the potential of common weed, Trifolium pratense as a bioindicator of heavy metal contamination in various land uses in urban areas, with a focus on Cd, Cu, Cr, Ni, and Pb. The results have shown that Cr and Ni had high bioconcentration factor (BCF) values in most sites, in comparison with Cu, Cd and Pb. Contamination factor (CF) values varied across all sites. The industrial area and old town sites had the highest translocation factor (TF) values for Cr and Ni, indicating greater transport of these metals from roots to aerial parts of plants. Differences between heavy metals (HMs) according to land use were observed; especially, Pb and Cu were more concentrated in soils than other heavy metals in industrial areas. Overall, these findings suggest that Trifolium pratense is a promising bioindicator for heavy metal contamination in various land uses in urban areas, making it a potentially valuable tool for monitoring heavy metal pollution in cities of the northern hemisphere.

1. Introduction

Urban environments are recognized as significant sources of hazardous and noxious pollutants that can contaminate the air, water, and soil [1]. Atmospheric pollution is considered one of the most pressing environmental problems affecting urban regions [2]. Human activities, such as industrial, municipal, and commercial operations, generate a diverse range of toxic pollutants that can negatively impact the health and well-being of living organisms [3,4].
Among the pollutants emitted through various human activities, industries, heating, and transportation in urban environments, heavy metals are a significant source of concern and a major pollutant [1,5]. Conventionally defined as elements with an atomic density greater than 5 g cm−3 and atomic numbers >20 [6], heavy metals are known for their ability to bioaccumulate, inherent toxicity, and long-lasting presence in various environments, making them commonly referred to as environmental pollutants [7]. Once heavy metals persist in the environment, their removal is challenging [8]. Unfortunately, due to the increasing number of pollution sources, low air quality, and inappropriate urban planning, human exposure to heavy metals has risen dramatically, especially in urban and industrial areas [9]. In the environment, accumulated heavy metals can be transferred to humans by contaminated water, inhaling polluted air, and consuming plants grown in contaminated soil [10]. So, the problem of heavy metals is widespread [11]. For humans, heavy metal exposure is a significant contributor to various health problems, including developmental retardation, immune system dysfunction, several types of cancer, endocrine disruption, neurological effects, kidney damage, and other disorders [8]. Furthermore, the concentration of heavy metals in plants can have negative impacts on plant growth, yield, and the environment [12]. For example, chromium (Cr) is a known carcinogenic metal that can accumulate in plant tissues, resulting in decreased growth and yield [13,14]. Cadmium (Cd) is a toxic heavy metal that can cause leaf chlorosis, stunted growth, and reduced root length [15]. Copper (Cu) is an essential micronutrient for plant growth but can be toxic at high concentrations, causing oxidative stress and decreased photosynthesis [16]. Nickel (Ni) is a heavy metal that can accumulate in plant tissues, causing oxidative damage and reduced growth [17]. Zinc (Zn) is an essential micronutrient that is toxic at high concentrations, causing chlorosis and reduced growth [12]. Lead (Pb) is a toxic heavy metal that can cause decreased photosynthesis and chlorosis, as well as neurological and developmental effects in humans and animals [18,19]. Therefore, their concentrations must be monitored and analyzed to assess and mitigate environmental heavy metal pollution [7]. Consequently, over the years, a large number of studies have analyzed the accumulation of heavy metals in different components, such as soils [20,21], water [20,22], sediments [22], and the tissues of living organisms [23]. Additionally, a good deal of research over the years has shown that a suitable choice to indicate the accumulation of heavy metals in different environments was to use plants, known as bioindicators [24,25].
In order to monitor the state of the environment, bioindicators are an adequate tool [26]. Bioindicators include species, communities, and biological processes used to assess the environment’s quality. Due to their moderate tolerance to environmental variability, bioindicators effectively indicate the environment’s condition [24,27]. Furthermore, an effective bioindicator plant for heavy metal pollution should possess the ability to efficiently accumulate heavy metals in its tissues, thereby serving as a sensitive detector of environmental pollution. In addition, the plant should have a wide distribution range, allowing for its use as a bioindicator across multiple geographic areas, and exhibit a moderate tolerance to environmental variability to grow in a variety of soil types and conditions. These criteria are essential in selecting appropriate bioindicator plants for monitoring heavy metal pollution in urban areas, ensuring that reliable and comprehensive data can be obtained to assess the environmental quality and potential risks associated with pollution [24,27,28].
Therefore, worldwide, in different environments, analyses of the heavy metal content in potential bioindicators have been conducted, such as lichens, mosses, and vascular plants [25,29]. Among wild plants, Trifolium pratense L. has received attention as a possible bioindicator plant for heavy metals [5]. Trifolium pratense L. (Red Clover) is a wild plant belonging to the legume (Leguminosae) family [30]. Due to its ability to accumulate heavy metals and other contaminants from the soil, it has been proposed as a potential bioindicator plant [5,31,32,33,34]. Therefore, several studies have investigated the use of red clover as a bioindicator of soil and air pollution (e.g., [5,35,36,37]). Overall, the use of Trifolium pratense L. as a bioindicator plant has shown promising results, although more research is needed to fully understand its potential and limitations.
The main aim of the present study was to evaluate T. pratense as a heavy metal bioindicator in urban areas of the representative city concerning land use. Trifolium pratense L. was selected as a potential bioindicator plant for heavy metal contamination in urban areas due to its widespread distribution, high biomass production, and ability to accumulate heavy metals in its tissues.
Moreover, the research was carried out to assess the concentration and translocation of the metals Cd, Cu, Cr, Ni, Pb, and Zn in the organs of T. pratense plants depending on the soil content. The heavy metals investigated in this study were chosen due to their prevalence as common pollutants in urban areas [38,39].

2. Materials and Methods

2.1. Study Area

Our study was conducted in Poznań, located in western Poland (52°24′30″ N, 16°56′03″ E). With an area of approximately 261.91 km2 and a population of around 530,000 inhabitants, Poznań ranks as the fifth-largest city in Poland in terms of population and the eighth largest in terms of area [40]. It is known for its temperate continental climate, which is characterized by warm summers and cold winters [41]. In Poznań, transport and built-up areas cover 43.5% of the total urban area. Industrial sites are predominantly located near the major roads in the western, eastern, and southeastern areas of Poznań, as well as in the surrounding areas. The surrounding areas of the city are home to the city’s developing automotive industry and agro-food sector. The most common soil textures are sand and sandy loam, with an average pH of 6.5–8.0 [42].

2.2. Experimental Materials

Experimental materials were one-year-old specimens of Trifolium pratense L. collected from 8 different research sites: individual houses area, area near the lake (15 m from shore), near a river (16 m from the riverbank), a high-density residential area, an industrial area, a park, an old town, and agricultural land (Table 1, Figure 1). Only plants in identical vegetative stages that showed no evident damage (such as discoloration, insect or disease indications), were gathered. Due to the key role of soil as the main factor modulating the physiological response of plants, and thus directly affecting the process of heavy metal accumulation, soil samples were collected in the same places where T. pratense grew.

2.3. Soil and Plants Sampling

Trifolium pratense L. and soil samples from particular localizations were collected between 5 and 11 May 2022. Soil materials and plant samples were taken from sample sites (Table 1), each one covered square-shaped areas with a 20 to 50 m2 range. Nine specimens of T. pratense were collected for each square-shaped area, from each rooting zone, and 0.5 kg of soil samples were collected in a layer of 0–20 cm depth. Separate plastic boxes were used to store the gathered samples of soil and plants before being delivered to the lab. We confirm that all methods, including the collection of plant material, were carried out in accordance with relevant guidelines and regulations. Voucher specimens were deposited in the herbarium of the Department of Ecology and Environmental Protection, Poznań University of Life Sciences.

2.4. Sample Preparation and Digestion Procedure

In the laboratory, the plant samples were first purified with deionized water using Milli-Q Advantage A10 Water Purification Systems, Merck Millipore (Merck, Darmstadt, Germany), and separated into leaves and roots. The soil samples were sieved (2 mm). To achieve constant dry weight, the plant and soil samples were dried at 40 ± 3 °C in an electric oven (TC 100, SalvisLAB, Rotkreuz, Switzerland) for 120 h. Digestion of the crushed in an agate mortar sample was carried out in the CEM Mars 5 Xpress microwave mineralization system (CEM, Matthews, NC, USA). From each plant or soil sample, 0.3000 ± 0.0001 g was added to a 55 mL vessel containing 8 mL of concentrated (65%) HNO3 Suprapur® (Merck, Darmstadt, Germany) and 1 mL of H2O2 for ultratrace analysis (Merck, Darmstadt, Germany). The program of digestion included three steps: ramp to temperature to 180°C—20 min; hold temperature at 180 °C—20 min; cool to room temperature—20 min. After the digestion steps using Qualitative Filter Papers (Grade 595: 4–7 μm Whatman, Kent, UK), the solutions were filtered, placed in flasks and made up to a final volume of 15.0 mL with deionized water. Reagents blank solutions were prepared in the same way as samples. The pH and electrical conductivity of the soil samples were measured using a pH meter and a conductometer, specifically the WTW Multi 3630 IDS EETF model. For pH measurement, a 1 N KCl solution with a proportion of 1:2.5 (10 g soil/25 mL KCl) was used. For electrical conductivity measurement, a proportion of 1:5 (10 g soil/50 mL demineralized H2O) was used.

2.5. Heavy Metal Determination

The determination of cadmium (Cd), chromium (Cr), nickel (Ni), copper (Cu), and lead (Pb) in plant samples was carried out using an inductively coupled plasma mass spectrometer (ICP-MS). The instrument used was the Agilent 7700x (Agilent, Santa Clara, CA, USA), which is equipped with a collision/ reaction cell (Octopole Reaction System, ORS), and was operated in no-gas and helium modes. The sample was introduced into argon (Linde Gas, Cracow, Poland) plasma via a MicroMist concentric nebulizer, quartz Scott double pass spray chamber and a quartz torch with a quartz injector. The operating conditions for the inductively coupled plasma mass spectrometry (ICP-MS) were optimized daily using the Tuning Solution (Agilent). The instrumental parameters were as follows: 1550 W for radiofrequency (RF) power, 15 L min−1 for plasma gas flow rate, 0.98 L min−1 for nebulizer gas flow rate, and 0.9 L min−1 for auxiliary gas flow rate. The ORS mode with helium gas (Linde Gas, Poland) was used in order to eliminate spectral interferences. To reduce non-spectral interferences, a 10 μg L−1 solution of 103 Rh was used as an internal standard. High-purity argon (99.999%) was used as a nebulizer, auxiliary, and plasma gas for the ICP-MS (Messer, Chorzów, Poland). An external calibration curve was prepared by preparing a set of 5 standard solutions in the concentration ranges of 0.05–50 µg L−1 for Cd, Cr, Ni, and Pb, and 0.05–100.0 µg L−1 for Cu.0–5 μg L−1. Calibration solutions were prepared by diluting a 10 mg L−1 multielement stock solution in 5% HNO3 (Multi-Element Calibration Standard 3, PerkinElmer, Waltham, MA, USA) [43].

2.6. Quality Assurance

To assess the precision and trueness of the analytical procedure-certified reference material (CRM), Trace Elements in Spinach Leaves (1515, NIST, Gaithersburg, MD, USA) and the method of standard additions were used [44]. The linearity of the calibration curves was calculated as a coefficient of correlation R, which was greater than 0.9996 for all analytes. The LOD was calculated according to the equation LOD = 3.3 SBL, where SBL is the standard deviation of repeated blank measurements. The LOD values were as follows: Cd 0.003 µg g−1, Cr 0.006 µg g−1, Cu 0.008 µg g−1, Ni 0.006 µg g−1, and Pb 0.006 µg g−1. The LOQ was calculated as three times the LOD value. Precision values were calculated as the coefficient of variation (CV) (%), which ranged from 0.8% to 2.5% for all elements. Trueness was evaluated as recovery (%), which ranged from 97% to 103%, respectively. The results of the Student’s t-test confirmed that there were no significant differences between the measured concentration ± standard deviation and the certified concentration ± standard uncertainty.

2.7. Ratios of Accumulation, Translocation and Contamination

Pollution of plants and soils with heavy metals was assessed by the bioconcentration factor (BCF), the translocation factor (TF), and the contamination factor (CF). The BCF reflects a plant’s ability to accumulate and translocate heavy metals, and is calculated as the ratio between the concentrations of heavy metals in plants and in soils [45]. The heavy metal bioconcentration factor (BCF) in plants was calculated with the formula (1), which expresses the ratio between the concentration of trace elements in root samples and the concentration of trace elements in soil samples [46]:
BCF = heavy metal concentration in roots (mg kg−1 DW)/heavy metal concentration in the soil (mg kg−1 DW)
To assess the ability of heavy metals to move from plant roots to other organs, we calculated the translocation factor (TF), which is a measure of a compound’s capacity for translocation. The TF can be used to evaluate the extent to which heavy metals are transferred from one plant organ to another [47]. With the following formula (2), according to Yu and Zhou [48], the translocation factor (TF) was calculated as the ratio between elements’ concentration in leaves and their concentration in the roots:
TF = heavy metal content in leaves (mg kg−1 DW)/heavy metal content in roots (mg kg−1 DW)
The contamination factor (CF) is a useful single index for monitoring heavy metal contamination [49]. It provides an effective means of quantifying the extent to which heavy metals have contaminated a given area. The CF for heavy metals can be calculated using the following formula (3):
CF = Ci/Cni
where Ci is the mean accumulation of the element in the soil, and Cni is the reference level for the element. The value of contamination factor allows classification of the degree of pollution in following way:
  • CF < 1—LCF—low contamination factor,
  • 1 ≤ CF < 3—MCF—moderate contamination factory,
  • 3 ≤ CF < 6—CCF—considerable contamination factor,
  • CF ≥ —VHCF—very high contamination factor [49].
According to [50] the reference levels for heavy metals are: Cd—0.41 mg kg−1; Cr—59.5 mg kg−1; Ni—29 mg kg−1; Cu—38.9 mg kg−1; Pb—27 mg kg−1.

2.8. Statistical Analyses

Statistical analyses were carried out using statistical software (R Core, 2014) and Statistica 13.1. A descriptive statistical analysis was performed to assess the concentrations of heavy metals in the examined plant species from different samples and also the concentration of defense system and physiological parameters. To assess the significance of differences between heavy metal levels in plant species, one-way analysis of variance (ANOVA) and post hoc Scheffé test were used. Data were visualized using heatmaps to compare the concentration of a particular group of elements in plants and soils at specific research sites, with two-dimensional variables (research sites, element) represented by colors. Specifically, darker colors correspond to higher concentrations, while lighter colors represent lower value. In addition, to discover distinctions and similarities among sites, sample types, and element accumulations, cluster analysis was also carried out.

3. Results

3.1. Soils Characteristics and Concentration of Heavy Metals in Soils

In research sites of Poznań, the soil pH ranged from 6.372 (high-density residential area) to 7.506 (industrial area), while the electrical conductivity (EC) ranged from 0.05 mS cm−1 (high-density residential area) to 0.221 mS cm−1 (park) (Table 2).
The concentrations of various metals (Cd, Cu, Cr, Ni, and Pb) in soil samples were found to vary across different areas. Specifically, the highest concentration of Cr was observed near the river (POZ03), while the lowest concentration occurred in the high-density residential area (POZ04). For Cd, the highest concentration was found in the park soils (POZ06), while the lowest concentration was observed in the high-density residential area (POZ04). The lowest concentrations of Ni, Cu, and Pb were also observed in the high-density residential area (POZ04). On the other hand, their highest concentrations were observed in the industrial area (POZ05) (Table 3).
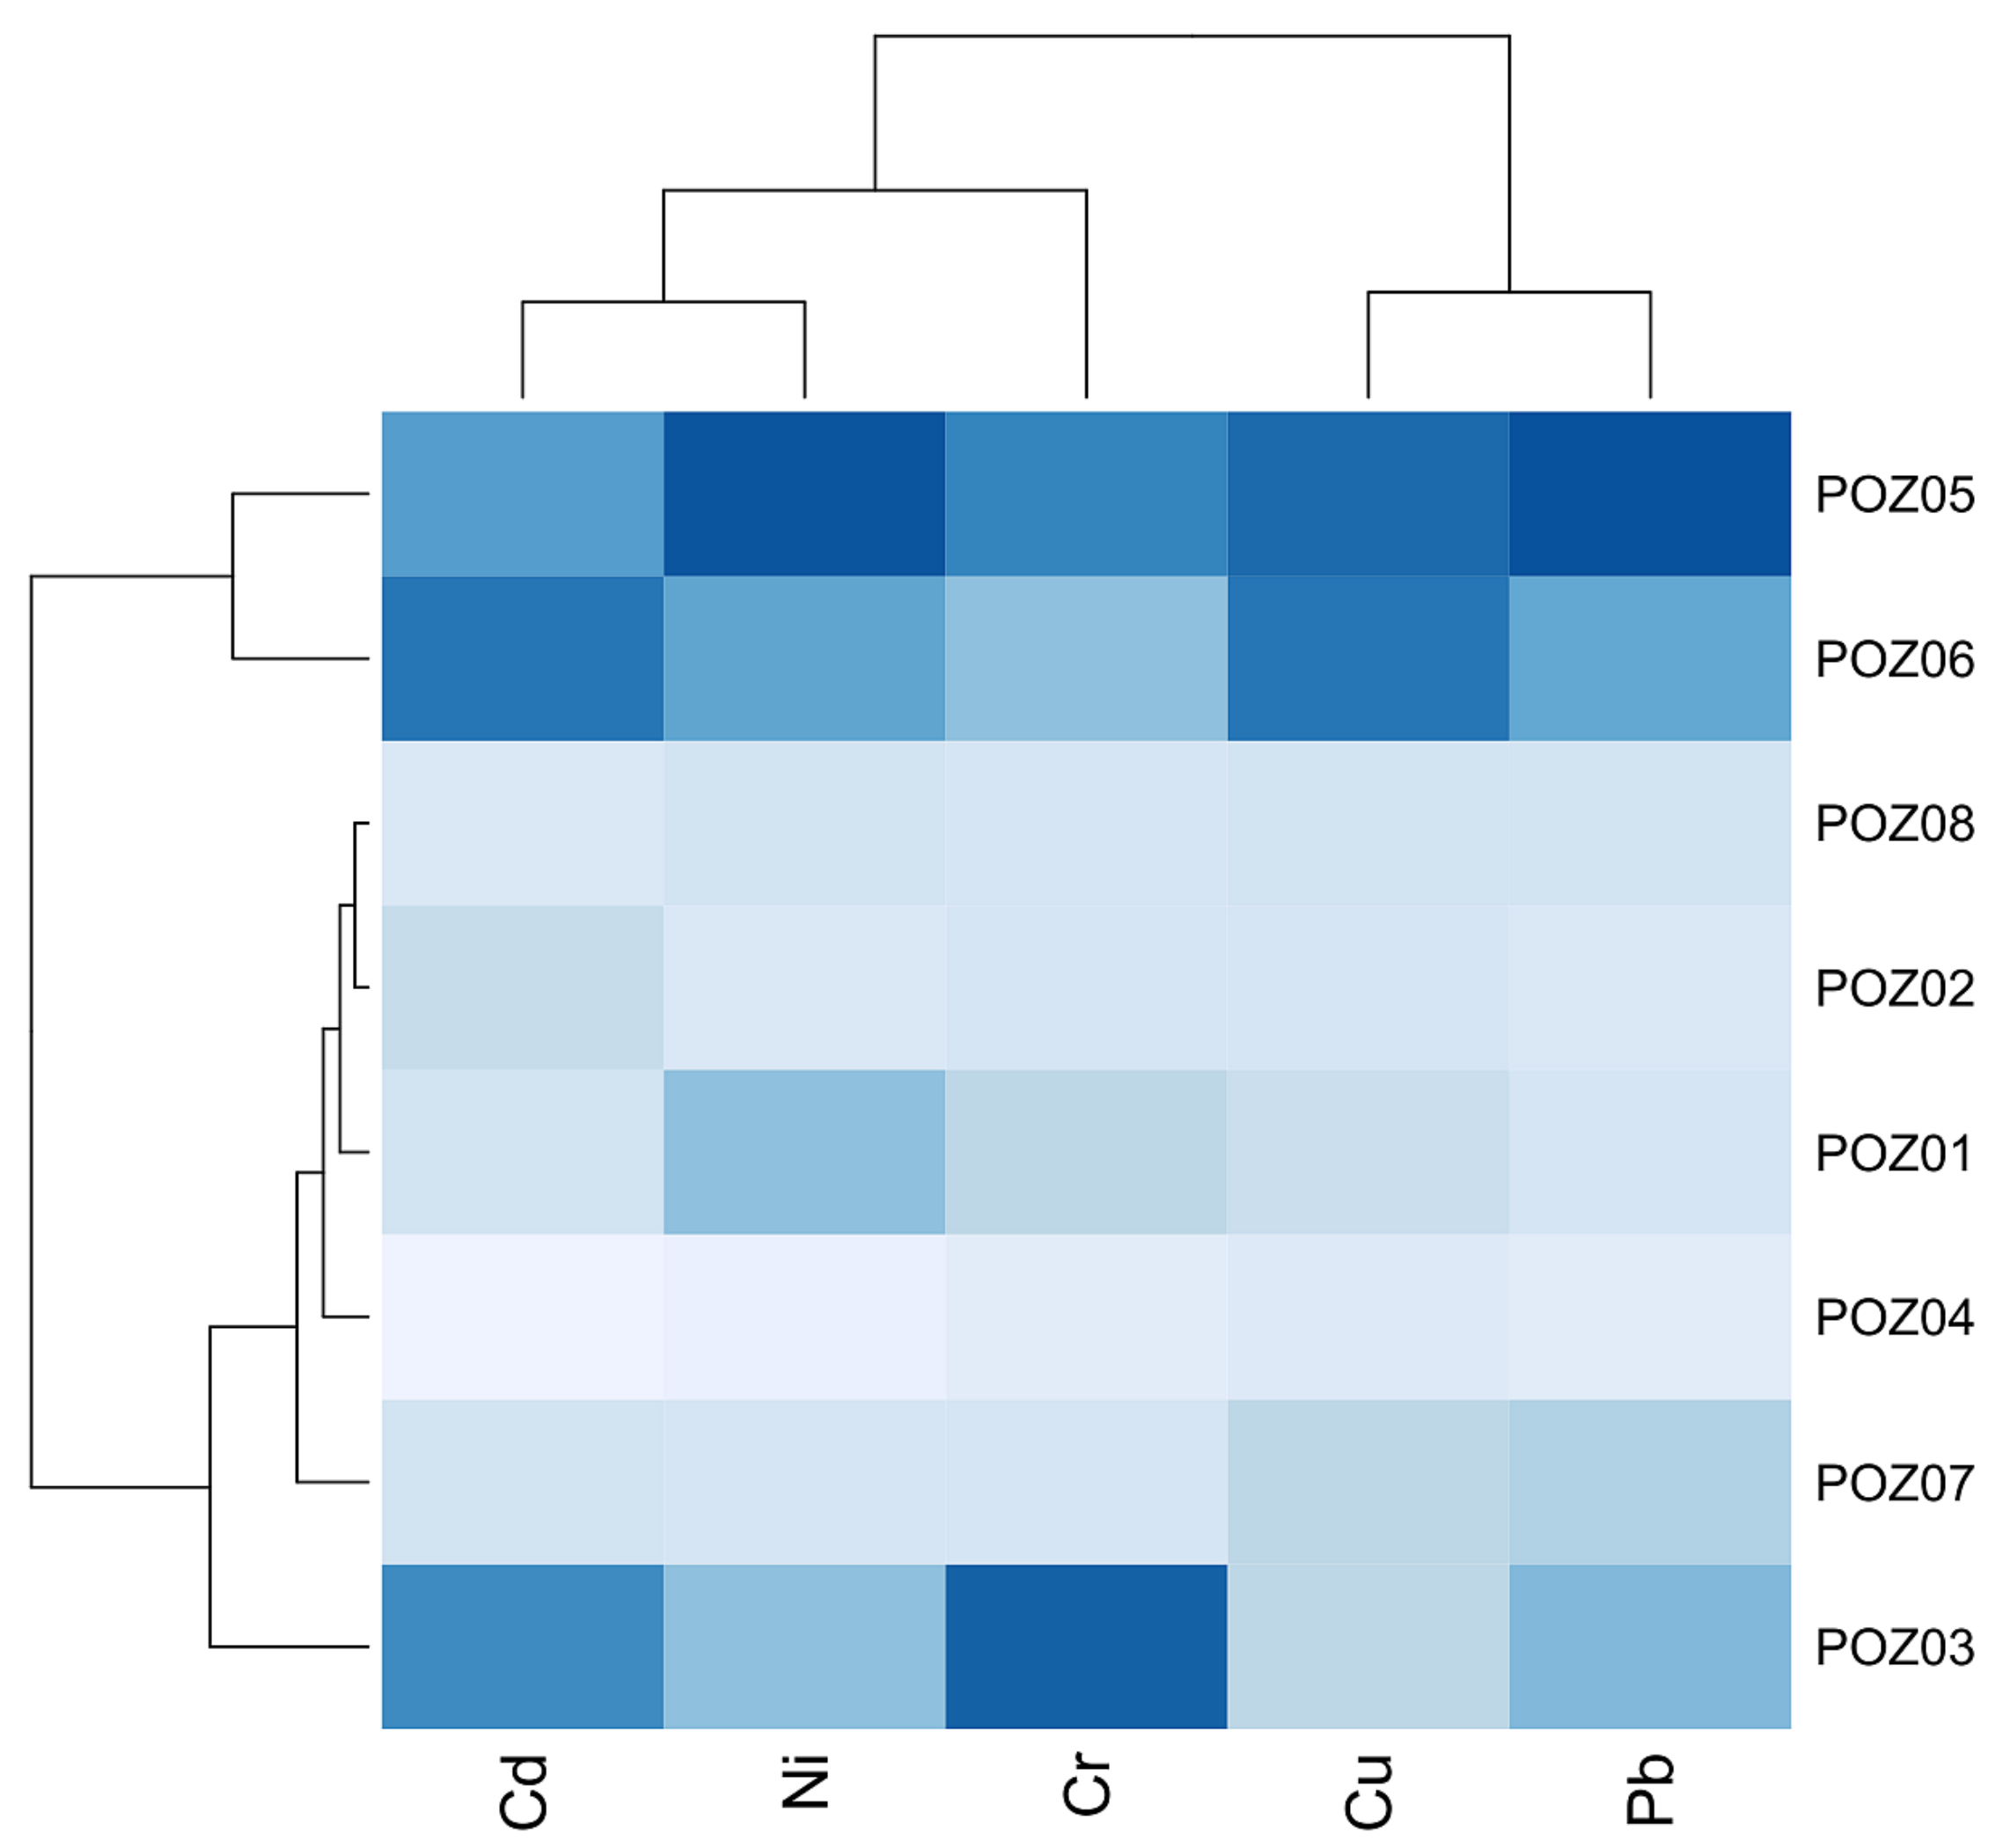
In the graph (Figure 2), the standardized results of heavy metal concentration in soils concerning land use were presented. Heavy metals concentration formed two main groups. The first group includes the industrial area (POZ05) and park (POZ06), and the second main group includes other research sites. From the intensity of the heatmap (the darker the color, the higher uptake of the heavy metal), it can be noted that soils from the industrial area (POZ05) and from the park (POZ06) compared with other research sites revealed an elevated level of all heavy metals (Cr, Cu, Ni, Cd, and Pb). However, from the intensity of the heatmap color in the soils of the industrial area (POZ05), these soils are noted to have a higher concentration of Pb, Ni, and Cu. Furthermore, in the park (POZ06), the soil is noted to have a higher concentration of Cd and Cu. Moreover, it can be noted that soils near the river (POZ03) revealed an elevated level of Cd and Cr (Figure 2).

3.2. Content of Heavy Metals in Plant Roots

Concerning roots, the highest concentration of Cr and Ni was noted in agricultural land (POZ08), and their lowest concentration was observed in the industrial area (POZ05). Cu and Cd’s highest concentration was observed in the park (POZ06). On the other hand, for Pb, the highest concentration was observed in roots of agricultural land, and the lowest concentration was observed near the lake (POZ02) (Table 3).
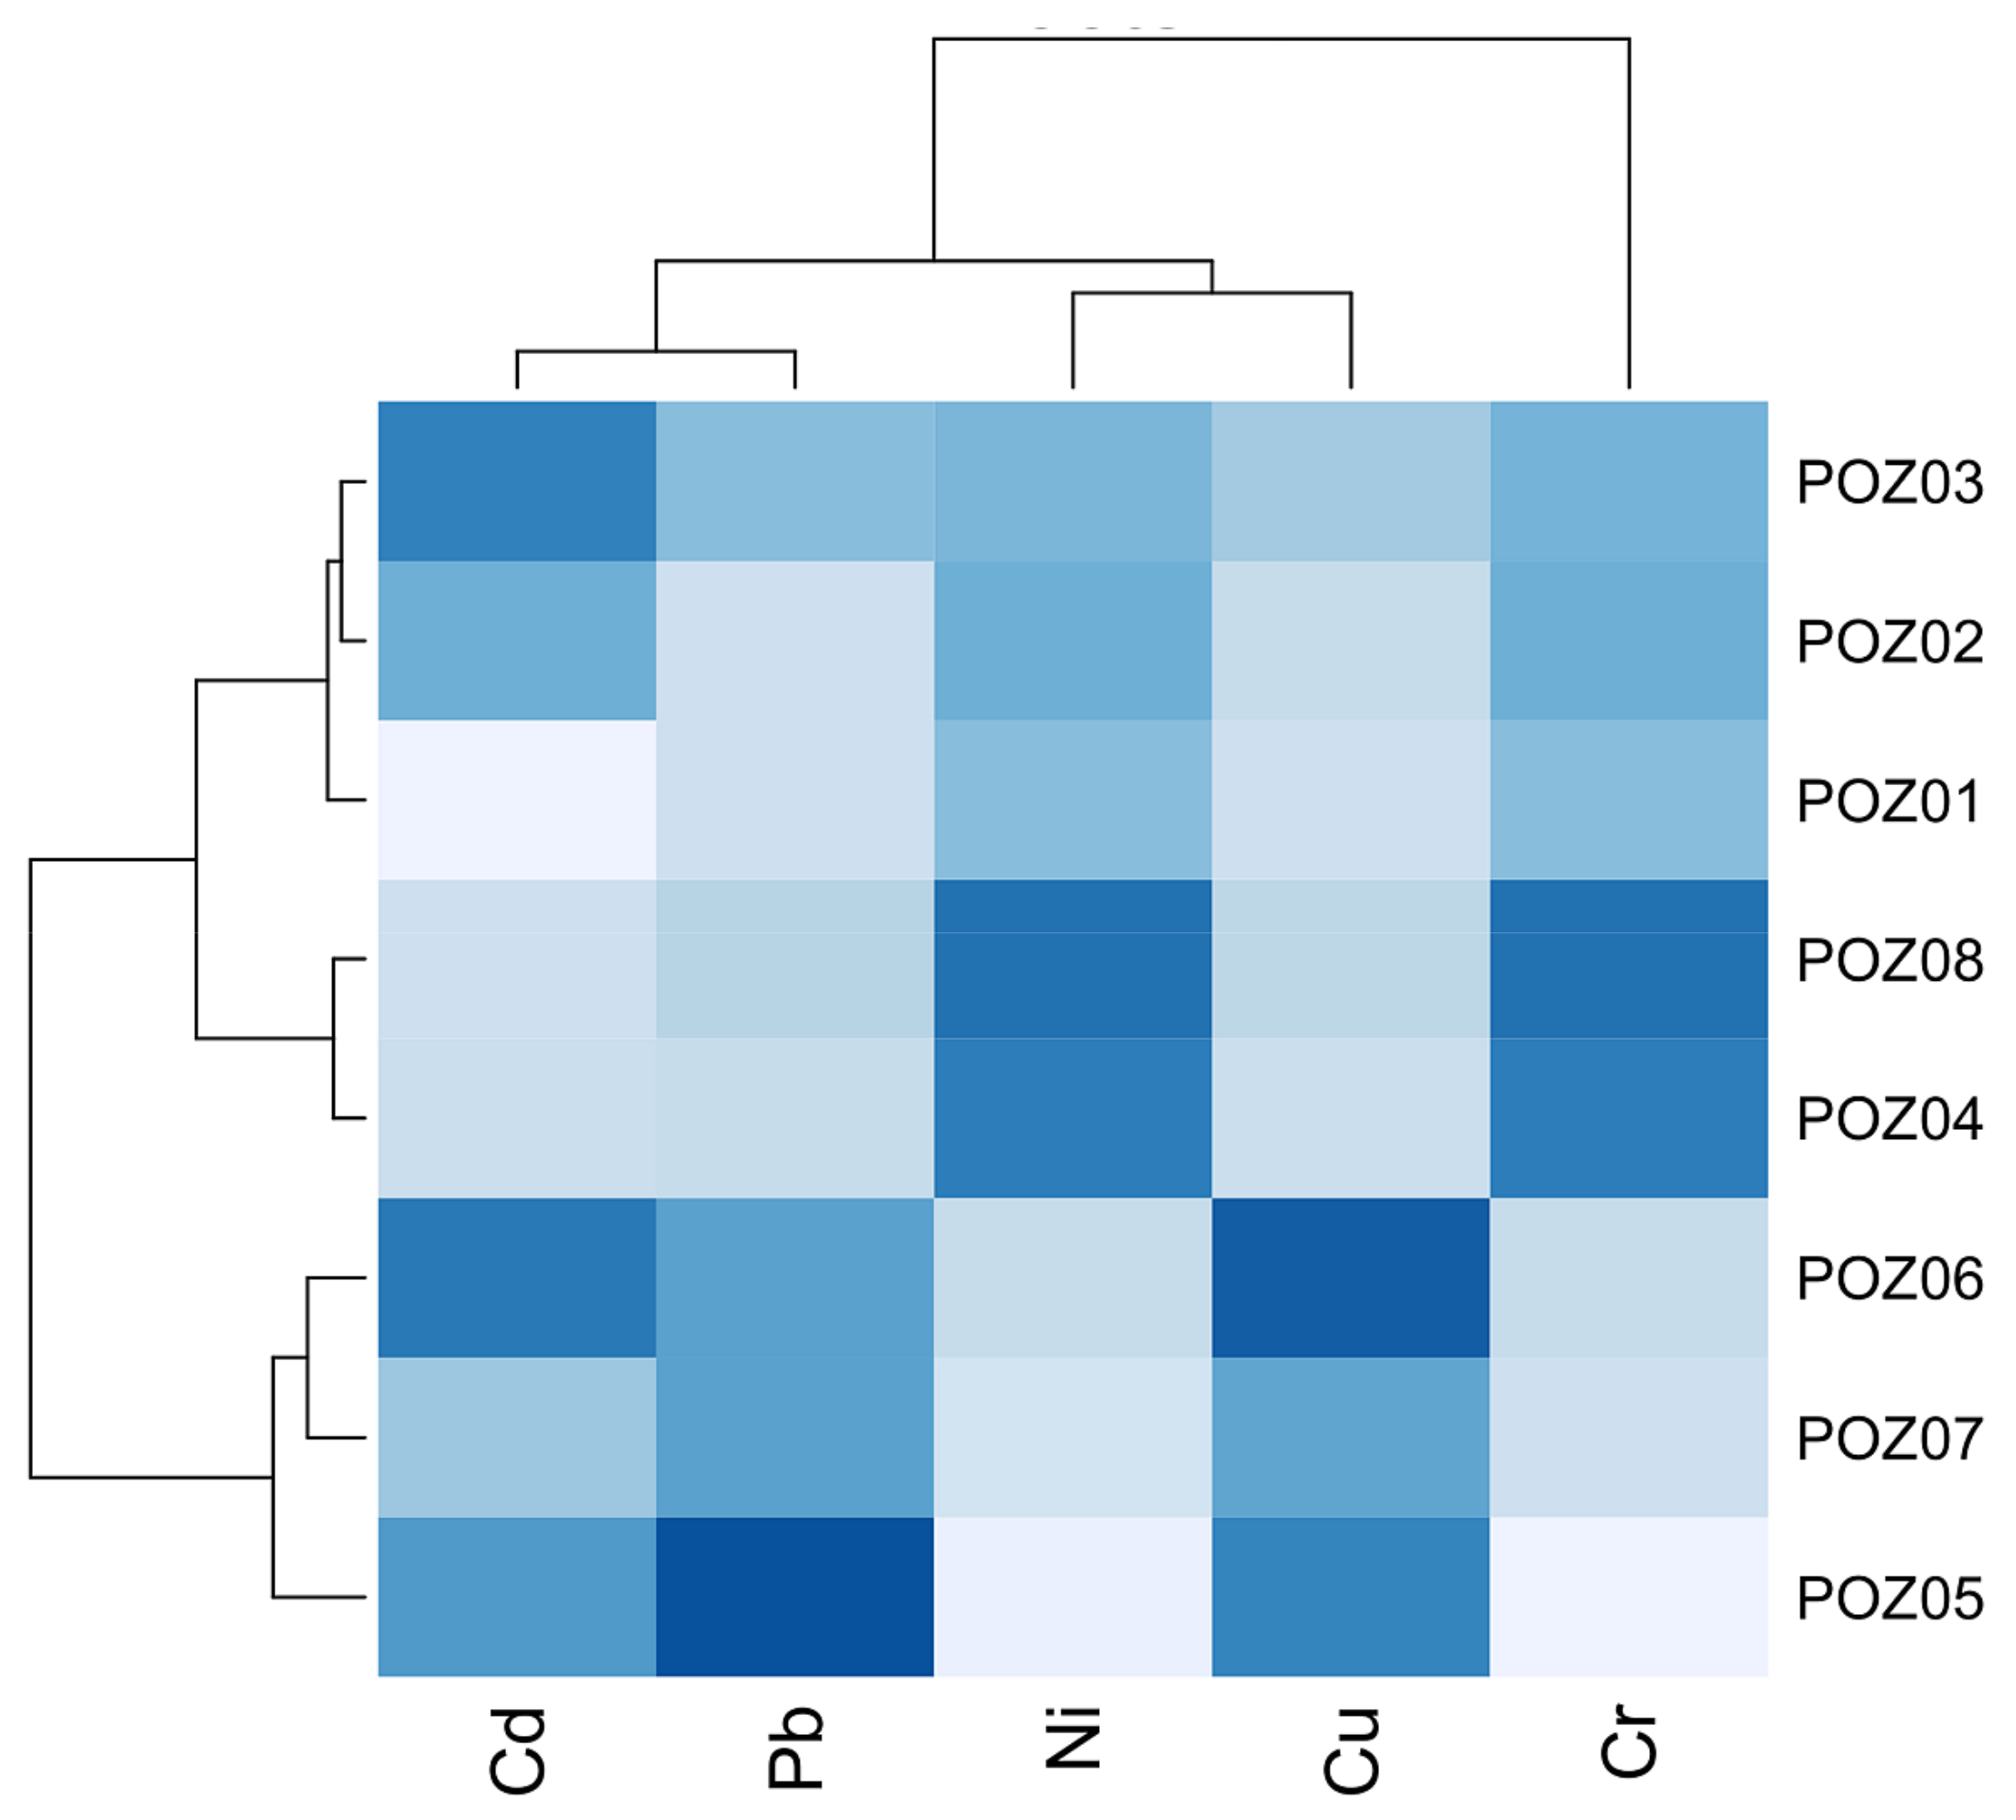
The standardized results of the analysis of heavy metals concentration in roots in relation to land use revealed the grouping of heavy metals into two main groups (Figure 3). The first main group included two subgroups; the first one includes a high-density housing area (POZ04) and agricultural land (POZ08), while the second subgroup includes individual houses (POZ01), near the lake (POZ02), and near the river (POZ03). The second main group included two subgroups; the first included the industrial area (POZ05), the second one—the park (POZ06) and the old town (POZ07). From the intensity of heatmap color (the more the intensity of the color is dark, the more the uptake of the heavy metal is high), it can be noted that the highest Cr and Ni concentration is noted in the agricultural land (POZ08) and the high-density housing area (POZ04). Pb and Cu’s highest concentration was noted in the industrial area (POZ05), park (POZ06), and the old town (POZ07). At the same time, Cd’s highest concentration was observed in the park (POZ06), near the river (POZ03), and in the industrial area (POZ05) (Figure 3).

3.3. Content of Heavy Metals in Plant Leaves

In leaves, the highest concentration of Cr, Ni, and Pb was observed in the industrial area (POZ05), and their lowest concentration was observed in the individual houses (POZ01). For Cu, the highest concentration was observed in the park (POZ06), and the lowest concentration was observed in the agricultural land (POZ08). On the other hand, concerning Cd, the highest concentration was observed in agricultural land (POZ08), and the lowest concentration was observed in individual houses (POZ01) (Table 3).
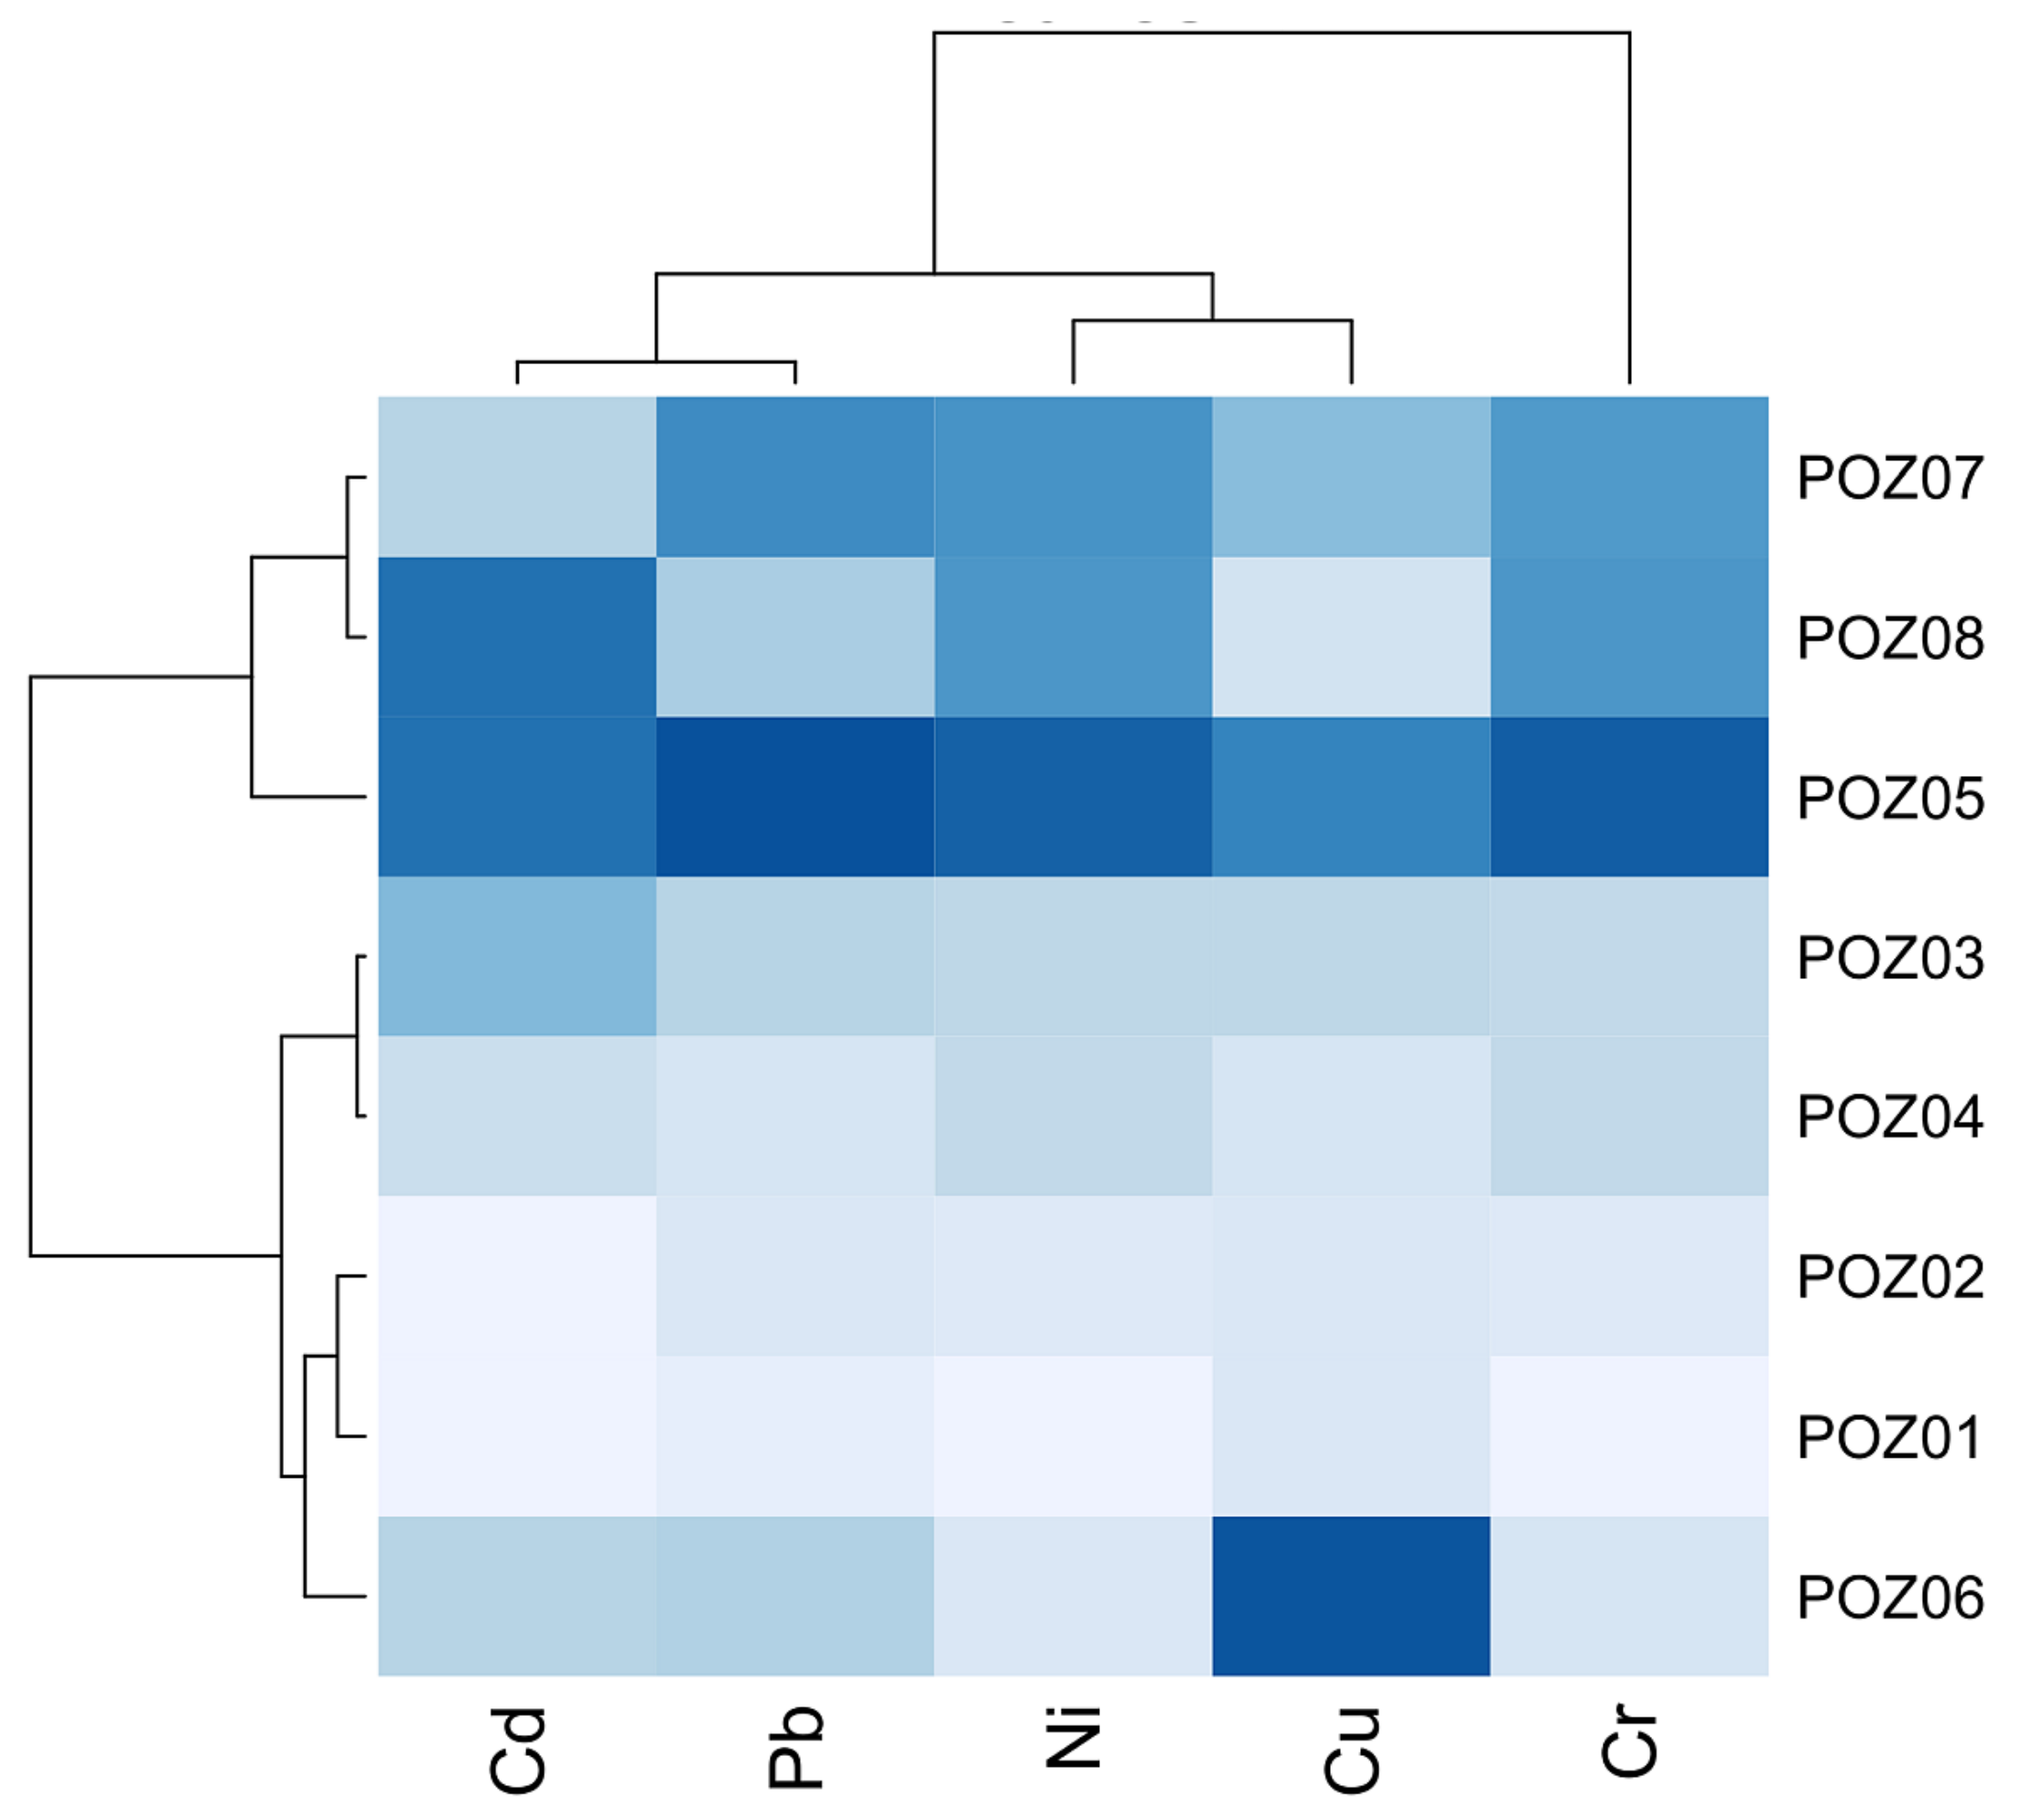
The standardized results of analyzed heavy metal concentrations in T. pretense leaves in relation to land use revealed the grouping of heavy metals into two main groups. The first group includes the industrial area (POZ05), the old town (POZ07), and the agricultural land (POZ08), and the second group includes other research sites. From the intensity of the heatmap color (the darker the color, the higher the uptake of the heavy metal), it can be noted that Pb, Ni, and Cr were revealed to be present in higher concentrations in the leaves of the industrial area (POZ05). In addition, it can be noted that Cu revealed a higher concentration in the industrial area (POZ05), but the concentration is lower than in the park leaves (POZ06). In addition, Cr and Ni revealed higher concentrations in the old town (POZ07) and the agricultural land (POZ08) (Figure 4).

3.4. Bioconcentration (BCF), Translocation (TF) and Contamination Factor (CF)

The bioconcentration factor (BCF) of chromium (Cr) in comparison with other heavy metals (Ni, Cu, Cd, and Pb) exceeded a value of 1, in most of the research sites except those near the river (POZ03), industrial area (POZ05), and park (POZ06). The nickel (Ni) bioconcentration factor (BCF) exceeded a value of 1 near the lake (POZ02), in the high-density residential area (POZ04), and on the agricultural land (POZ08). In contrast, the bioconcentration factor of Cu and Cd only exceeded a value of 1 in the high-density residential area (POZ04). On the other hand, the bioconcentration factor of Pb did not exceed the value of 1 in any research site. While concerning the translocation factor (TF), Cr and Ni recorded the highest translocation factor. Both elements exceeded the value of 1 in the industrial area (POZ05) and the old town (POZ07). Whereas other heavy metals did not exceed the value of 1 in any research site. Moreover, for the contamination factor (CF), Cr, Ni, Cu, Cd, and Pb showed different contamination values at all research sites. Cr and Ni, all research sites, were recorded to have a low contamination factor (LCF). In the case of Cu, the medium contamination factor (MCF) was recorded in the industrial area (POZ05) and the park (POZ06), whereas other research sites recorded a low contamination factor (LCF). In addition, as for the Cd, a medium contamination factor (MCF) was recorded in the river (POZ03), industrial area (POZ05), and the park (POZ06), while a low contamination factor (LCF) was recorded in other research sites. Additionally, in the case of Pb in the industrial area (POZ05) a considerable contamination factor (CCF) was recorded, while in the river (POZ03), park (POZ06), and the old town (POZ07) a medium contamination factor (MCF) was noted, whereas other research sites recorded a low contamination factor (LCF) (Table 4).

4. Discussion

In the presented study, as a potential bioindicator for heavy metals in an urban area, Trifolium pratense was used. Based on the obtained data, the spatial distribution of heavy metals (Cd, Cu, Cr, Ni and Pb) in the analyzed research sites was irregular. These differences in heavy metal concentrations in urban areas can result from many factors. Besides parameters, such as the type and number of vehicles and traffic that affect air pollution in urban areas [1], heavy metal concentrations can also be different due to other human activities and the natural background (land use propose, green areas, construction zones, industrial sites, roadside), demographic factors, soil type, and its parameters [25]. In addition, topography and meteorological conditions will determine their dispersion and transformation. Therefore, there is considerable diversity in the content of metals in urban soils in various locations [51]. In the presented study, the research sites were divided into two groups based on the content of heavy metals in the soil (first: industrial area and park; second: individual houses, near the lake, near the river, high-density housing area, the old town, and agricultural land).
The soils of the industrial area (POZ05) were characterized by the highest concentration of Pb (90.4 mg kg−1) and Cu (78.5 mg kg−1). In addition, Ni (22.2 mg kg−1) in this research site was higher than in other research sites. Lead (Pb), which is one of the most common elements [52], has many applications in various fields, such as industrial, agricultural, and household uses [53]. The high concentration of Pb in the soils of the industrial area (POZ05) can be attributed to its widespread use in various industries, including mining, smelting, and battery manufacturing. Similarly to Pb, metals such as Cu, Cd, and Zn can originate from sewage sludge, landfills, vehicle transport, geochemical processes, and industries [52]. Furthermore, the high concentrations of Cu and Ni in the soils of the industrial area can be attributed to the discharge of industrial effluents, as well as anthropogenic activities such as vehicular emissions [53]. The high concentrations of Pb, Cu, and Ni found in the soil of the industrial area suggest that anthropogenic activities in the area have significantly contributed to heavy metal pollution and the relation between land use and heavy metals. The plant’s ability to accumulate and tolerate heavy metals makes it a promising tool for monitoring selected heavy metals in the soil [5] of urban areas. That land use may have a relationship with the amounts of heavy metals is also concluded by Degórska [54], Lisiak-Zielińska et al. [25], and Adamu and Nganje [55]. Degórska [54] also found a significant relationship between the content of heavy metals in soil and land use in her investigation. Urban environments, which have experienced industrialization and urbanization, have shown a considerable increase in heavy metals such as Pb, Cd, Cu, and Zn on streets. Lisiak-Zielińska et al. [25] utilized Taraxacum officinale as a bioindicator of heavy metals in their study. The results showed that the heavy metal content in soil was primarily related to land use type, as determined by the geochemical background. Similarly, Adamu and Nganje [55] concluded that the elevation of heavy metal content in the surface soils of Benue State was related to urbanization and poor land planning and use. These findings underscore the importance of effective land management and planning in mitigating heavy metal pollution and preserving soil quality.
Furthermore, concerning Cd and Cr, the soils of the park (POZ06) were noted to have the highest Cd (1.13 mg kg−1) concentration, and those near the river (POZ03) were noted to have the highest Cr (35.9 mg kg−1) concentration. The cement-soil road bases in this area were probably the cause of the increased amounts of this element because chromium is mainly leached from the cement–ground foundation. The concentration of Cd can be related to the fact that these two areas are quite popular for recreation. Tourism activities, including the intensification of traffic and other related human activities, have been shown to contribute to the pollution of cadmium (Cd). As a result, it is clear that the occurrence and cycling of Cd in tourism environments are common phenomena [56]. The study conducted by Lisiak-Zielińska et al. [25] in Poznan also found similar results, where Taraxacum officinale accumulated higher amounts of Cd in areas near the lake, which is a popular recreational site. The increased traffic and other human activities associated with tourism were identified as contributing factors.
The roots of plants in the agricultural land (POZ08) were found to have higher concentrations of Cr and Ni. Heavy metals from human activities can significantly influence agricultural soils, leading to the bioconcentration of Cr and Ni in the roots of plants. The bioconcentration factor (BCF) for Cr and Ni in agricultural soil was found to exceed the value of 1, indicating that these elements were transported from the soil to the plant roots. The metals taken from the soil are initially stored in the plant roots. These metals can then be translocated to the aboveground plant parts through the xylem sap, which is driven by the plant’s respiration power [57]. These findings are supported by other studies [58,59], which demonstrate that chromium can be permanently bound by living cells in plant roots, leading to low chromium content in aboveground parts of the plants. Similarly to this study, extreme concentrations of Cr, Ni, and Cu have been found in agricultural soils in Qatar [60] and other soils in different land-use types, that are affected by human activities, including roadside, urban and industrial areas [61].The higher concentrations of Cr and Ni found in the roots of plants in the agricultural land (POZ08) could be attributed to the application of fertilizers, which can contain heavy metals such as chromium and nickel. Several studies have reported the occurrence of heavy metals in fertilizers, and their potential impacts on soil quality and crop productivity [62,63,64].
The highest values of the translocation factor for Cr and Ni were observed in the industrial area (POZ05) and the old town (POZ07), which could be linked to the presence of manufacturing plants and intensive traffic in these areas. Previous studies have also reported similar findings, highlighting the role of industrial activities and traffic in the emission of heavy metals into the environment and their subsequent accumulation in plants [14,65]. The main sources of Ni can also be related to the use of cadmium–nickel batteries and local industry, which have been shown to contribute to the contamination of soil and water with heavy metals [66]. A similar correlation between the translocation factor and land use was also noted by Angelova and Ivanov [67], who found higher values of this index in areas with heavy traffic. Cadmium and copper were found to accumulate mainly in the roots. In the present study, the highest concentration of Cu and Cd was found in the roots of plants in the park (POZ06), which is located in close proximity to the highway and has undergone urbanization.
Furthermore, in the leaves, the industrial area (POZ05) showed a high concentration of Cr, Ni, and Pb, compared to other research sites, indicating poor air quality and proximity to pollution sources [68]. The concentration of heavy metals in leaves can be attributed to their uptake through the stomata or the adsorption of atmospheric deposition [14,69]. The elevated concentrations of Cr, Ni, and Pb detected in the leaves of the industrial area (POZ05) are in agreement with the emissions from industrial activities and transportation, recognized as significant contributors to heavy metal pollution in urban areas. Additionally, the close proximity of the industrial area to other potential sources of heavy metals in the surrounding environment may also have contributed to the observed levels of heavy metals in the leaves. These findings are consistent with the results of Farooq et al. [70], who conducted a study on heavy metal pollution in the vicinity of industrial areas. Their study showed that the concentration of heavy metals was significantly higher in the leaves of various vegetables grown in areas close to industrial zones compared to areas further away, which provides further support for the idea that industrial activities and transportation are significant sources of heavy metal pollution in urban areas. In contrast, the leaves of agricultural land (POZ08) showed a higher concentration of Cd, which may be related to agricultural activities, especially the use of fertilizers. The occurrence of cadmium in soil is predominantly influenced by the application of phosphate fertilizers [71]. The deposition of Cd in crops can pose health risks to humans; hence, it is crucial to monitor and control its levels in food crops [72].

5. Conclusions

Our research revealed that the order of heavy metal concentration in soil was Pb > Cu > Cr > Ni > Cd. Specifically, the industrial area had the highest contamination levels of Pb, Ni, and Cu. In roots and leaves, the order of heavy metal concentration was Pb > Cu > Cr > Ni > Cd, where the roots of T. pratense in agricultural land had the highest concentration of Cr, Ni, and Cu. In addition, the leaves of T. pratense had the highest concentration of Cr, Ni, and Pb in the industrial area. Furthermore, the consistent pattern of heavy metal concentration observed in the roots and leaves of T. pratense may be due to the specific physiological and biochemical mechanisms involved in heavy metal uptake, translocation, and concentration within the plant. Our study demonstrated the potential of T. pratense as a bioindicator of heavy metal contamination in urban areas. However, further research is necessary to validate the effectiveness of T. pratense as a bioindicator in controlled conditions as well as in other urban areas and throughout various seasons.

Author Contributions

Conceptualization, A.C., M.L.-Z. and M.D.; methodology, A.H., M.L.-Z., K.B. and M.D.; formal analysis, A.H.; investigation, A.C.; data curation, A.C.; writing—original draft preparation, A.C.; writing—review and editing, M.L.-Z., A.H., K.B. and M.D.; visualization, A.C.; supervision, M.D. All authors have read and agreed to the published version of the manuscript.

Funding

This work was supported by discipline of science environmental engineering, mining and energy in Poznań University of Life Sciences (Poland) as the research program “Innovator”, no. 02/2022/INN.

Institutional Review Board Statement

Not applicable.

Informed Consent Statement

Not applicable.

Data Availability Statement

All data included in this study are available upon request by contact with the corresponding author.

Acknowledgments

The authors would like to thank Barbara Andrzejewska for technical support in the laboratory and Erjon Qorri for his assistance with the graphics. We confirm that both Barbara Andrzejewska and Erjon Qorri have given their consent to be acknowledged for their contributions to this work.

Conflicts of Interest

The authors declare no conflict of interest.

References

  1. Rucandio, M.I.; Petit-Dominguez, M.D.; Fidalgo-Hijano, C.; García-Giménez, R. Biomonitoring of chemical elements in an urban environment using arboreal and bush plant species. Environ. Sci. Pollut. Res. 2010, 18, 51–63. [Google Scholar] [CrossRef] [PubMed]
  2. Sawidis, T.; Breuste, J.; Mitrovic, M.; Pavlovic, P.; Tsigaridas, K. Trees as bioindicator of heavy metal pollution in three European cities. Environ. Pollut. 2011, 159, 3560–3570. [Google Scholar] [CrossRef] [PubMed]
  3. Wong, C.S.; Li, X.; Thornton, I. Urban environmental geochemistry of trace metals. Environ. Pollut. 2006, 142, 1–16. [Google Scholar] [CrossRef]
  4. Briffa, J.; Sinagra, E.; Blundell, R. Heavy metal pollution in the environment and their toxicological effects on humans. Heliyon 2020, 6, e04691. [Google Scholar] [CrossRef] [PubMed]
  5. Malizia, D.; Giuliano, A.; Ortaggi, G.; Masotti, A. Common plants as alternative analytical tools to monitor heavy metals in soil. Chem. Central J. 2012, 6, S6. [Google Scholar] [CrossRef] [PubMed]
  6. Tangahu, B.V.; Sheikh Abdullah, S.R.; Basri, H.; Idris, M.; Anuar, N.; Mukhlisin, M. A Review on Heavy Metals (As, Pb, and Hg) Uptake by Plants through Phytoremediation. Int. J. Chem. Eng. 2011, 2011, 939161. [Google Scholar] [CrossRef]
  7. Ali, H.; Khan, E.; Ilahi, I. Environmental Chemistry and Ecotoxicology of Hazardous Heavy Metals: Environmental Persistence, Toxicity, and Bioaccumulation. J. Chem. 2019, 2019, 6730305. [Google Scholar] [CrossRef]
  8. Mahurpawar, M. Effects of heavy metals on human health. Int. J. Res. Granthaalayah 2015, 3, 1–7. [Google Scholar] [CrossRef]
  9. Giles-Corti, B.; Vernez-Moudon, A.; Reis, R.; Turrell, G.; Dannenberg, A.L.; Badland, H.; Foster, S.; Lowe, M.; Sallis, J.F.; Stevenson, M.; et al. City planning and population health: A global challenge. Lancet 2016, 388, 2912–2924. [Google Scholar] [CrossRef]
  10. Karri, R.R.; Ravindran, G.; Dehghani, M.H. Wastewater—Sources, Toxicity, and Their Consequences to Human Health. In Soft Computing Techniques in Solid Waste and Wastewater Management; Karri, R.R., Ravindran, G., Hadi, M., Dehghani, H., Eds.; Elsevier: Amsterdam, The Netherlands, 2021; pp. 3–33. [Google Scholar] [CrossRef]
  11. Goudarzi, G.; Alavi, N.; Geravandi, S.; Idani, E.; Behrooz, H.R.A.; Babaei, A.A.; Alamdari, F.A.; Dobaradaran, S.; Farhadi, M.; Mohammadi, M.J. Health risk assessment on human exposed to heavy metals in the ambient air PM10 in Ahvaz, southwest Iran. Int. J. Biometeorol. 2018, 62, 1075–1083. [Google Scholar] [CrossRef]
  12. Asati, A.; Pichhode, M.; Nikhil, K. Effect of heavy metals on plants: An overview. Int. J. Appl. Innov. Eng. Manag. 2016, 5, 56–66. [Google Scholar]
  13. Singh, H.P.; Mahajan, P.; Kaur, S.; Batish, D.R.; Kohli, R.K. Chromium toxicity and tolerance in plants. Environ. Chem. Lett. 2013, 11, 229–254. [Google Scholar] [CrossRef]
  14. Shahid, M.; Dumat, C.; Khalid, S.; Schreck, E.; Xiong, T.; Niazi, N.K. Foliar heavy metal uptake, toxicity and detoxification in plants: A comparison of foliar and root metal uptake. J. Hazard. Mater. 2017, 325, 36–58. [Google Scholar] [CrossRef] [PubMed]
  15. Kiran; Bharti, R.; Sharma, R. Effect of heavy metals: An overview. Mater. Today Proc. 2021, 51, 880–885. [Google Scholar] [CrossRef]
  16. Nekoukhou, M.; Fallah, S.; Pokhrel, L.R.; Abbasi-Surki, A.; Rostamnejadi, A. Foliar enrichment of copper oxide nanoparticles promotes biomass, photosynthetic pigments, and commercially valuable secondary metabolites and essential oils in dragonhead (Dracocephalum moldavica L.) under semi-arid conditions. Sci. Total Environ. 2023, 863, 160920. [Google Scholar] [CrossRef] [PubMed]
  17. Çomaklı, E.; Bingöl, M.S. Heavy metal accumulation of urban Scots pine (Pinus sylvestris L.) plantation. Environ. Monit. Assess. 2021, 193, 1–13. [Google Scholar] [CrossRef]
  18. Manwani, S.; Vanisree, C.R.; Jaiman, V.; Awasthi, K.K.; Yadav, C.S.; Sankhla, M.S.; Pandit, P.P.; Awasthi, G. Heavy Metal Contamination in Vegetables and Their Toxic Effects on Human Health. In Sustainable Crop Production: Recent Advances; IntechOpen: Rijeka, Croatia, 2022; p. 181. [Google Scholar] [CrossRef]
  19. Upadhyay, R. Heavy metals in our ecosystem. In Heavy Metals in Plants Physiological to Molecular Approach; CRC Press: Boca Raton, FL, USA, 2022; pp. 1–15. [Google Scholar]
  20. Vongdala, N.; Tran, H.-D.; Xuan, T.D.; Teschke, R.; Khanh, T.D. Heavy Metal Accumulation in Water, Soil, and Plants of Municipal Solid Waste Landfill in Vientiane, Laos. Int. J. Environ. Res. Public Health 2018, 16, 22. [Google Scholar] [CrossRef] [PubMed]
  21. Peng, C.; Zhang, K.; Wang, M.; Wan, X.; Chen, W. Estimation of the accumulation rates and health risks of heavy metals in residential soils of three metropolitan cities in China. J. Environ. Sci. 2021, 115, 149–161. [Google Scholar] [CrossRef]
  22. Jia, Y.; Wang, L.; Qu, Z.; Yang, Z. Distribution, contamination and accumulation of heavy metals in water, sediments, and freshwater shellfish from Liuyang River, Southern China. Environ. Sci. Pollut. Res. 2017, 25, 7012–7020. [Google Scholar] [CrossRef]
  23. Riani, E.; Cordova, M.R.; Arifin, Z. Heavy metal pollution and its relation to the malformation of green mussels cultured in Muara Kamal waters, Jakarta Bay, Indonesia. Mar. Pollut. Bull. 2018, 133, 664–670. [Google Scholar] [CrossRef]
  24. Burger, J. Bioindicators: A Review of Their Use in the Environmental Literature 1970–2005. Environ. Bioindic. 2006, 1, 136–144. [Google Scholar] [CrossRef]
  25. Lisiak-Zielińska, M.; Borowiak, K.; Budka, A.; Kanclerz, J.; Janicka, E.; Kaczor, A.; Żyromski, A.; Biniak-Pieróg, M.; Podawca, K.; Mleczek, M.; et al. How polluted are cities in central Europe?—Heavy metal contamination in Taraxacum officinale and soils collected from different land use areas of three representative cities. Chemosphere 2020, 266, 129113. [Google Scholar] [CrossRef] [PubMed]
  26. Mehana, E.-S.E.; Khafaga, A.F.; Elblehi, S.S.; El-Hack, M.E.A.; Naiel, M.A.; Bin-Jumah, M.; Othman, S.I.; Allam, A.A. Biomonitoring of Heavy Metal Pollution Using Acanthocephalans Parasite in Ecosystem: An Updated Overview. Animals 2020, 10, 811. [Google Scholar] [CrossRef] [PubMed]
  27. Holt, E.A.; Miller, S.W. Bioindicators: Using organisms to measure. Nature 2011, 3, 8–13. [Google Scholar]
  28. Gerlach, J.; Samways, M.; Pryke, J. Terrestrial invertebrates as bioindicators: An overview of available taxonomic groups. J. Insect Conserv. 2013, 17, 831–850. [Google Scholar] [CrossRef]
  29. Pająk, M.; Pietrzykowski, M. Bioindication of Heavy Metals Contamination by Mushrooms and Mosses in Highly Industrialized Environment. In Biotechnology for Sustainable Environment; Springer: Singapore, 2021; pp. 271–288. [Google Scholar] [CrossRef]
  30. Gillet, J.M. Taxonomy and Morphology. In Clover Science and Technology; Taylor, N.L., Ed.; Crop Science Society of America: Madison, WI, USA, 1985; pp. 7–69. [Google Scholar] [CrossRef]
  31. Murin, G.; Micieta, K. Wild Plant Species in Bioindication of Polluted Environment. In Environmental Stress: Indication, Mitigation and Eco-Conservation; Springer: Dordrecht, The Netherlands, 2000; pp. 285–298. [Google Scholar] [CrossRef]
  32. Bara, G. Accumulation of Heavy Metals from Herbaceous Plants. ANGLISTICUM J. Assoc.-Inst. Engl. Lang. Am. Stud. 2016, 3, 73–79. [Google Scholar]
  33. Kujawska, J.; Pawłowska, M. Effects of Soil-Like Materials Mix from Drill Cuttings, Sewage Sludge And Sawdust on the Growth of Trifolium pratense L. and Transfer of Heavy Metals. J. Ecol. Eng. 2018, 19, 225–230. [Google Scholar] [CrossRef]
  34. Meng, L.; Yang, Y.; Ma, Z.; Jiang, J.; Zhang, X.; Chen, Z.; Cui, G.; Yin, X. Integrated physiological, transcriptomic and metabolomic analysis of the response of Trifolium pratense L. to Pb toxicity. J. Hazard. Mater. 2022, 436, 129128. [Google Scholar] [CrossRef]
  35. Nouchi, I. Plants as bioindicators of air pollutants. In Air Pollution and Plant Biotechnology: Prospects for Phytomonitoring and Phytoremediation; Springer: Tokyo, Japan, 2012; pp. 41–60. [Google Scholar]
  36. Bekuzarova, S.A.; Shabanova, I.A.; Bekmursov, A.D. Plants-bioindicators of soil contamination by heavy metals. In Heavy Metals and Other Pollutants in the Environment; Apple Academic Press: Burlington, ON, Canada, 2017; pp. 145–158. [Google Scholar]
  37. Inelova, Z.; Nurzhanova, A.; Yerubayeva, G.; Aitzhan, M.; Djansugurova, L.; Bekmanov, B. Heavy metal contents in plants of phytocenoses of the point of Besqaynar, Kyzylkairat and Taukaraturyk. Pak. J. Bot. 2020, 53, 511–516. [Google Scholar] [CrossRef]
  38. Alloway, B.J. Heavy Metals in Soils: Trace Metals and Metalloids in Soils and Their Bioavailability; Springer Science & Business Media: Dordrecht, The Netherlands, 2012; Volume 22. [Google Scholar]
  39. Keshavarzi, B.; Tazarvi, Z.; Rajabzadeh, M.A.; Najmeddin, A. Chemical speciation, human health risk assessment and pollution level of selected heavy metals in urban street dust of Shiraz, Iran. Atmospheric Environ. 2015, 119, 1–10. [Google Scholar] [CrossRef]
  40. Trojanek, R.; Tanas, J.; Raslanas, S.; Banaitis, A. The Impact of Aircraft Noise on Housing Prices in Poznan. Sustainability 2017, 9, 2088. [Google Scholar] [CrossRef]
  41. Bogawski, P.; Grewling, Ł.; Nowak, M.; Smith, M.; Jackowiak, B. Trends in atmospheric concentrations of weed pollen in the context of recent climate warming in Poznań (Western Poland). Int. J. Biometeorol. 2014, 58, 1759–1768. [Google Scholar] [CrossRef] [PubMed]
  42. Lis, J.; Pasieczna, A.; Starczewska-Czapowska, J. Geochemical Atlas of Poznan and Its Surendings: Soils, Water Sediments, Surface Waters: 1:100,000; Państwowy Instytut Geologiczny: Warszawa, Poland, 2005. [Google Scholar]
  43. Małecka, A.; Konkolewska, A.; Hanć, A.; Ciszewska, L.; Staszak, A.M.; Jarmuszkiewicz, W.; Ratajczak, E. Activation of antioxidative and detoxificative systems in Brassica juncea L. plants against the toxicity of heavy metals. Sci. Rep. 2021, 11, 22345. [Google Scholar] [CrossRef] [PubMed]
  44. Kutrowska, A.; Małecka, A.; Piechalak, A.; Masiakowski, W.; Hanć, A.; Barałkiewicz, D.; Andrzejewska, B.; Zbierska, J.; Tomaszewska, B. Effects of binary metal combinations on zinc, copper, cadmium and lead uptake and distribution in Brassica juncea. J. Trace Elements Med. Biol. 2017, 44, 32–39. [Google Scholar] [CrossRef] [PubMed]
  45. Aladesanmi, O.T.; Oroboade, J.G.; Osisiogu, C.P.; Osewole, A.O. Bioaccumulation factor of selected heavy metals in Zea mays. J. Health Pollut. 2019, 9, 191207. [Google Scholar] [CrossRef]
  46. Cohen, C.K.; Fox, T.C.; Garvin, D.F.; Kochian, L. The Role of Iron-Deficiency Stress Responses in Stimulating Heavy-Metal Transport in Plants1. Plant Physiol. 1998, 116, 1063–1072. [Google Scholar] [CrossRef]
  47. Takarina, N.D.; Pin, T.G. Bioconcentration Factor (BCF) and Translocation Factor (TF) of Heavy Metals in Mangrove Trees of Blanakan Fish Farm. Makara J. Sci. 2017, 21, 77–81. [Google Scholar] [CrossRef]
  48. Yu, Z.; Zhou, Q. Growth responses and cadmium accumulation of Mirabilis jalapa L. under interaction between cadmium and phosphorus. J. Hazard. Mater. 2009, 167, 38–43. [Google Scholar] [CrossRef]
  49. Shen, F.; Mao, L.; Sun, R.; Du, J.; Tan, Z.; Ding, M. Contamination Evaluation and Source Identification of Heavy Metals in the Sediments from the Lishui River Watershed, Southern China. Int. J. Environ. Res. Public Health 2019, 16, 336. [Google Scholar] [CrossRef]
  50. Kabata-Pendias, A. Trace Elements in Soils and Plants, 4th ed.; CRC Press, Taylor & Francis Group: Boca Raton, FL, USA, 2010. [Google Scholar] [CrossRef]
  51. Hołtra, A.; Zamorska-Wojdyła, D. The environmental pollution with copper and zinc along the communication routes in Wrocław, Poland. Environ. Prot. Eng. 2016, 42, 153–165. [Google Scholar] [CrossRef]
  52. Sardar, K.; Ali, S.; Hameed, S.; Afzal, S.; Fatima, S.; Shakoor, M.B.; Tauqeer, H.M. Heavy metals contamination and what are the impacts on living organisms. Greener J. Environ. Manag. Public Saf. 2013, 2, 172–179. [Google Scholar]
  53. Zarić, N.M.; Ilijević, K.; Stanisavljević, L.; Gržetić, I. Metal concentrations around thermal power plants, rural and urban areas using honeybees (Apis mellifera L.) as bioindicators. Int. J. Environ. Sci. Technol. 2015, 13, 413–422. [Google Scholar] [CrossRef]
  54. Degórska, A. An assessment of urban habitat contamination with selected heavy metals within the city of Katowice using the common dandelion (Taraxacum officinale Web.) as a bioindicator. Environ. Socio-economic Stud. 2013, 1, 29–40. [Google Scholar] [CrossRef]
  55. Adamu, C.I.; Nganje, T.N. Heavy Metal Contamination of Surface Soil in Relationship to Land Use Patterns: A Case Study of Benue State, Nigeria. Mater. Sci. Appl. 2010, 1, 127–134. [Google Scholar] [CrossRef]
  56. Mikhailenko, A.V.; Ruban, D.A.; Ermolaev, V.A.; Van Loon, A.J. Cadmium pollution in the tourism environment: A literature review. Geosciences 2020, 10, 242. [Google Scholar] [CrossRef]
  57. Ismael, M.A.; Elyamine, A.M.; Moussa, M.G.; Cai, M.; Zhao, X.; Hu, C. Cadmium in plants: Uptake, toxicity, and its interactions with selenium fertilizers. Metallomics 2019, 11, 255–277. [Google Scholar] [CrossRef]
  58. Rodriguez, E.; Santos, C.; Azevedo, R.; Moutinho-Pereira, J.; Correia, C.; Dias, M.C. Chromium (VI) induces toxicity at different photosynthetic levels in pea. Plant Physiol. Biochem. 2012, 53, 94–100. [Google Scholar] [CrossRef]
  59. Anjum, S.A.; Ashraf, U.; Khan, I.; Tanveer, M.; Shahid, M.; Shakoor, A.; Wang, L. Phyto-Toxicity of Chromium in Maize: Oxidative Damage, Osmolyte Accumulation, Anti-Oxidative Defense and Chromium Uptake. Pedosphere 2017, 27, 262–273. [Google Scholar] [CrossRef]
  60. Peng, Y.; Kheir, R.B.; Adhikari, K.; Malinowski, R.; Greve, M.B.; Knadel, M.; Greve, M.H. Digital Mapping of Toxic Metals in Qatari Soils Using Remote Sensing and Ancillary Data. Remote. Sens. 2016, 8, 1003. [Google Scholar] [CrossRef]
  61. Lwin, C.S.; Kim, Y.-N.; Lee, M.; Kim, K.-R. Coexistence of Cr and Ni in anthropogenic soils and their chemistry: Implication to proper management and remediation. Environ. Sci. Pollut. Res. 2022, 29, 62807–62821. [Google Scholar] [CrossRef]
  62. Zarcinas, B.A.; Ishak, C.F.; McLaughlin, M.J.; Cozens, G. Heavy metals in soils and crops in Southeast Asia. Environ. Geochem. Health 2004, 26, 343–357. [Google Scholar] [CrossRef]
  63. Ding, F.; He, Z.; Liu, S.; Zhang, S.; Zhao, F.; Li, Q.; Stoffella, P.J. Heavy metals in composts of China: Historical changes, regional variation, and potential impact on soil quality. Environ. Sci. Pollut. Res. 2017, 24, 3194–3209. [Google Scholar] [CrossRef]
  64. Sandeep, G.; Vijayalatha, K.R.; Anitha, T. Heavy metals and its impact in vegetable crops. Int. J. Chem. Stud. 2019, 7, 1612–1621. [Google Scholar]
  65. Nagajyoti, P.C.; Lee, K.D.; Sreekanth, T.V.M. Heavy metals, occurrence and toxicity for plants: A review. Environ. Chem. Lett. 2010, 8, 199–216. [Google Scholar] [CrossRef]
  66. Das, K.K.; Reddy, R.C.; Bagoji, I.B.; Das, S.; Bagali, S.; Mullur, L.; Khodnapur, J.P.; Biradar, M.S. Primary concept of nickel toxicity—An overview. J. Basic Clin. Physiol. Pharmacol. 2018, 30, 141–152. [Google Scholar] [CrossRef]
  67. Angelova, V.; Ivanov, K. Heavy metal content in dandelion (Taraxacum officinale Web.). Agric. Sci. 2018, 10, 55–61. [Google Scholar] [CrossRef]
  68. Djingova, R.; Kuleff, I.; Penev, I.; Sansoni, B. Bromine, copper, manganese and lead content of the leaves of Taraxacum officinale (dandelion). Sci. Total Environ. 1986, 50, 197–208. [Google Scholar] [CrossRef]
  69. Ma, C.; Liu, F.; Xie, P.; Zhang, K.; Yang, J.; Zhao, J.; Zhang, H. Mechanism of Pb absorption in wheat grains. J. Hazard. Mater. 2021, 415, 125618. [Google Scholar] [CrossRef]
  70. Farooq, M.; Anwar, F.; Rashid, U. Appraisal of heavy metal contents in different vegetables grown in the vicinity of an industrial area. Pak. J. Bot. 2008, 40, 2099–2106. [Google Scholar]
  71. Suciu, N.A.; De Vivo, R.; Rizzati, N.; Capri, E. Cd content in phosphate fertilizer: Which potential risk for the environment and human health? Curr. Opin. Environ. Sci. Health 2022, 30, 100392. [Google Scholar] [CrossRef]
  72. Grant, C.A.; Sheppard, S.C. Fertilizer Impacts on Cadmium Availability in Agricultural Soils and Crops. Hum. Ecol. Risk Assessment Int. J. 2008, 14, 210–228. [Google Scholar] [CrossRef]
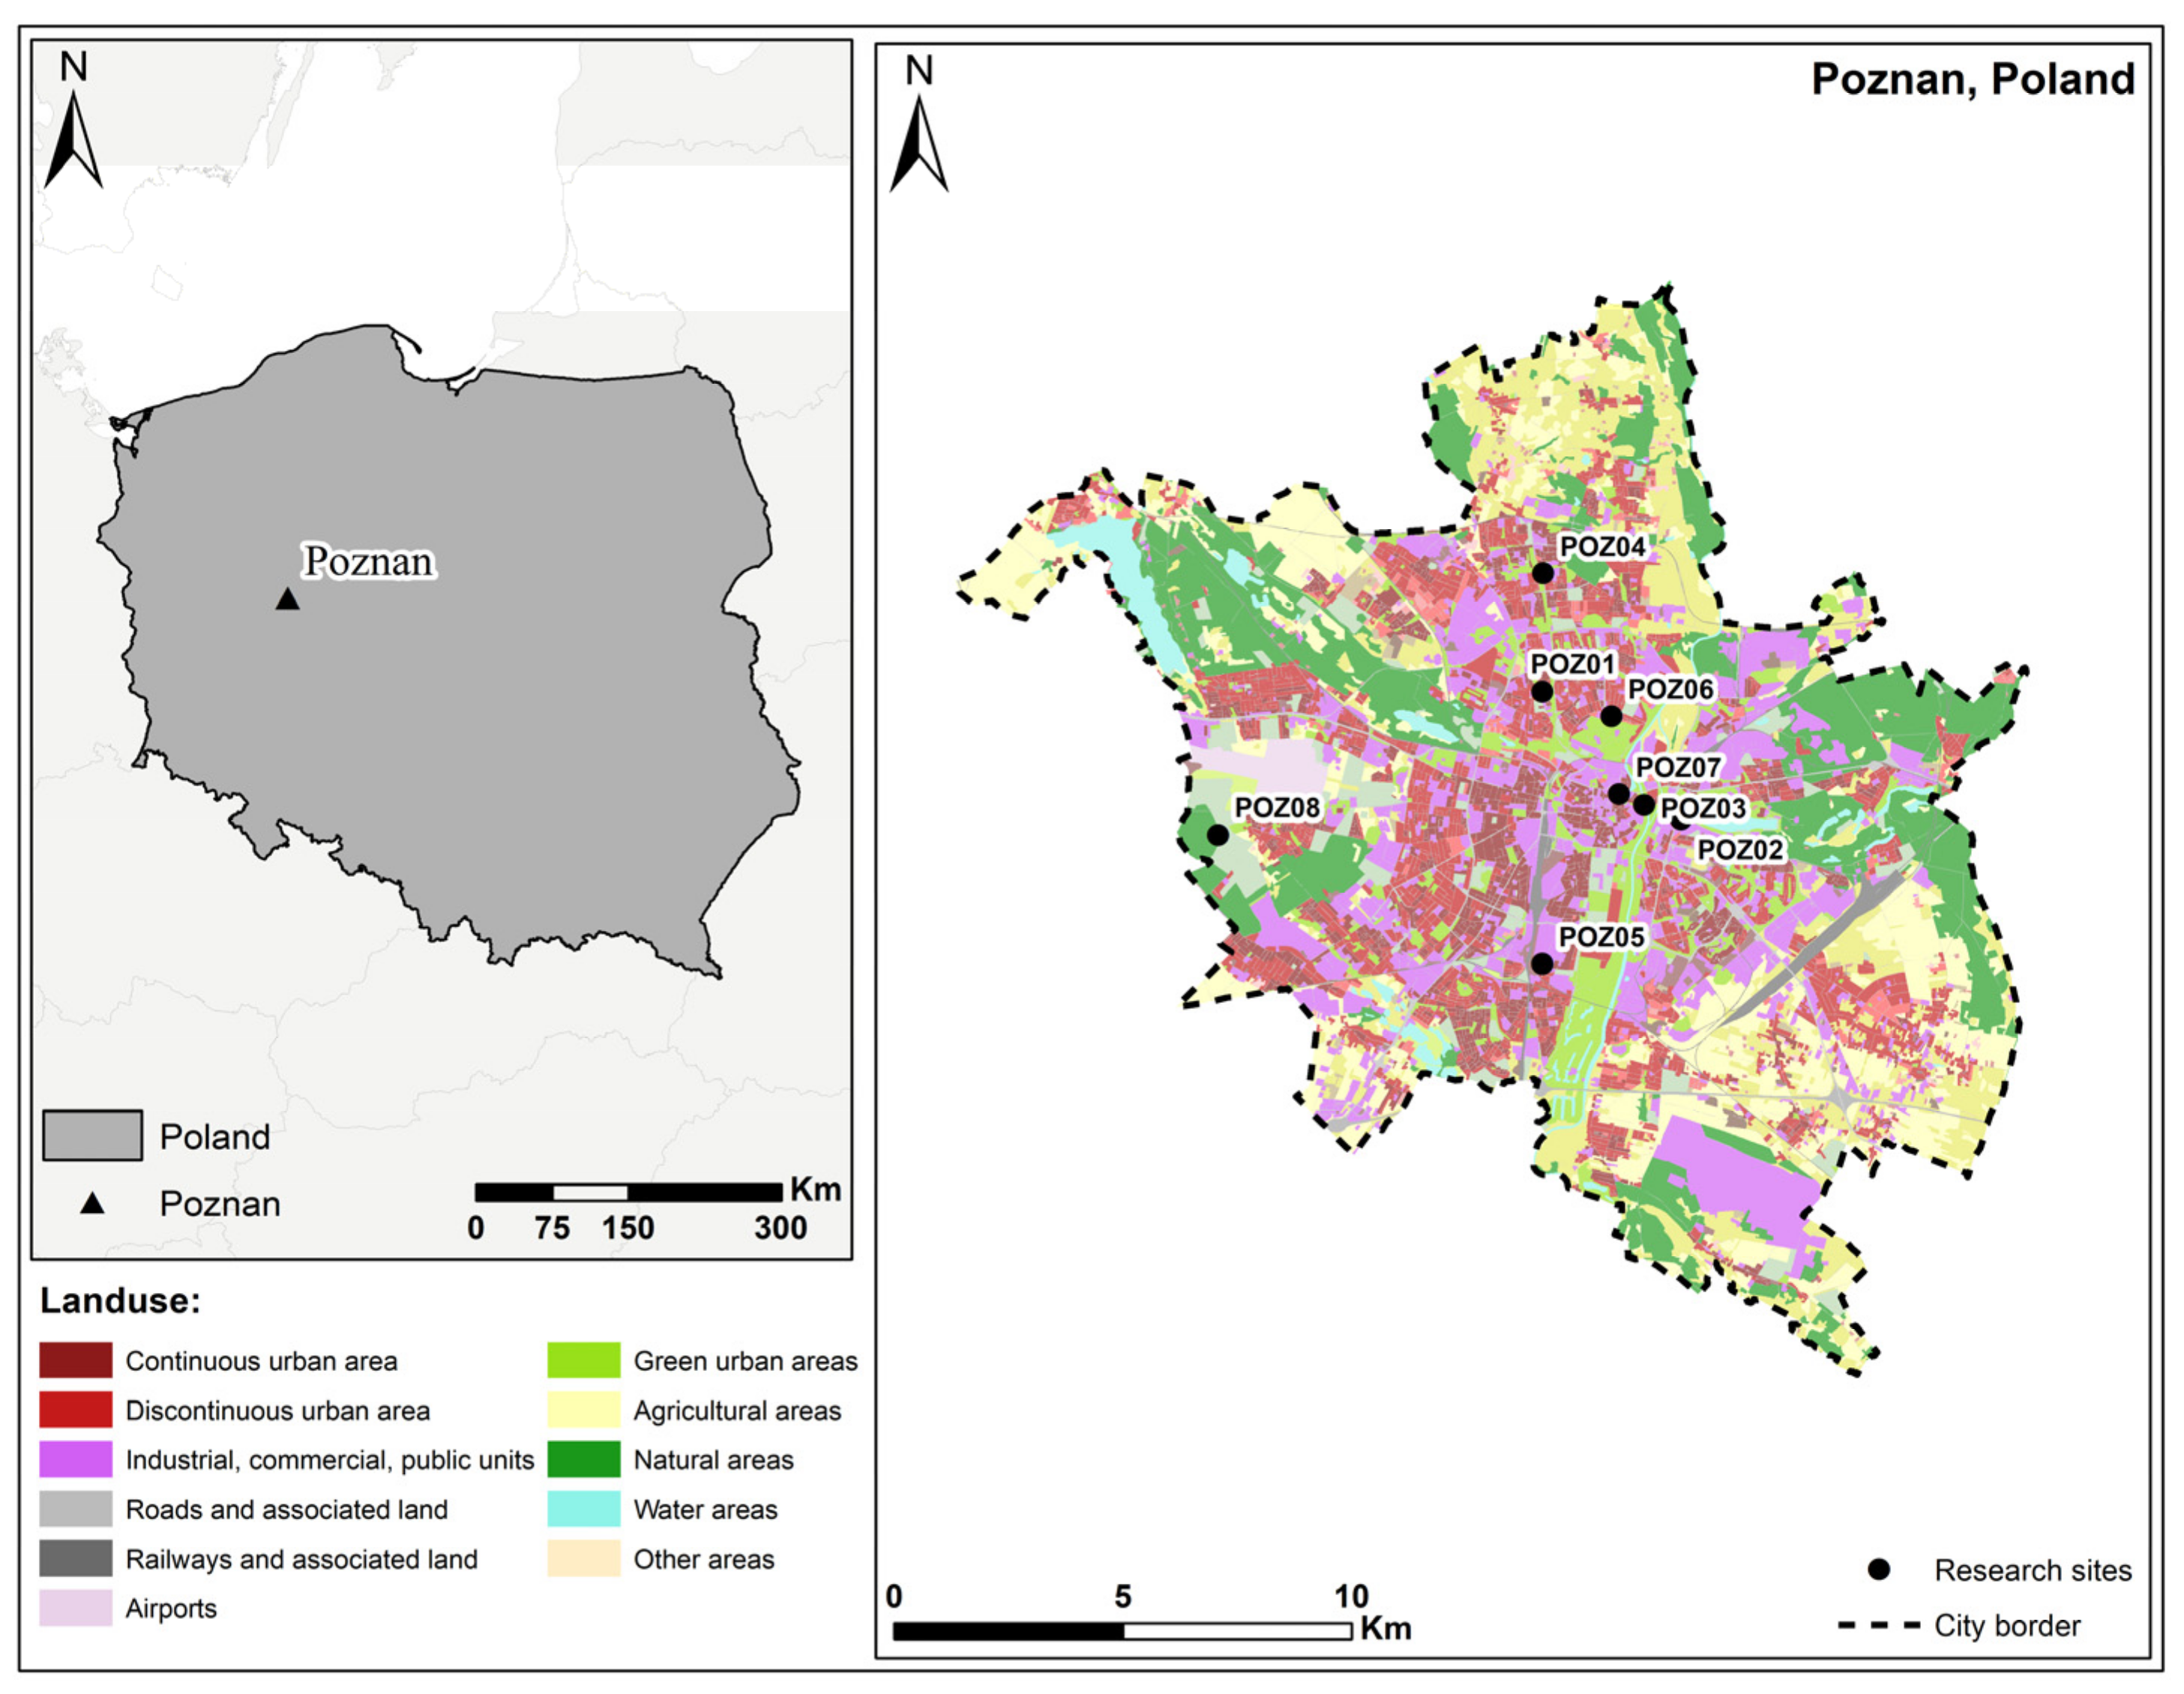
Figure 1. Location of research sites in Poznan (POZ01-POZ08) (source: own study based on Urban Atlas 2018).
Sustainability 15 07325 g001
Figure 2. Heatmap and cluster analysis of heavy metal (Cd, Cu, Cr, Ni and Pb) concentration in soils from all research sites.
Sustainability 15 07325 g002
Figure 3. Heatmap and cluster analysis of heavy metal (Cd, Cu, Cr, Ni and Pb) concentration in roots from all research sites.
Sustainability 15 07325 g003
Figure 4. Heatmap and cluster analysis of heavy metal (Cd, Cu, Cr, Ni and Pb) concentration in leaves from all research sites.
Sustainability 15 07325 g004
Table 1. Sample sites.
No.Description of Sample SitesCode
1individual housesPOZ01
2area near the lakePOZ02
3area near the riverPOZ03
4high-density residential areaPOZ04
5industrial areaPOZ05
6ParkPOZ06
7old townPOZ07
8agricultural landPOZ08
Table 2. Soil parameter at research sites (3 replications for each site).
Research SitepHEC [mS cm−1]
Individual houses (POZ01)6.886 ± 0.0120.102 ± 0.002
Area near the lake (POZ02)7.209 ± 0.0130.101 ± 0.001
Area near the river (POZ03)6.414 ± 0.0310.088 ± 0.004
High-density residential area (POZ04)6.372 ± 0.0340.050 ± 0.003
Industrial area (POZ05)7.506 ± 0.0250.147 ± 0.004
Park (POZ06)7.314 ± 0.0320.221 ± 0.003
Old town (POZ07)7.033 ± 0.0230.096 ± 0.002
Agricultural land (POZ08)7.353 ± 0.0140.106 ± 0.004
Table 3. The HMs content (mg kg−1 DW) in soil and plants (mean ± SD), where different letters (a–f) indicate means are significantly different (p < 0.05) in the same row according to the post hoc Scheffé test.
HMsPOZ01POZ02POZ03POZ04POZ05POZ06POZ07POZ08
soilCr14.2 ± 1.22 d8.69 ± 0.574 de47.3 ± 4.62 a5.714 ± 0.403 e38.3 ± 4.75 b21.4 ± 1.26 c8.797 ± 0.158 de8.487 ± 0.669 de
Ni10.9 ± 0.823 c5.43 ± 0.391 d10.7 ± 1.10 c4.04 ± 0.285 d22.3 ± 2.81 a13.9 ± 0.778 b5.70 ± 0.097 d6.30 ± 0.567 d
Cu15.9 ± 1.25 bc10.1 ± 0.652 c21.3 ± 1.78 b6.38 ± 0.274 c78.5 ± 9.74 a72.6 ± 4.22 a20.2 ± 0.273 b12.7 ± 1.13 bc
Cd0.321 ± 0.030 de0.386 ± 0.010 d0.971 ± 0.021 b0.143 ± 0.010 f0.853 ± 0.025 c1.12 ± 0.123 a0.322 ± 0.009 de0.268 ± 0.003 d
Pb13.6 ± 1.08 e12.0 ± 0.805 e39.5 ± 3.33 bc7.99 ± 0.445 e90.4 ± 14.6 a49.1 ± 3.3 b27.7 ± 0.458 cd15.4 ± 1.22 de
rootsCr32.5 ± 0.771 b38.3 ± 2.25 b35.9 ± 0.037 b54.8 ± 2.24 a7.10 ± 0.314 d20.8 ± 0.717 c18.3 ± 0.648 c60.6 ± 4.71 a
Ni9.97 ± 0.322 b11.2 ± 0.617 b10.4 ± 0.383 b15.6 ± 0.779 a3.78 ± 0.081 d6.5 ± 0.226 c5.6 ± 0.179 c16.8 ± 1.22 a
Cu6.47 ± 0.081 f7.71 ± 0.482 ef10.5 ± 0.485 d6.98 ± 0.230 ef19.5 ± 0.746 b24.3 ± 1.04 a15.1 ± 0.663 c8.56 ± 0.688 e
Cd0.084 ± 0.003 f0.336 ± 0.006 c0.463 ± 0.035 a0.178 ± 0.008 e0.404 ± 0.008 b0.498 ± 0.023 a0.257 ± 0.006 d0.156 ± 0.006 e
Pb1.06 ± 0.020 f1.00 ± 0.055 f3.25 ± 0.121 c1.45 ± 0.081 e8.65 ± 0.210 a4.74 ± 0.169 b4.66 ± 0.186 b2.04 ± 0.166 d
leavesCr3.48 ± 0.039 e7.49 ± 0.382 d15.46 ± 0.327 c15.8 ± 1.047 c52.4 ± 3.20 a9.53 ± 0.273 d35.8 ± 1.25 b36.9 ± 1.38 b
Ni1.33 ± 0.037 e2.71 ± 0.156 d5.03 ± 0.170 c4.92 ± 0.253 c15.3 ± 0.777 a3.06 ± 0.144 d11.2 ± 0.613 b10.9 ± 0.326 b
Cu6.28 ± 0.111 e6.40 ± 0.358 e7.49 ± 0.173 d6.54 ± 0.466 e11.2 ± 0.659 b13.0 ± 0.377 a8.58 ± 0.301 c6.60 ± 0.277 de
Cd0.008 ± 0.003 e0.012 ± 0.001 e0.061 ± 0.007 b0.032 ± 0.003 d0.109 ± 0.003 a0.044 ± 0.006 c0.040 ± 0.002 cd0.111 ± 0.004 a
Pb0.176 ± 0.004 e0.340 ± 0.017 de0.955 ± 0.025 c0.416 ± 0.036 d3.60 ± 0.232 a1.04 ± 0.028 c2.48 ± 0.109 b1.06 ± 0.040 c
Table 4. The bioconcentration, translocation and contamination factor of Cd, Cu, Cr, Ni and Pb in research sites.
Research SitesBCF TF CF
Where: The Highlighted Values Mean Concentration in Roots BiomassWhere: The Highlighted Values Mean Effective Metals Translocation within the PlantWhere: The Highlighted Values Mean Moderate or Considerable Contamination Factors
CrNiCuCdPbCrNiCuCdPbCrNiCuCdPb
POZ012.2910.9190.4120.2590.0780.1070.1350.9720.0880.1670.2380.3710.4040.7930.500
POZ024.4482.0850.7650.870.0840.1960.2410.8290.0380.3390.1440.1850.2570.9420.439
POZ030.7790.9760.4920.480.0820.4220.4880.7180.1330.2970.7310.3650.5432.3741.451
POZ049.6793.9071.1041.260.1840.2880.3120.9310.1760.2840.0950.1380.1620.3470.293
POZ050.1860.1710.2490.4770.0957.4284.0380.5720.2690.4180.6380.7622.0032.0693.369
POZ060.9730.4730.3370.4420.0970.460.4650.5350.090.2220.3570.4741.8532.7341.807
POZ072.0770.9850.7480.7970.1691.9561.9970.5690.1560.5320.1480.1970.5190.7871.027
POZ087.0042.6090.6680.590.130.6180.6660.7770.7120.530.1430.2180.3270.6520.573
Disclaimer/Publisher’s Note: The statements, opinions and data contained in all publications are solely those of the individual author(s) and contributor(s) and not of MDPI and/or the editor(s). MDPI and/or the editor(s) disclaim responsibility for any injury to people or property resulting from any ideas, methods, instructions or products referred to in the content.