Article

A Novel Operating State Evaluation Method for Photovoltaic Strings Based on TOPSIS and Its Application

1
China Datang Technological and Economic Research Institute Co., Ltd., Beijing 100040, China
2
Xi’an Xianlin Energy Technology Co., Ltd., Xi’an 710076, China
3
School of New Energy, North China Electric Power University, Beijing 102206, China
*
Author to whom correspondence should be addressed.
Sustainability 2023, 15(9), 7268; https://doi.org/10.3390/su15097268
Submission received: 1 March 2023 / Revised: 12 April 2023 / Accepted: 25 April 2023 / Published: 27 April 2023

Abstract

:
PV strings are essential for energy conversion in large-scale photovoltaic (PV) power plants. The operating state of PV strings directly affects the power generation efficiency and economic benefits of PV power plants. In the process of evaluating PV arrays, a reference array needs to be identified. By comparing PV arrays with the reference array, the operational status of the PV arrays can be evaluated. However, in the actual operation of PV power stations, it is difficult to directly determine the reference state of a PV array due to random fluctuations in the PV power output. In order to solve the problems mentioned above, this paper proposes a method to select the reference state and perform a grading evaluation of PV strings. Additionally, the proposed method is based on the Technique for Order Preference by Similarity to Ideal Solution (TOPSIS) algorithm, which is used to rank the performance of PV arrays to determine their status. In order to solve the problem of random fluctuations in PV power generation, a probability distribution model of the PV string conversion efficiency was built by using the kernel density estimation method. Then, the characteristic indicator of the PV string’s operating state was described by the output power of the PV string and its probability distribution model. Then, based on the operating characteristic indicator, the reference state of the PV string was determined using the TOPSIS method, and the grading evaluation of the operating state of the PV string was realized. Finally, the effectiveness of the proposed method was verified using the actual data of a PV power station.

1. Introduction

China’s photovoltaic power generation is developing rapidly. Data from the National Energy Administration of China show that, in 2021, the country’s newly installed capacity for PV power generation reached 54.880 million kWh, and the cumulative installed capacity reached 305.987 million kWh [1]. The increasing proportion of PV power generation in the energy structure has put forward new requirements in terms of operating state evaluation, fault diagnosis and intelligent operation. As core components of PV power plants, PV strings undertake the critical task of energy conversion, and their operating state will directly affect the overall power generation and economic benefits of PV power plants [2]. Therefore, it is very important to evaluate the operating state of PV strings.
The performance evaluation and fault identification of PV strings are key to the state analysis of PV strings. Currently, most PV system performance evaluation methods use specific evaluation indicators. Tahir et al. analyzed the variation in the conversion efficiency of photovoltaic modules of five technological routes under different environmental conditions [3]. Al-Ghussain et al. analyzed the accuracy of four PV module operating temperature calculation models considering wind speed based on the results of annual power generation and analyzed the effect of the cleaning frequency on annual power generation and the Levelized Cost of Energy (LCOE) [4]. Chabachi et al. evaluated the efficiency of PV power stations by using generated power, the performance ratio (PR), the capacity factor and loss indexes [5]. Ahmad Mohd Khalid et al. summarized the calculation method for the PR of PV power plants and its essential role in evaluating their power generation efficiency and environmental benefits [6]. Tamoor et al. used the results of PR calculations to determine the optimal installation inclination and spacing of PV arrays [7]. Tan et al. proposed a novel denoising convolutional-neural-network-based evaluation of the dust accumulation status of PV panels, which avoids the calculation of the PV system’s operating parameters and improves the efficiency of real-time monitoring [8]. Ramadan et al. improved the gradient-based optimizer (GBO) algorithm used for the parameter extraction of a PV module model [9]. Kun Ding et al. used deep belief networks for the feature extraction of I-V characteristic curves; Hausdorff distances and logistic functions were then used to construct health indicators for PV arrays. Finally, a triangular fuzzy membership function was used to rank the operational status of PV arrays [10]. Aktas et al. combined the “Analytic Hierarchy Process” and “Technique for Order Preference by Similarity to Ideal Solution” to propose a hybrid hesitant fuzzy decision-making approach. The test results show that the method can effectively evaluate the performance of PV arrays and is applicable to the siting of PV plants [11]. Qu et al. proposed an hourly weather status pattern recognition model based on unsupervised clustering and the multiclass GBDT-LR classification process for the complex and variable weather status, which further improves the timeliness and accuracy of the PV array status evaluation [12]. Karahüseyin et al. calculated the annual performance loss rate of PV plants for four-year outdoor exposure [13]. The above methods can be used to accurately analyze the overall operating state and efficiency of PV systems; however, there are few studies related to analyzing the operating state of PV strings based on conversion efficiency.
In recent years, machine learning algorithms have been widely used in the field of PV system state evaluation and fault identification and can mainly be classified as regression algorithms, classification algorithms and clustering algorithms. Majumdar et al. analyzed the electrical parameters of PV modules under different solar irradiance conditions, obtained their regression coefficients and then studied the influence of the atmospheric transparency index on the PV module’s PR [14]. Wang et al. realized the online fault diagnosis of PV modules by using the multiclass support vector algorithm of a multiclassification support vector machine [15]. Zhao et al. proposed a graph-based semi-supervised learning model that can detect faults and further identify the possible types of faults to speed up the recovery of the PV system [16]. Zhao et al. used the array current to extract the error function of the fault characteristics of the PV array and realized the fault diagnosis of the PV array using a probabilistic neural network (PNN); because the method relies on actual data, it is easy to apply in PV power stations [17]. Chen et al. improved the random forest algorithm and proposed an RF-based fault diagnosis model, followed by a grid-search method to optimize the model parameters. Both simulation and experimental results show that the method is effective for PV array fault diagnosis [18]. Cho et al. proposed a fault diagnosis method based on support vector machine classification to perform the fault diagnosis of PV generators using real operation data [19]. Adhya et al. examined the effectiveness of categorical boosting, light gradient boosting and extreme gradient boosting methods for PV array fault diagnosis. Compared with the random forest algorithm, the results show that these algorithms have a high fault diagnosis accuracy [20]. Wang et al. proposed a fault diagnosis model for PV arrays based on a logistic regression approach. The model parameters are obtained by minimizing the expected log-loss function under the worst-case probability distribution, which improves the robustness of fault diagnosis in the case of labeling errors in the PV array training data [21]. The accurate evaluation of the operational status of actual PV arrays is the basis for the fault diagnosis of PV arrays.
Determining the reference operating state of a PV string is helpful in analyzing the operating state of the PV string and evaluating its efficiency attenuation. In existing research, the theoretical model of a PV power plant provides a reference for the operating state evaluation. Arora et al. calculated the annual average PR based on the annual measurement data in 2018 and compared the calculated results with the simulation results of PVsyst software to quantitatively describe the power generation performance of PV power stations [22]. Manoharan Premkumar et al. used MATLAB/Simulink to analyze the mismatch loss of PV arrays in different shading modes, and the results are helpful in analyzing the operating state of PV systems [23]. Although there are many methods to improve the model or optimize the model parameters, the calculation of the theoretical model is complicated and cannot meet the needs of practical engineering applications. At the same time, it is difficult to determine the reference state of the PV string operation due to the randomness and volatility of the PV string’s output power and the uncertainty of measurement results.
The process of evaluating the PV string’s operating state can be abstracted as a multi-index decision-making problem, and the Technique for Order Preference by Similarity to Ideal Solution (TOPSIS) was first proposed by Hwang et al. [24]. The TOPSIS method firstly constructs the positive ideal solution and the negative ideal solution of each indicator in the problem, and the relative closeness of each scheme to the ideal scheme is calculated as the basis for evaluating the advantages and disadvantages. To date, TOPSIS has been widely used in PV power station site selection, PV-integrated building energy consumption evaluation and the PV grid impact’s comprehensive evaluation. For example, Rediske et al. used the GIS-AHP-TOPSIS comprehensive evaluation method to select the locations of large-scale PV power stations [25]. M. A. Ben Taher et al. took non-renewable usage (NRU), renewable usage (RU) and the loss of power supply probability (LPSP) as the optimization indicators. The TOPSIS method was used to optimize the capacity of the PV system to meet the load demand of public buildings and electric vehicles [26]. Amine Allouhi considered the Levelized Cost of Energy (LCOE) and the Cumulative Environmental Benefit (CEB). The genetic algorithm (GA) was used to identify the Pareto boundary, and the TOPSIS method was used to select the optimal scheme of PV power plant capacity allocation [27]. The TOPSIS method, as a commonly used multi-indicator decision-making method, has no strict restrictions on the data distribution. Therefore, this study used the TOPSIS method to determine the comprehensive evaluation of the operating state of PV strings.
Based on the above analysis, this paper proposes a new method for selecting the reference state and evaluating the operating state of PV strings. This method designs indicators that combine the distribution characteristics of the PV string conversion efficiency and the electrical characteristics of the string output to evaluate the operating state of PV strings and avoids the volatility and uncertainty of a single evaluation indicator. The section distribution in this paper is as follows: Section 2 introduces the method for establishing the distribution characteristic model of conversion efficiency for PV strings; Section 3 describes the principle of the TOPSIS method and describes in detail the steps of the reference-state selection and operating state evaluation method for the PV string series’ operation. In Section 4, the effectiveness of the proposed method is verified by actual operation data from a PV power station.

2. Distribution Characteristics of Conversion Efficiency

The conversion efficiency, η P V _ S t r i n g , can be defined as the ratio of the output power of the PV string to the received solar irradiance, which can be used to evaluate the operating state of the PV string, and it can be defined as [3]:
η P V _ S t r i n g = P a c t G A × 100 %
where P a c t is the output power of the PV string, kW; A is the nominal total area of the PV string, m2; and G is the global solar irradiance intensity received by the PV string, kW/m2, which can be measured with a solar radiation meter that has the same inclination as the PV array.
The actual operation data of a PV power station were used for analysis. The PV plant contains 50 PV arrays, and each array is composed of two inverters connected in parallel. Each inverter is connected to 12 combiner boxes, and 1 combiner box is connected to 14–16 strings; each of the PV strings has an installed capacity of 5.4 kW.
According to the definition of conversion efficiency and the product manual provided by PV module manufacturers, η P V _ S t r i n g should generally be around 0.17. However, due to uncertainty factors, such as the measurement error and fluctuation of solar irradiance, η P V _ S t r i n g fluctuates sharply. As shown in Figure 1, during the morning time or evening time, η P V _ S t r i n g fluctuates greatly, with an abnormally high value of 0.8. Therefore, more than a single short-time conversion efficiency indicator is needed to accurately evaluate the operating state of PV strings on the intra-day time scale.
Figure 2 shows the histogram distribution of η P V _ S t r i n g for six PV strings in Array No. 1 from a PV power station from 31 March 2022 to 5 April 2022, and the time resolution is 10 min. As can be seen in the figure, the frequency corresponding to the highest point in the histogram of different strings is different, and the value range of the corresponding conversion efficiency is also different, which indicates that the distribution of η P V _ S t r i n g is significantly different. Therefore, statistical analysis can effectively distinguish the operating states of different PV strings.
The kernel density estimation (KDE) method is a popular method for probability distribution modeling, which requires a small amount of prior knowledge and can be used when the probability density function is uncertain. Specifically, assuming that the sample of the random variable is X = x 1 , x 2 , , x n , the probability density function of the random variable at any point can be expressed as [28]:
f ( x ) = 1 N h i = 1 n K x X i h
where h is the bandwidth, N is the number of samples, and K ( · ) is the kernel function.
Considering the accessibility of the distribution function fitting process, the Gaussian kernel function is generally used as the kernel function, so the probability density function of Gaussian kernel density estimation is [28]:
f ( x ) = 1 N h i = 1 n 1 2 π e 1 2 x X i h 2
Figure 3 shows six PV strings’ probability density curves of η P V _ S t r i n g selected from PV Array No. 1; the higher the peak value of the curve, the more concentrated the distribution of η P V _ S t r i n g . In the case of the same or a similar peak value, the larger the peak position, the better the PV string’s operating state. There are apparent differences in the peak height and position of each PV string. Therefore, the extraction and analysis of the characteristic indicator of the probability density function (PDF) of η P V _ S t r i n g can effectively capture the operating state of the PV string from the aspects of efficiency and stability. Therefore, the peak height and the corresponding position of the PDF curve of η P V _ S t r i n g are taken as indicators to select the reference string and evaluate the operating state. 
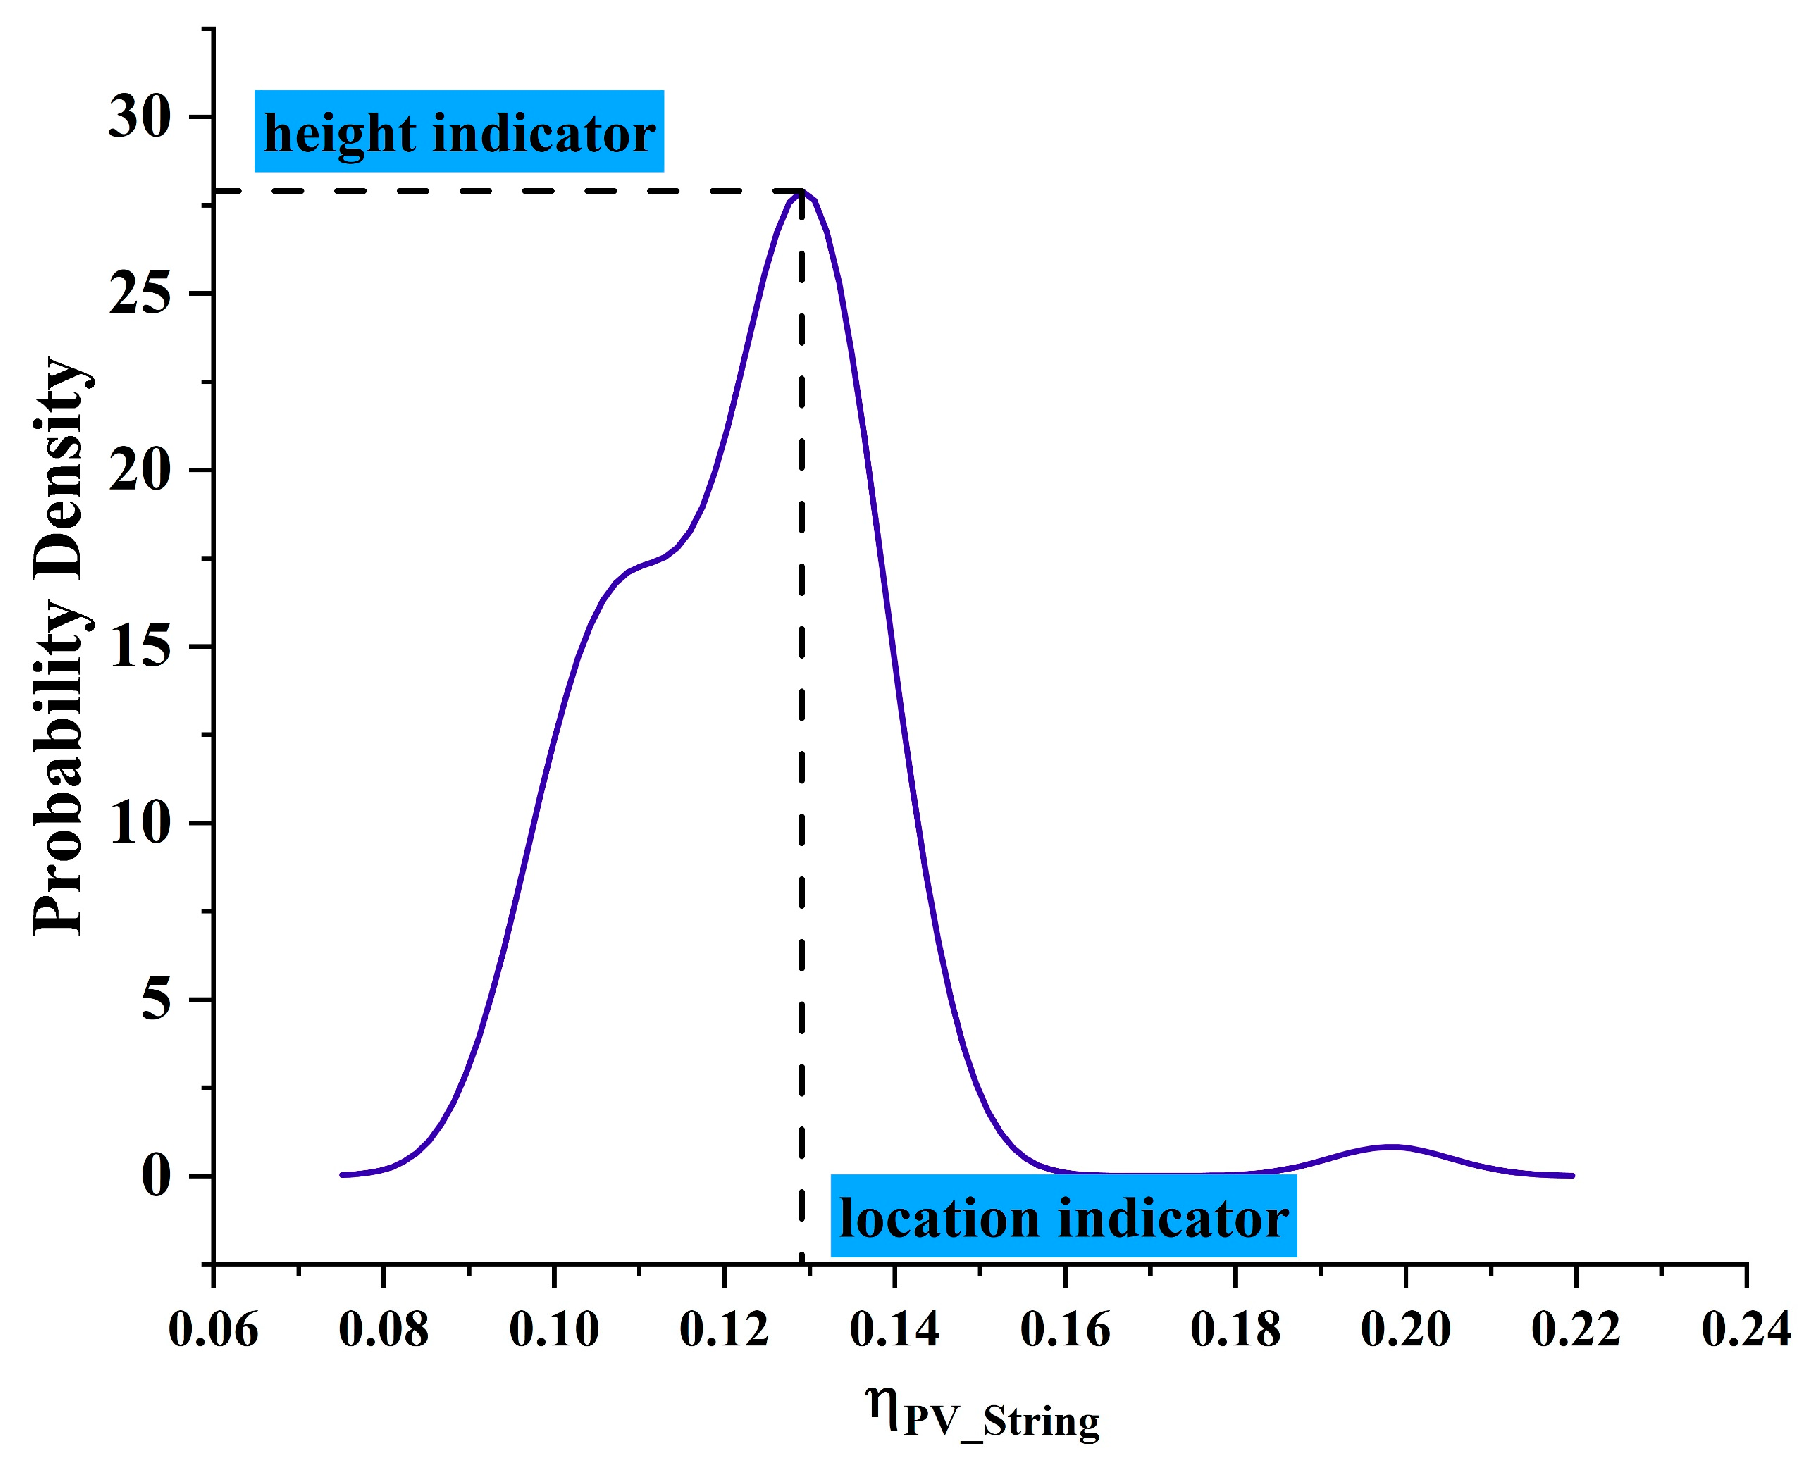
Figure 4 shows the height and position indicators for the PDF curve of η P V _ S t r i n g .

3. Selection for Reference State of PV Strings

3.1. Proposed Method

The proposed process of the operation reference-state selection and state classification evaluation method for PV strings is shown in Figure 5.
The specific steps of the method are as follows:
Step 1. Select evaluation indicators.
Supposing there are m PV strings; according to the output characteristics of the PV strings and statistical analysis for η P V _ S t r i n g , the method in this paper selects the output power of the PV strings and the height and position indicators of the PDF curve for η P V _ S t r i n g as comprehensive evaluation indicators.
Step 2. Construct a weighted decision matrix.
a. Data preprocessing
The initial decision matrix is formed after the evaluation indicator is selected. Then, the corresponding data of each evaluation indicator are standardized. Taking all the strings from the PV station on 4 April 2022 as an example, the relationship between the height indicator and the location indicator of the PDF curve of η P V _ S t r i n g is shown in Figure 6:
According to the analysis results in Section 2, the larger the location indicator, the larger the height indicator: that is, the closer the point to the upper right in Figure 6, the better the operating state of the PV string. Therefore, the electrical indicator, location indicator and height indicator are all beneficial indicators. According to Formula (4), the indicator data are standardized to obtain the standard decision matrix.
b. Construction of the weighted decision matrix
The weights of the three indicators in the standard decision matrix are calculated based on the CRITIC method. Firstly, the variability, namely, the standard deviation of each indicator’s data, is calculated. Then, the conflict, namely, the correlation coefficient between indicators, is calculated. Then, the weight of each indicator is calculated according to Formula (13). Finally, the weighted decision matrix is obtained by calculating the quantitative product between the weight coefficient and the standard decision matrix.
Step 3. Select the operational reference state of PV strings.
The weighted decision matrix is used as the input of the TOPSIS algorithm; the maximum value of each indicator is taken as the positive ideal solution, and the minimum value is taken as the negative ideal solution. The Euclidean distances between the indicator vectors corresponding to each PV string and the positive and negative ideal solutions are calculated. Then, the relative closeness of each indicator vector is calculated according to Formula (9), and the indicator vector corresponding to the PV string with the largest relative closeness is taken as the reference state of the PV strings.
Step 4. Operating state evaluation for PV strings.
For random variables with normal distributions, about 68.3% of the absolute deviation falls within the range of plus or minus one standard deviation. About 90.1% falls within 1.65 times the standard deviation. About 95% falls within the range of two standard deviations. Therefore, in this paper, the relative closeness of indicator vectors corresponding to the PV strings calculated in step (3) is a subtraction from the relative closeness of the reference-state string within the same segment and in the same array, and the difference value Δ f i is taken as the basis for the operating state evaluation.
The difference Δ f i in relative closeness between the reference-state string and other strings in the same array in one day is calculated. According to the above analysis, the absolute value of the absolute deviation of Δ f i , Δ f i Δ f i ¯ was calculated. After that, threshold values of 1, 2 and 3 (1, 1.65 and 2 times the standard deviation of Δ f i Δ f i ¯ ) were calculated to determine the evaluation grades of excellent, good, medium and poor operating states of PV strings.
After the threshold was calculated, the absolute deviation of each string Δ f i Δ f i ¯ was divided according to the determined threshold. The specific evaluation grade division rules are as follows:
Excellent state: Δ f i Δ f i ¯ is less than threshold 1;
Good state: Δ f i Δ f i ¯ is greater than threshold 1 and less than threshold 2;
Medium state: Δ f i Δ f i ¯ is greater than threshold 2 and less than threshold 3;
Poor state: Δ f i Δ f i ¯ is greater than threshold 3.

3.2. Principle of TOPSIS

The principle of the comprehensive evaluation using the TOPSIS method is as follows [29]:
  • Establish the performance evaluation matrix.
  • Calculate the weighted decision matrix.
Firstly, the indicator data are normalized:
n i j = x i j min ( x i j ) max ( x i j ) min ( x i j ) , i = 1 , 2 , , m , j = 1 , 2 , , n
Then, the weighted decision matrix is calculated according to the indicator weight:
ν i j = ω j n i j , i = 1 , 2 , , m , j = 1 , 2 , , n
3.
Determine the positive ideal solution and the negative ideal solution.
A + = ν 1 + , , ν n + = max i   ν i j , j J max i   ν i j , j J , i = 1 , 2 , , m A = ν 1 , , ν n = min i   ν i j , j J min i   ν i j , j J , i = 1 , 2 , , m
4.
Calculate the distance indicator.
The distance between the scheme to be evaluated and the positive ideal solution is:
d i + = j = 1 n ν i j ν j + 2 1 2 , i = 1 , 2 , , m
The distance between the scheme to be evaluated and the negative ideal solution is:
d i = j = 1 n ν i j ν j 2 1 2 , i = 1 , 2 , , m
5.
Calculate the relative closeness.
R i = d i d i + + d i , i = 1 , 2 , , m
6.
Sort the performance according to the relative closeness.
R i = 1 A i = A + R i = 0 A i = A

3.3. Method for Calculating the Weight of Indicators

The Criteria Importance Though Intercriteria Correlation (CRITIC) method is used to objectively determine the weights of evaluation indicators, which are determined according to the evaluation of the variability and conflict among the selected indicators in the decision problem. In contrast to the subjective weighting method, the CRITIC weighting method does not require the decision maker to make a subjective judgment, thus avoiding the possibility of biased results. The steps for calculating indicator weights using the CRITIC method are as follows [30]:
I. The indicator variability, namely, the standard deviation of each indicator’s data, is calculated as follows:
S j = 1 n 1 i = 1 n ( x i j x ¯ j ) 2
II. The indicator conflict is calculated and expressed as the correlation coefficient. The calculation method is as follows:
R j = i = 1 p 1 r i j
where r i j is the correlation coefficient between the i th and j th indicators.
III. The weights of indicators can be calculated by:
ω j = S j × R j j = 1 p S j × R j

4. Results Analysis and Discussion

4.1. Rationality Analysis of Reference-State Selection

The comprehensive evaluation method described in Section 3 was used to determine the reference string. According to the analysis of the statistical characteristics of η P V _ S t r i n g in Section 2, the comprehensive indicator combining electrical and statistical indicators of PV strings was selected as the evaluation indicator.
Global horizontal irradiance (GHI) and the output power of PV strings were sampled. Then, the actual output power of the strings was used to calculate η P V _ S t r i n g every 10 min. Then, the distribution of η P V _ S t r i n g was calculated by KDE, and its height and position indicators were extracted. The height, position indicator and output power of the strings were used as the input of the TOPSIS evaluation algorithm. Based on the output results, the rationality of the reference-state selection and state evaluation method was analyzed.
Taking the operation data on 6 April 2022 from PV Array No. 1 as an example, the indicator weights determined by the CRITIC weighting method are shown in Table 1.
The calculation results of the relative closeness of each PV string are shown in Figure 7.
It can be seen in Figure 7 that the values of relative closeness are mainly within 0.2–0.8. As mentioned in Section 3.2, the greater the relative closeness, the better the corresponding operating state of the PV string. The PV string with the maximum value is the selected reference-state string.
Therefore, S127 is the final selected reference-state array. The relative closeness, height indicator and position indicator values of S127 are shown in Table 2.
In order to verify the rationality of the selected reference-state PV string, the deviation between the actual and theoretical daily output power of each string is calculated, and the deviation of the reference-state string is compared and analyzed with those of other strings in Array No. 1.
The theoretical output power for the PV string calculation method is as follows [31]:
p t h = p e G
where p e is the installed capacity of the PV string, kW.
The analysis results are shown in Table 3.
The output power curve of PV strings and the relative deviation curve between the actual and theoretical output power for PV strings are shown in Figure 8.
Figure 8a shows the comparison of the output power of PV strings in Array No. 1 on 6 April 2022. The red dotted line is the selected reference-state string S127. The maximum output power of each string is between 4000 and 5000 W, and the fluctuation of the output power in each PV string is different throughout the day. The reference-state string S127 has a large output power, and the power output is stable throughout the day without drastic fluctuations. Figure 8b shows the comparison of the relative deviation between the actual and theoretical output power of the PV strings. It can be seen in Figure 8b that the absolute value of the relative deviation and volatility of the reference-state string S127 are significantly smaller than those of other groups in the same array.
In terms of the quantitative description, as shown in Table 3, the maximum relative deviation and average relative deviation of the actual and theoretical output power for the reference-state string S127 are significantly better than the average values for other strings, and the similarity to the theoretical output power curve is the strongest. This indicates that the actual output power of S127 is the closest to its theoretical output power, and its operating state is significantly better than that of other strings. In conclusion, the reference-state PV string selection method proposed in this paper is reasonable and effective.
A statistical analysis of the reference-state string selection results for 50 arrays in the whole station was performed. By calculating the normalized root-mean-square error (nRMSE) and cosine similarity between the reference PV string and the theoretical output power, the performance of the proposed reference-state string selection method (CRITIC + TOPSIS) was compared with that of the maximum power generation method ( E max ), the maximum conversion efficiency mean method ( η P V _ s t r i n g _ a v g , max ) and the equal-weight TOPSIS method (eq.weight TOPSIS). The results are shown in Figure 9.
In Figure 9, the performance of the reference-state PV string selected by the proposed method is significantly better than that of E max and η P V _ S t r i n g _ a v g , max and slightly better than that of the eq.weight TOPSIS method: the nRMSE of the proposed method has a smaller error fluctuation range and mean value, and the cosine similarity is greater. It can be proven that the reference-state string proposed in this paper is reasonable and effective.

4.2. Evaluation of Operating State of PV Strings

4.2.1. Determining the Grading Threshold

The actual operation data of PV strings for the whole station on 6 April 2022 were taken as an example for the analysis. Table 4 lists the analysis results of the grading thresholds. The grading thresholds of six PV arrays are different, indicating that the characteristics of different arrays are different, and different thresholds need to be set for them.

4.2.2. Grading Evaluation of Operating State of PV Strings

In order to verify the rationality and effectiveness of the operating state evaluation method for PV strings, the actual operation data from six PV arrays on 6 April 2022 were taken as an example, and the proportion of strings graded with different state grades was calculated; the results are shown in Figure 10. Figure 10 illustrates that the proposed method can classify the operational status of PV strings.
In order to better describe the operating state differences among the four grades, the PV strings in Array No. 6 on 6 April 2022 were analyzed to compare the output characteristics of the four grade strings. The comparison indicators include the conversion efficiency η P V _ S t r i n g , output power, daily utilization hours and output current of the PV strings, and Figure 11 shows the comparison results. There are significant differences in the output characteristic indicator performance of each grade. From an excellent grade to a poor grade, the conversion efficiency, output power, daily utilization hours and output current gradually deteriorate, and the fluctuation gradually increases.
To summarize, the operating state evaluation method proposed in this paper is reasonable and effective. It can be used to evaluate the operating state of PV strings in terms of their output and operating stability.

4.3. Discussion

The above analysis proves the effectiveness of the proposed method in selecting the reference state of PV strings by comparing it with the E max , η P V _ s t r i n g _ a v g , max and eq.weight TOPSIS methods. Through a multiple-indicator analysis, it is shown that the proposed method can effectively classify a PV string’s operating state. Through the above analysis, it is feasible to classify the operating states of PV stings using characteristic information of the PV string’s output power and conversion efficiency.

5. Conclusions

In order to resolve the difficulty of state evaluation for PV strings, a PV string operational reference-state selection method is proposed. Based on the objective weighted TOPSIS method, this method takes the characteristics of the PDF curve of η P V _ S t r i n g of the PV strings. The average daily output power of PV strings was also one of the evaluation indicators. The proposed method can effectively select the reference PV string from the perspective of the deviation and stability of the output power and then grade the operating state of PV strings.
The main work in this paper includes:
I. The probability distribution model of the PV strings’ conversion efficiency was established by using the KDE method, and the comprehensive evaluation indicator was established by using the model characteristic indicator and the output power of PV strings.
II. The TOPSIS method was used to select the reference-state PV string, and the grading evaluation of the operating state of PV strings was realized based on the statistical distribution of the differences in relative closeness.
III. The rationality and effectiveness of the proposed evaluation method were verified by using the actual operation data of a grid-connected PV power station. In addition, the method proposed in this paper is driven by the actual operation data of PV power stations and is an online evaluation method, which reduces the overall loss of power generated by the power station.
The limitations of this paper and future research include the following: data anomalies have an impact on the proposed method, and anomalous data elimination should be used to improve the performance of the method; the faults in the strings graded as poor should be analyzed, and then the fault diagnosis of the PV array can be realized. In the future, we will continue the above research and improve the performance of the method under data-deficient conditions.

Author Contributions

Conceptualization, H.Z.; Methodology, Z.W., Y.L. (Yinnan Liu) and H.W.; Software, L.P. and A.W.; Validation, S.S. and Y.L. (Yongjun Lian); Data Curation, Z.W.; Writing—S.S.; Writing—Review and Editing, H.Z.; Project Administration and Funding Acquisition, X.L. All authors have read and agreed to the published version of the manuscript.

Funding

This research received no external funding.

Institutional Review Board Statement

Not applicable.

Informed Consent Statement

Not applicable.

Data Availability Statement

Not applicable.

Acknowledgments

The authors would like to acknowledge the financial support from China Datang Technological and Economic Research Institute Co., Ltd.

Conflicts of Interest

The authors declare no conflict of interest.

References

  1. Construction and Operation of Photovoltaic Power Generation in 2021—National Energy Administration (Chinese) [EB/OL]. Available online: http://www.nea.gov.cn/2022-03/09/c_1310508114.htm (accessed on 9 March 2023).
  2. Yao, S.; Kang, Q.; Zhou, M.; Abusorrah, A.; Al-Turki, Y. Intelligent and Data-Driven Fault Detection of Photovoltaic Plants. Processes 2021, 9, 1711. [Google Scholar] [CrossRef]
  3. Tahir, Z.R.; Kanwal, A.; Asim, M.; Bilal, M.; Abdullah, M.; Saleem, S.; Mujtaba, M.A.; Veza, I.; Mousa, M.; Kalam, M.A. Effect of Temperature and Wind Speed on Efficiency of Five Photovoltaic Module Technologies for Different Climatic Zones. Sustainability 2022, 14, 15810. [Google Scholar] [CrossRef]
  4. Al-Ghussain, L.; Subaih, M.A.; Annuk, A. Evaluation of the Accuracy of Different PV Estimation Models and the Effect of Dust Cleaning: Case Study a 103 MW PV Plant in Jordan. Sustainability 2022, 14, 982. [Google Scholar] [CrossRef]
  5. Chabachi, S.; Necaibia, A.; Abdelkhalek, O.; Bouraiou, A.; Ziane, A.; Hamouda, M. Performance analysis of an experimental and simulated grid connected photovoltaic system in southwest Algeria. Int. J. Energy Environ. Eng. 2022, 13, 831–851. [Google Scholar] [CrossRef]
  6. Khalid, A.M.; Mitra, I.; Warmuth, W.; Schacht, V. Performance ratio—Crucial parameter for grid connected PV plants. Renew. Sustain. Energy Rev. 2016, 65, 1139–1158. [Google Scholar] [CrossRef]
  7. Tamoor, M.; Habib, S.; Bhatti, A.R.; Butt, A.D.; Awan, A.B.; Ahmed, E.M. Designing and Energy Estimation of Photovoltaic Energy Generation System and Prediction of Plant Performance with the Variation of Tilt Angle and Interrow Spacing. Sustainability 2022, 14, 627. [Google Scholar] [CrossRef]
  8. Tan, Y.; Liao, K.; Bai, X.; Deng, C.; Zhao, Z.; Zhao, B. Denoising Convolutional Neural Networks Based Dust Accumulation Status Evaluation of Photovoltaic Panel. In Proceedings of the 2019 IEEE International Conference on Energy Internet, Nanjing, China, 27–31 May 2019; pp. 560–566. [Google Scholar]
  9. Ramadan, A.; Kamel, S.; Hassan, M.H.; Tostado-Véliz, M.; Eltamaly, A.M. Parameter Estimation of Static/Dynamic Photovoltaic Models Using a Developed Version of Eagle Strategy Gradient-Based Optimizer. Sustainability 2021, 13, 13053. [Google Scholar] [CrossRef]
  10. Ding, K.; Chen, X.; Weng, S.; Liu, Y.; Zhang, J.; Li, Y.; Yang, Z. Health status evaluation of photovoltaic array based on deep belief network and Hausdorff distance. Energy 2023, 262, 125539. [Google Scholar] [CrossRef]
  11. Aktas, A.; Kabak, M. A Hybrid Hesitant Fuzzy Decision-Making Approach for Evaluating Solar Power Plant Location Sites. Arab. J. Sci. Eng. 2019, 44, 7235–7247. [Google Scholar] [CrossRef]
  12. Qu, J.; Qian, Z.; Pei, Y.; Wei, L.; Zareipour, H.; Sun, Q. An unsupervised hourly weather status pattern recognition and blending fitting model for PV system fault detection. Appl. Energy 2022, 319, 119271. [Google Scholar] [CrossRef]
  13. Karahüseyin, T.; Abbasoğlu, S. Performance Loss Rates of a 1 MWp PV Plant with Various Tilt Angle, Orientation and Installed Environment in the Capital of Cyprus. Sustainability 2022, 14, 9084. [Google Scholar] [CrossRef]
  14. Majumdar, D.; Pal, S.B.; Ganguly, R. New PV metrology for performance appraisal of poly-silicon PV modules in eastern Indian climatic zone. Renew. Energy Power Qual. J. 2021, 19, 333–337. [Google Scholar] [CrossRef]
  15. Wang, L.; Liu, J.; Guo, X.; Yang, Q.; Yan, W. Online Fault Diagnosis of Photovoltaic Modules Based on Multi-Class Support Vector Machine. In Proceedings of the 2017 Chinese Automation Congress, Jinan, China, 20–22 October 2017; pp. 4569–4574. [Google Scholar]
  16. Zhao, Y.; Ball, R.; Mosesian, J.; de Palma, J.-F.; Lehman, B. Graph-Based Semi-supervised Learning for Fault Detection and Classification in Solar Photovoltaic Arrays. IEEE Trans. Power Electron. 2015, 30, 2848–2858. [Google Scholar] [CrossRef]
  17. Zhao, J.; Sun, Q.; Zhou, N.; Liu, H.; Wang, H. A Photovoltaic Array Fault Diagnosis Method Considering the Photovoltaic Output Deviation Characteristics. Int. J. Photoenergy 2020, 2020, 2176971. [Google Scholar] [CrossRef]
  18. Chen, Z.; Han, F.; Wu, L.; Yu, J.; Cheng, S.; Lin, P.; Chen, H. Random Forest based intelligent fault diagnosis for PV arrays using array voltage and string currents. Energy Convers. Manag. 2018, 178, 250–264. [Google Scholar] [CrossRef]
  19. Cho, K.-H.; Jo, H.-C.; Kim, E.-S.; Park, H.-A.; Park, J.H. Failure Diagnosis Method of Photovoltaic Generator Using Support Vector Machine. J. Electr. Eng. Technol. 2020, 15, 1669–1680. [Google Scholar] [CrossRef]
  20. Adhya, D.; Chatterjee, S.; Chakraborty, A.K. Performance assessment of selective machine learning techniques for improved PV array fault diagnosis. Sustain. Energy Grids Netw. 2022, 29, 100582. [Google Scholar] [CrossRef]
  21. Wang, M.; Xu, X.; Yan, Z. Online fault diagnosis of PV array considering label errors based on distributionally robust logistic regression. Renew. Energy 2023, 203, 68–80. [Google Scholar] [CrossRef]
  22. Arora, R.; Arora, R.; Sridhara, S.N. Performance assessment of 186 kWp grid interactive solar photovoltaic plant in Northern India. Int. J. Ambient. Energy 2022, 43, 128–141. [Google Scholar] [CrossRef]
  23. Premkumar, M.; Subramaniam, U.; Babu, T.S.; Elavarasan, R.M.; Mihet-Popa, L. Evaluation of Mathematical Model to Characterize the Performance of Conventional and Hybrid PV Array Topologies under Static and Dynamic Shading Patterns. Energies 2020, 13, 3216. [Google Scholar] [CrossRef]
  24. Hwang, C.-L.; Yoon, K. Methods for Multiple Attribute Decision Making; Springer: Berlin/Heidelberg, Germany, 1981; pp. 58–191. [Google Scholar]
  25. Rediske, G.; Siluk, J.C.M.; Michels, L.; Rigo, P.D.; Rosa, C.B.; Cugler, G. Multi-criteria decision-making model for assessment of large photovoltaic farms in Brazil. Energy 2020, 197, 117167. [Google Scholar] [CrossRef]
  26. Ben Taher, M.A.; Lebrouhi, B.E.; Mohammad, S.; Schall, E.; Kousksou, T. Multi-objective optimization of a grid-connected PV system for a public building: Faculty of Sciences and Technology at Pau. Clean Technol. Environ. Policy 2022, 24, 2837–2849. [Google Scholar] [CrossRef]
  27. Allouhi, A. Solar PV integration in commercial buildings for self-consumption based on life-cycle economic/environmental multi-objective optimization. J. Clean. Prod. 2020, 270, 122375. [Google Scholar] [CrossRef]
  28. Zhang, K.; Yu, X.; Liu, S.; Dong, X.; Li, D.; Zang, H.; Xu, R. Wind power interval prediction based on hybrid semi-cloud model and nonparametric kernel density estimation. Energy Rep. 2022, 8, 1068–1078. [Google Scholar] [CrossRef]
  29. Sánchez-Lozano, J.M.; García-Cascales, M.S.; Lamata, M.T. Comparative TOPSIS-ELECTRE TRI methods for optimal sites for photovoltaic solar farms. Case study in Spain. J. Clean. Prod. 2016, 127, 387–398. [Google Scholar] [CrossRef]
  30. Khargotra, R.; Kumar, R.; András, K.; Fekete, G.; Singh, T. Thermo-hydraulic characterization and design optimization of delta-shaped obstacles in solar water heating system using CRITIC-COPRAS approach. Energy 2022, 261, 125236. [Google Scholar] [CrossRef]
  31. Zhu, H.; Lian, W.; Lu, L.; Kamunyu, P.; Yu, C.; Dai, S.; Hu, Y. Online Modelling and Calculation for Operating Temperature of Silicon-Based PV Modules Based on BP-ANN. Int. J. Photoenergy 2017, 2017, 6759295. [Google Scholar] [CrossRef]
Figure 1. Comparison of conversion efficiency for PV strings. (a) η P V _ S t r i n g for one day; (b) η P V _ S t r i n g for six day.
Sustainability 15 07268 g001
Figure 2. Histograms of η P V _ S t r i n g . (a) S24; (b) S88; (c) S56; (d) S72; (e) S8; (f) S40.
Sustainability 15 07268 g002
Figure 3. Comparison of probability density distributions of η P V _ S t r i n g .
Sustainability 15 07268 g003
Figure 4. Selection of height and location indicators of PDF curve.
Sustainability 15 07268 g004
Figure 5. Flow chart of reference-state selection and state evaluation method for PV strings.
Sustainability 15 07268 g005
Figure 6. Scatter diagram for height indicator and location indicator.
Sustainability 15 07268 g006
Figure 7. Calculation results of relative closeness.
Sustainability 15 07268 g007
Figure 8. Output power of PV strings and relative deviation from theoretical output power. (a) Output Power of PV string; (b) Relative deviation from theoretical output power.
Sustainability 15 07268 g008
Figure 9. nRMSE and cosine similarity results of different methods. (a) nRMSE; (b) Cosine Similarity.
Sustainability 15 07268 g009
Figure 10. Comparison of the ratio of the number of strings for four grades in the arrays.
Sustainability 15 07268 g010
Figure 11. Comparison of different grading results. (a) Conversion Efficiency; (b) Output Power of PV strings; (c) daily Utilization Hours; (d) Output Current of PV strings.
Sustainability 15 07268 g011
Table 1. Calculation results of indicator weights.
Electrical IndicatorHeight IndicatorLocation Indicator
0.15260.59560.2518
Table 2. Statistical indicators of the reference-state string.
String NumberRelative ClosenessHeight IndicatorLocation Indicator
S1270.958871.31030.1319
Table 3. Comparison of deviation between actual and theoretical output indicator values.
Indicator ValueReference-State String (S127)Average Value of Other Strings in the Array
Maximum Relative Deviation (%)17.3321.18
Average Relative Deviation (%)10.1010.51
Relative Coefficient0.9990.998
Table 4. Analysis results of the grading thresholds.
PV Array Num.th1th2th3
A10.108 0.178 0.216
A20.129 0.213 0.258
A30.106 0.175 0.212
A40.092 0.152 0.185
A50.099 0.164 0.199
A60.099 0.163 0.198
Disclaimer/Publisher’s Note: The statements, opinions and data contained in all publications are solely those of the individual author(s) and contributor(s) and not of MDPI and/or the editor(s). MDPI and/or the editor(s) disclaim responsibility for any injury to people or property resulting from any ideas, methods, instructions or products referred to in the content.

