Article

Tourism Demand Prediction after COVID-19 with Deep Learning Hybrid CNN–LSTM—Case Study of Vietnam and Provinces

1
Department of Tourism Management, Business Intelligence School, National Kaohsiung University of Science and Technology, Kaohsiung 807618, Taiwan
2
Faculty of Economics and Management, Thai Binh Duong University, Khanh Hoa 650000, Vietnam
3
The International Master’s Program of Tourism and Hospitality, National Kaohsiung University of Hospitality & Tourism, Kaohsiung 812301, Taiwan
4
Department of Public Finance and Taxation, Business Intelligent School, National Kaohsiung University of Science and Technology, Kaohsiung 807618, Taiwan
5
Department of Electrical Engineering, National Kaohsiung University of Science and Technology, Kaohsiung 807618, Taiwan
6
Department of Electronic–Electrical Engineering, Nha Trang University, Khanh Hoa 650000, Vietnam
*
Author to whom correspondence should be addressed.
Sustainability 2023, 15(9), 7179; https://doi.org/10.3390/su15097179
Submission received: 11 February 2023 / Revised: 18 April 2023 / Accepted: 19 April 2023 / Published: 25 April 2023

Abstract

:
The tourism industry experienced a positive increase after COVID-19 and is the largest segment in the foreign exchange contribution in developing countries, especially in Vietnam, where China has begun reopening its borders and lifted the pandemic limitation on foreign travel. This research proposes a hybrid algorithm, combined convolution neural network (CNN) and long short-term memory (LSTM), to accurately predict the tourism demand in Vietnam and some provinces. The number of new COVID-19 cases worldwide and in Vietnam is considered a promising feature in predicting algorithms, which is novel in this research. The Pearson matrix, which evaluates the correlation between selected features and target variables, is computed to select the most appropriate input parameters. The architecture of the hybrid CNN–LSTM is optimized by utilizing hyperparameter fine-tuning, which improves the prediction accuracy and efficiency of the proposed algorithm. Moreover, the proposed CNN–LSTM outperformed other traditional approaches, including the backpropagation neural network (BPNN), CNN, recurrent neural network (RNN), gated recurrent unit (GRU), and LSTM algorithms, by deploying the K-fold cross-validation methodology. The developed algorithm could be utilized as the baseline strategy for resource planning, which could efficiently maximize and deeply utilize the available resource in Vietnam.

1. Introduction

The development of the tourism industry could improve the enhancement of transportation, infrastructure, cuisine, and economy of the country [1]. In Southeast Asia, the tourism industry mainly contributes to the economic development of some developing countries. The tourism industry is considered a leading section to enrich the national economy in developing countries, especially in Vietnam, which was equivalent to 13.9% of its GDP [2]. In Indonesia, the tourism industry is the second largest contributor to the national economy, after palm oil [3].
Vietnam’s tourism industry has a promising future and Vietnam recently became an emerging harbor in Southeast Asia, which received millions of international tourism arrivals each year. The tourism industry has kept increasing every year and significantly contributed to the country’s GDP. Moreover, the number of direct works by the tourism industry accounted for 5.2% of total employment in Vietnam and 5.6% of total jobs in Indonesia [2,3]. The number of domestic tourists has also increased monthly due to the expansion of the middle class. Before 2019, the GDP contribution of the tourism industry in the Southeast Asia region was growing annually, but it was seriously affected in the 2020–2021 period due to the COVID-19 pandemic. The tourism contribution of Vietnam in 2021 was approximately two percent, which demonstrated a sharp decrease because of the impact of the pandemic.
From the beginning of 2023, the tourism industry has gradually recovered after the COVID-19 pandemic and showed positive growth in Southeast Asia, especially when China began to reopen its borders and lifted its restriction on foreign traveling. Therefore, some Southeast Asian countries need to prepare strategic plans to recover their tourism industry. Improving tourism potential can be achieved by marketing, enhancing the attractive destination development, and traditional festivals. However, the strategic plan is the critical method to recover Vietnam’s tourism competitiveness within the international environment. The collaboration between government and private companies for preparing tourism strategies is a substantial concern in reviving the tourism industry in Southeast Asia countries. Therefore, this research proposed a hybrid algorithm, combining a convolution neural network and long short-term memory, to accurately predict the tourism demand in Vietnam and some provinces. The research output will provide relevant information for the government, policymakers, business practitioners, and travel agencies in preparing the plan and decision-making in developing strategies, which aim to restore the tourism industries after the COVID-19 pandemic in Vietnam.

1.1. Previous Works

Much research in tourism prediction has been developed into time-series algorithms with traditional neural network approaches and deep learning methodology. Andry and Putu proposed the artificial neural network (ANN) to predict the tourism demand in Indonesia with the GDP, CPI, and five major tourism countries [3]. The performance outputs showed 99.84% accuracy and 0.00339% at epoch 15 during the training operation. Moreover, the optimum performance of ANN was achieved with one single hidden layer and 31 neural nodes, which generated the lowest error compared with MRA, SVM, and ARIMA algorithms. Assaf et al. proposed the Bayesian global vector autoregressive methodology to predict the tourism demand in nine countries in Southeast Asia [4]. The developed algorithm demonstrated its superiority through one- to four-quarters-ahead prediction, which demonstrated that an increase in international commercial growth could expand the tourism demand in Southeast Asia countries. Prosper and Ryan developed the autoregressive mixed-data sampling (AR-MIDAS) model to forecast tourism demand by utilizing Google trend search data [5]. The trend data combined with developed AR-MIDAS outperformed the SARIMA and AR methodologies, which could provide reliable information for policymakers in their planning strategies. The experiment results proved that the search information, such as travel plans, destination hotels or restaurants, traditional festivals, and flights to destination countries, could indicate potential tourism demand.
Tea and Maja suggested the autoregressive integrated moving average (ARIMA) methodology to forecast the German tourism demand in Croatia [6]. The suggested methodology proved a high accuracy forecasting methodology, which achieved 9.32 and 3.80 MAPE indicators. Cai et al. developed the optimized support vector regression (G-SVR), which deployed a genetic algorithm in searching optimized SVR architectures and utilized SVR in predicting the tourism demand [7]. The output presented that the developed G-SVR achieved higher MAPE benchmarks compared with the BP methodology in forecasting performance, revealing the potential of the proposed method. Selcuk utilized the data mining methodology, by developing ensemble learners, to predict the tourism demand in Turkey [8]. The developed algorithm achieved better performance than M5P, M5-Rule, and random forest methodologies and became a reliable estimator in the tourism section. The bagging and boosting ensembles could improve the accuracy of the predicting performance in the regression models against randomizing, voting, and stacking methodologies.
Claveria et al. compared different tourism demand forecasting methodologies, including the multi-layer perceptron, the Elman network, and the radial basis function [9]. The forecasting results showed that the MLP and RBF NN outperformed the Elman NNs in forecasting performance with or without the context of the past. Akin compared the predicting performance between various methodologies, namely SARIMA, NN, and SVR, which were optimized by the Hyndman and Khandakar methodologies, Levenberg–Marquardt algorithm, and particle swarm optimization. The predicting outcomes proved that the optimized SVR dominates, followed by SARIMA and NN. Moreover, sets of rules for model architecture were constructed by utilizing structural components and coefficients in time series features [10]. Athanasopoulos and Hyndman utilized a regression framework to forecast Australian domestic tourism, which considered the 2000 Sydney Olympics and 2002 Bali bombings events [11]. The developed methodology combined with exogenous variables could extract time series dynamics and economic relationships in the data, which outperforms traditional methodologies in short-term and long-term prediction. The proposed methodology was about official Australian government predicting algorithms, which achieved more-optimistic outcomes.
Chu investigated the ARAR methodology in forecasting tourism demand in the Asia-Pacific areas [12]. The developed algorithm presented different forecasting horizons in months and quarters. The ARAR achieved robust performance metrics in both MAPE and RMSE indexes when compared with the ARIMA methodology, which reinforced the reliability of the developed algorithm. Gunter and Irem compared the prediction accuracy of different univariate and multivariate algorithms, including EC-ADLM, TVP, ARMA, ETS, classical and Bayesian VAR, and the naïve-1 model [13]. For US and UK tourism prediction, the ARMA and ETS obtained the most appropriate performance and Bayesian VAR achieved the highest accuracy in German and Italian markets. However, the research proved that the naïve-1 methodology outperformed all other algorithms in all markets and predicting horizons. Huang and Hao developed a novel two-phase algorithm to enhance the prediction of tourism demand due to its complex correlation with the search index and enormous amounts of search engine data [14]. The combination between the double-boosting approach and ensemble SVR-based deep belief network could capture the nonlinear relationship, which significantly improved the monthly forecasting of tourist arrivals in Hong Kong. Therefore, the traditional neural network and algorithms have proved their effectiveness and efficiency in predicting tourism demand in recent years.
Although the traditional neural networks and autoregressive algorithms achieved more advantages and accuracies in predicting tourism demand, the deep learning algorithm is emerging as a better solution. Hsieh adapted LSTM, Bi-LSTM, and GRU algorithms, which were more reliable than traditional methods, to enhance Taiwan’s tourism demand prediction [15]. The performance results proved the accuracy and better reliability of LSTM in terms of the RMSE index, in tourism demand prediction relative to GRU and Bi-LSTM algorithms. He et al. developed the SARIMA-CNN–LSTM algorithms to daily predict tourism demand in different countries [16]. The hybrid algorithm could generate greater prediction accuracy and better process high-frequency data during predicting operation than individual SARIMA algorithms. Moreover, the proposed method could provide better interpretability than the LSTM alone, in the traditional time-series framework.
Kulshrestha et al. developed deep learning Bayesian Bi-LSTM to predict the tourism demand in Singapore, which outperformed the LSTM, SVR, RBFNN, and ADLM algorithms [17]. The authors utilized Bayesian optimization for identifying the most appropriate parameters and evaluating the effectiveness of hyperparameter fine-tuning on the predicting performance. Salamanis et al. suggested deep learning LSTM by incorporating data from exogenous variables in predicting tourism demand in Greece [18]. Combining with weather-related parameters, the proposed algorithm could be enhanced with noticeable influences on the predicting performance with all six different benchmarks. Therefore, deep learning methodologies demonstrate higher effectiveness and better performance in predicting tourism demand in comparison to traditional algorithms.

1.2. Main Contributions

Many researchers have utilized different deep learning algorithms in predicting the tourism demand; the LSTM in particular has been considered the most promising methodology in recent years. Although many researchers have utilized the LSTM algorithm, the other economic and additional factors, including the monthly CPI of destination, the GDP of the target country, the number of international and domestic holidays, the month in years, and the COVID-19 factor are not all considered in the prediction methodologies. Moreover, the hybrid CNN–LSTM algorithm has not yet been deeply investigated in tourism demand prediction. Therefore, this research fills the gap by utilizing these additional features in the developed algorithm, which combined the deep learning CNN and LSTM approaches. The CNN could extract the critical pattern in the high-frequency data and the LSTM could effectively process the serial data. The main contributions of this research are listed as follows:
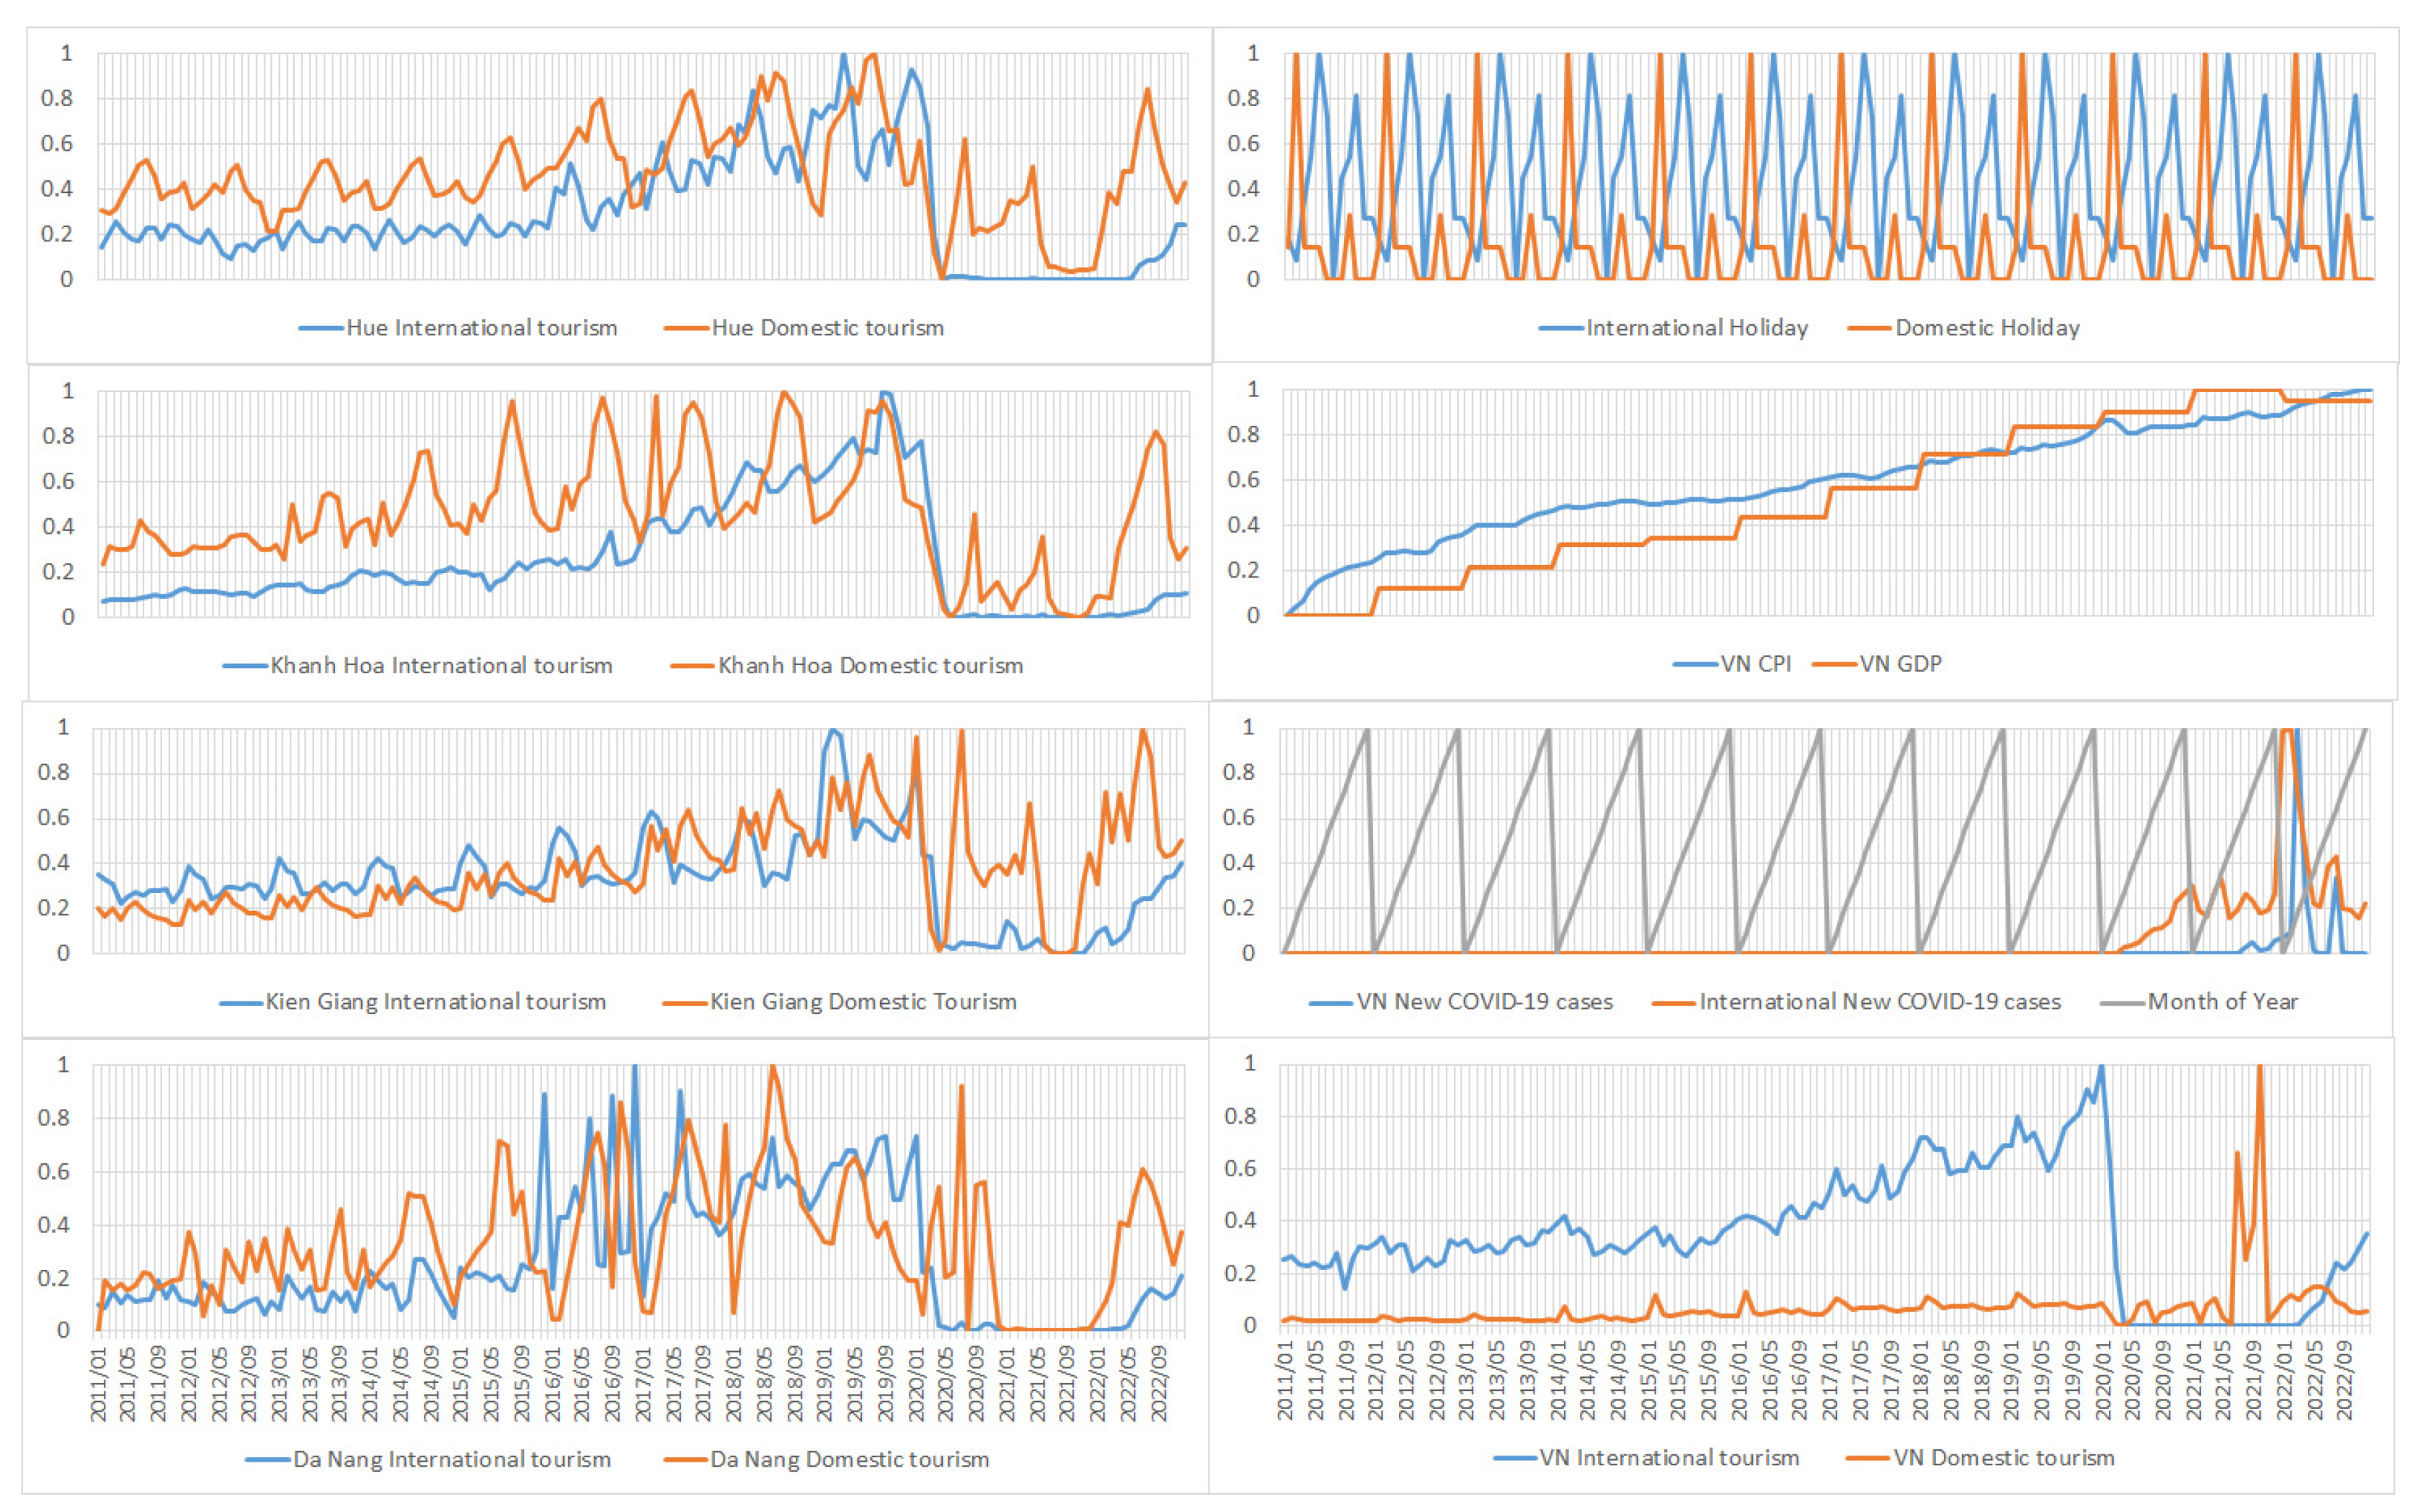
  • The number of international and domestic tourism in Vietnam and some provinces, including Hue, Da Nang, Khanh Hoa, and Kien Giang, have been collected monthly. Moreover, the sequential GDP, monthly CPI, number of international public holidays, number of domestic holidays, month-of-year, number of new COVID-19 cases in Vietnam, and number of new COVID-19 cases worldwide are also collected. The Pearson correlations matrixes between collected features are computed. The most relevant features with target outputs are selected as appropriate inputs in the proposed algorithm.
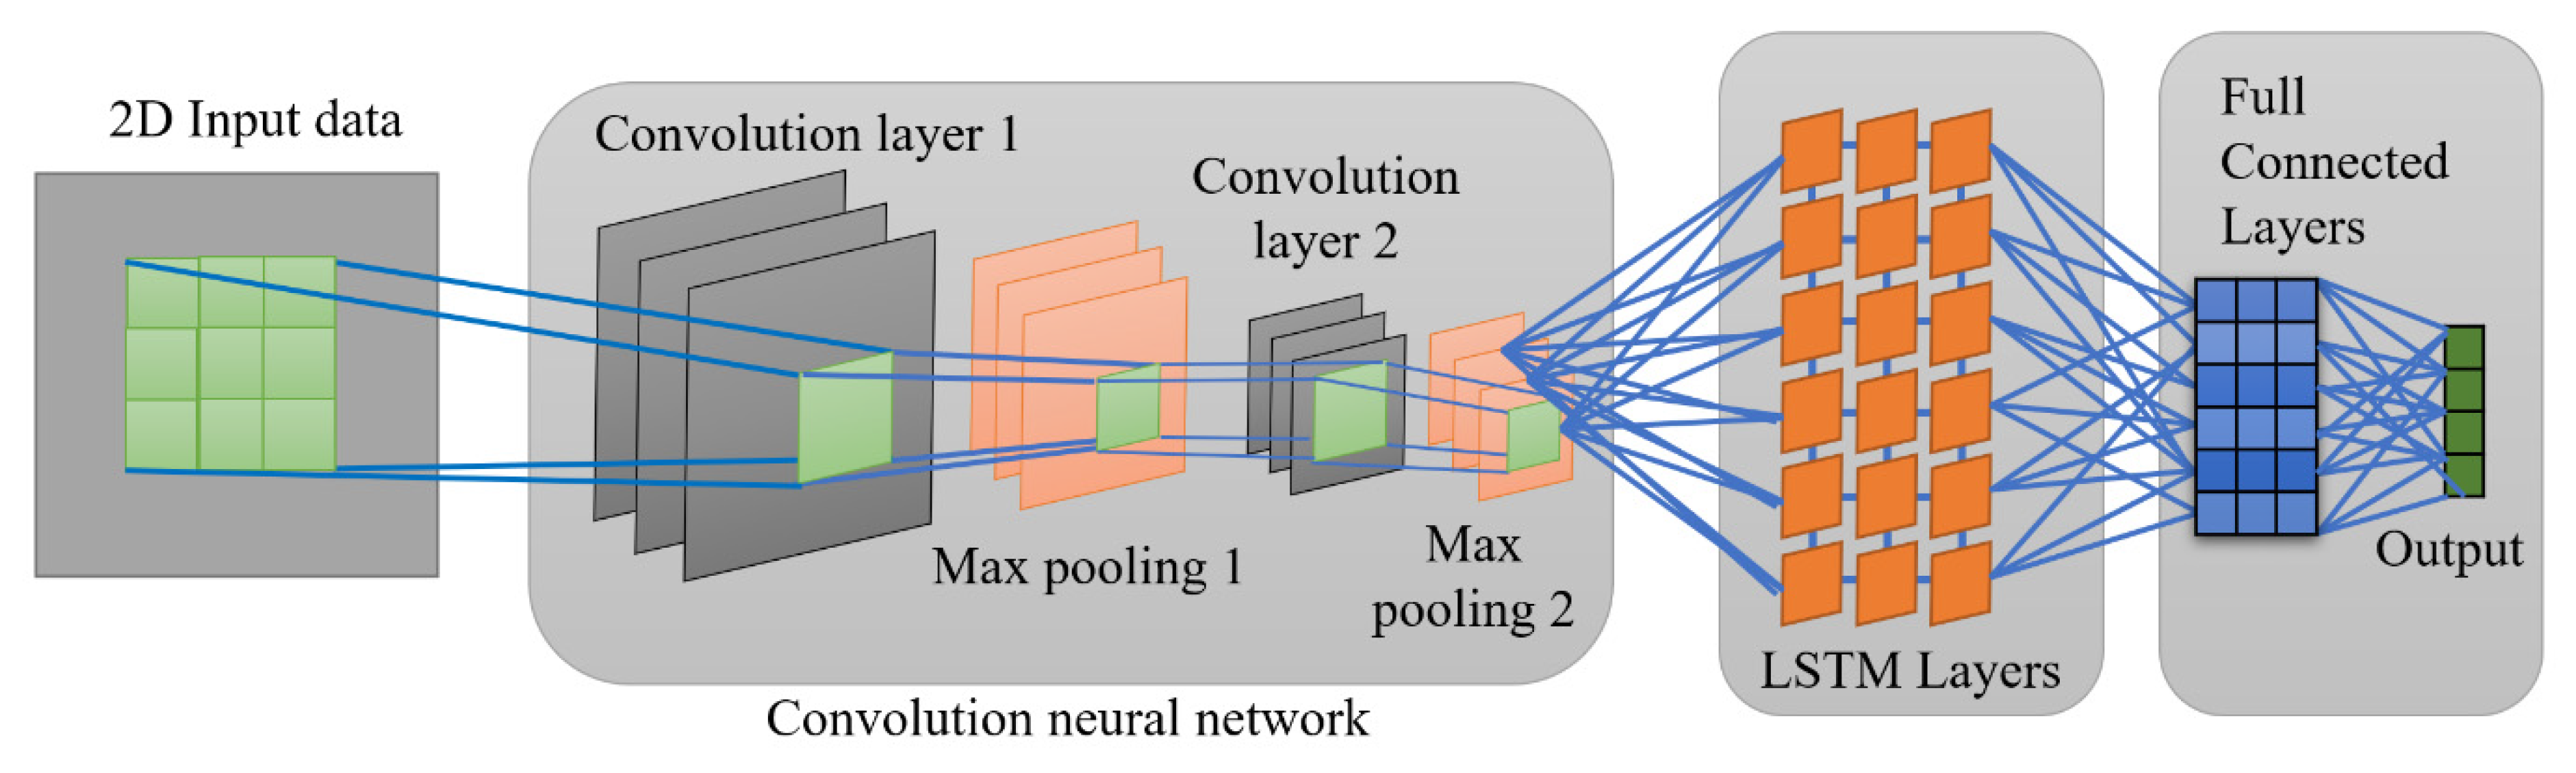
  • The hybrid deep learning CNN and LSTM methodologies are developed for predicting global and domestic arrival tourists in Vietnam and some provinces. The CNN could extract critical patterns from high-frequency data, which is transferred to the LSTM for processing the sequential information. Then, the outputs from LSTM layers are shifted to the fully connected layers, which output the international and domestic arrivals.
  • Hyperparameter fine-tuning is deployed to optimize the architecture of the proposed CNN–LSTM algorithm. In addition, the effectiveness of varying configurations of the CNN–LSTM on the prediction accuracy is also evaluated and analyzed.
  • The predicting performance and reliability of the proposed CNN–LSTM algorithm are compared and analyzed with other traditional methods, including BPNN, CNN, RNN, LSTM, and GRU, with different evaluation benchmarks. K-fold cross-validation is deployed for deeply comparing the predicted performance between algorithms.
The general framework of this research is presented in the next section. The third section illustrates the effectiveness of hyperparameter optimization on the CNN–LSTM performance. The fourth part shows the comparison between various predicting algorithms. The final section is the conclusion of this research.

2. General Methodology

In this research, the main methodologies are presented in Figure 1, as described in the main five steps:
  • The data collection: The numbers of international and domestic arrival tourism in Vietnam and some provinces were collected every month for many years. In addition, the number of international and domestic holidays and the number of new COVID-19 cases in Vietnam and worldwide each month are also gathered, which are novel contributions to this research. Moreover, the CPI and GDP are also selected as the correlated variables with the target data. The month-of-year data are also considered an input variable in the proposed methodology.
  • Data preprocessing: All the collected data are merged and need to be preprocessed before utilizing in the deep learning methodology [19]. Some missing data are refilled by the average values of nearby rows [20]. The outline data, which are the abnormal values, are removed from the data set. The min–max normalization method is utilized as the standard procedure, which converted all collected features into the same ranges [21]. The min–max normalization scales different variables into the [0, 1] range, as computed in Equation (1). All the normalized data are computed in the Pearson correlation matrix, which measures the correlation status between the input and the target variable. The feature selection process selects the most influential features and identifies the unrelated features to improve the prediction accuracy [22]. The Pearson correlation values measure the relationship between two variables and are calculated as in Equation (2) [23,24,25]. The most appropriate variables with strong correlation values are chosen for developing the model by the learning and validating operations.
X ^ = X m i n X X m i n X m a x
P X Y = X i X ¯ Y i Y ¯ X i X ¯ 2 Y i Y ¯ 2
3.
Hyperparameter fine-tuning (HFT) is utilized to optimize the architecture of the proposed CNN–LSTM [26,27,28]. Different parameters are varied to evaluate the effectiveness of the CNN–LSTM’s prediction accuracy, including the number of layers and number of filters in CNN architecture, the number of layers and neural nodes in LSTM structures, and the optimizing methodology during training and validating operations. The configurations that achieved the global optimum solution are selected as the most appropriate setting parameters for the developed CNN–LSTM algorithm. During the HFT operations, the effectiveness of varying CNN–LSTM architecture in predicting tourism demand is interpreted.
4.
The optimized CNN–LSTM architecture is proposed to compare and evaluate with other traditional and deep learning methodologies, including BPNN, CNN, GRU, LSTM, and RNN algorithms. The collected data are completely deployed in the evaluating operation by utilizing K-fold cross-validation [29,30,31]. During the developing model operations, the training data set is split into K fold, one fold for evaluating and the other fold for learning. Different benchmarks are selected to evaluate and compare the accuracy and reliability, including the mean square error (MSE), mean absolute percentage error (MAPE), cosine proximity (CP), and mean absolute error (MAE), which are calculated as in Equations (3)–(6). The closer these benchmarks are to zero, the better the predicting performance obtained. The loss function during the developing process is the MSE benchmark, which is gradually smaller during the learning activity of the proposed CNN–LSTM algorithm.
M A P E = 1 N i = 1 N y i y ^ i y i
M A E = 1 N i = 1 N y i y ^ i
M S E = 1 N i = 1 N y i y ^ i 2
C P = i = 1 n y i   y ^ i i = 1 n y i 2 i = 1 n y ^ i 2

2.1. Data Collection and Pearson Correlation Calculation for Selecting Input Features

The collected monthly international and domestic arrival tourism data in Vietnam and some provinces for more than ten years are illustrated in Figure 2. These figures illustrate an increasing trend in arrival tourism, until the appearance of the COVID-19 pandemic. To prevent the spread of the COVID-19 virus, some countries decided to close their borders, especially in China, Singapore, and South Korea, which significantly decreased the number of international tourists [32,33]. In addition, the lockdown policy due to the increasing number of new COVID-19 cases in Vietnam also critically affected the number of domestic tourists. Therefore, the number of new COVID-19 cases is selected as the promising feature in the prediction methodologies. Moreover, the number of international and domestic holidays as well as the month-of-year are collected to evaluate the correlation with the target vectors. The GDP and CPI are considered correlative indexes with the tourism volumes and are utilized in deep learning algorithms [3].
All the collected serial data are normalized by utilizing the min–max approach. The Pearson correlation coefficients, which measure the relational status between input and output vectors, are computed and illustrated in Figure 3. From the Pearson matrix, the most appropriate input features are selected for utilization in the predicting algorithms. The Pearson correlation coefficients vary in the range [−1, 1], which indicates the negative or positive relationship between two variables. The higher the value of the Pearson correlation, the better the relationship between the two variables. A near-zero Pearson coefficient illustrated noncorrelation between the two variables. Based on the Pearson correlation matrix, the selection processes for each data model are described below:
  • For predicting the international and domestic arrival tourism in Vietnam: The number of international arrival tourism in Vietnam has a strong negative correlation with the international new COVID-19 cases, which is a −0.5151 Pearson value, a moderate negative relationship with the new COVID-19 cases in Vietnam, which is −0.1975. International holidays have a low relationship with the target international tourism, which could be considered input features in the prediction methodology. For Vietnam’s domestic arrival tourism, the national GDP, CPI, and global new COVID-19 cases are the most correlated factors with the target domestic arrival tourism, which have 0.3855, 0.3562, and 0.2475 Pearson coefficients. The domestic holiday and month-of-year have very low correlations with target variables, which could be negligible. Therefore, to predict the international and domestic arrival tourism in Vietnam, the international holidays, CPI, GDP, Vietnam, and global new COVID-19 cases are selected as input parameters during the training and validating operations.
  • For predicting the international and domestic arrival tourism in Da Nang province: The level of international arrival tourism has the strongest correlation with the international new COVID-19 case factor, the Vietnam new COVID-19 case, and Vietnam GDP, which have −0.3798, −0.1462, and 0.0946 Pearson values, respectively. In addition, domestic arrival tourism has strong correlations with international new COVID-19 cases, domestic holidays, and month-of-year, which have −0.2354, −0.2035, and 0.1542 Pearson coefficients, respectively. Therefore, these abovementioned features, which possess strong correlations, are selected to predict international and domestic tourism in Da Nang province.
  • For Hue province, international arrival tourism in Hue has negative correlations with the international new COVID-19 cases, the Vietnam new COVID-19 cases, and the international holidays, which comprise −0.4403, −0.1779, and −0.1276 Pearson values, respectively. For the number of domestic tourists, the international new COVID-19 cases, the month-of-year, and domestic holidays could be considered as affected factors, which have −0.2536, −0.0956, and −0.091 Pearson quantities, respectively. Therefore, these affected factors will be selected for forecasting the number of arrival tourists in Hue province.
  • For Khanh Hoa province, the numbers of international customers are affected by the international new COVID-19 cases, the GDP, the CPI, and the Vietnam new COVID-19 cases, which have −0.3823, 0.1975, 0.1659, and −0.1473 Pearson values, respectively. Moreover, the international new COVID-19 cases also affected domestic tourism in Khanh Hoa province, which has a −0.3365 Pearson coefficient. Other factors, including the number of global and domestic holidays and the month-of-year, have weak correlations with target variables, which were negligible. Therefore, the above four selected features are the most appropriate input features for predicting the arrival of customers in Khanh Hoa province.
  • For Kien Giang province: The international arrival customers have strong correlations with international new COVID-19 cases, the month-of-year, the international the domestic holidays, and the Vietnam new COVID-19 cases, which maintain −0.4649, −0.2468, 0.2143, −0.2057, −0.1984 Pearson impact factors. In addition, the Kien Giang domestic tourism has powerful positive relationships with the CPI, GDP, and international new COVID-19 cases, which comprise 0.533, 0.5301, and 0.1913, respectively. Therefore, to effectively predict the international and domestic arrival customers in Kien Giang province, all the collected variables are considered in the developed CNN–LSTM algorithm.

2.2. The Traditional Back Propagation Neural Network and Deep Learning Algorithms

In this research, the BPNN is an evaluating benchmark to compare the performance with the developed CNN–LSTM algorithm. The BPNN was a successful approach that was inspired by biological neurons in the human brain. The BPNN computes the partial derivatives error during the training process to update the weight, normally known as the gradient [34,35,36]. The learning operation is performed through the gradient descent in the negative direction of updated weight values to reduce the error between the real and predicted vectors, as in Equation (7). The traditional BPNN approach has solved many expanding difficult problems in the control system, translation, and complex prediction.
w t + 1 = w t + η f ( i = 1 n w i j x i ) e k
The deep learning machines are outstanding algorithms compared with traditional BPNN, which utilizes the power of the high-speed computer. The standard RNN could recursively transform the current input vector with the output vector of the previous step [37]. However, the standard RNN encountered the gradient exploding or vanishing, which makes it difficult in long-term correlation [38]. The internal structure of standard RNN is presented in Figure 4 and the hidden and output states are computed as in Equation (8).
O t = H t = t a n h W h h h t 1 + W h x x t + b h
The LSTM neural network was designed to learn long-term dependencies and could overcome the vanishing problems of RNN [39,40]. The LSTM includes one input layer, many hidden layers, and an output layer. The main characteristic of LSTM is the internal structure of the LSTM cell, which is illustrated in Figure 5. The LSTM cell contains the forget gate, the input gate, and the output gate, which maintain and control its hidden and output status. The forget cell identifies the removed information for the input data and the previous hidden status, as computed in Equation (9). The input gate controls the data, which is necessary to add to the cell state, as calculated in Equation (10). The output gate defines which information is outputted from the cell state, as computed in Equation (11). During the forward operation, the candidate values, S ˜ t , identified by the current input state and previous hidden state, are added into the cell state and are computed in Equation (12). The new cell state is updated based on the forget values, the previous cell state, the input variable, and the candidate status, as calculated in Equation (13). Finally, the updated hidden state is derived as the Hadamard product between the output vector and the tanh activation of the current cell state, as in Equation (14). The input data are processed by the LSTM cell through timestep to timestep, which finally returns the whole sequence output data [41]. During the learning and validating operations, the weights and bias values are updated to minimize the loss-objective function across training data. During the training operation, the dropout layer is added to the recurrent layers, which is the fraction of the randomly dropped input units at each time, which reduces the risk of overfitting problems [42]. The dropout variable of 0.1 is an appropriate value that maintained the performance of the LSTM methodology [43].
f t = σ ( h t 1 W f , h + X t W f , x + b f )
i t = σ h t 1 W i , h + X t W i , x + b i
o t = σ h t 1 W o , h + X t W o , x + b o
s ˜ t = t a n h h t 1 W s , h + X t W s , x + b s
s t = f t s t 1 + i t s ˜ t
h t = o t t a n h s t
Another variant of LSTM is the GRU, which optimized the LSTM structure to reduce the number of gating signals to two, as illustrated in Figure 6 [44,45,46,47]. The update gate, Z n , and the reset gate, R n , are computed in Equations (15) and (16), save one gate and its parameters against the LSTM algorithm. The GRU also mixed the cell state and hidden state into one gate, which is calculated in Equations (17) and (18). The weight and bias vectors are updated through backpropagation gradient descent to minimize the loss function. The number of parameters in the GRU method is relatively small, which decreases the training operation and maintains the long-term information dependency. The GRU could obtain the long-distance preservation of the critical information by simplifying the number of gates, removing the redundant data, and storing the information dependence as the LSTM algorithm.
z t = σ W z , h . h t 1 + W z , x X t + b z
r t = σ W r , h . h t 1 + W r , x X t + b r
h ˜ t = t a n h W h , r r t h t 1 + X t + b c
h t = 1 z t h t 1 + z t h ˜ t

2.3. The Convolution Neural Network

The convolution neural network consists of a convolution layer and a pooling layer, as described in Figure 7. The convolution layer is the most important part of the deep learning machine in image recognition, which utilized different filters for generating various intermediate feature maps [48,49,50]. Each neuron feature map is connected to neighboring neurons in the previous map, which is shared by all spatial position input vectors. The feature map outputs are calculated by the weight vector and input data, combined with the bias term in the filter, as in Equation (19). The sharing weight could reduce the model complexity and improve the training velocity. An activation function is utilized for detecting nonlinear features in the multiple CNN layers [51]. The pooling layers deploy the shift invariance by decreasing the dimension of feature maps. Each pooling layer is positioned between two convolution layers to connect its corresponding feature data. In this research, max pooling is utilized to extract high-level features in the sequential data. In this research, the CNN is deployed to achieve the high-frequency pattern in the sequential data, which enhances the predicting performance of the arrival tourism.
z i , j = w k l x i , j l + b k l

2.4. The Developed Convolution Neural Network and Lstm Algorithms

The developed algorithm combines the advantages of both CNN and LSTM algorithms to construct the hybrid CNN–LSTM model, as illustrated in Figure 8. The two-dimensional sequential data are delivered to the CNN architecture to extract the high-frequency data patterns, which contain the most critical information with the target arrival tourism [48,52]. Some convolution filters could separate feature maps from historical information for further processing in the pooling layer. The max-pooling layers, which could decrease the input dimensional in long-sequential historical data, are deployed in this project [50,53]. The decreasing spatial dimension in the max-pooling layer could decrease the computation cost. The CNN layers could convert the higher-dimension original historical data into shorter feature maps, which provide useful relevant information with target data [54]. The output information is transported to the LSTM layers, which could effectively process the sequential information. The LSTM could store the long-term dependency during training iteration and transfer the processed data to the fully connected layers [55]. The final layer is the output layer, which provides the predicted arrival tourism. Some dropout layers are deployed to solve the over-fitting problems with the 0.1 dropout fraction. The ReLU activation function is employed as the activation function of the developed CNN–LSTM to improve the convergence speed [56]. The Adam optimizer is applied to minimize the loss function during the model development [57,58]. All the developed CNN–LSTM algorithms are completed by utilizing the TensorFlow library [59,60].

3. Hyperparameter for Developed CNN–LSTM Algorithms

In deep learning machines, hyperparameter fine-tuning is the most critical process to identify the most optimized structure of the developed CNN–LSTM algorithm [26,27,61]. In this research, the grid search hyperparameter is deployed to identify the highest-performance architecture. Different important parameters are varied and simulated to produce the predicted performances. Based on different combinations of configuration, the architectures of the proposed CNN–LSTM are identified and trained [61]. Table 1 summarizes the setting structure of the developed CNN–LSTM in predicting the arrival of tourism. The window size is varied in the range (6, 9, 12, 15), which evaluates the effectiveness of the prediction accuracy. In addition, the number of filters in CNN layers is diversified from 8, 16, 32, and 64. In the LSTM structure, the depth and number of LSTM cells are also changed to select the highest accuracy architecture, which is diverse in the ranges (2, 3, 4) and (32, 64, 128). All the collected data are separated into 80:10:10 for training, validating, and testing operations. Based on the varying setting parameters, a total of 144 configurations are simulated and compared to determine the most supreme structure of the developed CNN–LSTM algorithm [62]. The experiment results of different configurations are described in the following.
Figure 9 illustrates the effectiveness of changing the critical parameters of the CNN–LSTM structure on the predicting benchmarks. The effects of the window size, CNN filters, LSTM layers, and number of LSTM cells are clearly illustrated for Vietnam data collection and other provinces, including Da Nang, Hue, Khanh Hoa, and Kien Giang provinces. The smaller MSE, CP, MAE, and MAPE evaluating benchmarks present better accuracy in predicting performance. In the Vietnam collection data, the six-window size outperforms other parameters in all evaluating error metrics. The more the window size increases, the more the prediction accuracy decreases. The 9-, 12-, and 15-window sizes have the worst performance with a larger spread of benchmark errors. In the LSTM structure, the three layers surpasses the two layers and four layers in the MSE, validating MSE, CP, validating CP, and MAE evaluating benchmarks, and has worse performance in other metrics. Similarly, the 64-LSTM cell achieves excellent predicting performance in the MSE, validating MSE, CP, validating CP, and MAE indexes. In the CNN structure, 16 filters obtain better performance indexes with higher stability in relation to 8, 32, and 64 filters. Therefore, in Vietnam, regarding the number of arriving tourists, the optimized architecture of the developed CNN–LSTM, which achieved the most excellent predicting benchmarks, includes a 6-window size, 3-LSTM layers with 64 cells, and 16-filters in the CNN structure.
In the Da Nang province tourism data, the 9-window size obtains the most premium evaluating benchmarks compared with 6-, 12-, and 15-window size parameters. In the LSTM structure, three layers surpass other configurations with the smallest error areas in the spider chart. In addition, the 64-LSTM cell overtakes the 32- and 128-LSTM cells, which possess more error range metrics between target and predicted values. In addition, the 16-CNN filter attains the most brilliant prediction accuracy in comparison to other setting parameters and is considered the most optimized parameter in the CNN structure. Therefore, to achieve the most exceptional predicting results in the Da Nang tourist collection, the LSTM structure with a 9-window size, 3 layers with 64 cells, and 16-filters in the CNN layers, represent the most optimized architecture of the proposed CNN–LSTM algorithm.
In the Hue tourism collection, the 6-window size outperforms the 9-, 12-, and 15-window sizes with the smallest expand area in almost all of the error benchmarks. Moreover, in the LSTM architecture, the two layer accomplish the highest accuracy against three and four layers, and utilizing 32 cells executes the most promising precision relative to 64 and 128 cells. The 16 filters in the CNN structure outperform the 8, 32, and 64 filters in the MSE, validating MSE, CP, MAE, and validating MAE. Therefore, the optimized CNN–LSTM architecture comprises a 6-window size, 16 filters in CNN layers, and 2 layers with 32 cells in the LSTM structure, which demonstrate the most outstanding performances against other configurations.
For the Khanh Hoa dataset, the experiment outcomes revealed that the 12-window size outperforms the 6-, 9-, and 15-window sizes with the most optimized error benchmarks. Three layers of LSTM achieve the most optimistic predicting results in comparison to other layers and 128-LSTM cell obtains the most encouraging predicting outcomes relative to 32- and 64-cells. In the CNN setting architecture, the 64 filters have the best accuracy than other parameters. Consequently, the CNN–LSTM algorithm with a 12-window size, 64 filters, and 3 layers with 128-LSTM cells is the most optimized architecture in predicting the arrived tourists in Khanh Hoa province.
Through the experiment results on the Kien Giang data collection, the 9-window size generally has better accuracy in the MSE, CP, MAE, MAPE, and validating MAPE benchmarks. The 2-LSTM layers with 64 cells surpass other configurations in most of the evaluating indexes. In the CNN architecture, the 32 filters obtain the most accurate benchmarks against structures. Hence, the optimized CNN–LSTM architecture in the Kien Giang tourism collection includes a 9-window size, 2 LSTM layers with 64 cells, and 32-CNN filters, which demonstrate the best accuracy in predicting the arrival of international and domestic tourists.
Through the hyperparameter optimization, the most efficient CNN–LSTM architectures in each data collection are identified. In the next part, the optimized CNN–LSTM structures are compared and analyzed with other traditional and deep learning algorithms.

4. Comparing Predicting Performance between Methodologies

The comparison and analysis of the predicting performance between the developed CNN–LSTM and others has important implications based on the findings. The most optimized architectures of various predicting algorithms are deployed to predict the arrival of tourists in Vietnam and some provinces. The 10-fold cross-validation algorithm is utilized to completely analyze the predicted performance in different views [29,30,63]. The experiment results with different predicted algorithms in various data collection are illustrated in Figure 10. The spider plots describe the predicting performances based on various evaluating indicators, including MSE, validating MSE, MAE, validating MAE, CP, validating CP, MAPE, and validating MAPE benchmarks. The closer to zero the evaluating indicators are, the more accurately the algorithms perform. The better predicting algorithm possesses smaller expanding areas in the spider plot compared with other methodologies.
In the Vietnam tourist collection, the proposed CNN–LSTM outperforms other predicting algorithms in most error benchmarks, except the MAPE metric. In the MSE index, the proposed CNN–LSTM outperforms the BPNN, RNN, and CNN with 70.6%, 77.2%, and 15.2% improvement in the learning operation, and surpasses the BPNN and LSTM with 48% and 77.6% enhancement in the validating process, respectively. Through the CP indicator, the developed algorithm defeats the BPNN, RNN, GRU, LSTM, and CNN with 75.7%, 47.7%, 7.3%, 0.4%, and 15.6% advancement, respectively, during the training activity and outclasses the BPNN, RNN, GRU, and CNN with 65%, 97.4%, 50.0%, and 97.9% augmentation, respectively, during the verifying operation. Observing the MAE error, the hybrid algorithm exceeds the BPNN, RNN, GRU, and CNN with 45.0%, 56.8%, 5.7%, and 15.5% improvement, respectively, in the training campaign, and outshines the BPNN and LSTM with 3.2%, and 45.3% achievement in the confirming process. Comparing across algorithms, the hybrid CNN–LSTM surpasses other methodologies with the highest augmentation of 77.2%, 77.6%, 75.7%, 97.9%, 56.8%, 45.3%, and 84.7% in the MSE, validating MSE, CP, validating CP, MAE, validating MAE, and validating MAPE, respectively. Therefore, the developed hybrid CNN and LSTM algorithms outperform other traditional and deep learning methodologies in predicting global and domestic tourism in Vietnam data collection.
In the Da Nang collection, the developed algorithm outshines other methodologies with the smallest expansion area in the spider plot. Through the MSE metric, the hybrid CNN–LSTM outshines the BPNN, RNN, and CNN with 50.3%, 66.4%, and 73.1% improvement, respectively, during the learning campaign, and outdistances the BPNN, RNN, GRU, LSTM, and CNN with 34.8%, 45.5%, 56.0%, 55.2%, and 56.1% achievement, respectively, in the verifying process. In the CP index, the proposed algorithm surpasses the BPNN, RNN, and CNN methodologies with 19.4%, 30.4%, and 50.8% preferment, respectively, in the learning activity, and outrivals all others with a maximum 79.9% enhancement in the validating process. In the MAE indicator, the developed CNN–LSTM overperforms the CNN method with a maximum 61.9% improvement in the training data and surpasses the GRU with a maximum 36.8% enhancement in the validating data. With the MAPE value, the developed CNN–LSTM outperforms the RNN with the greatest achievement of 49.3% during the learning activity and surpasses the BPNN with the topmost enhancement of 96.9% during the validating process. Comparing across the algorithms, the developed CNN–LSTM obtains extreme improvements of 73.1%, 56%, 50.8%, 79.9%, 61.9%, 37.2%, 49.3%, and 96.9% in the training and validating MSE, CP, MAE, and MAPE, respectively. Hence, the CNN–LSTM outperforms other methodologies in the prediction of the number of tourists arriving in Da Nang in most of the evaluating benchmarks.
In the Hue collection data, the CNN–LSTM outperforms other predicting models because it retains the smallest area in the spider chart. In the summarized plot, the CNN–LSTM achieves the most improvement compared with other traditional and deep learning methodologies. In the MSE benchmark, the CNN–LSTM surpasses the BPNN, RNN, and CNN with 25.6%, 43.8%, and 70.8% improvement in the learning operation, and outstrips the GRU, LSTM, and CNN with 1%, 33.7%, and 48.3% achievement during the verifying activity. In the next CP benchmark, the CNN–LSTM continues to improve the prediction accuracy with a 31.5% improvement in training operation and maximum of 40.2% enhancement in the validating process. The MAE shows outperformance of the developed CNN–LSTM with most of the algorithms, obtaining 66.9% in training and 34.8% in validating operations. The final MAPE indicator presents the improvement of the proposed CNN–LSTM in tourism prediction, which obtains the most significant improvement of 66.3% in training data and 87.4% in the validating data. In general, the developed CNN–LSTM surpasses all other predicting algorithms, which achieved the 70.8%, 48.3%, 31.5%, 40.2%, 66.9%, 34.8%, 66.3%, and 87.4% improvement in the training and validating MSE, CP, MAE, and MAPE, respectively.
In the Khanh Hoa collection, the CNN–LSTM shows outstanding prediction performance, followed by the GRU, BPNN, LSTM, RNN, and CNN, respectively. The proposed algorithm achieves 63.4%, 87.3%, 54.9%, and 85.9% enhancement against BPNN, RNN, GRU, and CNN, respectively, in the training MSE and 42.1%, 72.1%, 65.7%, 70.9%, and 72.1% augmentation in relation to BPNN, RNN, GRU, LSTM, and CNN, respectively, in the validating MSE. In the next index, the CNN–LSTM surpasses 12.9% 72.7%, 7.5%, and 59.9% improvement against BPNN, RNN, GRU, and CNN, respectively, in the training operation, and 19.8%, 98.0%, 10.1%, 81.1%, and 97.5% enrichment in comparison to BPNN, RNN, GRU, LSTM, and CNN, respectively, in the validating operation. In the MAE index, the optimized algorithm improves the predicting performance up to 23.8%, 67.8%, 21.8%, and 64.6% against BPNN, RNN, GRU, and CNN in the training data, and 26.0%, 13.8%, 22.8%, and 26.0% in relation to RNN, GRU, LSTM, and CNN in the validating process. in the final benchmark, the developed algorithm achieves the greatest improvement of 87.8% and 26.4% compared with BPNN in the training and verifying operations, respectively. Therefore, the CNN–LSTM generally outperforms other prediction methodologies with a maximum improvement of 87.3%, 72.1%, 72.7%, 98.0%, 67.8%, 26%, 87.8%, and 26.4% in the training and confirming MSE, CP, MAE, and MAPE, respectively.
In the final tourism data collection, the spider plot illustrates the highest accuracy of the proposed CNN–LSTM in predicting international and domestic tourism rates. In the MSE benchmark, the CNN–LSTM achieves 50.2%, 3.3%, and 82.7% improvements against RNN, LSTM, and CNN methodologies in the learning operation, and 6.9% 35.2%, 50.1%, 53.3%, and 65.7% enhancement relative to BPNN, RNN, GRU, LSTM, and CNN algorithms in the validating activity. In the next index, the CNN–LSTM outperforms the traditional CNN methodology with significant advancement of 66.7% and 81.4% in the training and validating operations. In the MAE index, the CNN–LSTM obtains better performance in most of the other algorithms, which obtains 77.4% and 54.8% improvement compared with CNN, in the learning and verifying operations, respectively. In the final MAPE indicator, the developed algorithm obtains 89.2% and 49.6% accuracy in contrast to RNN, in the learning and confirming operations, respectively. In general, the developed CNN–LSTM achieves the highest improvement of 82.7%, 65.7%, 66.7%, 81.4%, 77.4%, 54.8%, 89.2%, and 49.6% in the MSE, CP, MAE, and MAPE during the learning and verifying activities, respectively.
Compared with single LSTM through different data collections, the hybrid CNN–LSTM outperforms the traditional LSTM, which has the most significant improvement of 3.3% MSE, 77.6% validating MSE, 3.3% CP, 81.1% validating CP, 33.5% MAE, 46.2% validating MAE, 75.7% MAPE, and 52.6% validating MAPE in predicting the arrived tourists of Vietnam and some countries. The additional CNN layer before the traditional LSTM improved its accuracy and performance in extracting high-frequency patterns in sequential data.
In relation to single CNN layers through different data collection methods, the hybrid algorithm could reinforce the traditional algorithm, which acquires the most significant improvement of 85.9% MSE, 72.1% validating MSE, 66.7% CP, 97.9% validating CP, 77.4% MAE, 54.8% validating MAE, 76.0% MAPE, and 6.1% validating MAPE. Therefore, the additional LSTM could improve the CNN layer in processing the sequential information, which enhances its effectiveness and reliability in predicting tourism demand in Vietnam and some provinces.
The developed CNN–LSTM not only outperforms the traditional CNN and LSTM algorithms but also obtains higher prediction accuracy in relation to the BPNN, RNN, and GRU algorithms. When compared to RNN through different algorithms, the developed algorithm outperforms the prediction accuracy with the most extreme improvement of 87.3% MSE, 72.1% validating MSE, 72.7% CP, 98.0% validating CP, 67.8% MAE, 35.7% validating MAE, 89.2% MAPE, and 87.4% validating MAPE. In addition, compared with the GRU methodology, the hybrid algorithm demonstrated better performance, which achieved an enhancement of 54.9% MSE, 65.7% validating MSE, 7.5% CP, 76.4% validating CP, 34.9% MAE, 44.8% validating MAE, and 84.8% MAPE. The proposed CNN–LSTM was also effective in predicting performance relative to the BPNN methodology, which acquired improvements of 70.6% MSE, 48.0% validating MSE, 75.7% CP, 65.0% validating CP, 45.0% MAE, 22.7% validating MAE, 87.8% MAPE, 96.9% validating MAPE. Therefore, the CNN–LSTM achieves outstanding performances with various evaluating benchmarks relative to other methodologies, which indicated better effectiveness and higher reliability in combining the CNN and LSTM algorithms. In general, the developed CNN–LSTM achieves the most significant enhancements with 96.9% validating MAPE against BPNN, 98% validating CP against RNN, 84.4% MAPE against GRU, 81.1% validating CP against LSTM, and 97.5% validating CP against CNN. Therefore, the CNN–LSTM is the most appropriate methodology for predicting international and domestic tourism demand in Vietnam and other provinces. Figure 11 presents the predicting error in the testing data, which proves the higher prediction accuracy of the proposed algorithm.

5. Findings and Discussion

Some of the conclusions drawn from the study are presented below:
  • The new international and domestic COVID-19 cases are considered the most effective features that control the number of arrived tourists, through the Pearson correlation values. Improvements in the GPD and CPI indexes have increased the size of the middle class in Vietnam society, which is the main fraction of domestic tourists in Vietnam and some provinces. In addition, the numbers of international and domestic tourists in Kien Giang and Da Nang provinces make up a significant proportion of the total number of international and domestic holidays. Therefore, the authority in these provinces could extend the number of domestic holidays, combined with traditional festivals and cultural ceremonies, to attract more tourists. The Pearson correlations between arrived tourists and other holiday and COVID-19 factors are novel in this research.
  • The optimized structures of the proposed CNN–LSTM during the hyperparameter process are identified in this research. Moreover, the optimized window sizes, which are the number of historical sequential information, combined with the number of layers and cells in LSTM structure, and the number of filters in CNN layers for each data collection, are discovered in this research.
  • This research proves the effectiveness when combining the CNN and LSTM algorithms, which outperforms the single CNN and LSTM algorithms in different evaluating benchmarks. Moreover, this research also demonstrates the higher performance of proposed algorithms in comparison to the BPNN, RNN, and GRU methodologies.
  • This research verifies an effective CNN–LSTM methodology combined with the Pearson correlation matrix to identify the most appropriate input features, which create a reliable methodology for resource planning, efficiently maximizing, and deeply utilizing the available resource in Vietnam and some provinces. The developed methodology could boost the tourism industry not only in Vietnam but also all over the world after the COVID-19 pandemic.

6. Results

In this research, the hybrid algorithm is developed to predict the international and domestic tourism demand in Vietnam and some provinces. The new global and domestic COVID-19 cases and the number of holidays are also accumulated in the data collection process. The Pearson values indicate a strong correlation between collected data and the number of arrived tourists, which are selected as input features in the prediction methodology. Hyperparameter fine-tuning is deployed to optimize the CNN–LSTM architecture. Moreover, the comparison between proposed CNN–LSTM and other algorithms, including BPNN, RNN, GRU, LSTM, and CNN, are presented in this research. Through the experiment outcome, the developed CNN–LSTM achieves the most significant enhancements with 96.9% validating MAPE against BPNN, 98% validating CP against RNN, 84.4% MAPE against GRU, 81.1% validating CP against LSTM, and 97.5% validating CP against CNN. The monthly predicted tourist arrivals results could be utilized as the baseline strategy for resource planning, which could efficiently maximize and deeply utilize the available resource in Vietnam and some provinces.

Author Contributions

Conceptualization, T.N.-D. and Y.-M.L.; methodology, P.N.-T.; Investigation, T.N.-D. software, M.-Y.C.; Resources, Y.-M.L.; formal analysis, T.N.-D. and C.-L.P.; writing—original draft preparation, T.N.-D.; writing—review and editing, C.-L.P.; supervision, Y.-M.L., C.-L.P., M.-Y.C.; funding acquisition, C.-L.P.; Data curation, P.N.-T.; software, M.-Y.C. and P.N.-T. All authors have read and agreed to the published version of the manuscript.

Funding

This research received no external funding.

Informed Consent Statement

Not applicable.

Data Availability Statement

Data sharing not applicable.

Conflicts of Interest

The authors declare no conflict of interest.

References

  1. Tian, F.; Yang, Y.; Jiang, L. Spatial Spillover of Transport Improvement on Tourism Growth. Tour. Econ. 2022, 28, 1416–1432. [Google Scholar] [CrossRef]
  2. Tien, N.H.; Dung, H.T.; Vu, N.T.; Doan, L.; Duc, M. Risks of Unsustainable Tourism Development in Vietnam. Int. J. Res. Financ. Manag. 2019, 2, 81–85. [Google Scholar]
  3. Alamsyah, A.; Friscintia, P.B.A. Artificial Neural Network for Indonesian Tourism Demand Forecasting. In Proceedings of the 2019 7th International Conference on Information and Communication Technology (ICoICT), Kuala Lumpur, Malaysia, 24–26 July 2019; pp. 1–7. [Google Scholar]
  4. Assaf, A.G.; Li, G.; Song, H.; Tsionas, M.G. Modeling and Forecasting Regional Tourism Demand Using the Bayesian Global Vector Autoregressive (BGVAR) Model. J. Travel Res. 2019, 58, 383–397. [Google Scholar] [CrossRef]
  5. Bangwayo-Skeete, P.F.; Skeete, R.W. Can Google Data Improve the Forecasting Performance of Tourist Arrivals? Mixed-Data Sampling Approach. Tour. Manag. 2015, 46, 454–464. [Google Scholar] [CrossRef]
  6. Baldigara, T.; Mamula, M. Modelling International Tourism Demand Using Seasonal ARIMA Models. Tour. Hosp. Manag. 2015, 21, 19–31. [Google Scholar] [CrossRef]
  7. Cai, Z.; Lu, S.; Zhang, X. Tourism Demand Forecasting by Support Vector Regression and Genetic Algorithm. In Proceedings of the 2009 2nd IEEE International Conference on Computer Science and Information Technology, Beijing, China, 8–11 August 2009; pp. 144–146. [Google Scholar]
  8. Cankurt, S. Tourism Demand Forecasting Using Ensembles of Regression Trees. In Proceedings of the 2016 IEEE 8th International Conference on Intelligent Systems (IS), Sofia, Bulgaria, 4–6 September 2016; pp. 702–708. [Google Scholar]
  9. Claveria, O.; Monte, E.; Torra, S. Tourism Demand Forecasting with Neural Network Models: Different Ways of Treating Information. Int. J. Tour. Res. 2015, 17, 492–500. [Google Scholar] [CrossRef]
  10. Akın, M. A Novel Approach to Model Selection in Tourism Demand Modeling. Tour. Manag. 2015, 48, 64–72. [Google Scholar] [CrossRef]
  11. Athanasopoulos, G.; Hyndman, R.J. Modelling and Forecasting Australian Domestic Tourism. Tour. Manag. 2008, 29, 19–31. [Google Scholar] [CrossRef]
  12. Chu, F.-L. Analyzing and Forecasting Tourism Demand with ARAR Algorithm. Tour. Manag. 2008, 29, 1185–1196. [Google Scholar] [CrossRef]
  13. Gunter, U.; Önder, I. Forecasting International City Tourism Demand for Paris: Accuracy of Uni-and Multivariate Models Employing Monthly Data. Tour. Manag. 2015, 46, 123–135. [Google Scholar] [CrossRef]
  14. Huang, B.; Hao, H. A Novel Two-Step Procedure for Tourism Demand Forecasting. Curr. Issues Tour. 2021, 24, 1199–1210. [Google Scholar] [CrossRef]
  15. Hsieh, S.-C. Tourism Demand Forecasting Based on an LSTM Network and Its Variants. Algorithms 2021, 14, 243. [Google Scholar] [CrossRef]
  16. He, K.; Ji, L.; Wu, C.W.D.; Tso, K.F.G. Using SARIMA–CNN–LSTM Approach to Forecast Daily Tourism Demand. J. Hosp. Tour. Manag. 2021, 49, 25–33. [Google Scholar] [CrossRef]
  17. Kulshrestha, A.; Krishnaswamy, V.; Sharma, M. Bayesian BILSTM Approach for Tourism Demand Forecasting. Ann. Tour. Res. 2020, 83, 102925. [Google Scholar] [CrossRef]
  18. Salamanis, A.; Xanthopoulou, G.; Kehagias, D.; Tzovaras, D. LSTM-Based Deep Learning Models for Long-Term Tourism Demand Forecasting. Electronics 2022, 11, 3681. [Google Scholar] [CrossRef]
  19. Shapi, M.K.M.; Ramli, N.A.; Awalin, L.J. Energy Consumption Prediction by Using Machine Learning for Smart Building: Case Study in Malaysia. Dev. Built Environ. 2021, 5, 100037. [Google Scholar] [CrossRef]
  20. Newgard, C.D.; Lewis, R.J. Missing Data: How to Best Account for What Is Not Known. JAMA 2015, 314, 940–941. [Google Scholar] [CrossRef]
  21. Liu, Y.; Chen, H.; Zhang, L.; Wu, X.; Wang, X. Energy Consumption Prediction and Diagnosis of Public Buildings Based on Support Vector Machine Learning: A Case Study in China. J. Clean. Prod. 2020, 272, 122542. [Google Scholar] [CrossRef]
  22. Zhao, H.-X.; Magoulès, F. Feature Selection for Predicting Building Energy Consumption Based on Statistical Learning Method. J. Algorithm. Comput. Technol. 2012, 6, 59–77. [Google Scholar] [CrossRef]
  23. Benesty, J.; Chen, J.; Huang, Y.; Cohen, I. Pearson Correlation Coefficient. In Noise Reduction in Speech Processing; Springer: Berlin/Heidelberg, Germany, 2009; pp. 1–4. [Google Scholar]
  24. Zhou, H.; Deng, Z.; Xia, Y.; Fu, M. A New Sampling Method in Particle Filter Based on Pearson Correlation Coefficient. Neurocomputing 2016, 216, 208–215. [Google Scholar] [CrossRef]
  25. Adler, J.; Parmryd, I. Quantifying Colocalization by Correlation: The Pearson Correlation Coefficient Is Superior to the Mander’s Overlap Coefficient. Cytom. Part A 2010, 77, 733–742. [Google Scholar] [CrossRef]
  26. Feurer, M.; Hutter, F. Hyperparameter Optimization. In Automated Machine Learning; Springer: Berlin/Heidelberg, Germany, 2019; pp. 3–33. [Google Scholar]
  27. Yang, L.; Shami, A. On Hyperparameter Optimization of Machine Learning Algorithms: Theory and Practice. Neurocomputing 2020, 415, 295–316. [Google Scholar] [CrossRef]
  28. Bergstra, J.; Yamins, D.; Cox, D. Making a Science of Model Search: Hyperparameter Optimization in Hundreds of Dimensions for Vision Architectures. In Proceedings of the International Conference on Machine Learning; PMLR: Atlanta, GA, USA, 2013; pp. 115–123. [Google Scholar]
  29. Rodriguez, J.D.; Perez, A.; Lozano, J.A. Sensitivity Analysis of K-Fold Cross Validation in Prediction Error Estimation. IEEE Trans. Pattern Anal. Mach. Intell. 2009, 32, 569–575. [Google Scholar] [CrossRef]
  30. Fushiki, T. Estimation of Prediction Error by Using K-Fold Cross-Validation. Stat. Comput. 2011, 21, 137–146. [Google Scholar] [CrossRef]
  31. Jung, Y. Multiple Predicting K-Fold Cross-Validation for Model Selection. J. Nonparametr. Stat. 2018, 30, 197–215. [Google Scholar] [CrossRef]
  32. Chen, H.; Shi, L.; Zhang, Y.; Wang, X.; Sun, G. A Cross-Country Core Strategy Comparison in China, Japan, Singapore and South Korea during the Early COVID-19 Pandemic. Glob. Health 2021, 17, 22. [Google Scholar] [CrossRef]
  33. Xu, W.; Wu, J.; Cao, L. COVID-19 Pandemic in China: Context, Experience and Lessons. Health Policy Technol. 2020, 9, 639–648. [Google Scholar] [CrossRef]
  34. Hecht-Nielsen, R. Theory of the Backpropagation Neural Network. In Neural Networks for Perception; Elsevier: Amsterdam, The Netherlands, 1992; pp. 65–93. [Google Scholar]
  35. Goh, A.T.C. Back-Propagation Neural Networks for Modeling Complex Systems. Artif. Intell. Eng. 1995, 9, 143–151. [Google Scholar] [CrossRef]
  36. Li, J.; Cheng, J.; Shi, J.; Huang, F. Brief Introduction of Back Propagation (BP) Neural Network Algorithm and Its Improvement. In Advances in Computer Science and Information Engineering; Springer: Berlin/Heidelberg, Germany, 2012; pp. 553–558. [Google Scholar]
  37. Zaremba, W.; Sutskever, I.; Vinyals, O. Recurrent Neural Network Regularization. arXiv 2014, arXiv:1409.2329. [Google Scholar]
  38. Bengio, Y.; Simard, P.; Frasconi, P. Learning Long-Term Dependencies with Gradient Descent Is Difficult. IEEE Trans. Neural Netw. 1994, 5, 157–166. [Google Scholar] [CrossRef]
  39. Hochreiter, S.; Schmidhuber, J. Long Short-Term Memory. Neural Comput. 1997, 9, 1735–1780. [Google Scholar] [CrossRef] [PubMed]
  40. Gers, F.A.; Schmidhuber, J.; Cummins, F. Learning to Forget: Continual Prediction with LSTM. Neural Comput. 2000, 12, 2451–2471. [Google Scholar] [CrossRef]
  41. Rizal, A.A.; Soraya, S.; Tajuddin, M. Sequence to Sequence Analysis with Long Short Term Memory for Tourist Arrivals Prediction. Proc. J. Phys. Conf. Ser. 2019, 1211, 12024. [Google Scholar] [CrossRef]
  42. Kanjanasupawan, J.; Chen, Y.-C.; Thaipisutikul, T.; Shih, T.K.; Srivihok, A. Prediction of Tourist Behaviour: Tourist Visiting Places by Adapting Convolutional Long Short-Term Deep Learning. In Proceedings of the 2019 International Conference on System Science and Engineering (ICSSE), Dong Hoi, Vietnam, 20–21 July 2019; pp. 12–17. [Google Scholar]
  43. Fischer, T.; Krauss, C. Deep Learning with Long Short-Term Memory Networks for Financial Market Predictions. Eur. J. Oper. Res. 2018, 270, 654–669. [Google Scholar] [CrossRef]
  44. Cho, K.; Van Merriënboer, B.; Gulcehre, C.; Bahdanau, D.; Bougares, F.; Schwenk, H.; Bengio, Y. Learning Phrase Representations Using RNN Encoder-Decoder for Statistical Machine Translation. arXiv 2014, arXiv:1406.1078. [Google Scholar]
  45. Dey, R.; Salem, F.M. Gate-Variants of Gated Recurrent Unit (GRU) Neural Networks. In Proceedings of the 2017 IEEE 60th International Midwest Symposium on Circuits and Systems (MWSCAS), Boston, MA, USA, 6–9 August 2017; pp. 1597–1600. [Google Scholar]
  46. Wu, W.; Liao, W.; Miao, J.; Du, G. Using Gated Recurrent Unit Network to Forecast Short-Term Load Considering Impact of Electricity Price. Energy Procedia 2019, 158, 3369–3374. [Google Scholar] [CrossRef]
  47. Zhang, Z.; Qin, H.; Liu, Y.; Wang, Y.; Yao, L.; Li, Q.; Li, J.; Pei, S. Long Short-Term Memory Network Based on Neighborhood Gates for Processing Complex Causality in Wind Speed Prediction. Energy Convers. Manag. 2019, 192, 37–51. [Google Scholar] [CrossRef]
  48. Kalchbrenner, N.; Grefenstette, E.; Blunsom, P. A Convolutional Neural Network for Modelling Sentences. arXiv 2014, arXiv:1404.2188. [Google Scholar]
  49. Gu, J.; Wang, Z.; Kuen, J.; Ma, L.; Shahroudy, A.; Shuai, B.; Liu, T.; Wang, X.; Wang, G.; Cai, J. Recent Advances in Convolutional Neural Networks. Pattern Recognit. 2018, 77, 354–377. [Google Scholar] [CrossRef]
  50. Albawi, S.; Mohammed, T.A.; Al-Zawi, S. Understanding of a Convolutional Neural Network. In Proceedings of the 2017 International Conference on Engineering and Technology (ICET), Antalya, Turkey, 21–23 August 2017; pp. 1–6. [Google Scholar]
  51. O’Shea, K.; Nash, R. An Introduction to Convolutional Neural Networks. arXiv 2015, arXiv:1511.08458. [Google Scholar]
  52. Kiranyaz, S.; Avci, O.; Abdeljaber, O.; Ince, T.; Gabbouj, M.; Inman, D.J. 1D Convolutional Neural Networks and Applications: A Survey. Mech. Syst. Signal Process. 2021, 151, 107398. [Google Scholar] [CrossRef]
  53. Scherer, D.; Müller, A.; Behnke, S. Evaluation of Pooling Operations in Convolutional Architectures for Object Recognition. In International Conference on Artificial Neural Networks; Springer: Berlin/Heidelberg, Germany, 2010; pp. 92–101. [Google Scholar]
  54. Lu, J.; Zhang, Q.; Yang, Z.; Tu, M. A Hybrid Model Based on Convolutional Neural Network and Long Short-Term Memory for Short-Term Load Forecasting. In Proceedings of the 2019 IEEE Power & Energy Society General Meeting (PESGM), Atlanta, GA, USA, 4–8 August 2019; pp. 1–5. [Google Scholar]
  55. Li, Y.; Cao, H. Prediction for Tourism Flow Based on LSTM Neural Network. Procedia Comput. Sci. 2018, 129, 277–283. [Google Scholar] [CrossRef]
  56. Krizhevsky, A.; Sutskever, I.; Hinton, G.E. Imagenet Classification with Deep Convolutional Neural Networks. Adv. Neural Inf. Process. Syst. 2012, 25, 1097–1105. [Google Scholar] [CrossRef]
  57. Bi, J.-W.; Liu, Y.; Li, H. Daily Tourism Volume Forecasting for Tourist Attractions. Ann. Tour. Res. 2020, 83, 102923. [Google Scholar] [CrossRef]
  58. Polyzos, S.; Samitas, A.; Spyridou, A.E. Tourism Demand and the COVID-19 Pandemic: An LSTM Approach. Tour. Recreat. Res. 2021, 46, 175–187. [Google Scholar] [CrossRef]
  59. Abadi, M.; Barham, P.; Chen, J.; Chen, Z.; Davis, A.; Dean, J.; Devin, M.; Ghemawat, S.; Irving, G.; Isard, M.; et al. TensorFlow: A System for Large-Scale Machine Learning. In Proceedings of the 12th {USENIX} Symposium on Operating Systems Design and Implementation ({OSDI} 16), {USENIX} Association. Savannah, GA, USA, 2–4 November 2016; pp. 265–283. [Google Scholar]
  60. Goldsborough, P. A Tour of Tensorflow. arXiv 2016, arXiv:1610.01178. [Google Scholar]
  61. Bergstra, J.; Bardenet, R.; Bengio, Y.; Kégl, B. Algorithms for Hyper-Parameter Optimization. Adv. Neural Inf. Process. Syst. 2011, 24, 2011. [Google Scholar]
  62. Yu, T.; Zhu, H. Hyper-Parameter Optimization: A Review of Algorithms and Applications. arXiv 2020, arXiv:2003.05689. [Google Scholar]
  63. Refaeilzadeh, P.; Tang, L.; Liu, H. Cross-Validation. Encycl. Database Syst. 2009, 5, 532–538. [Google Scholar]
Figure 1. The general framework for predicting the number of international and domestic arrival tourism in this research.
Sustainability 15 07179 g001
Figure 2. The monthly collected data after utilizing the min–max normalization, in Vietnam and provinces, including Hue, Khanh Hoa, Kien Giang, and Da Nang, from January 2011 to December 2022, combining with other additional features.
Sustainability 15 07179 g002
Figure 3. The Pearson correlation matrix between input and target variables in predicting algorithms.
Sustainability 15 07179 g003
Figure 4. The standard RNN cell.
Sustainability 15 07179 g004
Figure 5. The internal cell of the LSTM architecture.
Sustainability 15 07179 g005
Figure 6. The internal structure of the GRU cell, which reduces the gate number.
Sustainability 15 07179 g006
Figure 7. The structure of convolution layers in processing 2D input data.
Sustainability 15 07179 g007
Figure 8. The developed hybrid convolution neural network and long short-term memory in predicting arrival tourism.
Sustainability 15 07179 g008
Figure 9. The effectiveness of hyperparameter on the predicting performance: (a) for Vietnam data collection, (b) for Da Nang data collection, (c) for Hue data collection, (d) for Khanh Hoa data collection, and (e) for Kien Giang data collection.
Sustainability 15 07179 g009
Figure 10. The performance comparison between the developed CNN–LSTM and other methodologies: (a) for Vietnam tourism collection, (b) for Da Nang tourism collection, (c) for Hue tourism collection, (d) for Khanh Hoa tourism collection, and (e) for Kien Giang tourism collection.
Sustainability 15 07179 g010
Figure 11. The testing error for different predicting horizon with various methodologies and data collections.
Sustainability 15 07179 g011
Table 1. The hyperparameter configuration for the developed CNN–LSTM methodology in predicting arrival tourism.
Hyperparameter Setting
Learning rate0.001
Cost functionMSE
Optimizer algorithmADAM
Batch size32
Dropout Rate0.1
Learning/Validating/Testing split80:10:10
Training epoch100
Input dataWindow size(6, 9, 12, 15)
CNN layersDepth CNN layers1
Activation functionRelu
Number filters(8, 16, 32, 64)
Padding & Stride1
CNN filter size3 × 3
LSTM LayersDepth LSTM layers(2, 3, 4)
Activation function Relu
LSTM neuron(32, 64, 128)
FC layersDepth2
Activation functionRelu
Neuron64
Disclaimer/Publisher’s Note: The statements, opinions and data contained in all publications are solely those of the individual author(s) and contributor(s) and not of MDPI and/or the editor(s). MDPI and/or the editor(s) disclaim responsibility for any injury to people or property resulting from any ideas, methods, instructions or products referred to in the content.

