Article

Study on Coupling Coordination Relationship between Urban Development Intensity and Water Environment Carrying Capacity of Chengdu–Chongqing Economic Circle

School of Resources and Safety Engineering, Central South University, Changsha 410083, China
*
Author to whom correspondence should be addressed.
Sustainability 2023, 15(9), 7111; https://doi.org/10.3390/su15097111
Submission received: 20 February 2023 / Revised: 3 April 2023 / Accepted: 18 April 2023 / Published: 24 April 2023
(This article belongs to the Special Issue Urbanization and Environmental Sustainability)

Abstract

:
The high-level coupling coordination relationship between urban development and a city’s water environment carrying capacity is conducive to urban sustainable development. Taking the Chengdu–Chongqing Economic Circle as the research object, this study developed an index system to determine the urban development intensity and water environment carrying capacity, respectively. Based on the comprehensive evaluation model and the coupling coordination degree model, the spatial distribution characteristics, agglomeration law of urban development intensity, water environment carrying capacity and their coupling coordination relationship were analyzed. The results showed that the areas with a high urban development intensity were distributed in the main urban districts of Chengdu and Chongqing, and the intensity gradually reduced away from both core cities, which formed a “ripple-like” pattern. The areas with a high water environment carrying capacity were mainly in the southwest, southeast, northeast and central parts of the region and were distributed in a “W” pattern along the Yangtze River. The coupling coordination degree between the urban development intensity and water environment carrying capacity was low, as only 11.4% of the cities were coordinated while most cities were slightly uncoordinated. The research results can provide a theoretical basis for sustainable urban development in the Chengdu–Chongqing Economic Circle.

1. Introduction

Nowadays, global urbanization is continuing to accelerate. The global population of cities rose from 746 million in 1950 to 2.9 billion in 2014 [1]. Between 2015 and 2030, the urban population is expected to grow by 1.5 billion, of which 60% of the total population (5 billion) will live in cities. By 2050, it is estimated that 70% of people will live in urban areas [1]. In this historic process of urbanization, developing countries in Asia and Africa will cover 90% of the growth [2]. In the context of rapid urbanization in developing countries, the issue has become more and more prominent in recent times—the conflict between urban development and environmental protection has led to a series of problems, such as water quality degradation [3], land use and land cover change [4], environmental deterioration [5] and so on. Among these problems, the water environment problems caused by rapid urbanization garnered significant attention from the public and researchers [6]. Abdollahi studied the link between environment pollution and economic growth in eight neighboring developing countries and found a bidirectional causal relationship between the two [7], which means that environmental protection is as important as economic development for developing countries.
China, as the world’s largest developing country, has seen a growing conflict between urbanization and the environment. In the context of urbanization, urban agglomerations have emerged as the strategic core zones for economic development and the primary platform for new urbanization [8]. Currently, China’s urban agglomerations cover 20% of the total land area in the country, which accommodates 60% of the population and contributes 80% to the national economy [9]. However, the rapid and high-intensity development in urban agglomeration has also brought about industrial wastewater, waste gas and solid waste, and is responsible for 67% of the total waste produced [9]. Against this backdrop, many problems in urban agglomeration have emerged such as high-density population concentration and environmental pollution, as well as the rapid expansion of land [10]. Therefore, it is necessary and significant to explore approaches to sustainable development.
In October 2021, the Central Committee of the Communist Party of China and the State Council issued A Master Plan for the Construction of the Chengdu–Chongqing Economic Circle (hereinafter referred to as the Plan), whereby major decisions and arrangements were made to promote the Chengdu–Chongqing Economic Circle and create an important growth engine for high-quality development. Located at the intersection of “the Belt and Road Initiative” and the Yangtze River Economic Belt, the Chengdu–Chongqing Economic Circle enjoys obvious regional advantages. The region boasts excellent ecological resources, abundant minerals, dense cities and varied scenery. It is the region with the densest population, the strongest industrial base and innovation ability, the most promising market and the highest degree of openness in Western China, which gives it a unique and important strategic position in China’s overall national development [11]. In the process of vigorously strengthening the development of urban agglomeration, requirements were also put forward; for example, forming a basic ecological security pattern, effectively addressing the serious environmental problems and improving the coordinated supervision of the ecological environment and the compensation mechanism for regional ecological protection [12]. The rapid economic development in this region added pressure on resources and the environment, especially the water environment [13]. Although the region is rich in water resources, problems still exist such as a low efficiency of water utilization, waste of water resources, uneven distribution in time and space and serious pollution [14]. The region ranked at the bottom in the evaluation of water resources and the environmental carrying capacity within the Yangtze River Economic Belt [15]. Urban water environment pollution has become increasingly obvious, especially in the agglomeration and superposition of point and nonpoint source pollution, domestic and industrial pollution sources and various primary and secondary pollutants [16]. Therefore, to achieve sustainable development in urban agglomerations, it is essential to shift from traditional development models and ensure coupling and coordination between urban development and water environment protection.
To solve the abovementioned problems, many achievements have been made in the research on the coordinated development between urban development and resources and the environment. As for the research scope, previous studies mainly focused on urban agglomeration and the provincial region [17]; for example, Wang [18] studied the coupling coordination relationship between urbanization and the ecosystem in Beijing–Tianjin–Hebei, and Zhao [19] explored the relationship between urbanization and the water environment in the Hanjiang River basin; in terms of the index system construction, scholars have mainly adopted the index of population density, construction intensity and economic benefits [20] to characterize the urban development intensity (UDI) based on the concept of land development intensity [21,22]. Regarding the water environmental carrying capacity (WECC), conceptual models such as PSR [23] and DPESBRM [24] were used to build the corresponding evaluation index system. In the study of the coupling coordination relationship, the coupling coordination degree (CCD) model [21], geographic spatial–temporal weighted model (GTWR) [25] and other methods were introduced to study the spatial–temporal changes as well as the driving forces of the UDI and resource and environment carrying capacity [26]. Meanwhile, remote sensing (RS) [27], geographic information systems (GIS) [28] and other modern information and monitoring technologies were also applied. In the relevant research on urban sustainability, the UDI depended on urban development strategies and land-use modes. The rational development of urban land is crucial to promote the healthy development of society and ensure the sustainable use of urban land resources [29]. The WECC has emerged as a key tool to evaluate the coordination between socioeconomic activities and water environment systems, which is playing an increasingly important role in decision making for sustainable development [30]. From the perspective of achieving sustainable development in a region, a positive and highly coupling coordination relationship between the UDI and WECC is necessary [31]. The coordination and cooperation between urban planning and water resource management is the key to ensure the harmony between urban development and the water environment [32]. In the relevant research on the Chengdu–Chongqing region, Liu Dengjuan [33] studied the coordination relationship between environment and economic development and summarized the development laws of the Chengdu–Chongqing economy and environment. Yang Liangjie [34] investigated the type, evolution and decoupling of the interaction between the urbanization quality and resources and the environment of the Chengdu–Chongqing urban agglomeration.
Generally, the present research also shows deficiencies. First, most studies focused on the coupling coordination relationship between the overall ecological environment and urban development intensity and few focused on single aspects, and the studies usually introduced comprehensive concepts of the ecological environment that were too broad, which easily led to a lack of specificity. Second, improvements still need to be continuously made in the concept, evaluation and measurement methods of the UDI and WECC. For the former, the evaluation indicators were usually selected subjectively according to different evaluation objects. For the latter, its connotation still needs to be extended from a single land development intensity to a representation of the overall urban development. Therefore, a more comprehensive index system needs to be established. Third, most studies attached more importance to the central and eastern parts of China, and few explored the western cities. Correspondingly, the researchers often chose specific cities as the research objects, while fewer studies placed emphasis on the Chengdu–Chongqing region.
In summary, the Chengdu–Chongqing Economic Circle has faced increasing water environmental pressure due to economic and population growth, which has resulted in serious water environmental problems. Therefore, this study will carry out the following work in response to the abovementioned problems: (1) Construct a coupling coordination model of the WECC and UDI for urban agglomeration. Based on the literature review combined with the water environmental situation and economic development in the Chengdu–Chongqing Economic Circle, and considering the interaction between the WECC and UDI, the evaluation index system of the WECC and UDI is established. Finally, a coupling coordination model is constructed by introducing a comprehensive evaluation model. (2) Conduct a spatiotemporal analysis of the coupling coordination of the WECC and UDI for urban agglomeration. Based on the constructed index system, data from various cities of the Chengdu–Chongqing Economic Circle in 2020 are collected. Then, the spatial distribution characteristics of the WECC, UDI and CCD are analyzed by using the coupling coordination model and the visualization function of GIS. (3) Provide optimization suggestions for the coupling coordination relationship of the Chengdu–Chongqing Economic Circle’s WECC and UDI. According to the results of the data analysis, targeted measures are proposed from technical, economic, policy and other aspects to improve the WECC, UDI and CCD. The ultimate goal of this research is to enhance the WECC and UDI of urban agglomeration, achieve a high-level coupling coordination relationship between the UDI and WECC and realize sustainable development in the region. This study has certain reference significance in terms of achieving sustainable development for urban agglomeration areas facing water environmental problems.

2. Materials and Methods

2.1. Study Scope

According to the Plan issued by the State Council, its scope includes parts of Kaizhou and Yunyang and 27 districts (counties), namely the central area of Chongqing, Wanzhou, Fuling, Qijiang, Dazu, Qianjiang, Changshou, Jiangjin, Hechuan, Yongchuan, Nanchuan, Bishan, Tongliang, Tongnan, Rongchang, Liangping, Fengdu, Dianjiang and Zhongxian in Chongqing, as well as 15 cities of Chengdu, Zigong, Luzhou, Deyang Mianyang (except Pingwu County and Beichuan County), Suining, Neijiang, Leshan, Nanchong, Meishan, Yibin, Guang’an, Dazhou (except Wanyuan City), Ya’an (except Tianquan County and Baoxing County) and Ziyang in Sichuan Province. It covers a total area of 185,000 square kilometers. In 2019, there were 96 million permanent residents with a GDP of nearly 6.3 trillion yuan (96.5 billion US dollars), which accounted for 6.3% of the country’s total [11]. Based on the systematic, integrated and feasible data analysis, this study included Mianyang, Dazhou and Ya’an. The geographic location is presented in Figure 1.

2.2. Date Sources

Given the completeness and availability of the data, this paper took data from the year 2020 as the standard for statistical analysis. The data are mainly from the Sichuan Statistical Yearbook, Chongqing Statistical Yearbook, China Urban Statistical Yearbook, Sichuan Water Resources Bulletin, Sichuan Environment Statistics Bulletin, Chongqing Water Resources Bulletin, Chongqing Environment Statistics Bulletin, “Fourteenth Five-Year Plan”, environmental quality bulletin and water resources bulletin in all cities and counties.

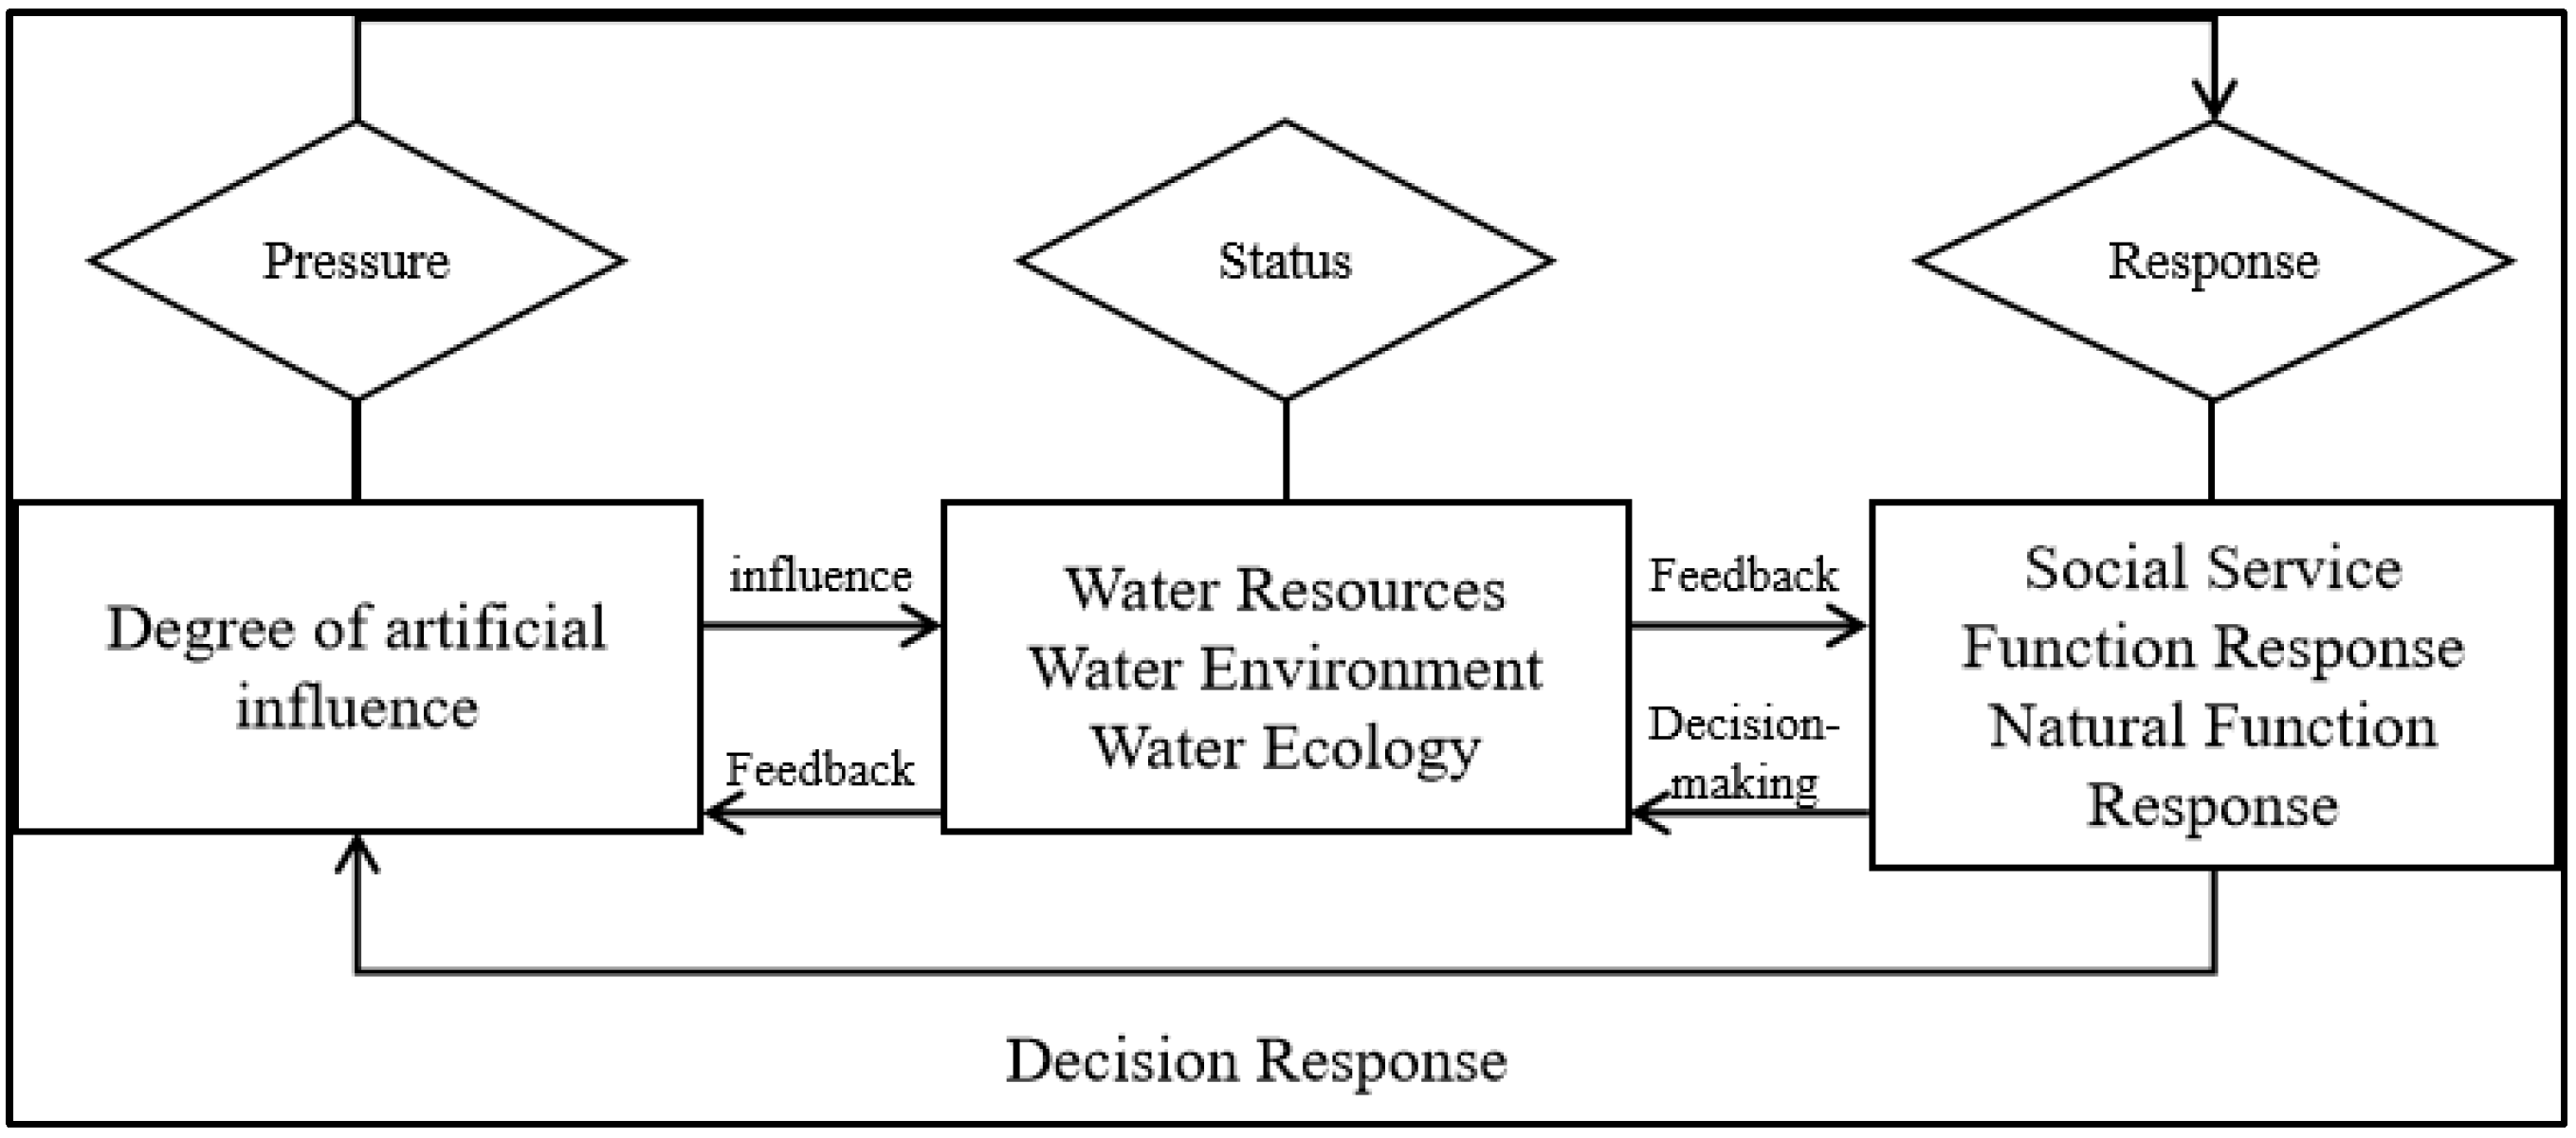
2.3. The Interaction between UDI and WECC

Previous studies mainly focused on the relationship between resources and the environmental carrying capacity and urban development, and there were relatively few studies on the WECC and UDI, but the principle of their interaction was similar. According to the relevant literature, it was found that over a long period of time, urban development and the environment have been mutually constrained and coordinated with each other. Therefore, the relationship between the UDI and WECC can be defined as a coupling coordination relationship [35,36,37]. This means that the relationship between the UDI and WECC can be characterized as a dynamic balance. The coupling coordination mechanism between the UDI and WECC is summarized in Figure 2.

2.4. Establishment of Evaluation Index System

2.4.1. UDI Evaluation Index System

Urban development refers to the urbanization process with urban land use as the core. It forms an urban physical space and provides services that are compatible with urban functions through the investment of capital and labor and thus achieves economic, social and environmental benefits [38]. As a complex concept including a multilayer structure and multiple elements, the development intensity is the cumulative reflection of the regional carrying density [30]. On the basis of the current research on urban development intensity [39], this paper selected six indicators from three aspects to establish the UDI index system, namely population concentration, economic agglomeration and land use, as shown in Table 1.

2.4.2. PSR-Based WECC Evaluation Index System

On the premise of not deteriorating the water environment, the WECC refers to the threshold of the capacity of the water environment system to bear socioeconomic activities in a certain period and region [40]. Previous research introduced the Pressure–Status–Response (PSR) model, which distinguishes three types of indicators: pressure indicators, status indicators and response indicators. Among them, indicators of pressure are used to characterize the impact of human economic and social activities on the environment; indicators of status are used to characterize the environmental conditions and changes at a specific point in time; and indicators of response refer to the actions taken by society and individuals to mitigate, prevent, restore and address the negative impacts of human activities on the environment. The model framework for evaluating the WECC is shown in Figure 3. This paper selected 13 evaluation indicators based on the PSR model, the establishing principles of the evaluation index system and relevant research [41,42]. Finally, the evaluation index system of the WECC in the Chengdu–Chongqing Economic Circle was established, as shown in Table 2.

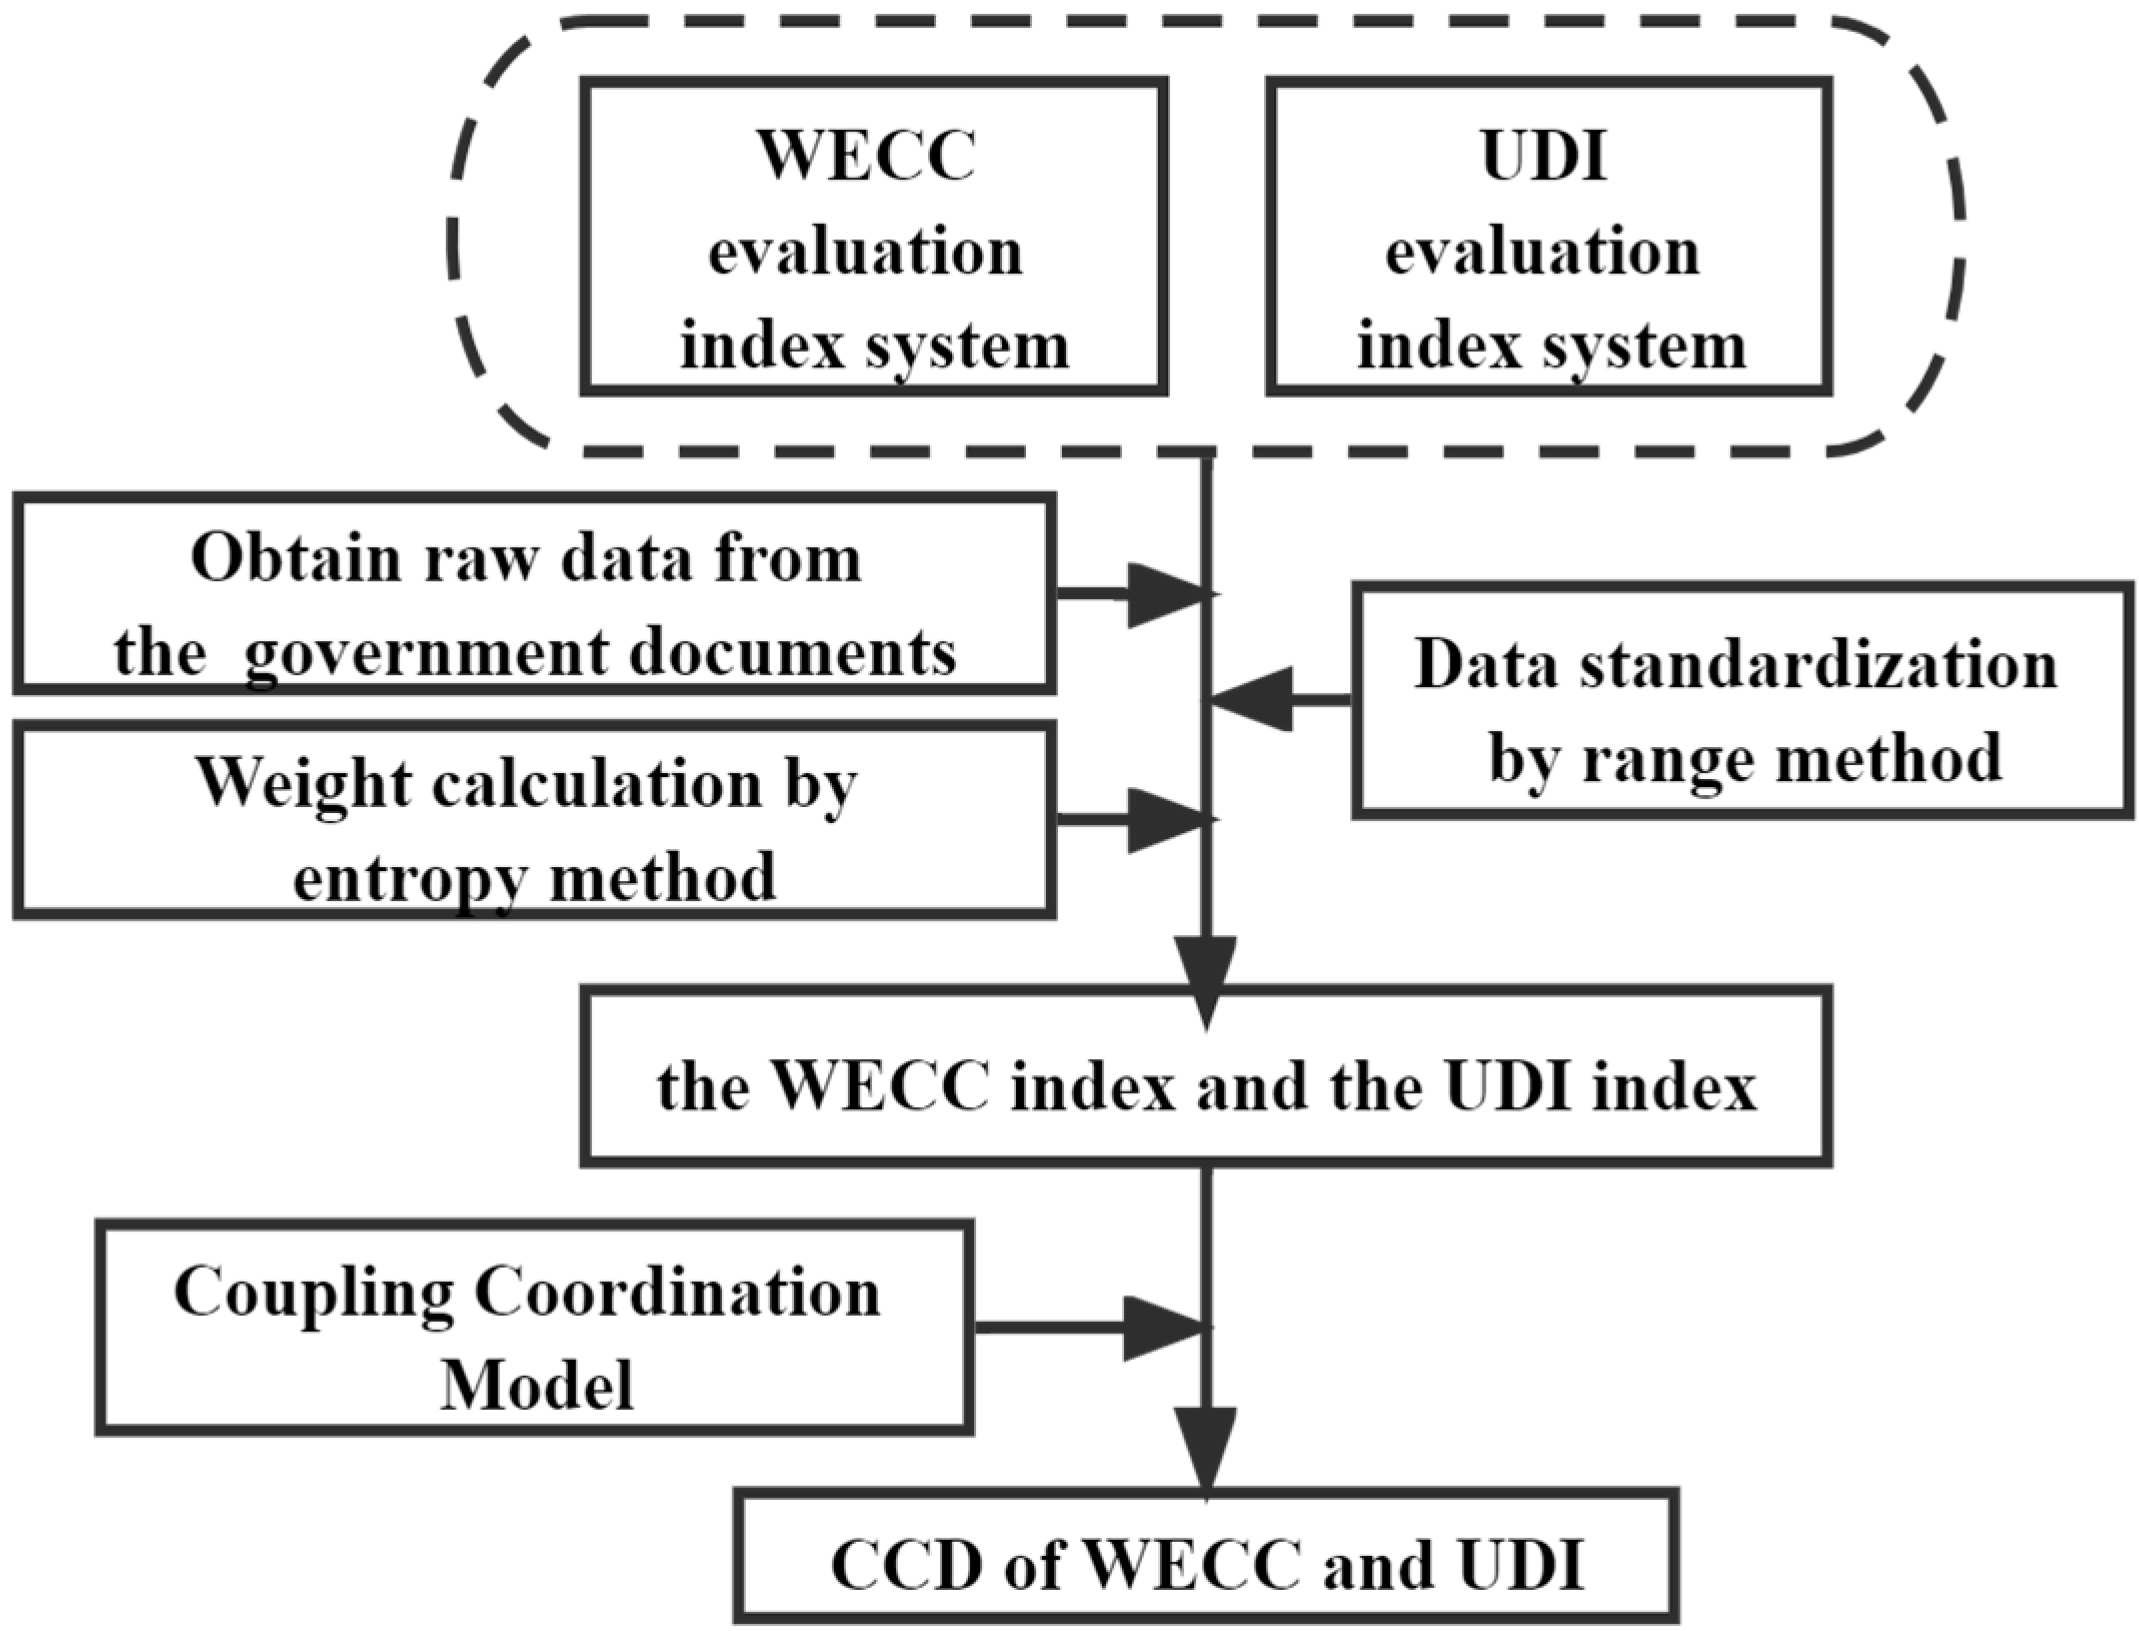
2.5. Research Methods

Based on the coupling coordination mechanism between the UDI and WECC and the system of evaluation indicators for the WECC and UDI, this study used a comprehensive evaluation and coupling coordination model to quantify the WECC, UDI and their coupling coordination relationship. The specific quantification calculation process mainly consists of three steps: First, the original data are obtained from relevant public documents based on the evaluation index system. Second, the comprehensive evaluation model is used to calculate the index of the UDI and WECC. Third, the coupling coordination model is introduced, and the index of the UDI and WECC are brought into this model to obtain the CCD of the two. The process is shown in Figure 4.

2.5.1. Comprehensive Evaluation Model

The comprehensive evaluation model applies the range method and entropy evaluation method to quantitatively calculate the UDI and WECC based on the above index system. The steps are as follows:
(1)
Data Matrix Establishment
A = X 11 X m 1 X 1 n X m n
where X i j (i =1, 2, …, m; j = 1, 2, …, n) represents the value of the j-th evaluation index under the i-th criterion. M is the number of criteria layers, and n is the number of indexes.
(2)
Data Standardization
The data in Table 2 were divided into positive and negative indexes for better data analysis, which eliminates the error caused by different initial dimensions and ensures that different data are comparable and referential. The range method is used for standardization according to Formulas (2) and (3).
Positive index standardization:
X i j = X i j min X i j max X i j min X i j
Negative index standardization:
X i j = max X i j X i j max X i j min X i j
where min X i j and max X i j represent the minimum and maximum value of the j-th index under all criterion layers, respectively.
(3)
Weight Calculation by Entropy Method
Given the actual status of the Chengdu–Chongqing region and the randomness of subjective weighting, this paper adopted the entropy method to calculate the weight. This method mainly determines the weight of each index according to the index variation degree, which eliminates the subjectivity of the weight of each factor and makes the evaluation result more consistent with reality [43].
The following are the specific steps:
Step 1: calculate the proportion P i j of index j under the i-th criterion:
P i j = X i j i = 1 m X i j
Step 2: calculate the information entropy e j :
e j = k i = 1 m P i j ln P i j
where k = 1 / ln m .
Step 3: calculate the information entropy redundancy d j :
d j = 1 e j
Step 4: calculate the weight of each index W j according to redundancy:
W j = d j j = 1 n d j
(4)
Comprehensive Evaluation Index
Based the calculated weights and standardized indexes, the WECC and UDI indexes are calculated:
f x i = j n w j X i j
g y i = j n μ j Y i j
where f x i and g ( y i ) are the WECC index and the UDI index of the i-th city, respectively. X i j and w j are the standardized value of and the corresponding index weight of the WECC, respectively. Y i j and μ j are the standardized value of and the corresponding index weight of the UDI, respectively.

2.5.2. Coupling Coordination Model

Coupling is the phenomenon characterized by two or more systems interacting with each other and influencing each other and reflects the strength of their interaction. Coordination is a positive correlation between the systems and indicates the progress of system elements from chaos to harmony [44]. The analysis of the coupling coordination relationship among systems can greatly solve their problem of unbalanced development so as to achieve mutual coordination and harmonious development among various systems or elements. The urban development system and the water environment system are not completely opposed and share the same future with interdependency [31]. This paper introduces the coupling coordination model to measure the degree of interaction between the WECC and UDI. The following are the specific formula used:
C i = 2 × f ( x i ) × g ( y i ) f ( x i ) + g ( y i ) 2
T i = α × f ( x i ) + β × g ( y i )
D i = C i × T i
where C i is the coupling degree of the WECC and UDI; D i is the coupling coordination degree; T i is the comprehensive coordination index of the WECC and UDI; and α and β are the contribution degrees of the WECC and UDI, respectively. As α bears a resemblance to β in terms of importance, α = β = 0.5 is determined [45]. Table 3 illustrates the specific classification of the coupling coordination levels [46].

3. Results

3.1. Index Weights

From Table 4, among the evaluation indicators of the UDI in the Chengdu–Chongqing Economic Circle in 2020, it is evident that the economic agglomeration intensity had the highest weight, while the land-use intensity had the lowest weight, which indicated that economic factors had the greatest impact on the UDI while land use had a relatively small impact on the level of the UDI. At the index layer, the economic density had the greatest impact on the UDI with a weight of 0.4201. Among the WECC evaluation indicators for each city, the pressure subsystem had the highest weight and the status subsystem had the lowest weight, which indicated that the pressure subsystem had the greatest impact on the WECC and the impact of the water environmental status on the WECC was relatively small. At the index layer, the indicators with the highest weight were the amount of industrial NH3-N emissions per million yuan of GDP, the greenery coverage in built-up areas and the fiscal expenditure on environmental pollution control as a proportion of GDP. This indicated that these three factors had a considerable impact on the WECC.

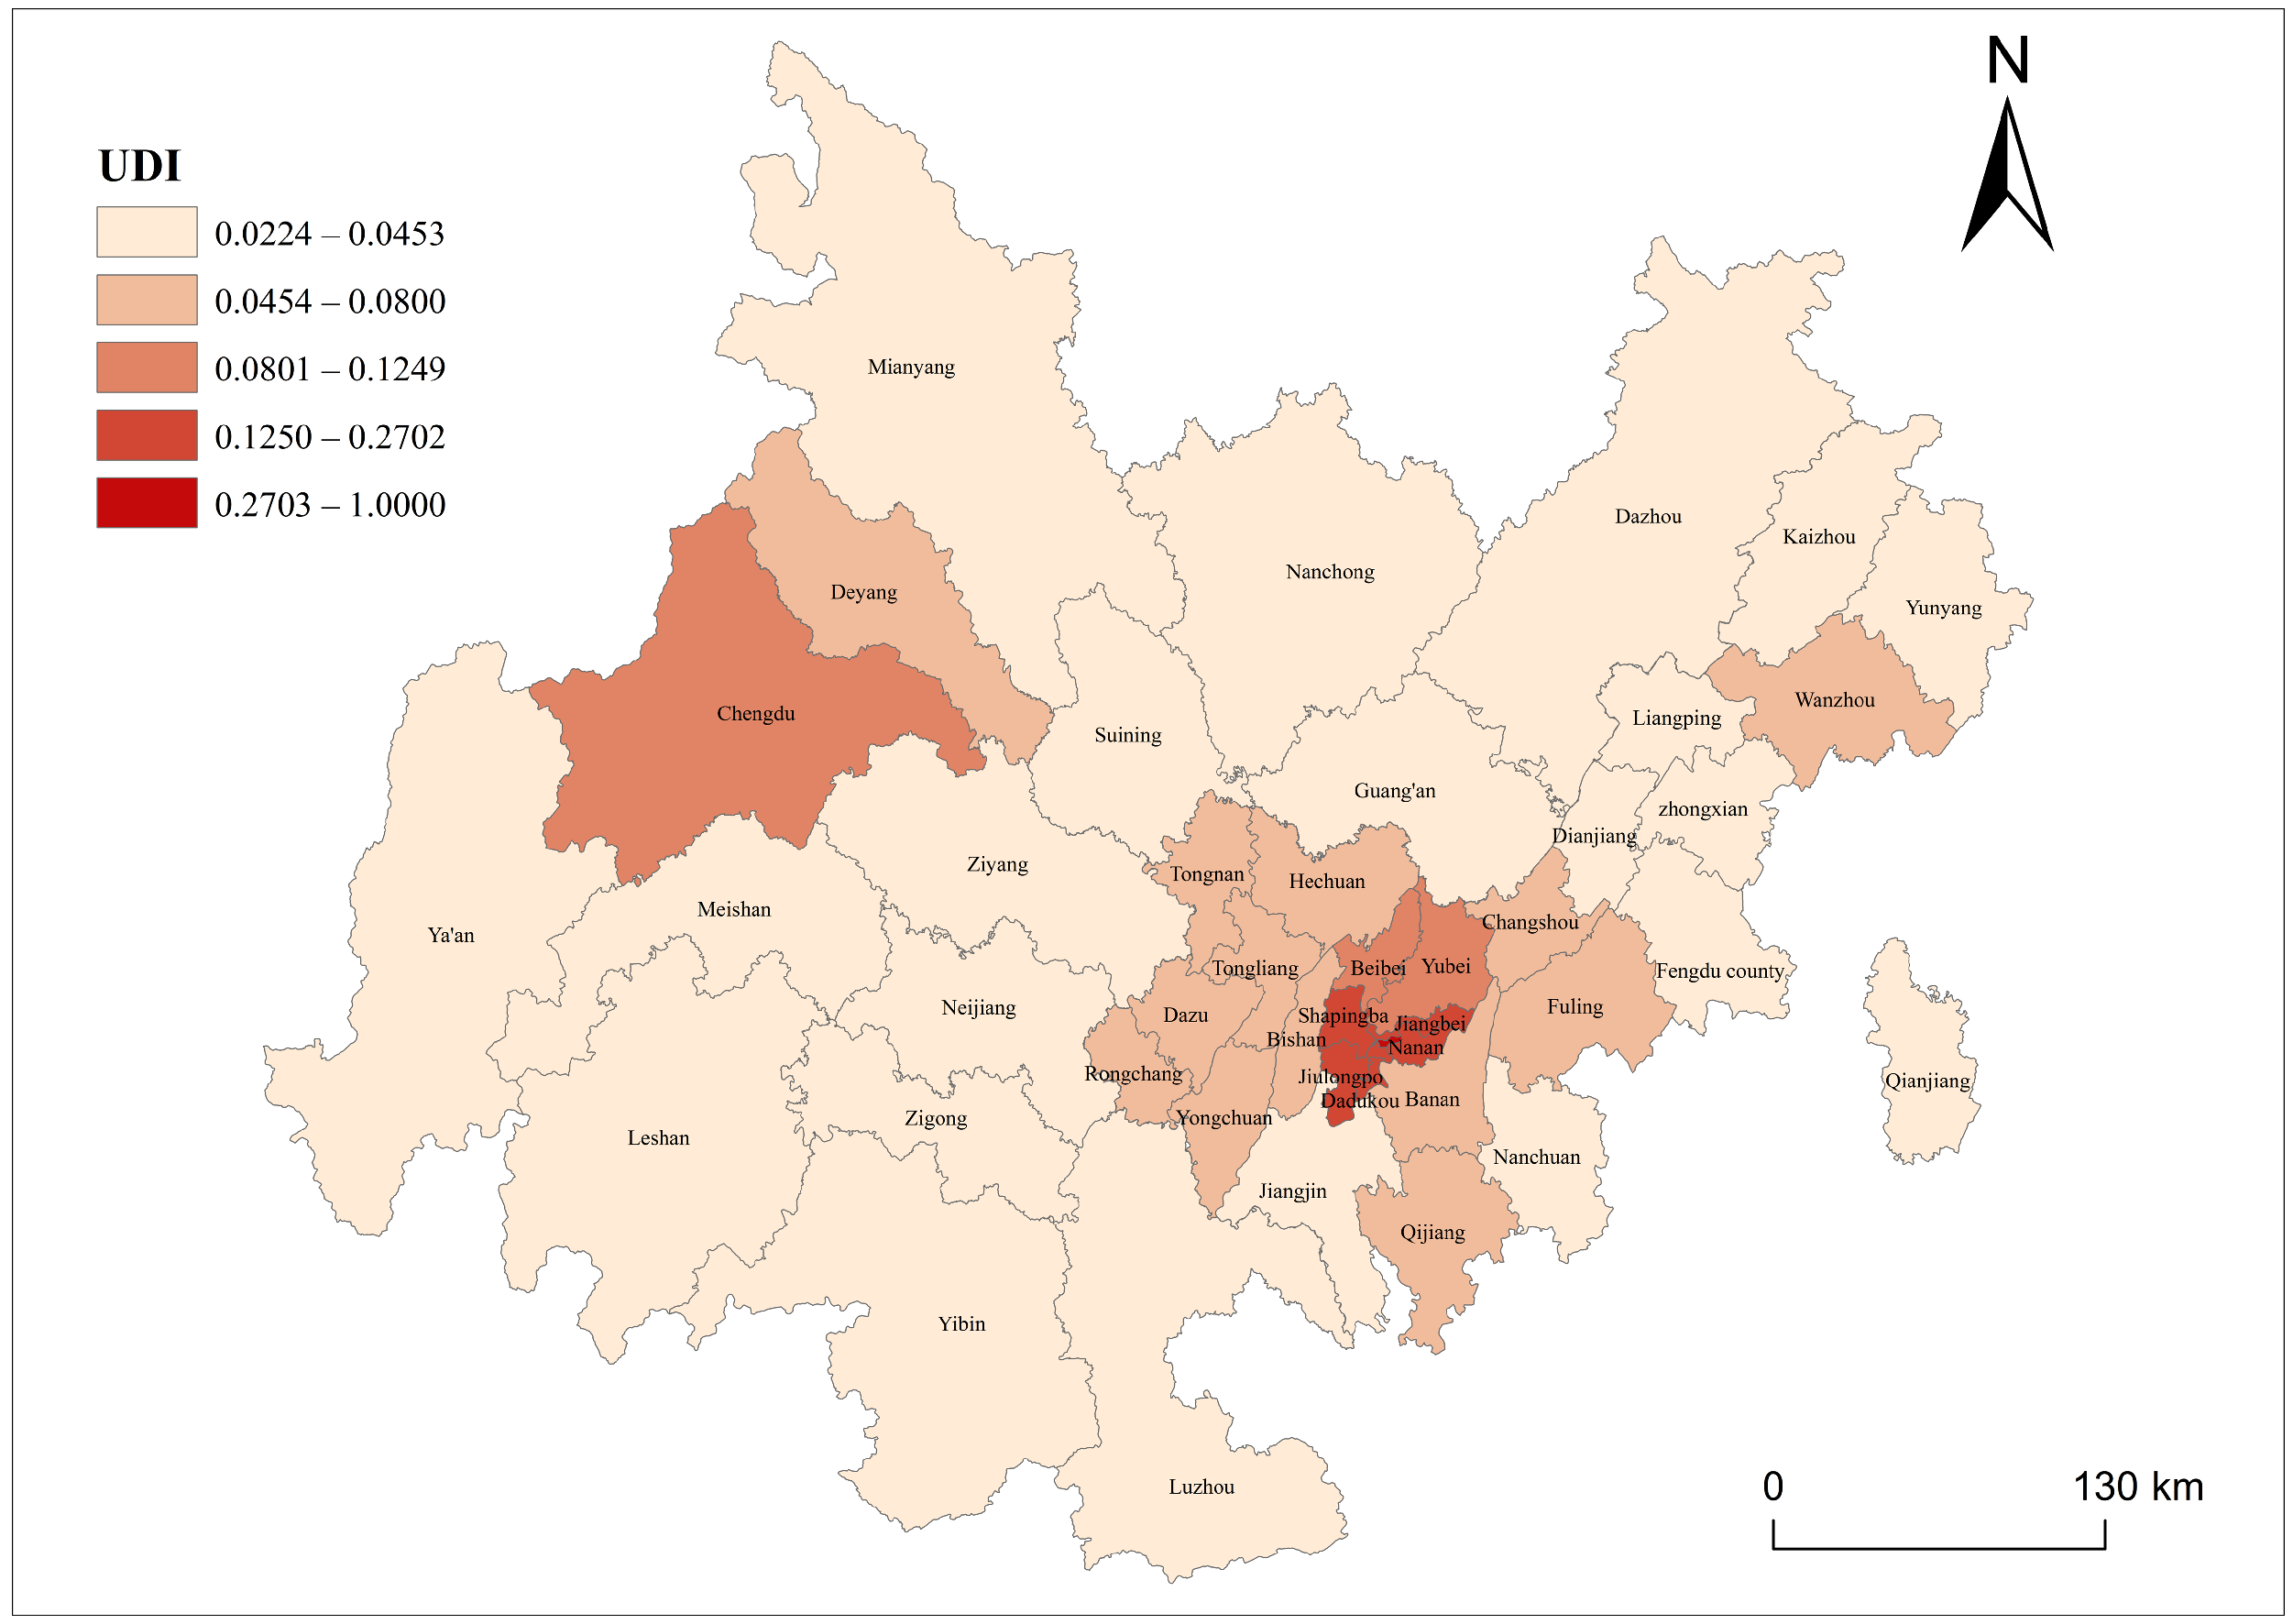
3.2. Analysis of UDI Spatial Pattern

In combination with the UDI evaluation index system and the comprehensive evaluation model, the UDI of the Chengdu–Chongqing Economic Circle was calculated in Table 5. By using the natural breaks (Jenks), the UDI was divided into five grades and was visualized in ArcGIS. The spatial distribution of the UDI is shown in Figure 5.
It can be seen from Figure 5 that the two core cities ranked the highest in the UDI, namely Chengdu and the main urban districts of Chongqing (except the Banan District). Although the Yuzhong District was the smallest administrative district in Chongqing, it had the most developed service and tourism industry. It became the area with the highest UDI due to its advantages of having a high economic density, population density and land use efficiency. Among the cities with an intermediate UDI in Sichuan Province, Deyang was the only city close to Chengdu. It developed together with Chengdu under the policy support of the Chengdu–Deyang integration. As for the cities with an intermediate UDI in Chongqing, most of them were located at the periphery of the main urban districts. They were listed as the new area; that is, the key area along with the main urban districts for future development. In addition, two more regional core cities were the Wanzhou District and Qianjiang District in the northeast and the southeast of Chongqing, respectively, both of which are important cities that support regional development. In conclusion, in the Chengdu–Chongqing Economic Circle, the UDI was the highest around the main urban districts of Chengdu and Chongqing, and it gradually reduced away from both core cities and formed a “ripple-like” pattern. Moreover, the UDI in Chongqing was generally higher than that in Sichuan.

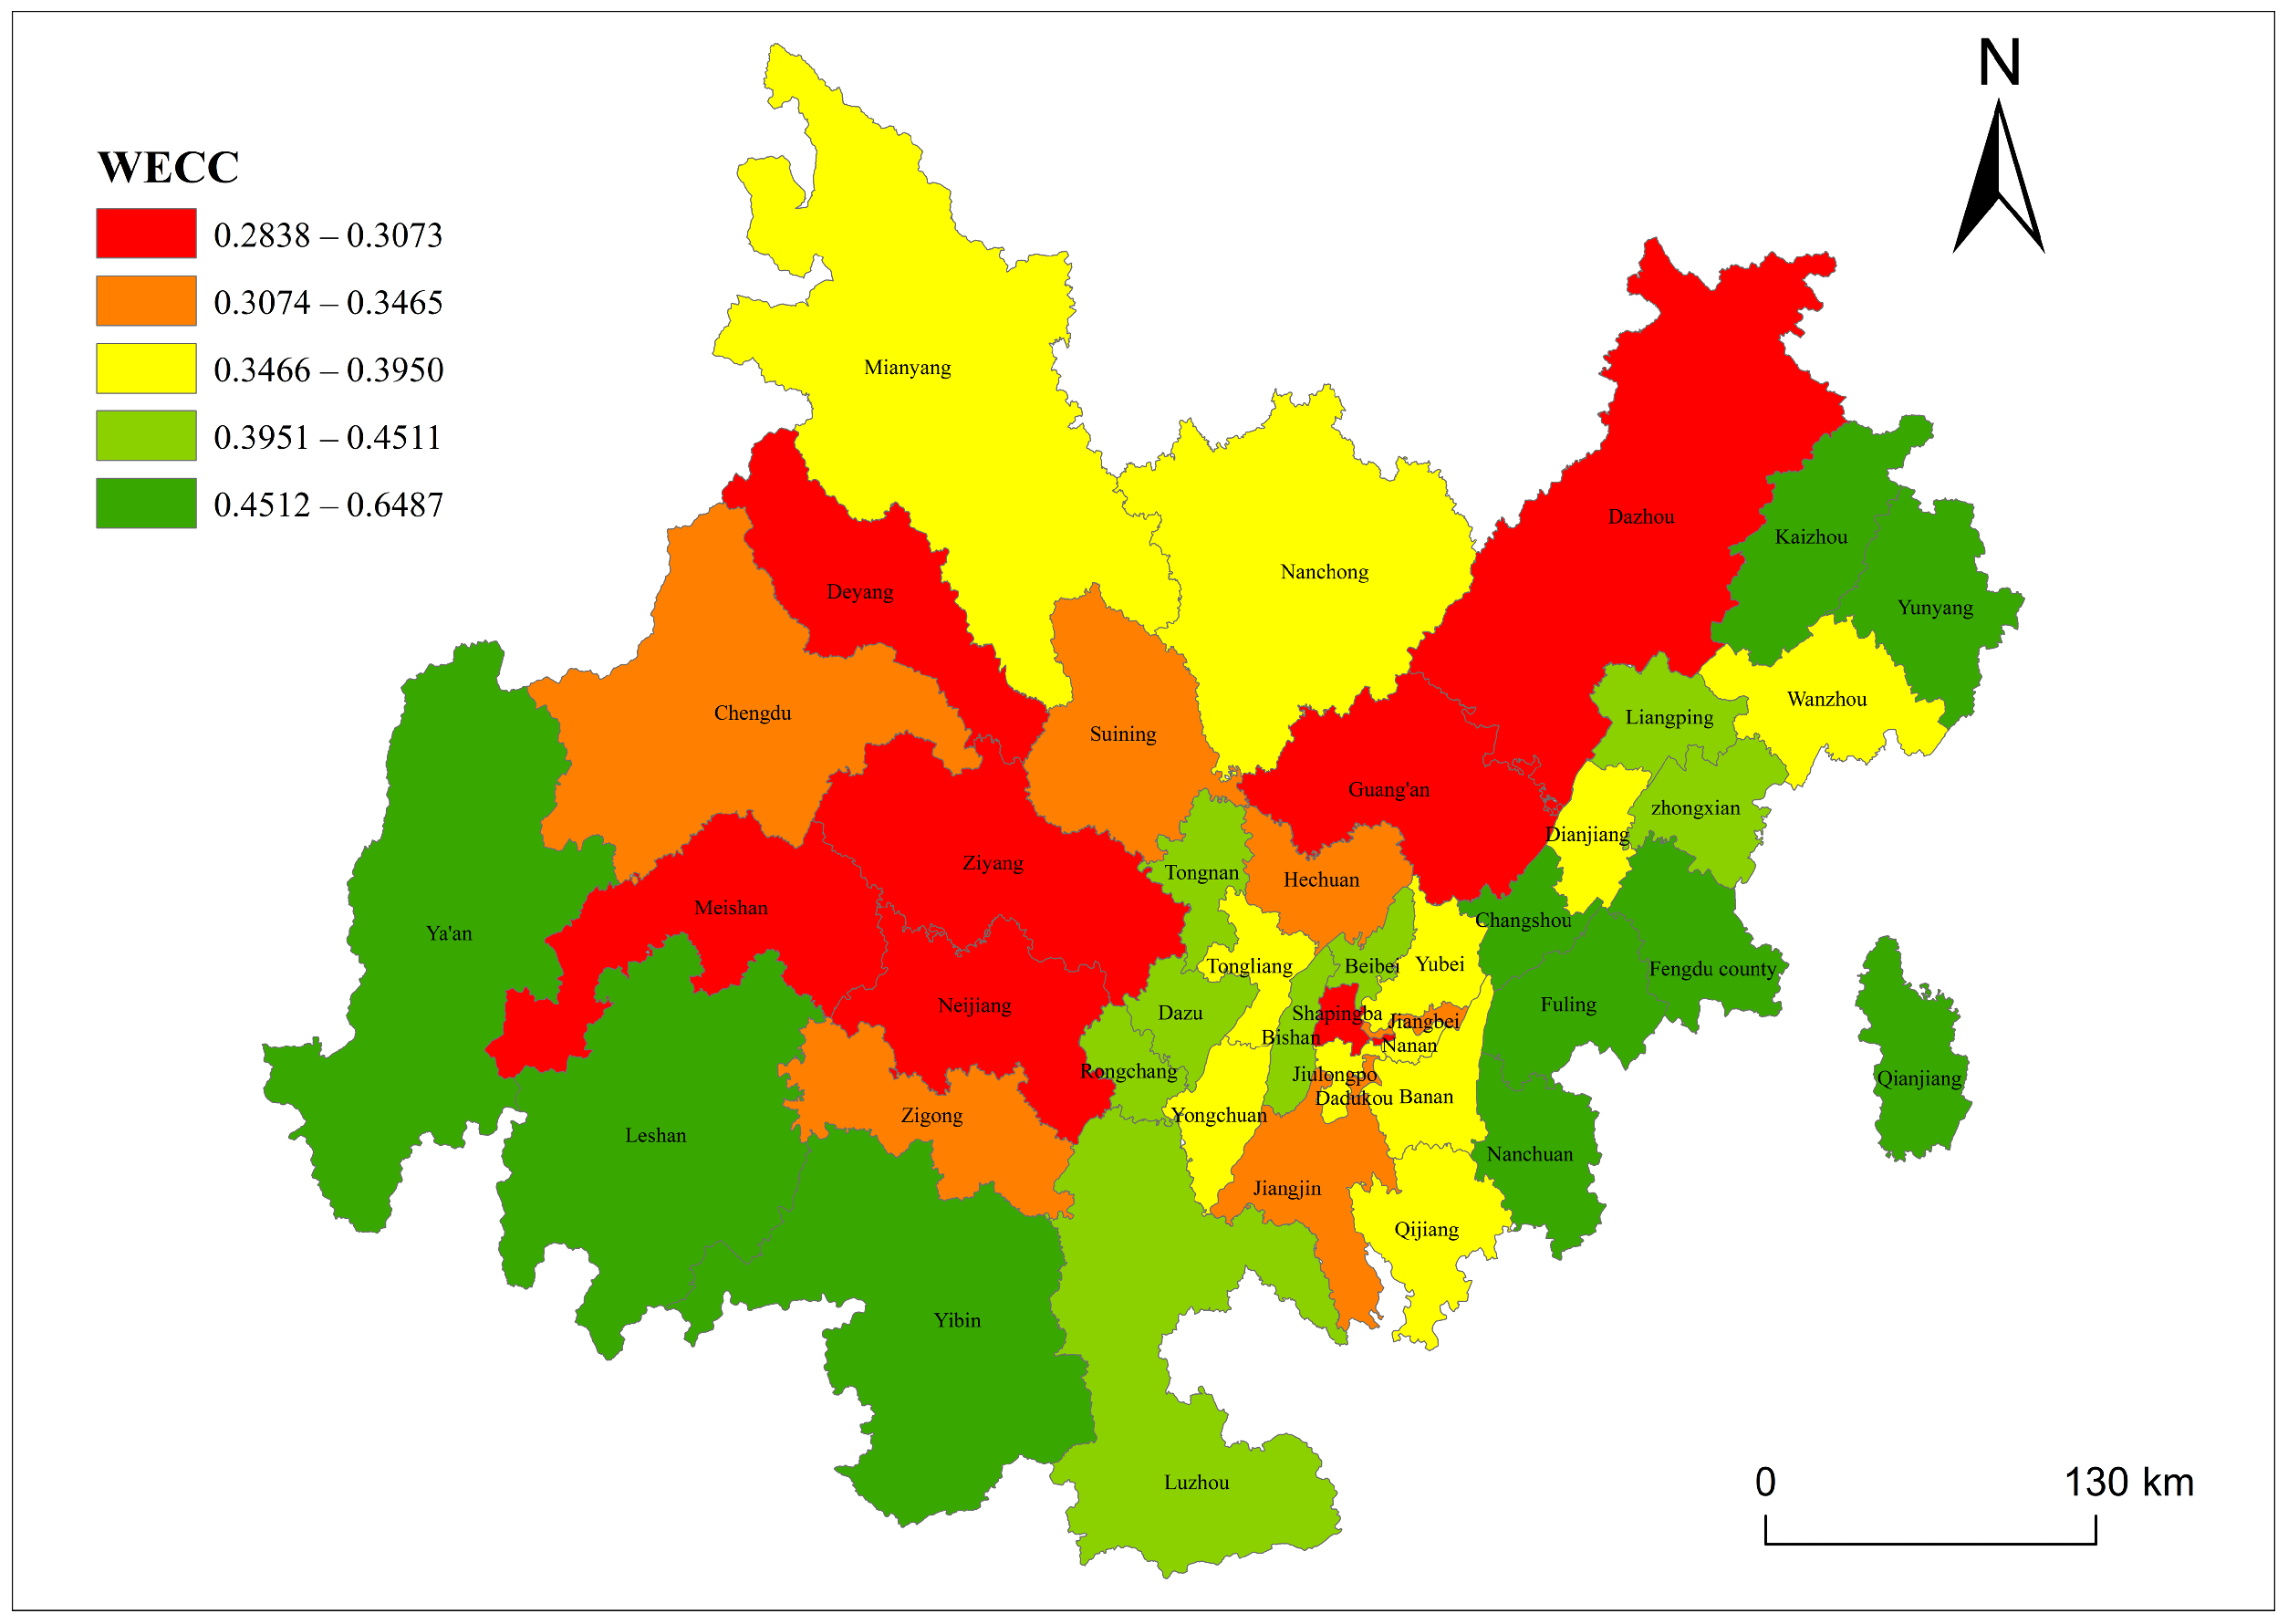
3.3. Analysis of WECC Spatial Pattern

In combination with the WECC evaluation index system and the comprehensive evaluation model, the WECC of the Chengdu–Chongqing Economic Circle was calculated in Table 6. Using the same processing method illustrated in Section 3.2, the spatial distribution of the WECC was obtained, as shown in Figure 6.
It can be seen from Figure 6 that the WECC was generally low within the Chengdu Metropolitan Area, Northeast Sichuan and main urban districts of Chongqing. This was mainly due to the high water environment pressure caused by the agglomeration of the industry and population. The areas with a high WECC were mainly around the urban agglomeration, such as Southwest Sichuan, Southeast Chongqing and Northeast Chongqing. They are concentrated along the Yangtze River basin and boast high-quality water resources with a small population and low environmental pressure. Some of the areas around the main urban districts of Chongqing also have a high WECC, such as the Bishan District and Beibei District. These areas, as the “green lung” and “back garden” of the main urban districts, play a significant role in improving the environment of the main urban districts and respond positively in the water environment. In conclusion, areas with a high WECC are mainly in the southwest, southeast, northeast and central parts of the Chengdu–Chongqing Economic Circle, and are distributed in a W shape along the Yangtze River basin.

3.4. Analysis of CCD Spatial Pattern

Based on the evaluation value of the UDI and WECC in each urban district, the coupling coordination degree of the Chengdu–Chongqing Economic Circle was calculated with the coupling coordination model, as shown in Table 7. The CCD was classified according to the grading method in Table 7, and its spatial distribution was obtained in ArcGIS, as shown Figure 4.
It can be seen from Figure 7 that among the 44 cities in the Chengdu–Chongqing Economic Circle, 1 city was at the intermediately incoordinate level, 28 cities were at the mildly incoordinate level and 10 cities were at the nearly incoordinate level. Four cities were at the slightly coordinated level, and one city was at the intermediately coordination level. The average coupling coordination index of the whole economic circle was 0.395, which means it belonged to the mildly incoordinate level. In this region, only five cities were coordinately developed, which accounted for 11.4% of the cities, and all the five cities were located in two core cities. Moreover, the Yuzhong District was the only environmental lagging city, and the other 43 units were all developmental lagging cities (their indexes of the UDI lagged behind that of the WECC). By analyzing the coupling coordination degree as a whole, it can be concluded that the economic circle with rich water resources and environment advantages generally owns a high WECC, but its relatively weak development of the economy, population and land bring about the incoordination between the UDI and WECC.

4. Discussion and Suggestions

4.1. Discussion

This paper established a comprehensive evaluation model and coupling coordination model for the WECC and UDI to solve the water environment problems existing in the Chengdu–Chongqing Economic Circle [29]. The research results showed the WECC, UDI and their spatial distribution characteristics in the region. According to the analysis results, the reason for the spatial pattern of the UDI was due to different urban positions. For example, Yuzhong District, as the political, economic, cultural and commercial center of Chongqing, has become the area with the highest level of development intensity in the Chengdu–Chongqing Economic Circle. Most of its low-value areas were dominated by agricultural development, so it took on higher ecological protection responsibilities. On the contrary, Zhongxian, with the lowest development intensity, is located in the heart of the Three Gorges Reservoir Area and has an ecological protection redline with an area of 154.44 km2, and the urbanization rate was only 48.27%. The reasons for the spatial patterns of the WECC were mainly due to two points. Firstly, most of the low-value areas were characterized by extensive growth cities with an insufficient industrial transformation, which resulted in a high water environmental pressure and an overall low water environmental carrying capacity. This was the case in most areas with a low WECC in Sichuan. For instance, Neijiang City is a typical old industrial city with a relatively extensive economic growth model. High-energy consumption and high-emission industries such as steel, thermal power and cement account for a large proportion, and structural pollution problems are more prominent. Secondly, there are differences in the endowment of water resources. It can be found that the high-value areas were concentrated in the Western Sichuan and Southeastern Chongqing regions with relatively well-endowed water resources, and the local population and industry were less developed and tended to follow the ecological development path, which resulted in a lower water environmental pressure.
According to the UDI, WECC and their coupling coordination relationship, the cities in the economic circle can be classified into three types. By analyzing the UDI, WECC and CCD, the common problems are identified, and policy recommendations are correspondingly proposed to achieve the overall sustainable development of the region. The specific categories and their existing problems are as follows: The first is the cities with a high UDI, low WECC and high CCD, such as the two core cities. This group of cities has low levels of indicators related to the pressure and status of the water environment, such as the daily domestic water consumption per capita (B14) and water holdings per capita (B22). The second is those with a low UDI, high WECC and low CCD, such as Southeast Sichuan and Northeast Chongqing. These types of cities are characterized by low levels of indicators such as population density (A11), economic density (A21) and percentage of urban built-up area in the total area (A32). The third is those with a low UDI, low WECC and low CCD, such as the northern part of Sichuan and the peripheral areas of the core cities. These types of cities have low levels of all standardized indicators of the state, including the WECC and UDI.
Compared with relevant research [12,33,34], this study addressed the following problems: (1) the data on the Chongqing districts and counties were too simple or incomplete in previous research; (2) there were only studies on resource and environmental issues, but few targeted studies focused on the relationship between water environmental issues and urban development. Therefore, this research has improved the data for all cities in Sichuan and counties in Chongqing. Based on the existing water environmental problems in the region, the study of urban sustainable development was carried out from the perspective of the coordination between the WECC and UDI, which solved the problem of the lack of relevant research in the region.
However, this research also has limitations. First, Chongqing, as a municipality directly under the Central Government, has experienced several internal changes in administrative division, which has resulted in a lack of district and county data and difficulty collecting data. Second, this paper only conducted research based on statistical data from the year 2020 without studying how the results may change when using data from different years. In the future, indicators can be optimized according to the availability of data, and relevant research can be carried out on different time scales. The WECC–UDI relationship is complex, and the specific mechanism of their internal indicators on the coupling coordination degree is still not clear. Therefore, the influencing factors and driving mechanisms of the coupling coordination relationship are expected to be discussed from a diversified perspective so as to draw more accurate and in-depth conclusions.

4.2. Policy Implications

(1)
Based on the calculation results and discussions in this research, three specific situations for different regions have been identified. In order to enhance the UDI, WECC and CCD of cities and to attain the objective of sustainable development in the urban agglomeration, the following recommendations are put forth:
(2)
Regarding the first type of city, many indicators in the Yuzhong District of Chongqing were at low levels, such as the per capita water resources, per capita green space and the proportion of environmental protection investments to GDP; additionally, the indicator of the per capita daily water consumption in Chengdu was also the lowest. Such cities are in the process of experiencing incremental constraints and potential reserve tapping. They should prioritize technological and compact development. Moreover, the utilization of water resources can be optimized by strengthening their investment in water environment protection, water-resource allocation and water-saving publicity. Thus, the pressure on the water environment can be reduced and the feedback can be enhanced so as to achieve the goal of improving the WECC and promoting the coupling coordination between urban development and the water environment.
(3)
Regarding the second kind of cities such as Zhongxian County and the Kaizhou District, they rank at the bottom in terms of population density, economic density and urbanization rate. However, their water qualification rate and industrial wastewater discharge rank is at the top; this is because those cities feature a sparsely populated land and high-quality water resources. Therefore, to maximize the advantages of a high WECC, it is essential that we make full use of them and then vigorously promote the combined development of agriculture and the service industry and explore new models such as leisure-sightseeing agriculture and efficient agriculture. In this way, the high-quality water resources can be transformed into capital, which will attract talents and investments. Finally, a new pattern featuring water ecology, water culture and leisure is formed.
(4)
The third type of cities, such as Ziyang City and Guang’an City, rank low in their per capita GDP and urbanization rate, as well as their water resource quality, annual average precipitation and per capita water resources. Such cities need regional codevelopment to strengthen exchanges with core cities such as Chengdu and Chongqing. They should receive a large number of industries and talents from areas with a high UDI to promote their own development. Meanwhile, they should not only achieve scientific development but also prioritize environmental protection. In this case, industries can be upgraded and transformed, and the relationship between development and the environment can be effectively handled. As a result, the goal of rapid and healthy development with high coordination can be achieved.

5. Conclusions

This study calculated the UDI and WECC of the Chengdu–Chongqing Economic Circle by establishing the corresponding evaluation index system. Moreover, the degree of the coupling coordination between the UDI and WECC was determined by applying the coupling coordination model. Then, we explored the spatial distribution law of the UDI, WECC and coupling coordination degree in this region by using ArcGIS. Finally, we drew the following conclusions:
(1)
In the Chengdu–Chongqing Economic Circle, the UDI was the highest around the main urban districts of Chengdu and Chongqing, and it gradually reduced away from both core cities and formed a “ripple-like” pattern. Moreover, the UDI in Chongqing was generally higher than that in Sichuan.
(2)
The areas with a high WECC were mainly in the southwest, southeast, northeast and central parts of the Chengdu–Chongqing Economic Circle and formed a W-shaped overall distribution along the Yangtze River basin. The areas with a low WECC were distributed in cities with a high urban development intensity and in industrialized cities.
(3)
The UDI and WECC in this region were generally slightly uncoordinated, and only 11.4% of the cities were coordinated. Moreover, the Yuzhong District was the only environmental lagging city, while the other 43 cities were all developmental lagging cities.
(4)
Based on the results of the data analysis, the cities in the study area were classified into three types, with the goal of enhancing the UDI, WECC and coupling coordination degree. Policy recommendations were proposed for typical problems existing in the different types of cities.
This study will provide some enlightenment for relevant research on the coupling and coordinated development of water environment protection and urban development. Moreover, the research results are expected to guide the policymakers in formulating urban sustainable development policies in the study area.

Author Contributions

Conceptualization, H.D. and J.Y.; methodology, J.Y.; software, P.W.; formal analysis, P.W. and J.Y.; resources, H.D.; data curation, J.Y.; writing—original draft preparation, J.Y.; writing—review and editing, H.D.; visualization, J.Y. and P.W.; funding acquisition, H.D. All authors have read and agreed to the published version of the manuscript.

Funding

This work was supported by the National Natural Science Foundation of China (Grant No. 51874352).

Institutional Review Board Statement

Not applicable.

Informed Consent Statement

Not applicable.

Data Availability Statement

The data used to support the findings of this study are available from the corresponding author upon request.

Conflicts of Interest

The authors declare no conflict of interest.

References

  1. United Nations Department of Economic and Social Affairs (UNDESA). World Urbanization Prospects. In United Nations Department of Economic and Social Affairs; United Nations: New York, NY, USA, 2014; Available online: https://esa.un.org/unpd/wup/publications/files/wup2014-highlights.pdf (accessed on 28 March 2023).
  2. United Nations. The World’s Cities in 2016; United Nations: New York, NY, USA, 2016. [Google Scholar]
  3. Li, W.; Hai, X.; Han, L.; Mao, J.; Tian, M. Does urbanization intensify regional water scarcity? Evidence and implications from a megaregion of China. J. Clean. Prod. 2020, 244, 118592. [Google Scholar] [CrossRef]
  4. Vargo, J.; Habeeb, D.; Stone, B. The importance of land cover change across urban–rural typologies for climate modeling. J. Environ. Manag. 2013, 114, 243–252. [Google Scholar] [CrossRef] [PubMed]
  5. Zhang, J.; Zeng, W.; Shi, H. Regional environmental efficiency in China: Analysis based on a regional slack-based measure with environmental undesirable outputs. Ecol. Indic. 2016, 71, 218–228. [Google Scholar] [CrossRef]
  6. Fang, C.; Wang, J. A theoretical analysis of interactive coercing effects between urbanization and eco-environment. Chin. Geogr. Sci. 2013, 23, 147–162. [Google Scholar] [CrossRef]
  7. Abdollahi, H. Investigating Energy Use, Environment Pollution, and Economic Growth in Developing Countries. Environ. Clim. Technol. 2020, 24, 275–293. [Google Scholar] [CrossRef]
  8. Fang, C. Important progress and future direction of studies on China’s urban agglomerations. J. Geogr. Sci. 2015, 25, 1003–1024. [Google Scholar] [CrossRef]
  9. Fang, C.; Zhou, C.; Gu, C.; Chen, L.; Li, S. A proposal for the theoretical analysis of the interactive coupled effects between urbanization and the eco-environment in mega-urban agglomerations. J. Geogr. Sci. 2017, 27, 1431–1449. [Google Scholar] [CrossRef]
  10. Fang, C.; Liu, X. Temporal and spatial differences and imbalance of China’s urbanization development during 1950–2006. J. Geogr. Sci. 2009, 19, 719–732. [Google Scholar] [CrossRef]
  11. Cheshmehzangi, A.; Tang, T. Chengdu-Chongqing City Cluster: From an Economic Zone to a Major Economic Circle in the Western China. In China’s City Cluster Development in the Race to Carbon Neutrality; Springer Nature: Singapore, 2022; pp. 77–92. [Google Scholar]
  12. Ying, Z.; Yuan, C.; Zhuolu, L.; Weiling, J. Ecological Resilience Assessment of an Emerging Urban Agglomeration: A Case Study of Chengdu-Chongqing Economic Circle, China. Pol. J. Environ. Stud. 2022, 31, 2381–2395. [Google Scholar] [CrossRef]
  13. Deng, H.; Song, X.; Li, C.; Li, Y.; Diao, H.; Xu, J. Comprehensive Evaluation on Urban Water Security Based on the Novel DPEBLR Concept Model and the Cloud Matter-Element Model: A Case Study of Chongqing, China. Water 2022, 14, 3486. [Google Scholar] [CrossRef]
  14. Liang, X.; Gong, Q.; Zheng, H.; Xu, J. Examining the impact factors of the water environment using the extended STIRPAT model: A Case Study in Sichuan. Environ. Sci. Pollut. Res. 2020, 27, 12942–12952. [Google Scholar] [CrossRef] [PubMed]
  15. Gao, S.; Guo, H.; Yu, J. Urban Water Inclusive Sustainability: Evidence from 38 Cities in the Yangtze River Economic Belt in China. Sustainability 2021, 13, 2068. [Google Scholar] [CrossRef]
  16. Liu, W.; Chen, W.; Feng, Q.; Deo, R.C. Situations, challenges and strategies of urban water management in Beijing under rapid urbanization effect. Water Supply 2018, 19, 115–127. [Google Scholar] [CrossRef]
  17. Kan, D.; Ye, X.; Lyu, L.; Huang, W. Study on the Coupling Coordination between New-Type Urbanization and Water Ecological Environment and Its Driving Factors: Evidence from Jiangxi Province, China. Int. J. Environ. Res. Public Health 2022, 19, 9998. [Google Scholar] [CrossRef]
  18. Wang, Z.; Liang, L.; Sun, Z.; Wang, X. Spatiotemporal differentiation and the factors influencing urbanization and ecological environment synergistic effects within the Beijing-Tianjin-Hebei urban agglomeration. J. Environ. Manag. 2019, 243, 227–239. [Google Scholar] [CrossRef]
  19. Zhao, G.; Liang, R.; Li, K.; Wang, Y.; Pu, X. Study on the coupling model of urbanization and water environment with basin as a unit: A study on the Hanjiang Basin in China. Ecol. Indic. 2021, 131, 108130. [Google Scholar] [CrossRef]
  20. Luo, X.; Cheng, C.; Pan, Y.; Yang, T. Coupling Coordination and Influencing Factors of Land Development Intensity and Urban Resilience of the Yangtze River Delta Urban Agglomeration. Water 2022, 14, 1083. [Google Scholar] [CrossRef]
  21. Huang, X.; Huang, X.; Liu, M.; Wang, B.; Zhao, Y. Spatial-temporal Dynamics and Driving Forces of Land Development Intensity in the Western China from 2000 to 2015. Chin. Geogr. Sci. 2020, 30, 16–29. [Google Scholar] [CrossRef]
  22. Tan, S.; Liu, Q.; Han, S. Spatial-temporal evolution of coupling relationship between land development intensity and resources environment carrying capacity in China. J. Environ. Manag. 2022, 301, 113778. [Google Scholar] [CrossRef]
  23. Men, B.; Liu, H. Water resource system vulnerability assessment of the Heihe River Basin based on pressure-state-response (PSR) model under the changing environment. Water Supply 2018, 18, 1956–1967. [Google Scholar] [CrossRef]
  24. Peng, T.; Deng, H.; Lin, Y.; Jin, Z. Assessment on water resources carrying capacity in karst areas by using an innovative DPESBRM concept model and cloud model. Sci. Total Environ. 2021, 767, 144353. [Google Scholar] [CrossRef] [PubMed]
  25. Zhang, J.; Dong, Z. Assessment of coupling coordination degree and water resources carrying capacity of Hebei Province (China) based on WRESP2D2P framework and GTWR approach. Sustain. Cities Soc. 2022, 82, 103862. [Google Scholar] [CrossRef]
  26. Qiao, R.; Li, H.; Han, H. Spatio-Temporal Coupling Coordination Analysis between Urbanization and Water Resource Carrying Capacity of the Provinces in the Yellow River Basin, China. Water 2021, 13, 376. [Google Scholar] [CrossRef]
  27. Xu, D.; Yang, F.; Yu, L.; Zhou, Y.; Li, H.; Ma, J.; Huang, J.; Wei, J.; Xu, Y.; Zhang, C.; et al. Quantization of the coupling mechanism between eco-environmental quality and urbanization from multisource remote sensing data. J. Clean. Prod. 2021, 321, 128948. [Google Scholar] [CrossRef]
  28. Wang, S.X.; Shang, M.; Zhou, Y.; Liu, W.L.; Wang, F.; Wang, L.T. Resources and Environmental Carrying Capacity Using RS and GIS. Pol. J. Environ. Stud. 2017, 26, 2793. [Google Scholar] [CrossRef]
  29. Yang, Q.; Wang, L.; Li, Y.; Fan, Y.; Liu, C. Urban land development intensity: New evidence behind economic transition in the Yangtze River Delta, China. J. Geogr. Sci. 2022, 32, 2453–2474. [Google Scholar] [CrossRef]
  30. Xu, Z.; Xiao, S.; Du, C.; Deng, Q.; Yan, B.; Zeng, Z.; Liu, X. Temporal Variation of Water Environment Carrying Capacity in a Highly Urbanized Region of China. Water 2020, 12, 3362. [Google Scholar] [CrossRef]
  31. Tao, J.; Xie, Y.; Zhou, H.; Xu, Y.; Zhao, G. Cross-County Characteristics of Water–Ecology–Economy Coupling Coordination in the Wuding River Watershed, China. Land 2022, 11, 2283. [Google Scholar] [CrossRef]
  32. Ma, X.; Li, N.; Yang, H.; Li, Y. Exploring the relationship between urbanization and water environment based on coupling analysis in Nanjing, East China. Environ. Sci. Pollut. Res. 2022, 29, 4654–4667. [Google Scholar] [CrossRef]
  33. Liu, D.; Lv, Y. Evaluation on the Environment and Economic Coordination Development of Chengdu-Chongqing Urban Agglomeration of the Yangtze River Economic Belt. Reform Econ. Syst. 2017, 203, 36–42. [Google Scholar]
  34. Yang, L.J.; Zhang, X.H.; Pan, J.H.; Yang, Y.C. Coupling coordination and interaction between urbanization and eco-environment in Cheng-Yu urban agglomeration, China. Chin. J. Appl. Ecol. 2021, 32, 993–1004. [Google Scholar] [CrossRef]
  35. Zhao, Y.; Wang, S.; Zhou, C. Understanding the relation between urbanization and the eco-environment in China’s Yangtze River Delta using an improved EKC model and coupling analysis. Sci. Total Environ. 2016, 571, 862–875. [Google Scholar] [CrossRef] [PubMed]
  36. Yao, L.; Li, X.; Li, Q.; Wang, J. Temporal and Spatial Changes in Coupling and Coordinating Degree of New Urbanization and Ecological-Environmental Stress in China. Sustainability 2019, 11, 1171. [Google Scholar] [CrossRef]
  37. Li, Y.; Li, Y.; Zhou, Y.; Shi, Y.; Zhu, X. Investigation of a coupling model of coordination between urbanization and the environment. J. Environ. Manag. 2012, 98, 127–133. [Google Scholar] [CrossRef] [PubMed]
  38. Huang, L.; Yang, P.; Zhang, B.; Hu, W. Spatio-Temporal Coupling Characteristics and the Driving Mechanism of Population-Land-Industry Urbanization in the Yangtze River Economic Belt. Land 2021, 10, 400. [Google Scholar] [CrossRef]
  39. Xu, W.; Dong, Y.-e.; Teng, X.; Zhang, P.-p. Evaluation of the development intensity of China’s coastal area. Ocean. Coast. Manag. 2018, 157, 124–129. [Google Scholar] [CrossRef]
  40. Kai, X.; Qiu, X.; Wang, Y.; Zhang, W.; Yin, J. The Water Environment Carrying Capacity of the Aiyi River Based on Artificial Neural Networks. Pol. J. Environ. Stud. 2020, 29, 131–139. [Google Scholar] [CrossRef]
  41. Wei, X.; Wang, J.; Wu, S.; Xin, X.; Wang, Z.; Liu, W. Comprehensive evaluation model for water environment carrying capacity based on VPOSRM framework: A case study in Wuhan, China. Sustain. Cities Soc. 2019, 50, 101640. [Google Scholar] [CrossRef]
  42. Song, W.; Pang, Y. Research on narrow and generalized water environment carrying capacity, economic benefit of Lake Okeechobee, USA. Ecol. Eng. 2021, 173, 106420. [Google Scholar] [CrossRef]
  43. Ding, X.; Chong, X.; Bao, Z.; Xue, Y.; Zhang, S. Fuzzy Comprehensive Assessment Method Based on the Entropy Weight Method and Its Application in the Water Environmental Safety Evaluation of the Heshangshan Drinking Water Source Area, Three Gorges Reservoir Area, China. Water 2017, 9, 329. [Google Scholar] [CrossRef]
  44. Ariken, M.; Zhang, F.; Liu, K.; Fang, C.; Kung, H.-T. Coupling coordination analysis of urbanization and eco-environment in Yanqi Basin based on multi-source remote sensing data. Ecol. Indic. 2020, 114, 106331. [Google Scholar] [CrossRef]
  45. Hong, T.; Wang, B.; Li, L. The Coupling Relationship between Urban Resilience Level and Urbanization Level in Hefei. Math. Probl. Eng. 2022, 2022, 7339005. [Google Scholar] [CrossRef]
  46. Li, D.; Fan, K.; Lu, J.; Wu, S.; Xie, X. Research on Spatio-Temporal Pattern Evolution and the Coupling Coordination Relationship of Land-Use Benefit from a Low-Carbon Perspective: A Case Study of Fujian Province. Land 2022, 11, 1498. [Google Scholar] [CrossRef]
Figure 1. Geographical location of Chengdu–Chongqing Economic Circle.
Sustainability 15 07111 g001
Figure 2. Coupling coordination mechanism between UDI and WECC.
Sustainability 15 07111 g002
Figure 3. PSR model based on WECC.
Sustainability 15 07111 g003
Figure 4. Quantification calculation process.
Sustainability 15 07111 g004
Figure 5. Spatial distribution of UDI in Chengdu–Chongqing Economic Circle.
Sustainability 15 07111 g005
Figure 6. Spatial distribution of WECC of Chengdu–Chongqing Economic Circle.
Sustainability 15 07111 g006
Figure 7. Spatial distribution of CCD of Chengdu–Chongqing Economic Circle.
Sustainability 15 07111 g007
Table 1. Evaluation index system of UDI.
Target LayerGuideline LayerIndex LayerDefinition of IndexUnitIndex Type
UDI (A)Population concentration
intensity (A1)
Population density (A11)Average number of people per unit area of landperson/km2+
Urbanization rate (A12)The proportion of urban residents to the total resident population in a country or region%+
Economic agglomeration
intensity (A2)
Economic density (A21)Ratio of gross domestic product (GDP) to area of administrative105 yuan/km2+
GDP per capita (A22)The ratio of GDP to the resident population of a region within the accounting period (usually one year)yuan+
Land-use intensity (A3)Per capita construction land area (A31)Total urban building land area per capita allocated to the total urban populationm2/person+
Percentage of urban built-up area in total area (A32)Ratio of urban built-up area to total administrative area%+
In the table, “+” represents positive (development) index and it means that the greater the value, the higher its support degree for the evaluation index.
Table 2. Evaluation index system of WECC.
Target LayerGuideline LayerIndex LayerDefinition of IndexUnitIndex Type
WECC (B)P (B1)Water consumption per unit of GDP (B11)Amount of water consumed per 10,000 yuan of GDPton/105 yuan
Industrial wastewater emissions per 10,000 Yuan GDP (B12)Industrial wastewater emissions per 10,000 yuan of GDPton/105 yuan
Energy consumption per unit of GDP (B13)Energy consumed by a country or region (to generate) one unit of measure (usually million) of GDPton of standard coal equivalent/105 yuan
Daily domestic water consumption per capita (B14)Average daily domestic water consumption per water user populationL
Industrial COD emissions per unit of GDP (B15)Industrial COD emissions per 10,000 yuan of GDPton/105 yuan
Industrial NH3-N emissionsper unit of GDP (B16)Industrial ammonia nitrogen emissions per 10,000 yuan GDPton/105 yuan
S (B2)Average annual precipitation (B21)Average annual rainfall measured at multiple observation points at a sitemm+
Water holdings per capita (B22)Average amount of water per person by populationm3+
Water quality compliance rate in water function zones (B23)Proportion of water functional areas meeting water quality standards to water functional areas evaluated%+
Green space per capita (B34)Average area of public green space per inhabitant in the citym2/person+
R (B3)Sewage treatment rate (B31)Volume of treated domestic and industrial effluent as a proportion of total effluent discharge%+
Greenery coverage in built-up areas (B32)Ratio of greenery coverage to total land area in built-up urban areas%+
Fiscal expenditure on environmental pollution control as a proportion of GDP (B33)The proportion of financial expenditure on environmental pollution prevention, ecological protection and construction to the local GDP of the year%+
In the table, “+” represents positive (development) index and “−” means negative (restriction) index. For the former, the greater the value, the higher its support degree for the evaluation index. For the latter, the smaller its value, the higher its support degree for the evaluation index.
Table 3. Classification of CCD Levels.
CCDLevelCCDLevel
(0, 0.1)Extremely incoordinate[0.5, 0.6)Slightly coordinate
[0.1, 0.2)Seriously incoordinate[0.6, 0.7)Basically coordinate
[0.2, 0.3)Intermediately Incoordinate[0.7, 0.8)Intermediately coordinate
[0.3, 0.4)Mildly incoordinate[0.8, 0.9)Well coordinate
[0.4, 0.5)Nearly incoordinate[0.9, 1]Excellently coordinate
Table 4. Weighting of each index of UDI and WECC.
Target LayerGuideline LayerIndex LayerWeights
AA1A110.2522
A120.0492
A2A210.4201
A220.0542
A3A310.0218
A320.2025
BB1B110.0686
B120.0174
B130.0257
B140.0311
B150.0982
B160.296
B2B210.0379
B220.0329
B230.0419
B240.0305
B3B310.0644
B320.1536
B330.1018
Table 5. UDI index of Chengdu–Chongqing Economic Circle.
NumberAdministrative DistrictUDINumberAdministrative DistrictUDINumberAdministrative DistrictUDINumberAdministrative DistrictUDI
1Yuzhong1.000012Yongchuan0.071923Suining0.045334Dazhou0.0339
2Jiangbei0.270313Fuling0.069124Jiangjin0.044335Qianjiang0.0338
3Dadukou0.225214Changshou0.064025Zigong0.043036Yunyang0.0336
4Nanan0.215115Rongchang0.063426Nanchuan0.040937Ya’an0.0326
5Shapingba0.195216Qijiang0.061027Leshan0.040138Liangping0.0321
6Jiulongpo0.189817Tongliang0.060628Dianjiang0.038139Luzhou0.0313
7Yubei0.125018Hechuan0.059029Yibin0.038040Guang’an0.0303
8Chengdu0.102519Dazu0.055530Neijiang0.037841Kaizhou0.0264
9Beibei0.100420Wanzhou0.053031Meishan0.036642Fengdu0.0259
10Bishan0.080021Deyang0.051532Mianyang0.035343Ziyang0.0229
11Banan0.077722Yongchuan0.049333Nanchong0.034044Zhongxian0.0224
Table 6. WECC index of Chengdu–Chongqing Economic Circle.
NumberAdministrative DistrictWECCNumberAdministrative DistrictWECCNumberAdministrative DistrictWECCNumberAdministrative DistrictWECC
1Qian jiang0.6487 12Bishan0.4446 23Nanan0.3810 34Suining0.3245
2Ya’an0.6180 13Liangping0.4436 24Tongliang0.3696 35Zigong0.3193
3Yun yang0.5060 14Rongchang0.4282 25Dianjiang0.3645 36Jiangjin0.3155
4Changshou0.4944 15Luzhou0.4078 26Wanzhou0.3644 37Dazhou0.3074
5Yibin0.4871 16Dazu0.4070 27Banan0.3641 38Yuzhong0.3073
6Leshan0.4869 17Beibei0.4049 28Mianyang0.358239Shapingba0.3068
7Fengdu0.4835 18Tongnan0.4011 29Jiulongpo0.356140Deyang0.3042
8Fuling0.483319Qijiang0.3951 30Hechuan0.346641Neijiang0.2890
9Nanchuan0.476820Yongchuan0.3876 31Chengdu0.342242Guang’an0.2889
10Kaizhou0.476021Nanchong0.3830 32Jiangbei0.336643Ziyang0.2862
11Zhongxian0.451222Yubei0.3816 33Dadukou0.328944Meishan0.2838
Table 7. CCD of Chengdu–Chongqing Economic Circle.
NumberAdministrative DistrictCDDLevelNumberAdministrative DistrictCDDLevelNumberAdministrative DistrictCDDLevel
1Yuzhong0.7445Intermediately coordinate16Qijiang0.3940Mildly incoordinate31Jiangjin0.3438Mildly incoordinate
2Jiangbei0.5492Slightly coordinate17Dazu0.3877Mildly incoordinate32Dianjiang0.3434Mildly incoordinate
3Nanan0.5350Slightly coordinate18Tongliang0.3868Mildly incoordinate33Zigong0.3423Mildly incoordinate
4Dadukou0.5217Slightly coordinate19Qianjiang0.3846Mildly incoordinate34Nanchong0.3378Mildly incoordinate
5Jiulongpo0.5098Slightly coordinate20Hechuan0.3781Mildly incoordinate35Luzhou0.3362Mildly incoordinate
6Shapingba0.4947Nearly incoordinate21Ya’an0.3766Mildly incoordinate36Mianyang0.3354Mildly incoordinate
7Yubei0.4673Nearly incoordinate22Tongnan0.3750Mildly incoordinate37Kaizhou0.3347Mildly incoordinate
8Beibei0.4490Nearly incoordinate23Leshan0.3738Mildly incoordinate38Fengdu0.3344Mildly incoordinate
9Bishan0.4343Nearly incoordinate24Nanchuan0.3737Mildly incoordinate39Neijiang0.3232Mildly incoordinate
10Chengdu0.4327Nearly incoordinate25Wanzhou0.3727Mildly incoordinate40Dazhou0.3195Mildly incoordinate
11Fuling0.4275Nearly incoordinate26Yibin0.3687Mildly incoordinate41Meishan0.3192Mildly incoordinate
12Changshou0.4217Nearly incoordinate27Yunyang0.3611Mildly incoordinate42Zhongxian0.3171Mildly incoordinate
13Banan0.4101Nearly incoordinate28Deyang0.3537Mildly incoordinate43Guang’an0.3059Mildly incoordinate
14Yongchuan0.4086Nearly incoordinate29Suining0.3482Mildly incoordinate44Ziyang0.2846Intermediately incoordinate
15Rongchang0.4060Nearly incoordinate30Liangping0.3456Mildly incoordinate
Disclaimer/Publisher’s Note: The statements, opinions and data contained in all publications are solely those of the individual author(s) and contributor(s) and not of MDPI and/or the editor(s). MDPI and/or the editor(s) disclaim responsibility for any injury to people or property resulting from any ideas, methods, instructions or products referred to in the content.

