Article

Projection of the Co-Reduced Emissions of CO2 and Air Pollutants from Civil Aviation in China

Key Laboratory of Beijing on Regional Air Pollution Control, Faculty of Environment and Life, Beijing University of Technology, Beijing 100124, China
*
Author to whom correspondence should be addressed.
Sustainability 2023, 15(9), 7082; https://doi.org/10.3390/su15097082
Submission received: 7 March 2023 / Revised: 18 April 2023 / Accepted: 19 April 2023 / Published: 23 April 2023

Abstract

:
Civil aviation transport is a key area of fossil energy consumption and greenhouse gas emission, and it is also an important source of air pollutants; the emissions of these have caused severe environmental problems. In this paper, we estimated the emissions in 235 domestic civil airports, and predicted the future trends of CO2 and air pollutant emissions from civil aviation in China until 2050 under three scenarios. The co-reduced emissions of each measure were evaluated by using the co-control effects coordinate system. The results show that in 2018, the emissions of CO2, NOx, SO2, CO, PM and HC were 117.23 × 10⁶ tons, 90.47 × 10⁴ tons, 14.37 × 10⁴ tons, 9 × 10⁴ tons, 1.29 × 10⁴ tons and 0.66 × 10⁴ tons, respectively. CO2, NOx, SO2 and PM emissions were mainly concentrated in cruise mode, accounting for 87–93% of the total emissions; HC and CO emissions were more frequently from the LTO. Under the baseline scenario, the growth rate of air pollutant emissions will account for a greater share, from 84% in 2030 to 464% in 2050, whereas the general scenario reduces emissions by 15% and 71%, respectively, and a higher reduction of 26% and 93% is seen in the stringent scenario. Improving aviation fuels is the most significant co-reduction measure, which can reduce CO2 by 89% and 68% in 2030 and 2050, and reduce air pollutants by 86–89% and 62–65%, respectively.

1. Introduction

The Chinese government announced at the United Nations General Assembly 2020 that it will increase its autonomous national contribution, make stronger policies and measures, and strive for peak CO2 emissions by 2030 and work towards carbon neutrality by 2060. The rapid expansion of China’s civil aviation industry has led to a drastic increase in aviation fuel and CO2 emissions [1]. The aviation industry has become one of the top ten greenhouse gas emission industries in the world [2]. Global CO2 emissions from civil aviation amounted to 918 Mt in 2018, accounting for 2.4% of the total [3], and this proportion will continue to rise in the long term even though it decreased in 2020 due to COVID-19. If the civil aviation industry does not take any control measures, its carbon emissions will increase to three times the current level by 2050 [4]. In addition to CO2, aircraft engine combustion also emits air pollutants including NOx, CO, HC, SO2 and PM. The study by Yim et al. (2015) showed that 16,000 people died prematurely worldwide each year due to exposure to PM2.5 and O3 pollution from aviation emissions, and 5000 of them were living within 20 km of airports [5].
At present, many scholars at home and abroad have conducted research on the emission of CO2 and air pollutants in the transportation industry, including in highway [6,7,8,9], water [10,11] and railway [12,13] transportation. For the aviation sector, foreign scholars have carried out explorations very early; for example, Simone et al. (2013) developed a computationally-efficient tool to estimate the global civil aviation emissions in 2005 [14]. China’s aviation emissions have only begun to attract attention in recent years. A long-term aviation CO2 emissions inventory of each flight in China from 2017 to 2020 was established [15]. Based on eight scenarios, the CO2 emissions in China’s civil aviation sector may increase by a factor of 1.6 to 3.9 between 2020 and 2050 [16]. A scenario analysis was used to analyze CO2 emissions from China’s civil aviation industry through to 2030 [1]. Zeydan et al. (2022) determined the air pollution caused by emissions arising from domestic flights in Turkey [17]. In terms of the air pollutant emissions, an improved approach was proposed to estimate the aircraft pollutant emissions of NOx, CO, SO2, HC and PM from LTO cycles for 204 Chinese airports [18]. Tokuslu (2020) estimated air pollutants including nitrogen oxides, carbon monoxide and hydrocarbons from aircrafts during landing and take-off (LTO) cycles for the year 2018 at Tbilisi International Airport in Georgia [19]. In addition, studies have shown that sustainable aviation fuels can reduce carbon emissions by up to 80% over their lifetimes compared to conventional fossil fuels [20]. The PM emissions can be effectively reduced by 50–70% [21]. The GCAM and a top-down partial equilibrium model were used to explore the potential impact of biofuels for use in aviation; the results showed potential to reduce the carbon intensity of aviation [22,23]. Hydrogen is also being considered as a long-term solution [24]. Khalili et al. (2022) proposed an instantaneous voltage instability prediction method to protect the power system [25]. As a kind of clean energy, electrical energy has a good development prospect, such as for the expansion of electric vehicles in the transportation industry [26], but the application of electrical energy in the field of aviation still needs further exploration. Certainly, these studies aid in understanding the current situation concerning airport emissions. However, most of the research focuses on the establishment of emission inventories [15,27,28,29,30], the emission of CO2 and air pollutants [1,16,17,18,19], and the prediction of future emissions [1,16,31,32,33], but there are a lack of studies on the co-reduction of CO2 and air pollutants.
In this study, the emissions of greenhouse gases (CO2) and air pollutants (NOx, SO2, CO, PM and HC) of China’s aviation industry in 2018 were calculated based on the data collected and sorted out from 235 airports in China’s aviation industry in 2018, and the emission factors of different pollutants of different aircraft types. Based on three scenarios and three emission reduction measures, the CO2 and air pollutant emissions from the aviation sector were projected from 2019 to 2050, and their emission reduction potentials under different scenarios were analyzed. The co-reduction emission effect under different scenarios and different measures was carried out with quantitative evaluation by using the co-control effects coordinate system. The study is valuable and helpful in supporting the formulation of low-carbon strategies for China’s aviation sector.

2. Materials and Methods

The research content of this paper is mainly divided into three parts, including the establishment of a greenhouse gas and air pollutant emission inventory of China’s civil aviation aircrafts in 2018, the prediction of greenhouse gas and air pollutant emissions of China’s civil aviation aircrafts during 2019–2050, and the assessment of the co-reduction emission effect under different scenarios. Figure 1 depicts the flow chart of this study, which intuitively shows the research content of this paper.

2.1. Calculation Methods

Aviation engines mainly burn aviation kerosene and aviation gasoline fuels to emit pollutants. The share of aviation gasoline fuel was as low, being less than 1% [1]; so, this study only considered the fuel combustion of kerosene. The aircraft flight process is generally divided into the LTO and the cruise. In this study, a standard LTO cycle was used to estimate aircraft-by-aircraft emissions. The “International Standards and Recommended Practices” published by ICAO stipulates that all aircraft activities at the airport can be represented by the LTO cycle, including four modes of take-off, climb, approach and taxi. Based on years of statistical data from hundreds of airports around the world, ICAO provides a recommended value for the operation time of each mode of a LTO cycle, and defines the top height of the atmospheric boundary layer as 3000 ft (about 915 m) in the standard take-off and landing model [34]. The pollutant emissions for each model were calculated as follows:
E i , m = j n j F ¯ j , m E I ¯ i , j , m t j , m
where E i , m is the emission of pollutant i in the operation mode m ; i is the pollutant type (including CO2, HC, CO, NOX, SO2, PM); m is the engine operation mode, involving approach, taxi, takeoff and climb; j is the aircraft type, and n j is the number of engines (units) of type j aircraft; F ¯ j , m is the average fuel consumption rate (kg/s) of the aircraft j in the m mode. E I ¯ i , j , m is the average emission factor (g/kg) of pollutant i of type j aircraft in m mode; t j , m is the operation time (s) of type j aircraft in m mode, with reference to the standard operation times of 0.7, 2.2, 4 and 26 min for each mode of takeoff, climb, approach and taxi, respectively, as specified in the “Airport Air Quality Manual” published by ICAO [35].
In this study, the fuel consumption method was used to calculate the multi-pollutant emissions of the aircraft during the cruise.
E i = j ( F j F L T O , j ) × E I i
where E i is the emission of pollutant i during the cruise; F j is the total fuel consumption of aircraft type j ; F L T O , j is the amount of fuel consumed by aircraft type j in the LTO cycle, according to the statistics in “2019 Civil Aviation from Statistics” published by CAAC and based on fuel per unit LTO of aircraft type j in the ICAO Engine Emission Databank multiplied by the LTO numbers; and E I i is the emission factor of pollutant i during the cruise [36].

2.2. Data Sources

2.2.1. Activity Level Data

Flight schedules are commonly used to calculate the LTO emissions, and the activity level data for this study were mainly obtained from the CAAC and the official websites of each airport, including airline name, aircraft type, flight number, departure time and location, destination and time.
Generally, one type of aircraft may be equipped with multiple types of engines because they are produced by different engine manufacturers and supplied with many different types of engines. Therefore, different models were matched with engines based on the information collected from aircraft manufacturers and domestic and foreign literature in this study. Boeing and Airbus series, the main models of Chinese civil airliners, account for 95% of the total series, and among them are the Boeing aircraft, mainly the B738 series, Airbus aircraft, mainly A320 series. The main engine is CFM series, CFM by France Safran Group, and GE, a well-known manufacturer of aviation gas turbine engines, as shown in Figure 2.
The LTO cycles of the civil aviation aircraft are based on the number of landings and takeoffs, and an LTO cycle equals two landings and takeoffs. In this study, the LTO date of 235 airports in China’s aviation sector in 2018 were compiled to work out the LTO cycles for subsequent emission calculation. Figure 3a is the distribution of LTO cycles at airports nationwide. It can be seen that prosperous cities such as Beijing, Shanghai and Guangzhou have completed the majority of the cycles, accounting for 22% of the country, whilst provinces with about 10 airports, such as Sichuan, Yunnan and Shandong, cannot be ignored. However, Xinjiang and Inner Mongolia, which have the largest number of airports (21 and 20), do not have many LTO cycles, mainly because of their remote locations. Similarly, Figure 3b is the distribution of the passenger throughput in airports nationwide. It can be seen that the passenger throughput is the same as the distribution of LTO cycles. The passenger flow in Beijing, Shanghai, Guangzhou and other cities is relatively large, and because the LTO cycles are mainly concentrated in these areas, this indicates that there is a positive correlation between LTO cycles and passenger throughput.

2.2.2. Emission Factors

Based on the above-mentioned relationship between different civil aircraft models and engines, aircraft type, engine model and pollutant emission factor were matched according to the fuel consumption rate and pollutant emission factor of each operating mode in the ICAO-recommended engine emission databank. Then, a weighted average of the different engine components of the same model was calculated through literature research and data collection from engine manufacturers. The average fuel consumption rate and emission factors were weighted by the different engine components of the same aircraft as follows:
F ¯ j , m = 1 A a K a F a , m
E I ¯ i , j , m = 1 A a K a E I i , a , m
where F ¯ j , m is the average fuel consumption rate (kg/s) of type j aircraft in m mode; E I ¯ i , j , m is the average emission factor (g/kg) of pollutant i emitted by type j aircraft in m phase; A is the total number of type j aircraft (aircraft); K a is the number of type j aircraft fitted with type a engine (aircraft); F a , m is the fuel consumption rate (kg/s) of type a engine in m phase; E I i , a , m is the emission factor (g/kg) of pollutant i emitted by type a engine in m phase; and a is the engine model.
In this study, the engine EI of PM was calculated using an updated method, the first-order approximation 3.0 (FOA3.0) [37]. The emission factors for PM were calculated as follows.
E I P M = ( E I P M n v o l + E I P M v o l F S C + E I P M v o l F u e l O r g a n i c s ) × 10 3
where E I P M is the PM emission factor (g/kg); E I P M n v o l is the non-volatile particulate matter emission factor (mg/kg); E I P M v o l F S C is the volatile sulfate particulate matter emission factor (mg/kg); E I P M v o l F u e l O r g a n i c s is the volatile organic particulate matter emission factor (mg/kg).
The emissions of fuel consumption in the cruise phase depend on cruise performance parameters (including Mach number, fuel flow and thrust) under the known cruising distance, altitude, mode (speed), aircraft mass and external temperature deviation [38]. Considering these parameters, HC, CO, NOX and PM measured during a real flight were selected as emission factors in this study with reference to the study by Han et al. (2017) [39]. CO2 and SO2 emissions are determined only by the FSC rather than the engine performance [18,40]. The CO2 emission factor is 3150 g/kg based on the emission factor database of the EEA. According to the national standard [41], the FSC of aviation No.3 jet fuel is 0.2%. In reference to the study by Schumann et al. (2002) [42], the emission factor for SO2 was calculated as follows, assuming that 96.7% of sulfur is converted to SO2 after a complete combustion burn.
E I S O 2 = 2 F S C × η × 10 3
where F S C is the sulfur content of 0.2% in aviation kerosene; η is the fuel combustion efficiency of 96.7%, so E I S O 2 is 3.868 g/kg.

2.3. Scenario Defined

In this study, three scenarios were defined, taking into account the current emission control measures in the aviation sector and the “goals of carbon peaking and carbon neutrality” for the aviation sector, as well as the possible low-carbon strategies and technology upgrading directions in future years.

2.3.1. Baseline Scenario

The baseline scenario is a continuation of existing emission reduction initiatives, policy frameworks, and foreseeable technology paths without additional decarbonization efforts. Under current technology conditions, aviation is reducing its carbon footprint by increasing the fuel efficiency of aircraft engines and making planes more efficient at carrying passengers (more seats per aircraft). As such, it is assumed that energy consumption per unit will decline by 1% per year.

2.3.2. General Scenario

The general scenario is a “transition” of China’s civil aviation to achieve carbon neutrality. Specifically, fuel efficiency will be improved by 2% annually from 2020 to 2040 and by 3% from 2040 to 2050 according to the ICAO proposal. Next, this study set the percentage of each period from 2020 to 2050 based on the present aviation biofuel technology. That is, 5% of China’s civil aviation fleet is refueled with biofuel by 2020, which could reduce 60% of carbon emissions. Then, the proportion of biofuel is determined to increase by 5% every five years until 2035, and by 10% every five years during 2035–2050. It is found that biofuel can effectively reduce particle emissions by 50–70%, not only slowing down CO2 emissions, but also inhibiting the formation of tail gas condensation [21]. According to the results of this study, it is set that the PM emission reduction of biofuel can be 50% during 2020–2035 and 60% during 2040–2050. As for the pollutants HC, CO, NOx and SO2, this study assumes that the application of biofuel can reduce the emission of these four pollutants by 80%, as no research on this aspect has been found. As for the new technology of aircraft application, a hydrogen-fueled aircraft will not be commercially available until 2035 at the earliest, according to the research report “Hydrogen-powered aviation”. So, the proportion of hydrogen-fueled aircrafts in the national airline fleets was defined to start from that year.

2.3.3. Stringent Scenario

This is a more stringent version of the general scenario for China’s civil aviation that would employ the maximum available technology to achieve carbon neutrality. This means that major technological breakthroughs could be made in biofuels and hydrogen-powered aircrafts. Aviation fuel efficiency is set to improve by 3% in 2020–2040 and 5% in the next decade, according to the IEA World Energy Outlook report. Additionally, the aviation bio-kerosene would have a larger fleet share and would achieve 100% sustainable bio-kerosene by 2050. In this case, the PM emission could be reduced by 70%, and the emissions of HC, CO, NOX and SO2 could be reduced by 80% as in the general scenario.

2.4. Projection of CO2 and Air Pollutant Emissions from the Aviation Sector

2.4.1. Projection of Emissions during the LTO Phase

In this study, the LTO cycle was selected as the driving factor for the projection, referring to the method by Li. (2017) [43]. The equation was established by identifying the average annual growth rate of LTO cycles in historical years, as shown below.
A P = i L T O i × ( 1 + R i ) ^ ( n b )
where A P is the number of aircraft LTO in the future year of the airport in province P , R i is the average annual growth rate of airport i , and P , i , n , b represent different provinces, different airports, forecast year and base year, respectively.
The LTO cycles for the past five years from 2014 to 2018 have grown at an average annual rate of 9%. According to the report “Civil Aviation Market Forecast for the Next 20 Years” published by Boeing in 2020 [44], China’s RPK will grow at an average annual rate of 5.5% between 2020 and 2039, higher than the world average growth. It is expected to overtake the United States as the world air passenger market leader in the next 20 years. This value is also confirmed by the annual forecast report from 2020 to 2039 published by the ADR of China [45]. In addition, the ADR also gives specific changes in the growth rate of RPK during the different period, as shown in Table 1. China’s civil aviation is dominated by passenger traffic, accounting for about 80% of the total transport turnover, while freight turnover occupies 20%. Therefore, the increased trend of LTO was represented by the growth rate of total transport turnover, given the positive correlation between aircraft movements and total transport turnover.
Since GDP is the main factor behind the development of civil aviation, the change in GDP growth in China was incorporated in this study to further revise the forecasting factors. Due to the dramatic impact of COVID-19, this study looked at the Fourteenth Five-Year Plan released by China combined with the Economic Blue Book published by CASS [46,47]. GDP growth in 2019 and 2020 was set at 6.1% and 2.3%, respectively, and combined with the World Energy Outlook 2020 by IEA, the global economy was set to recover to the level of 2019 in 2021 [48]. So, the average annual growth rate of LTO during the different period was determined, as shown in Table 1.

2.4.2. Projection of Emissions during the Cruise Phase

For calculation, 30% of the HC and CO pollutants emitted by the aircraft in the cruise phase came from the LTO cycles and 70% from high altitude [49]. This study was revised with reference to some of the most recent research findings. For instance, Liu et al. (2019) [28] found that HC and CO pollutants accounted for 24% and 29% of the emissions during the cruise, respectively, and Yu et al. (2019) [50] revealed that HC and CO pollutants were emitted equally in both phases, i.e., 50% of the cruise phase. In contrast, this study concluded that only 40% of HC and CO were emitted during the cruise, and the results were used in the next calculations for prediction. In this study, the emission factors and model combinations of each pollutant are assumed to be constant for future years, and the data of 2018 shall prevail.

2.5. Co-Reduction of Emissions

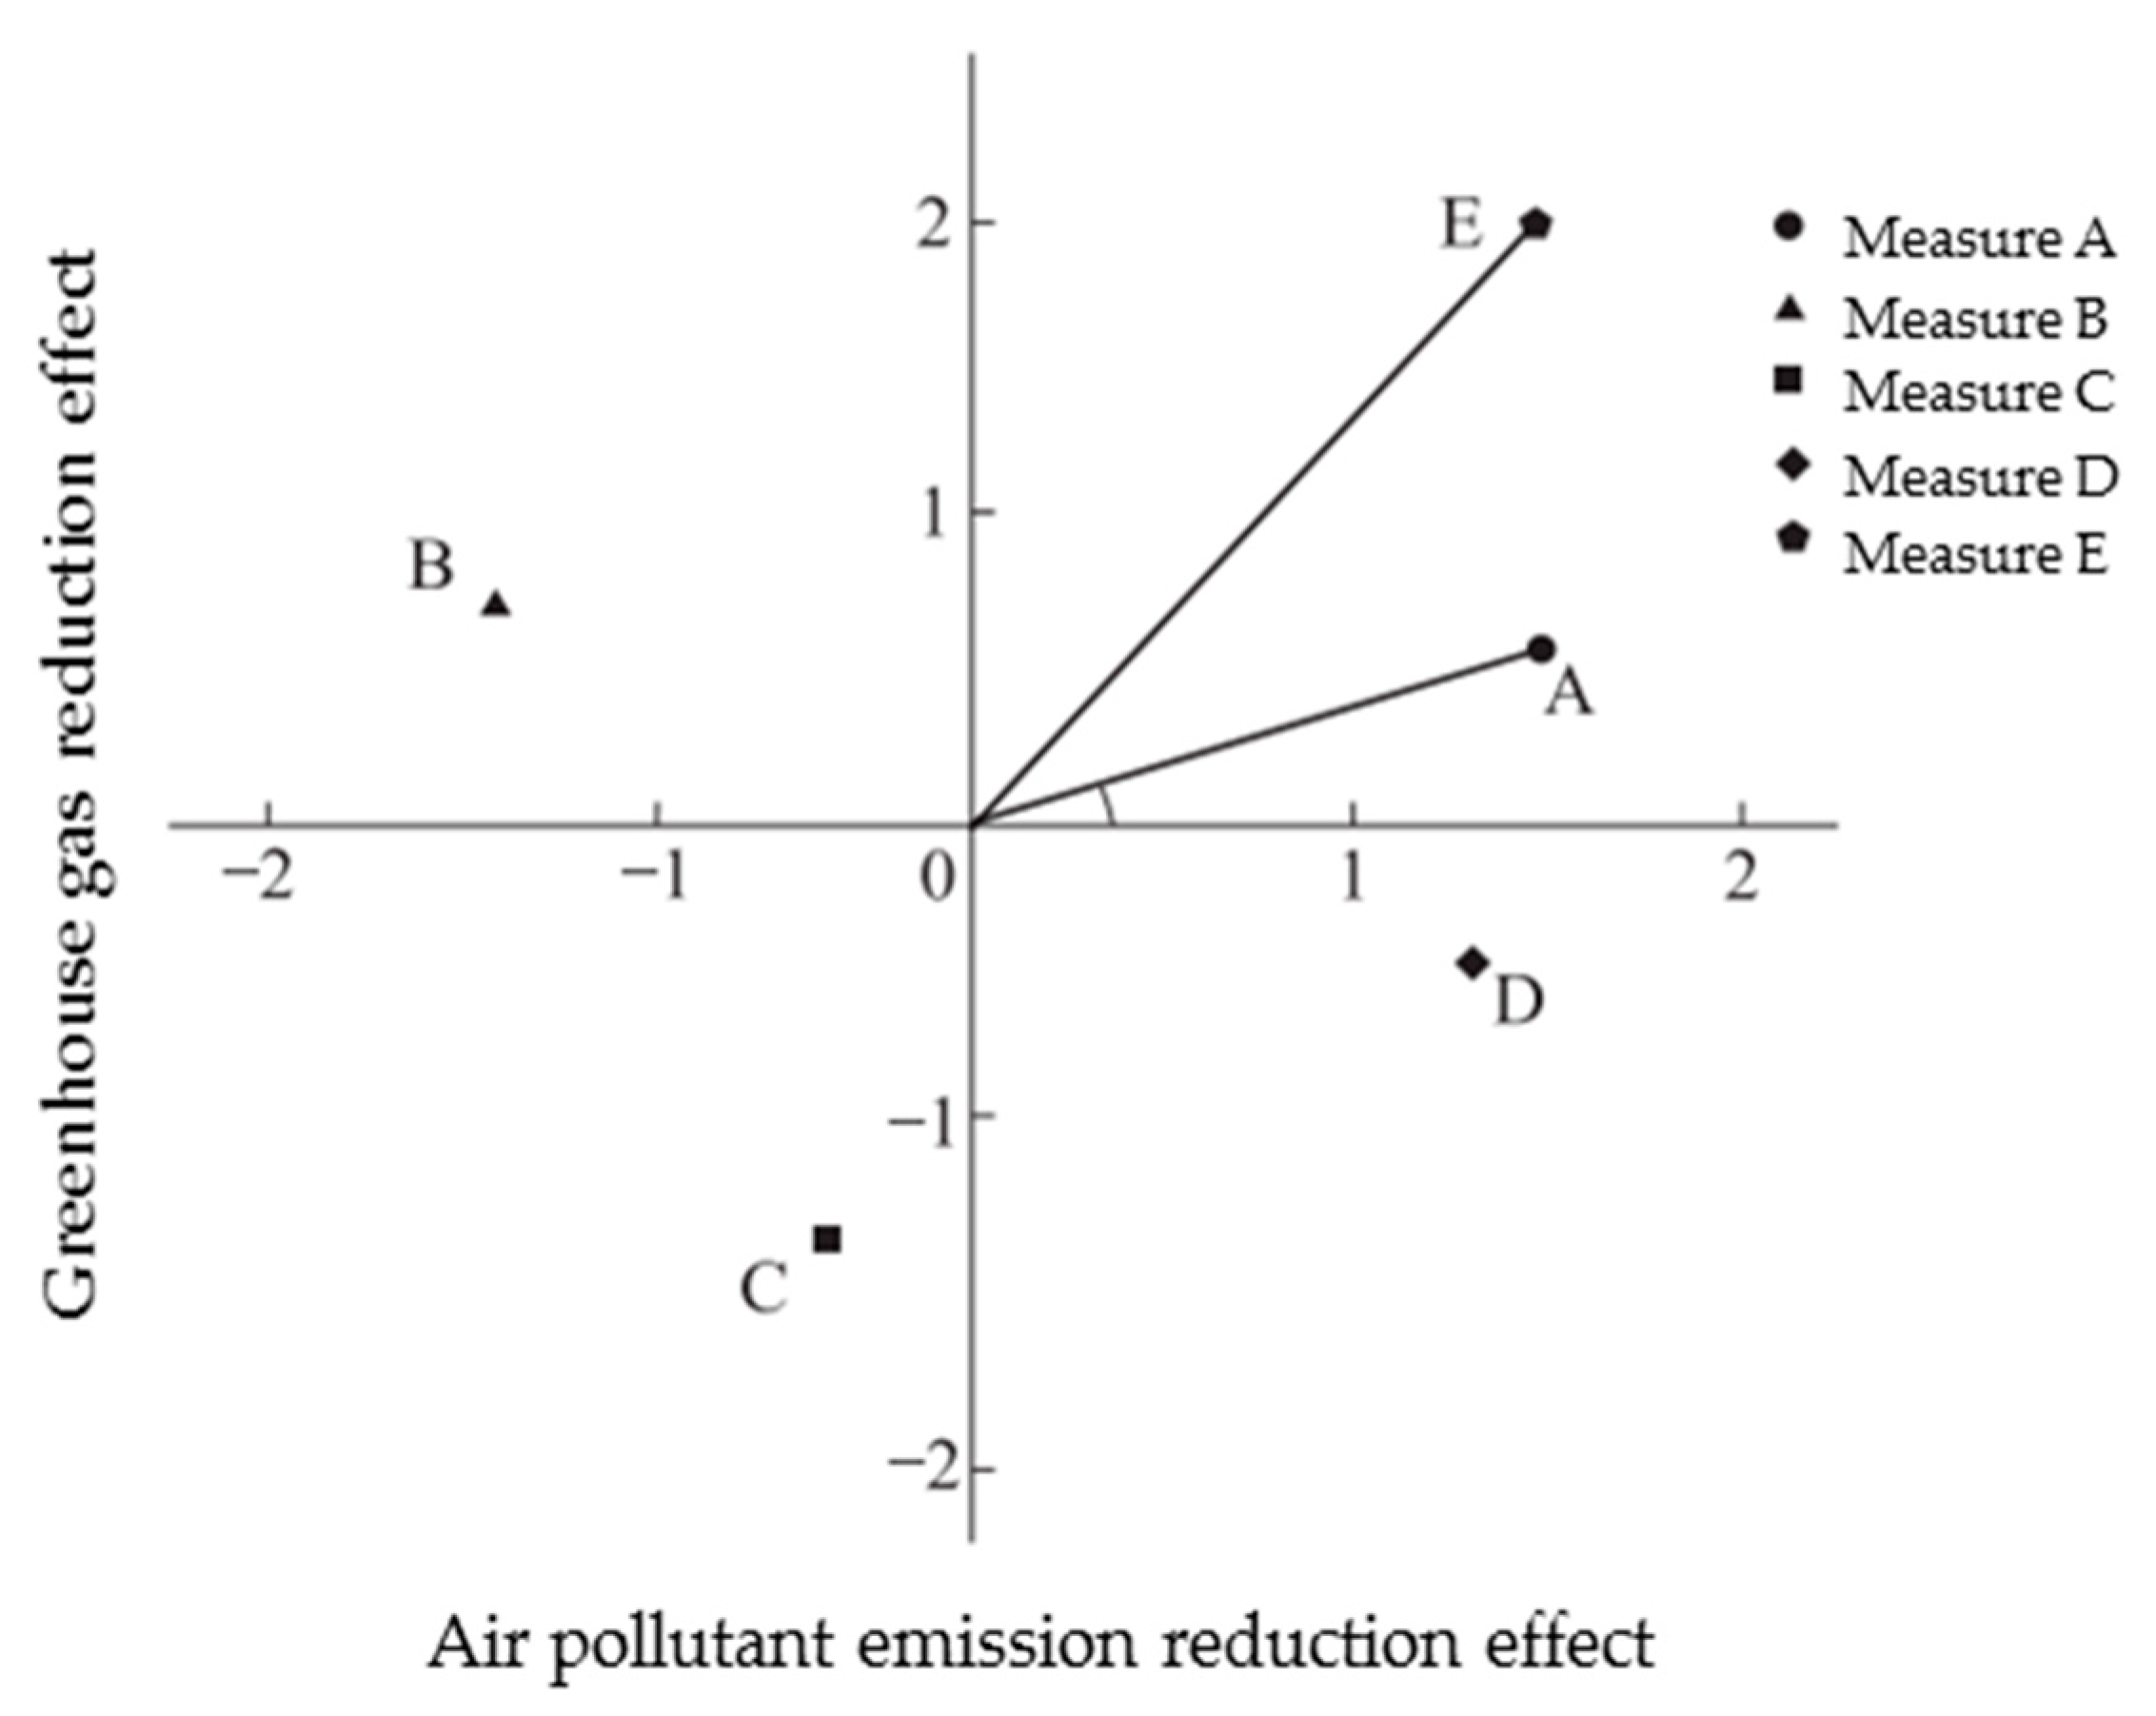
In this study, the method of the coordinated system used by Mao et al. (2021) and Guo et al. (2023) was used to evaluate the co-reduction effect of CO2 and air pollutants in China’s civil aviation [51,52]. As shown in Figure 4, in a two-dimensional or multi-dimensional Euclidean coordinate system, different coordinates are used to express the reduction effect of a certain emission reduction measure relative to different pollutants, which can be called a “co-control effects coordinate system”. The spatial position of a certain emission reduction measure in the coordinate system can directly reflect its emission reduction effect and co-reduced degree. As shown in Figure 4, in the two-dimensional coordinate system, the abscissa represents the emission reduction effect of this measure on air pollutants, and the ordinate represents the emission reduction effect on greenhouse gas. Point A in the first quadrant represents the co-reduction effect achieved by this measure. If the included angle α, formed by the line from point A to the origin of coordinates and the horizontal axis, is greater, the greenhouse gas emission reduction effect of the measure is better when reducing the same amount of air pollutants. That is, the co-reduction effect of measure E is better than that of measure A; in the second quadrant, point B represents the increase in air pollutant emission caused by this measure while reducing greenhouse gas emission. C in the third quadrant means that the measure has no co-reduction effect; Point D in the fourth quadrant represents the increase in greenhouse gas emissions caused by the reduction in air pollutants at the same time.
Normalized emission reduction is used to quantify the comprehensive result of each measure, and to analyze the cumulative effect of all measures by constructing a normalized equivalent index of pollutant and greenhouse gas emission reduction and by combining the emission reduction amount. The normalized calculation formula is as follows.
A P e q = α C O 2 + β H C + γ C O + δ N O x + ε P M + θ S O 2
where A P e q is the air pollutant equivalent index; CO2, HC, CO, NOX, PM and SO2 refer to the emission reduction of these pollutants by different measures; α , β , γ , δ , ε and θ refer to the corresponding equivalent coefficients (emission reduction coefficients) of each pollutant, respectively. The co-equivalent coefficients in this study are selected from the guideline based on the price weighting ratio of pollutant emissions trading in a typical city (Shenzhen). In this study, the equivalent coefficients of pollutant HC are chosen to be the same value as PM2.5.

3. Results and Discussions

3.1. Present Emissions from the Aviation Sector

Greenhouse gas and pollutant emissions from China’s civil aviation sector in 2018 were estimated by applying the methodology in Section 2. The results showed that CO2 emissions from the civil aviation sector accounted for 12% of the total carbon emissions from the transportation sector (980 Mt) [53]. In the transportation sector, aircraft emissions are much lower than for motor vehicles [54], which is why hybrid vehicles exist [55]. However, aircraft emissions should not be ignored. The emissions of CO2 and air pollutants from the civil aviation sector in China in 2018 are shown in Table 2.
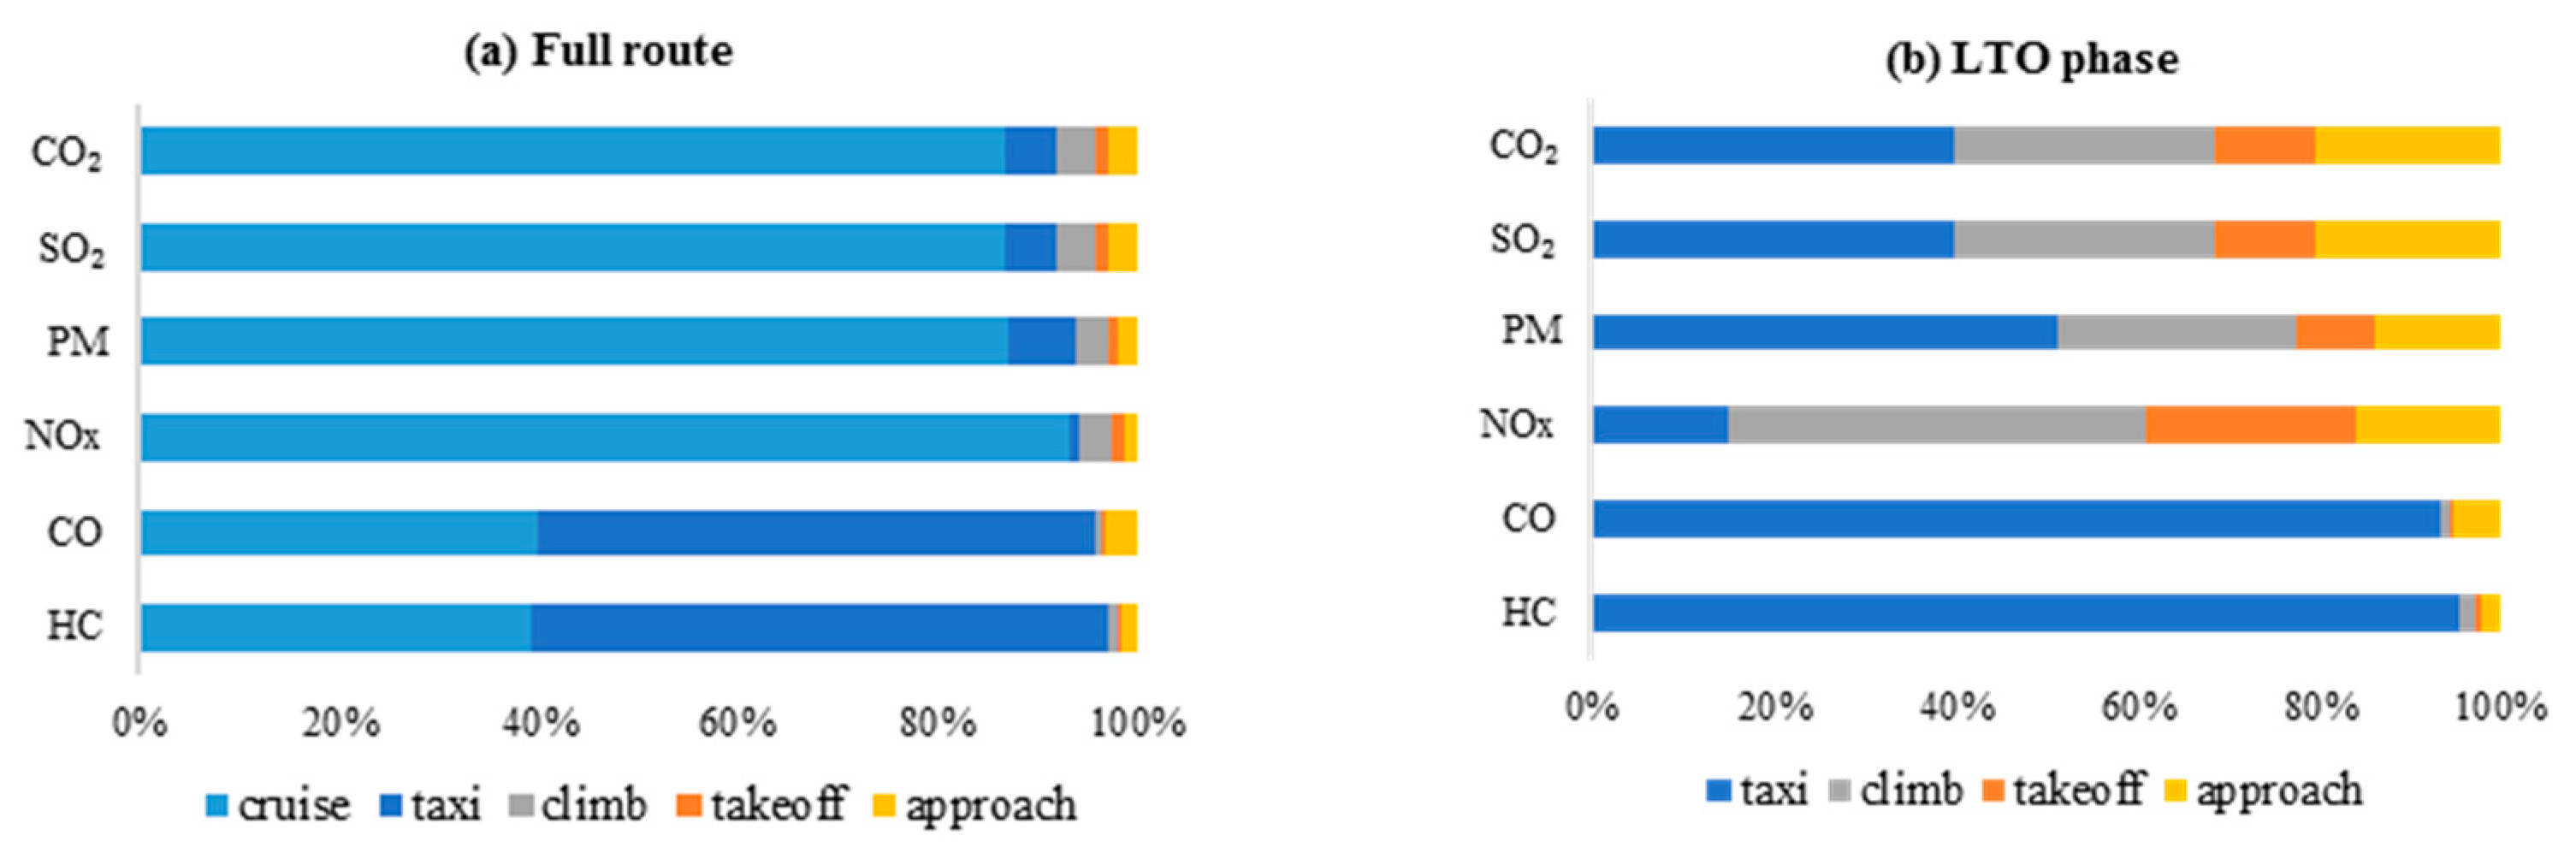
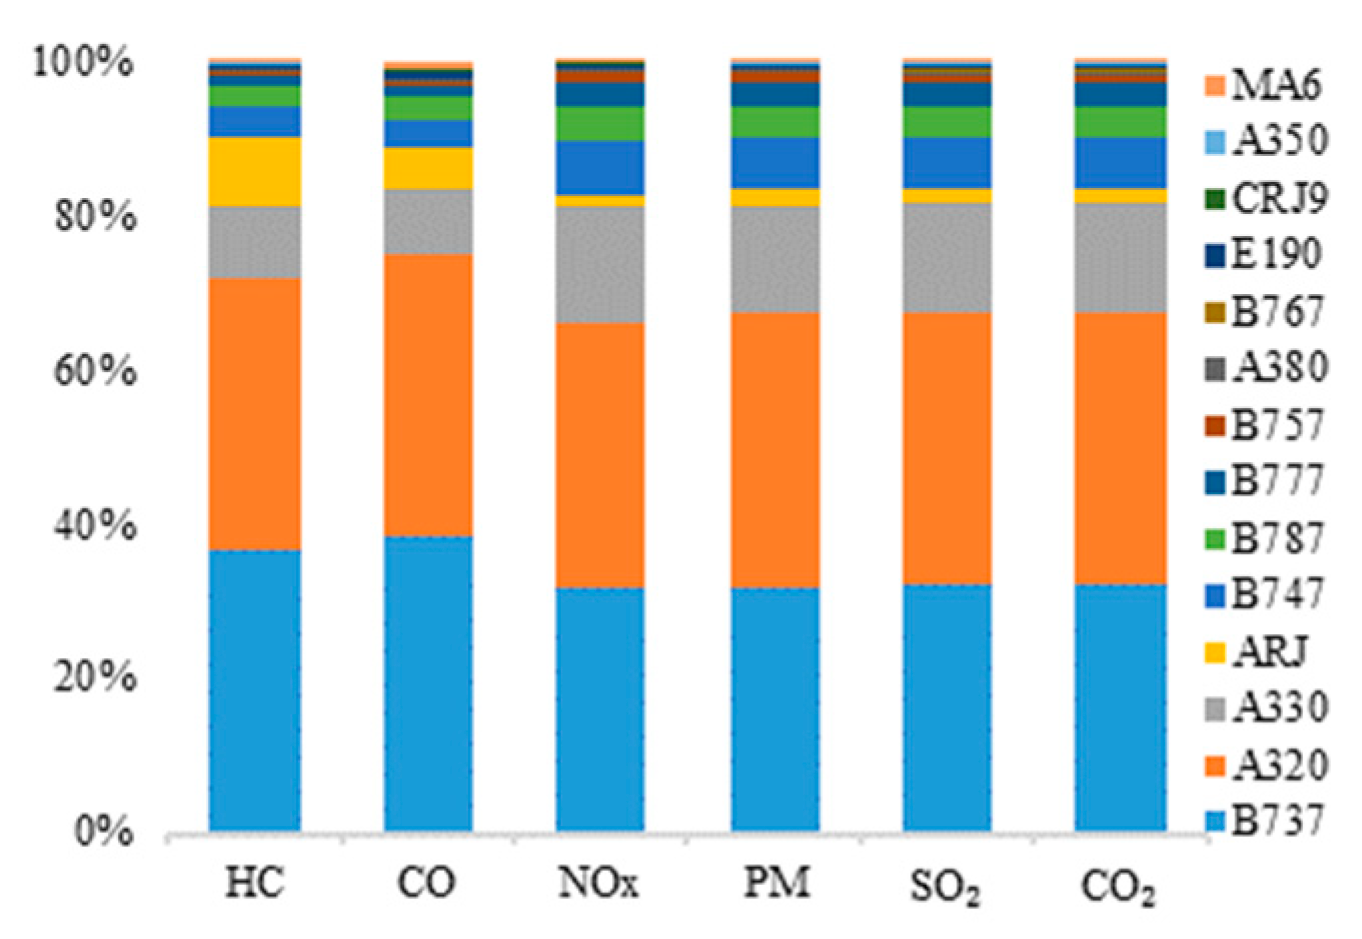
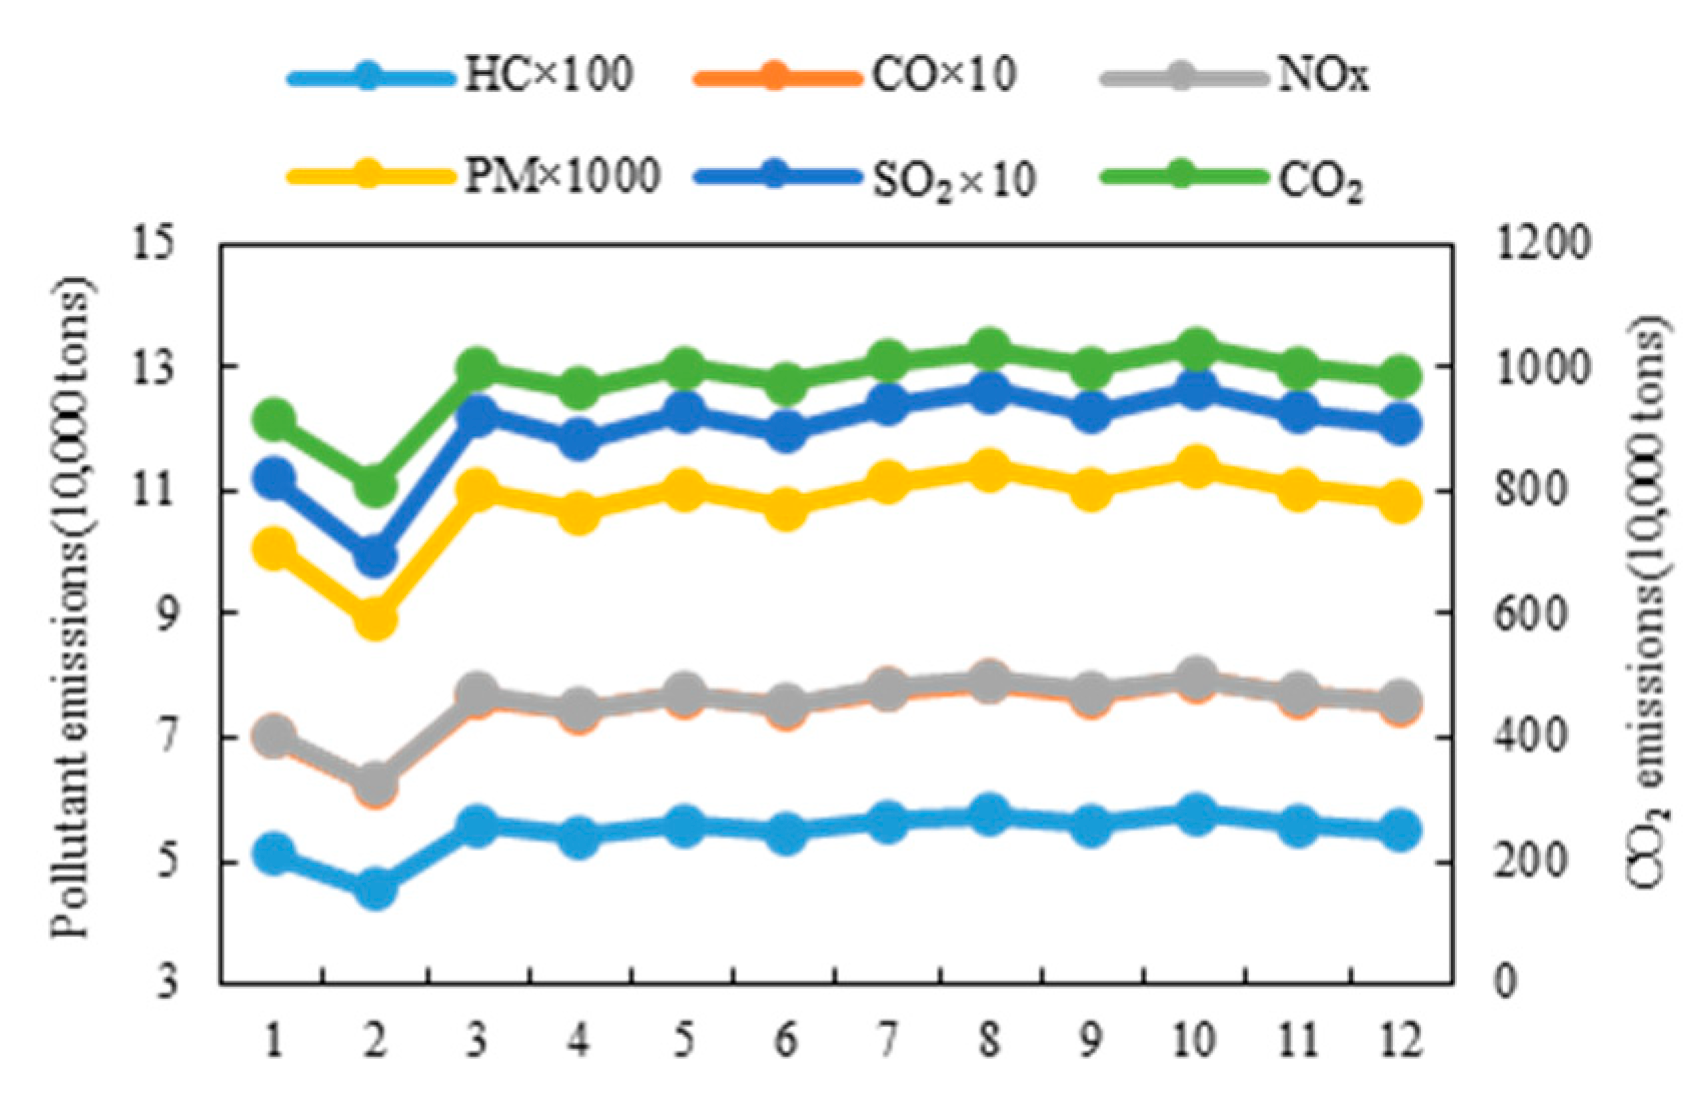
Figure 5 is a graph of pollutant emission proportion under different modes from civil aviation in China in 2018. Figure 5a shows the proportion of pollutant emissions in the five modes of cruise, taxi, climb, takeoff and approach during full route, and Figure 5b illustrates the proportion of pollutant emissions in the four modes during the LTO. It can be seen that the pollutant emissions vary greatly in different modes. Among them, the emissions of CO2 and air pollutants NOX, SO2 and PM are mainly concentrated during the cruise, accounting for 87–93% of the total emissions, while HC and CO emissions mainly come from the taxi mode. In addition to the disparate distribution of pollutant emissions in different modes, there are significant differences in the proportion of contribution to each pollutant by different aircraft types. Figure 6 shows the proportion of emissions from different aircraft types in China’s civil aviation in 2018. As can be seen from the figure, the B737 series and the A320 series have the highest emissions, contributing 32–38% and 35–37% of CO2, HC, CO, NOX, PM and SO2, respectively. This is mainly because these two aircraft series have the highest number of takeoffs and landings, accounting for 42% and 44% of the total. The next largest emitter of pollutants is the A330 series, contributing 9–15% of the total. Figure 7 shows different pollutants emitted by civil aviation in China in 2018 in four seasons. The analysis showed that the pollutant emissions in the four seasons were in the order of autumn > summer > spring > winter, accounting for 26%, 25%, 25% and 23% of the total annual emissions, respectively. Among them, the spring and autumn season displacement difference is very small, only 0.6%. The emissions in winter decreased by 11% compared with those in autumn. This is partly due to the low population flow during the Spring Festival in January and February, and partly due to the relatively low atmospheric boundary layer in these two months; that is, the low effective emission height led to relatively less pollutant emission. January and February had the lowest emissions, accounting for 7.8% and 6.9% of the total, respectively. The months with the highest emissions were August and October, accounting for 8.81% and 8.79% of the total, respectively, during the summer vacation travel season and with the highest number of LTO cycles. Emissions were lower in September than in August and October, which could be attributed to the typhoon weather that forced several airports to cancel flights. The changes in CO2 and NOx emissions were greatly affected by the seasons, and the difference between autumn and winter was 3260 kt and 30 kt, respectively. The main reason is that the emissions of pollutants CO2 and NOx are mainly concentrated in the climbing and cruising phases, while the sunshine duration in summer and autumn is longer, resulting in the elevation of the atmospheric boundary layer, and thus resulting in the rise of the effective emission height of pollutants, which is accompanied by the increase in emissions.
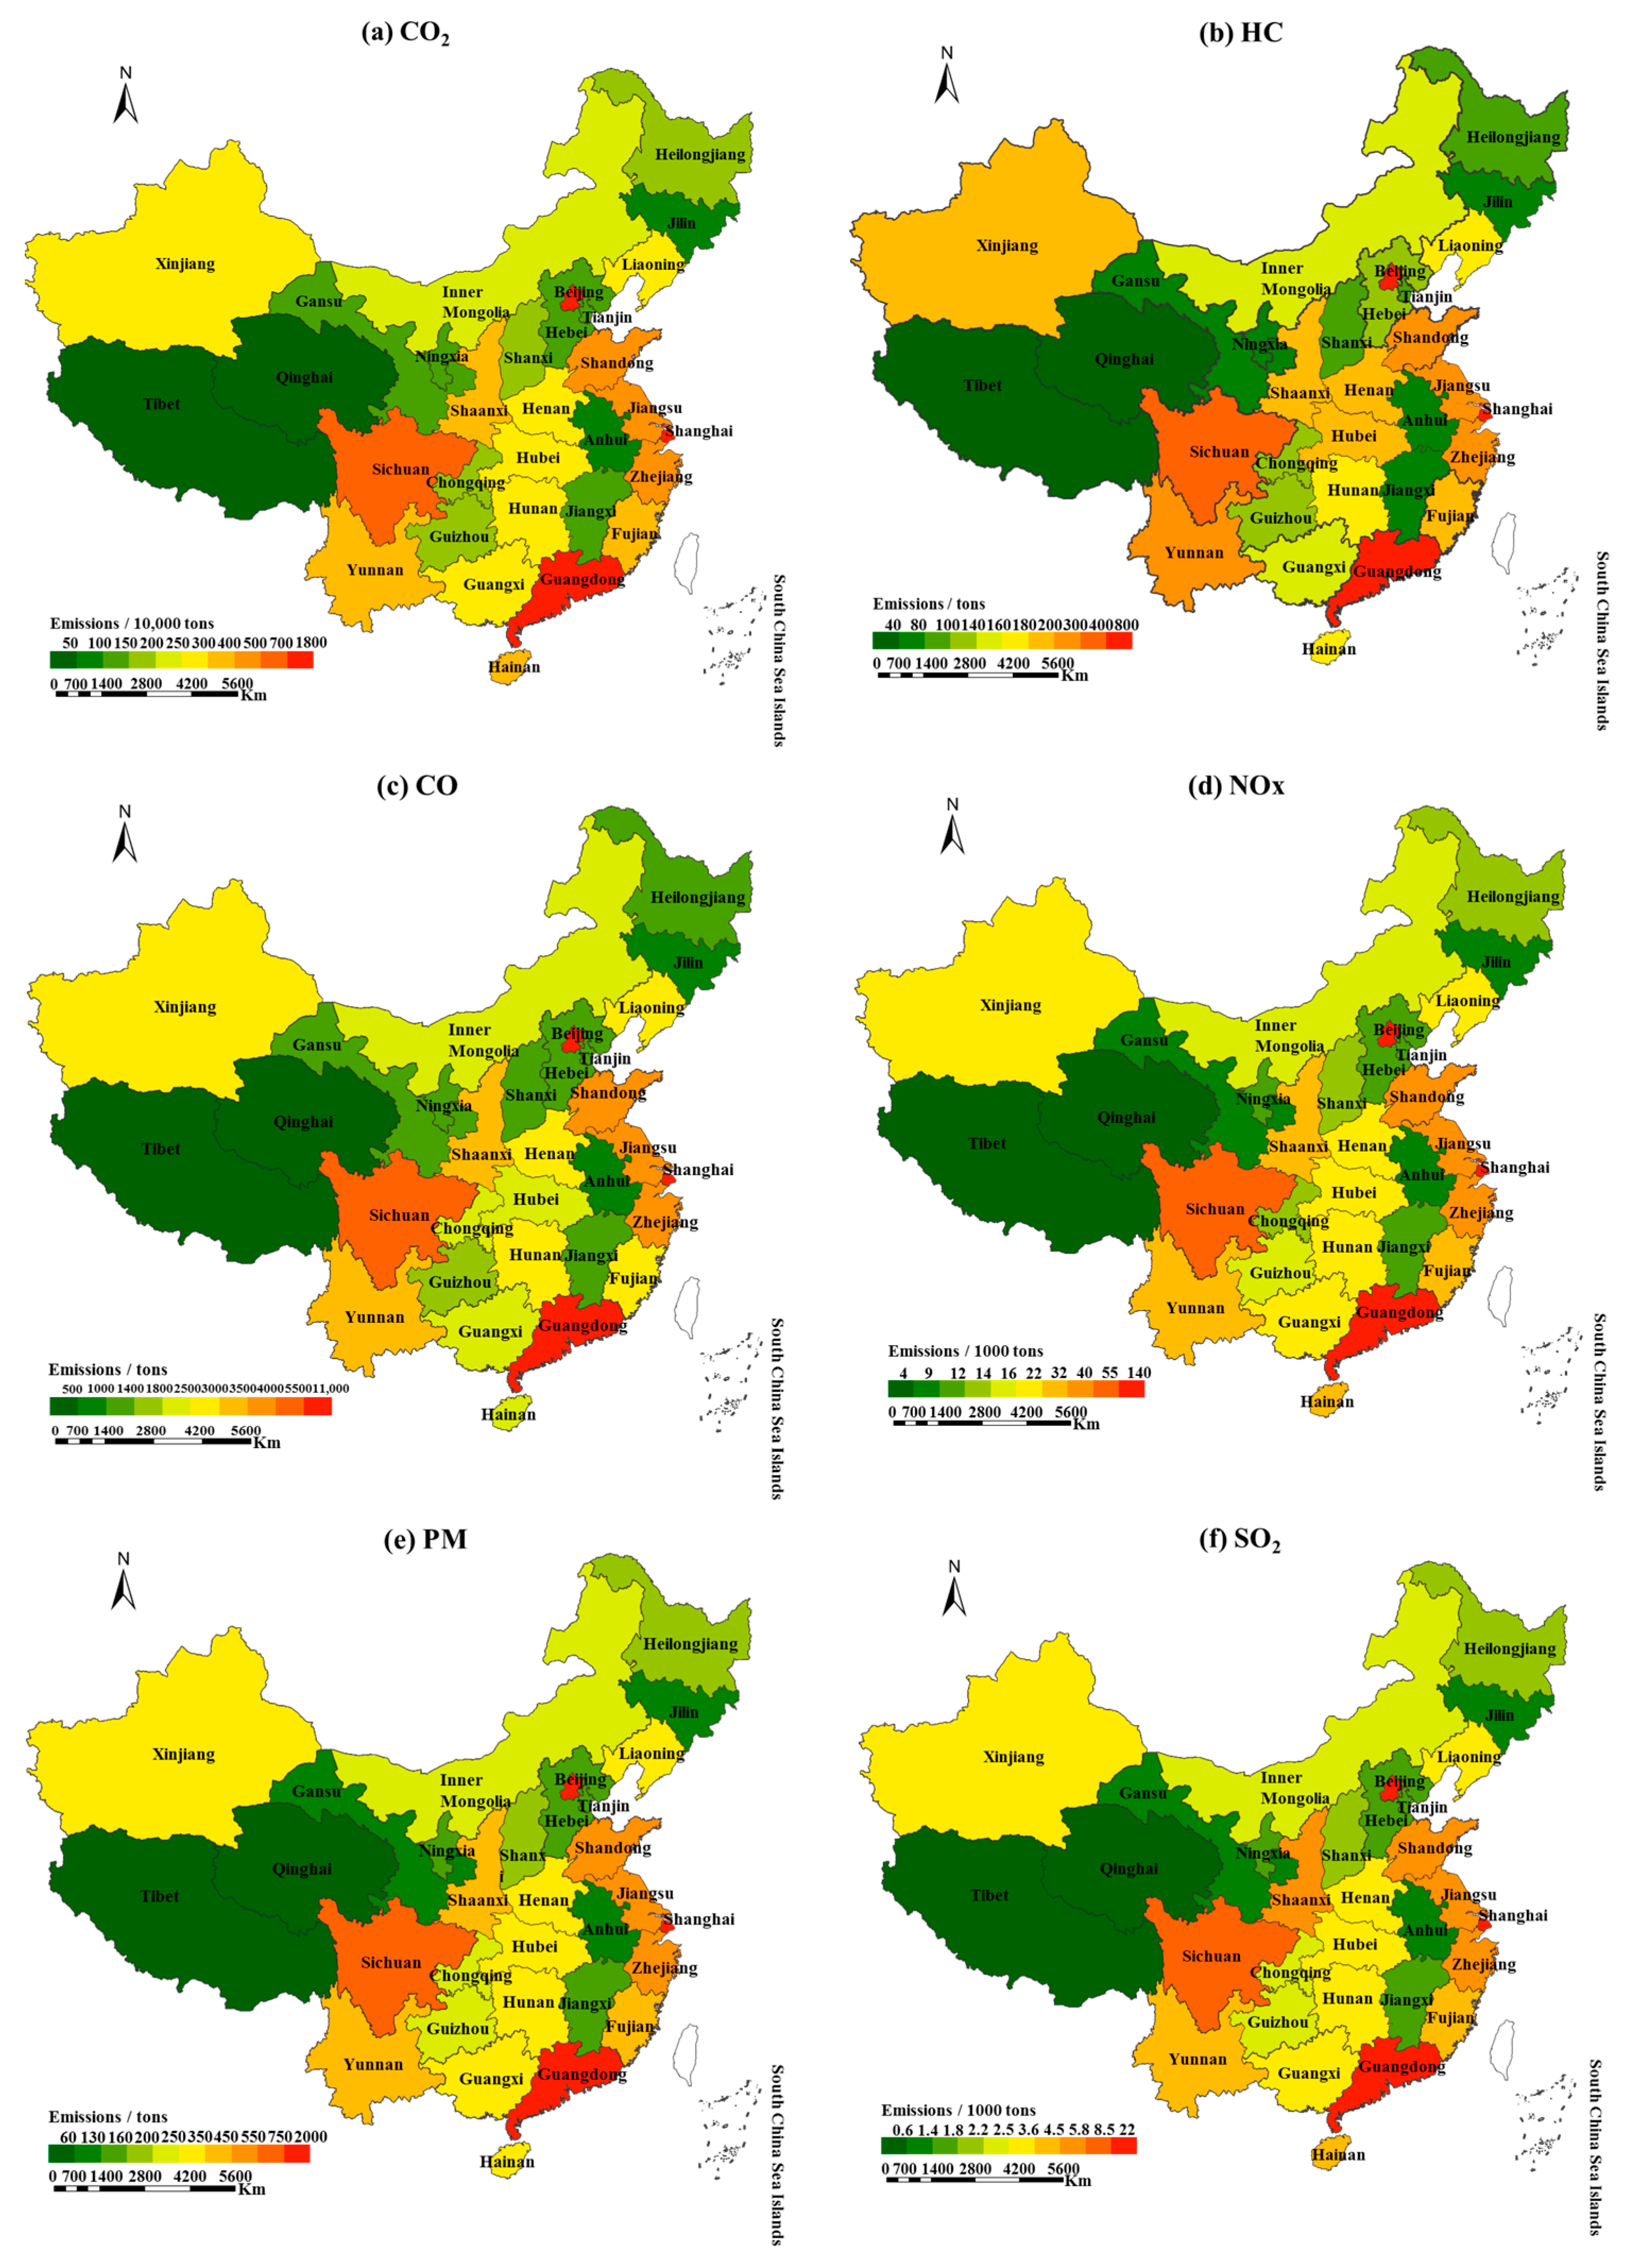
Figure 8 shows the spatial distribution of different pollutants’ emissions by provinces from civil aviation in China in 2018. It can be seen that both CO2 and air pollutant emissions were unevenly distributed in space. The high values of their emissions are mainly scattered in four regions, namely Shandong, Jiangsu, Zhejiang and Shanghai in East China, Guangdong in South Central China, Beijing in North China and Sichuan in Southwest China. In general, emissions were higher in the east, second highest in the center, and lowest in the west. Guangdong Province has the largest emissions, followed by Beijing, and not far behind Beijing is Shanghai. On the one hand, the airports in these three provinces have huge passenger traffic and intensive departure frequency, as can be seen from Figure 2; both in terms of LTO cycles and passenger throughput distribution, these three cities are in first place and have significantly higher amounts than other cities. On the other hand, because these three provinces are the major developed cities in China with more international routes and longer transport distances, a large number of large- and medium-sized wide-body airliners have been introduced there.
By collecting existing research results, this study conducted a comparative verification of emissions in different flight stages, with specific results shown in Figure 9. The results show that this study gave a biased, higher total flight-wide pollutant emissions result than those studies. The CO2 emissions were 95%, 23% and 206% higher than the results of [28,50,56], respectively. Similarly, for the air pollutants CO, PM and SO2, the results of this study were higher than those of [28,50,56,57], which were 3–126%, 16–290% and 127–1381%, respectively. For the LTO phase, the CO2 emissions were 20% higher than the results of [58], for the air pollutants CO, PM, SO2 and NOx, the results of this study were higher than those of [18,58], which were 41–77%, 100–300%, 58–533%, 0.85–57%, respectively. The reasons for the differences may be attributed to the following: (1) Interannual variation in activity levels, as the emission inventories in these studies were established 0–8 years prior to this study, which can explain the annual increase in pollutant emissions. The rapid growth of different pollutants in this study may be due to the rapid development of China’s aviation sector. In terms of LTO cycles and passenger throughput, the annual average of 2018 was more than 50% higher than that of 2010. (2) The selection of pollutant emission factors, as compared with other air pollutants, PM and SO2 had the largest emission difference in this study, which was mainly due to the different selection of emission factors. In this study, the emission factors for PM and SO2 were derived using cutting-edge methods and localized values, respectively, and were higher than those selected by previous researchers. For example, in most studies, the SO2 emission factor was mainly selected as the internationally commonly used 1 g/kg, while in this study, it was 3.868 g/kg, determined according to the Chinese aviation kerosene standard. For the pollutant HC, the total emissions were 43% and 37% higher than the research results of [28,56], while they were 35% and 41% lower than the research results of [50,57]. This is mainly due to the lower selection of emission factors in the cruise phase in this study. In addition, the CO2 and pollutant emissions in this study were much higher than in foreign airports [17,59,60,61]. This is because these countries have conducted relevant research on this as early as the 1950s, gradually forming a relatively complete evaluation and pollution prevention and control system for aircraft atmospheric environmental impact. In addition, as the world’s most populous country, China’s domestic airport takeoff and landing flights and passenger throughput are far higher than in foreign airports. The analysis of the above reasons is also applicable to the analysis of emission differences during the LTO phase. Overall, the results of this study are acceptable.

3.2. CO2 and Pollutant Emission Projections

3.2.1. LTO Cycles

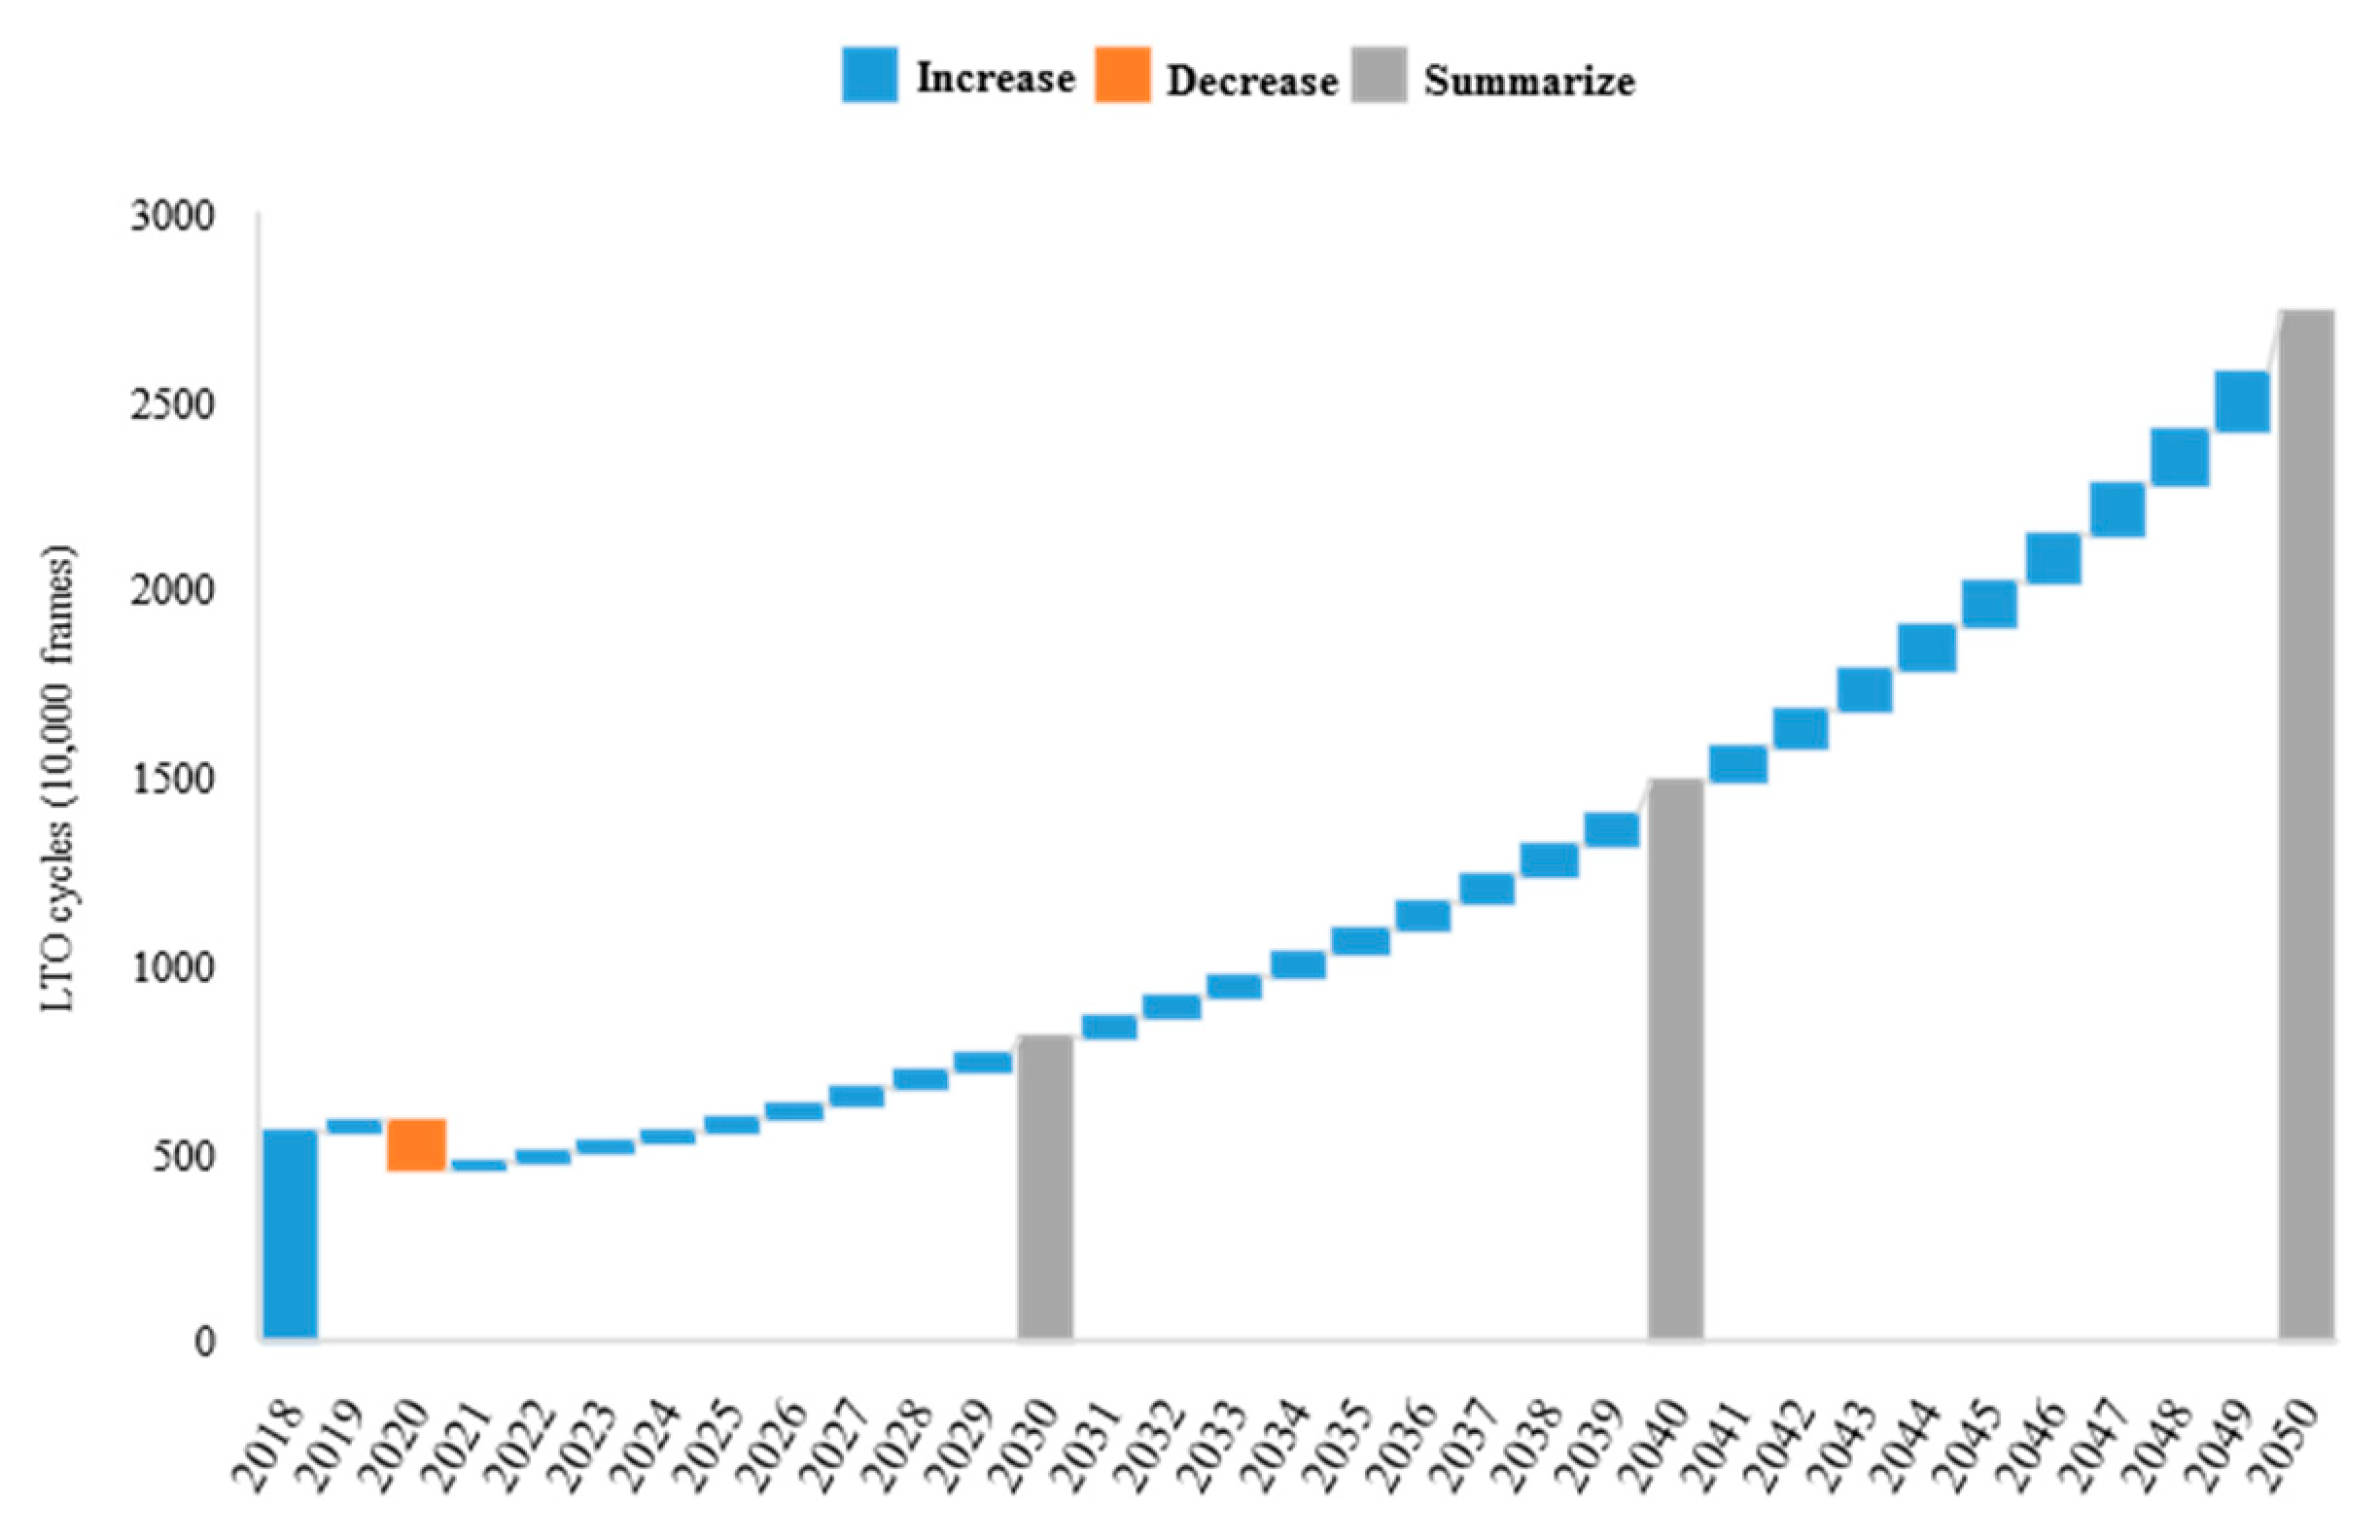
Based on Equation (7), the projection of LTO cycles from civil aviation in China from 2019 to 2050 is shown in Figure 10. Overall, the LTO cycles in the coming years show a rapid upward trend, reaching 7.82 million, 13.63 million and 23.95 million in 2030, 2040 and 2050, respectively, an increase of 41%, 146% and 332% compared with the base year. This indicates that although China’s civil aviation has been somewhat curtailed by the pandemic, its overall rapid growth trend is almost unaffected by it.

3.2.2. Emissions Projections

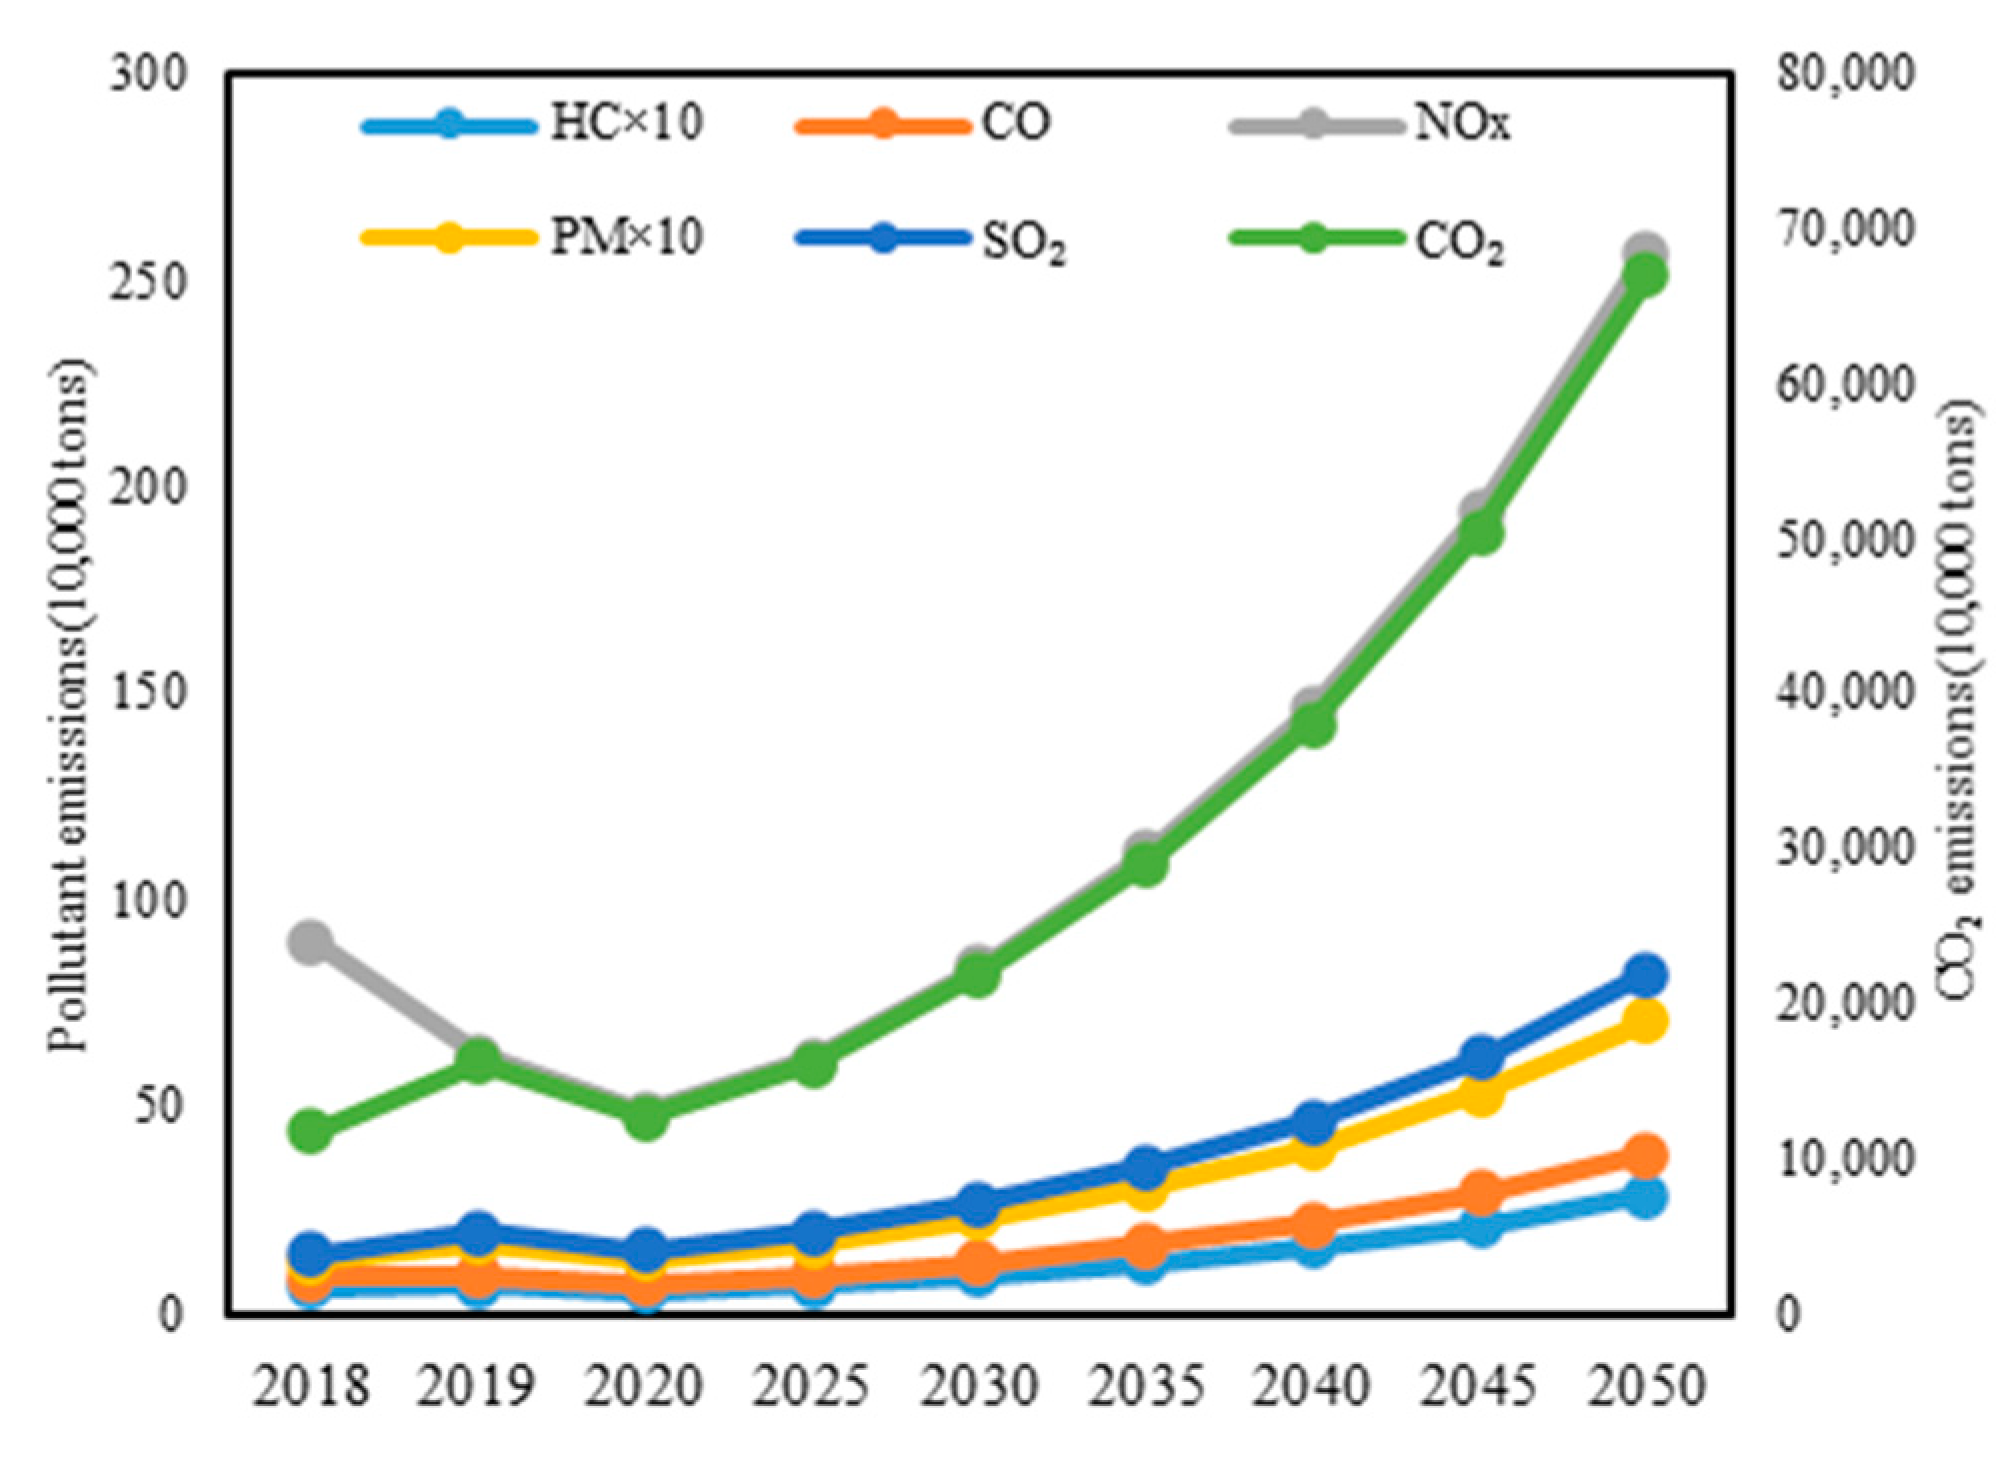
Figure 11 shows the projections of pollutant and CO2 emissions for China’s civil aviation from 2019 to 2050. The emission of pollutants in the coming years shows a rapid rising trend. By 2050, the emissions of CO2 and air pollutants HC, CO, NOX, PM and SO2 are estimated to reach 670.59 Mt, 28.6 kt, 388 kt, 2568.9 kt, 70.8 kt and 822.1 kt, respectively. CO2 emissions show a sharp upward trend, with 163.012 Mt in 2019, an increase of 40% compared to the base year. Additionally, 2020, the year most severely affected by the pandemic, saw its CO2 emissions fall to 127.15 Mt, an increase of only 8% compared to the base year, and in 2030, 2040, and 2050 to 219.213 Mt, 381.596 Mt, and 670.595 Mt, respectively, an increase of nearly 87–472% compared to the base year.
The emissions of HC, CO, PM and SO2 all present an overall upward trend, while NOx has a slight decrease in the first period, but still an overall upward trend. The emissions of HC, CO, NOX, PM and SO2 in 2019 were 6.9 kt, 94 kt, 624 kt, 17 kt and 200 kt, respectively. The emissions of HC, CO and NOX have decreased to some extent in 2020, being 5.4 kt, 74 kt and 487 kt, respectively, a decrease of 17–46% compared to the base year. Meanwhile, PM and SO2 emissions rose to 13.4 kt and 156 kt by 4% and 8%, respectively. In future, the emissions of each pollutant will increase year by year, reaching 28 kt, 388 kt, 2569 kt, 71 kt and 822 kt, respectively, in 2050, an increase of 184–472% compared to the base year.

3.3. Analysis of Multi-Pollutant Reduction Potential under Different Scenarios

3.3.1. Emissions Projections

Table 3 shows the specific emissions of CO2 and air pollutants in China’s aviation sector in 2050. It can be seen that there are obvious differences in the emission of various pollutants. Figure 12 illustrates the emission projections of CO2 and air pollutants (HC, CO, NOX, SO2 and PM) from the civil aviation sector in China under different scenarios from 2018 to 2050. It can be seen that there are differences in the emission trends of each pollutant under different scenarios.
(1)
Baseline scenario
Under the baseline scenario, CO2 emissions grow from 117.23 Mt in the baseline year 2018 to 217.02 Mt in 2030 and 663.89 Mt in 2050 as China’s civil aviation grows at an average annual rate of 5.8%, an increase of 1.9 times and 4.7 times, respectively, at an average annual growth rate of 5.6%. This indicates that although the civil aviation sector does not account for much of China’s total energy consumption, it has the highest growth trend and therefore should be controlled. HC, CO, NOX, PM and SO2 emissions increase year by year, reaching 28.4 kt, 384.1 kt, 2543.2 kt, 70.1 kt and 813.9 kt, respectively, in 2050, an increase of 330%, 327%, 181%, 466%, and 443%, respectively, compared to 2018. It can be seen that the emission trends are approximately the same in the different scenarios, as the specific measures implemented in the different scenarios are proportionally distributed.
(2)
General scenario
Under the general scenario, CO2 emissions do not peak in 2030, but continue to grow at an average annual rate of 7% and peak around 2035 at 230.18 Mt, a 20% decrease from the baseline scenario. After this, they will begin to decline at an average annual rate of 1% in 2040–2050, decreasing to 225.14 Mt in 2040 and 194.47 Mt in 2050, a 40% and 71% decrease from the baseline scenario, respectively. Emissions of SO2 peak roughly in 2035 at 275.1 kt. Additionally, the air pollutants of HC, CO and NOX will peak around 2040 at 10.3 kt, 139.1 kt and 920.9 kt, respectively. In addition, aircrafts using biofuels reduce emissions less, so there is no peak PM as aircrafts using biofuels reduce emissions less compared to other air pollutants. Emissions of HC, CO, NOX, PM and SO2 are expected to be reduced to 8.3 kt, 112.5 kt, 745 kt, 29 kt and 238.4 kt, respectively, by 2050, at rates of 60–72% compared to the corresponding years under the baseline scenario.
(3)
Stringent scenario
Under the stringent scenario, CO2 emissions are expected to peak around 2030 at 160.03 Mt, and then begin to decrease at an average annual rate of 6%, to 133.56 Mt and 46.94 Mt by 2040 and 2050, respectively, a decrease of 65% and 93% from the baseline scenario. HC, CO, NOX, PM and SO2 emissions can all roughly peak around 2035 at 6.8 kt, 92.7 kt, 613.8 kt, 19.4 kt and 196.5 kt, respectively. Emissions of HC, CO, NOX, PM and SO2 are expected to be reduced at 80–94% to 4 kt, 54.3 kt, 359.6 kt, 14.9 kt and 115.1 kt by 2050 compared to the corresponding years under the baseline scenario.
The comparison of the three scenarios shows that in both policy scenarios, China’s civil aviation sector emitted pollutants much more slowly than in the baseline scenario. This suggests that both protocols can be effective in reducing emissions from civil aviation, but the stringent policy will help China to achieve its peak carbon neutrality target sooner.

3.3.2. Emission Reduction Potential

In this section, the pollutant reduction effects under three emission control measures are analyzed by calculating the reduction routes for each pollutant under different scenarios.
(1)
CO2 reduction Potential
Figure 13 shows the potential of China’s aviation sector to slow down the CO2 peak target under the scaled-up application of various measures. It can be seen that under the general scenario, CO2 will peak around 2035. To be specific, fuel efficiency improvement, aviation fuel improvement and new aircraft application can reduce CO2 emissions by 5.82 Mt, 40.79 Mt and 14.57 Mt, respectively, or 3%, 14% and 5% compared to the baseline scenario. Under the stringent scenario, CO2 emissions would peak around 2030. Fuel efficiency and aviation fuel improvements could reduce CO2 emissions by 6.57 Mt and 52.61 Mt, respectively, or 3% and 24% compared to the baseline scenario. Since a hydrogen powered aircraft will only go commercial in 2035 at the earliest, emissions from China’s aviation sector are likely to peak around 2030 if disruptive technological breakthroughs in sustainable aviation fuels can be achieved, relying solely on the large-scale application of sustainable aviation fuels and significant fuel efficiency improvement measures.
(2)
Air pollutants reduction potential
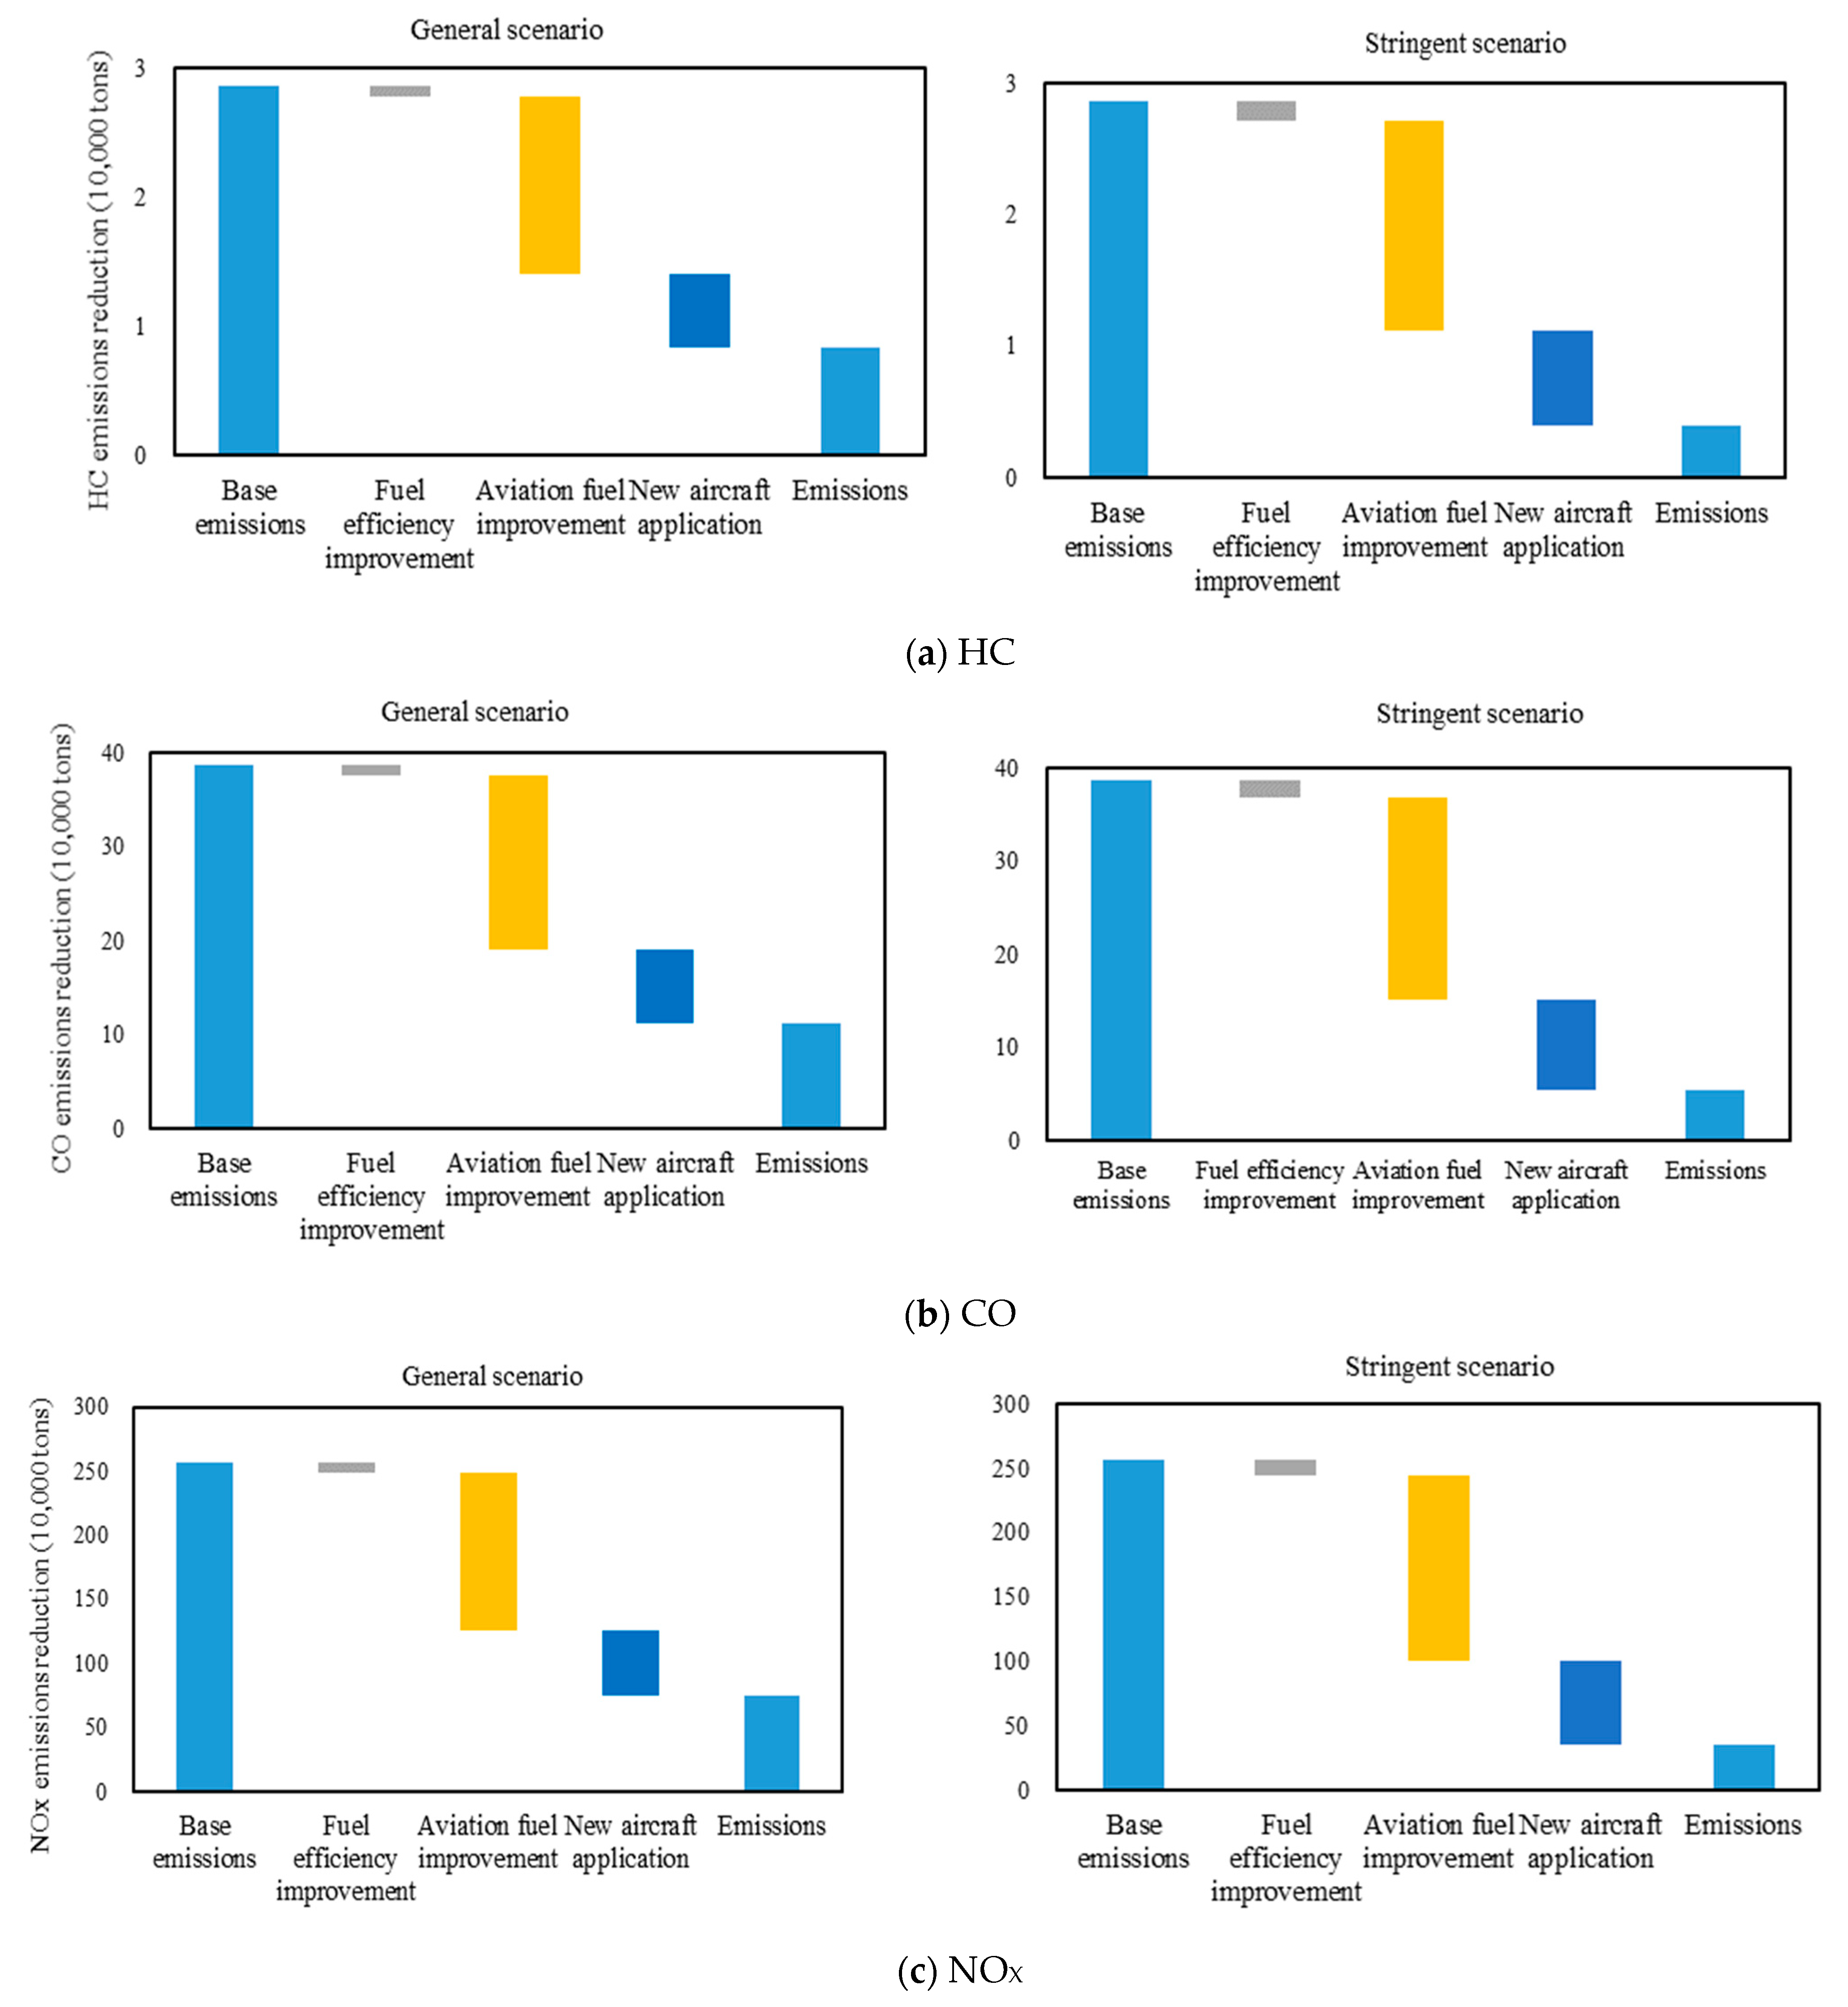
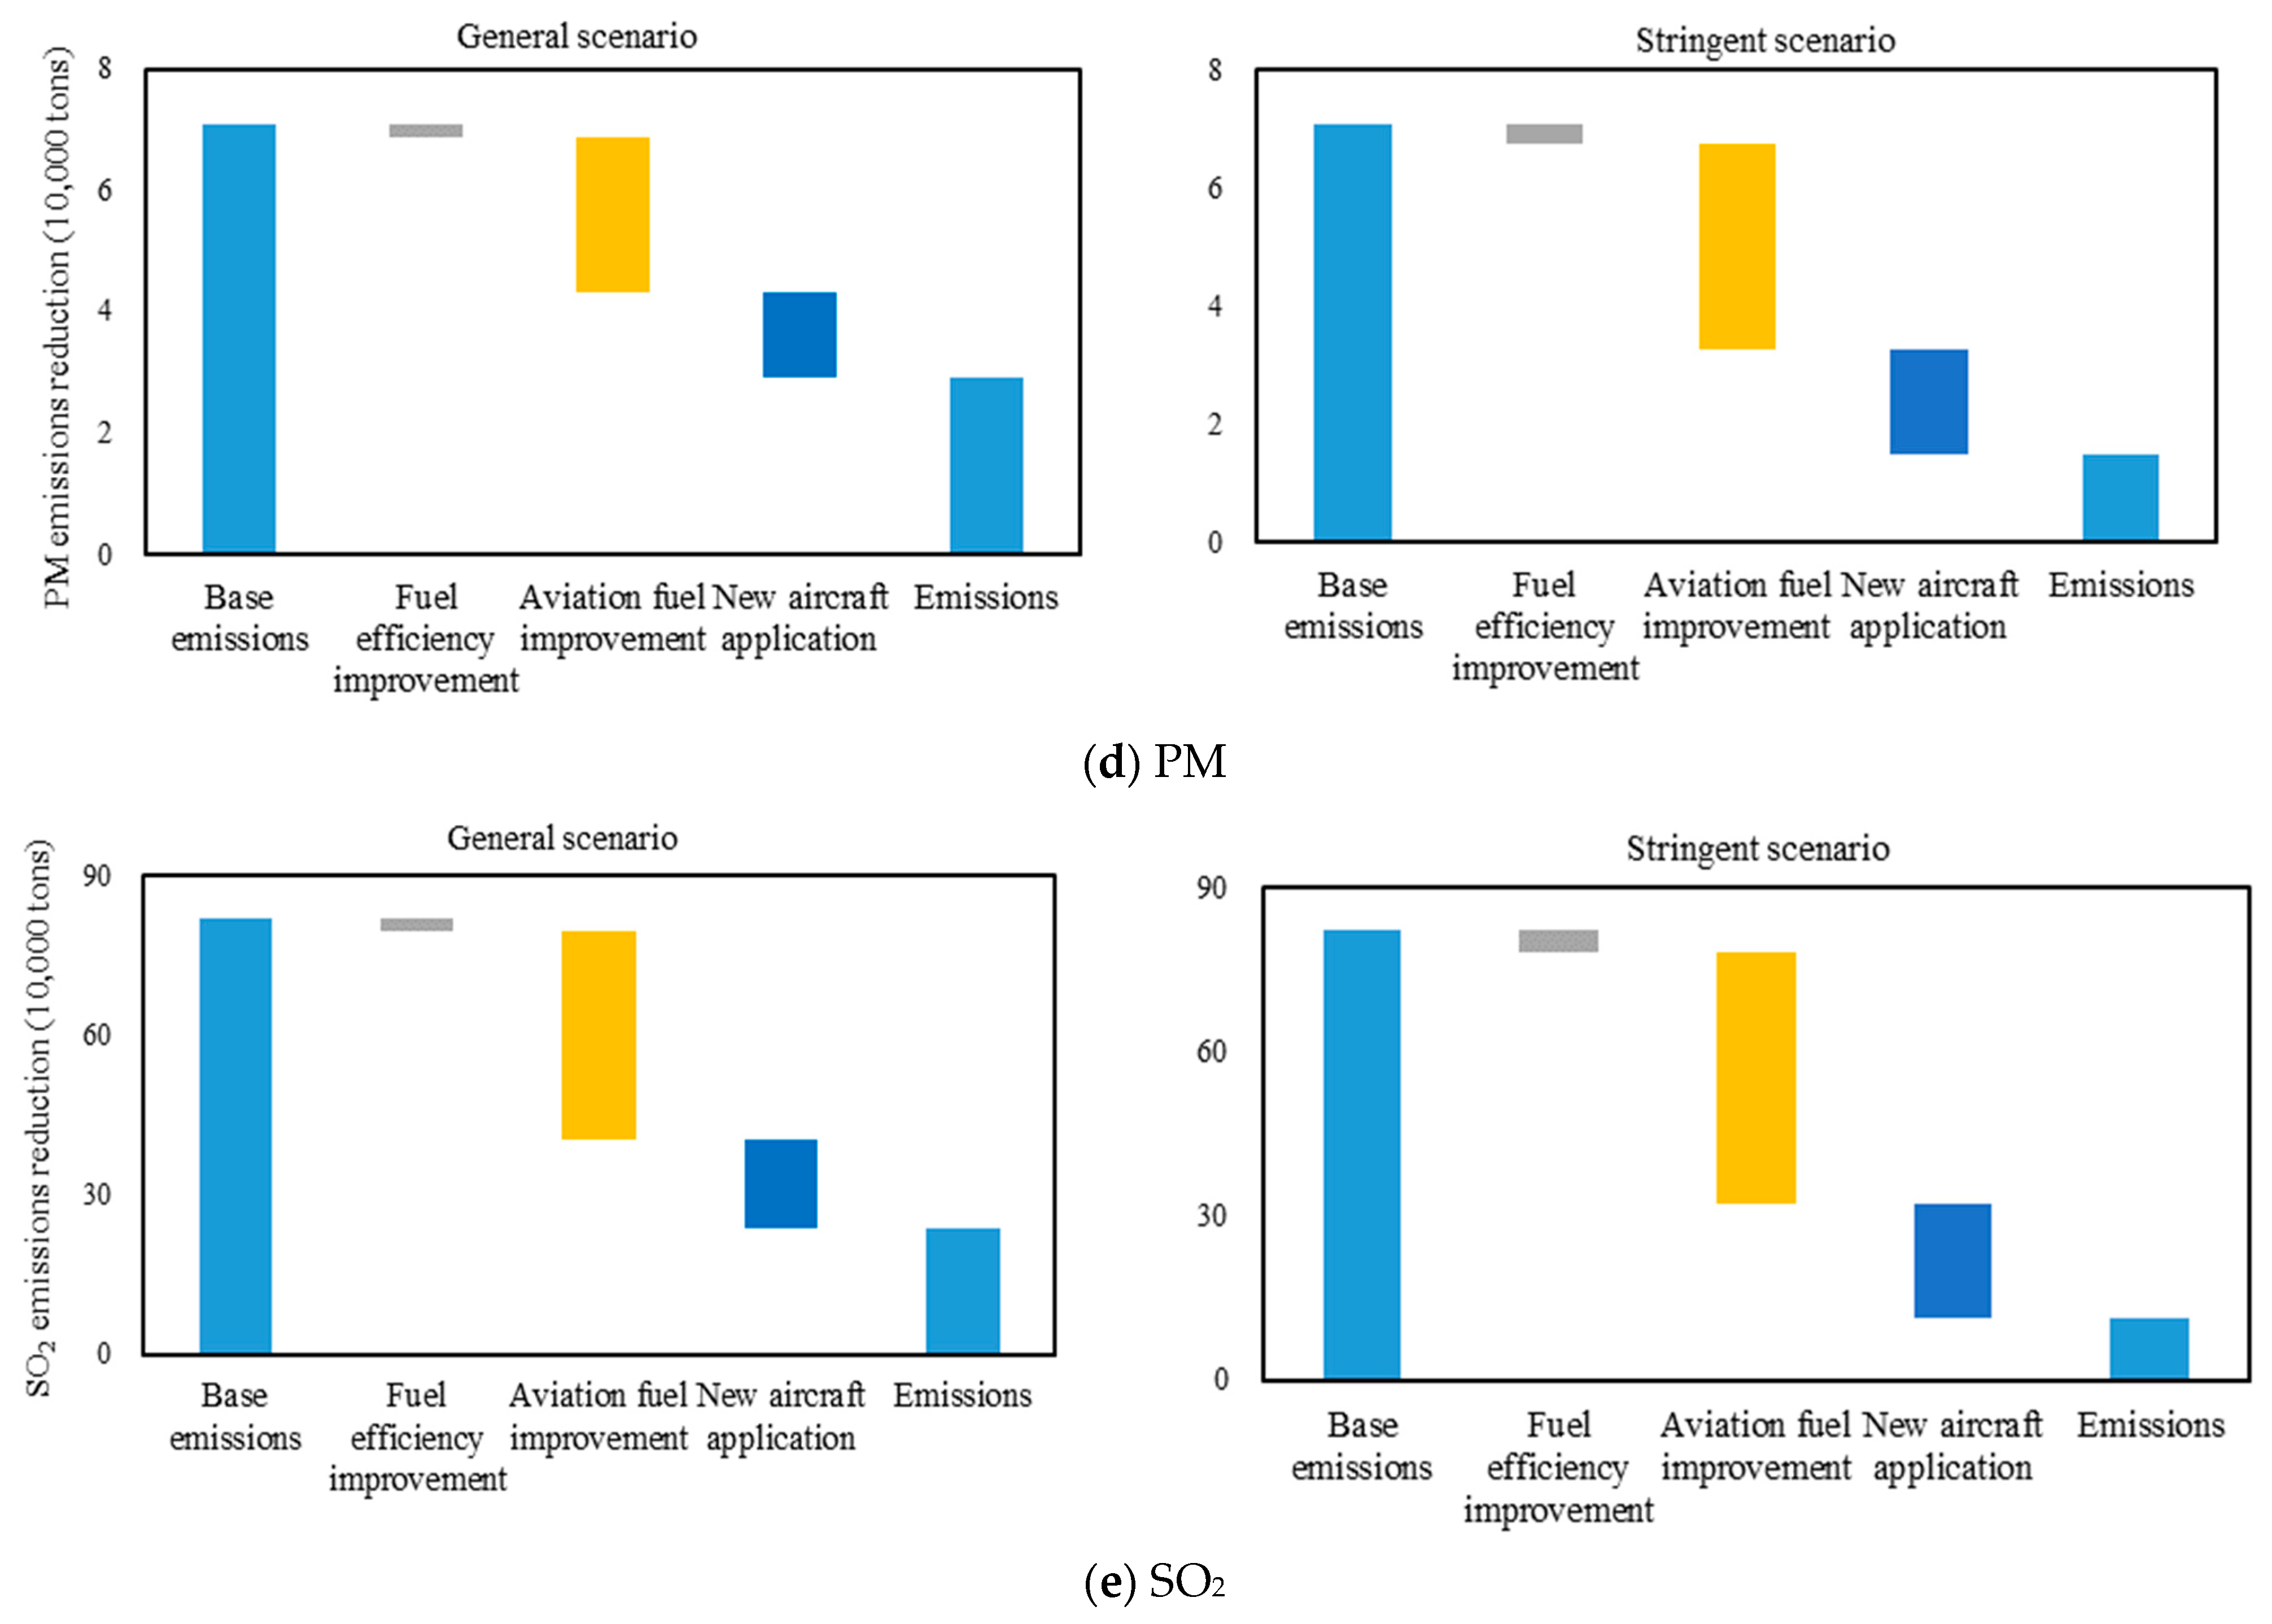
Fuel efficiency improvement, aviation fuel improvement and new aircraft application can reduce the air pollutants (HC, CO, NOX, PM, SO2). Figure 14 illustrates the reduction potential for each air pollutant in 2050. Under the general scenario, fuel efficiency measures can reduce the emissions of HC, CO, NOX, PM and SO2 by 0.8 kt, 11.6 kt, 77.1 kt, 2.1 kt and 24.6 kt, respectively, accounting for 4–5% of the total emission reduction of the corresponding pollutants and 3% compared to the baseline scenario. The aviation fuel improvement measure can reduce the emissions of air pollutants HC, CO, NOX, PM and SO2 by 13.7 kt, 186.2 kt, 1233.1 kt, 25.5 kt, and 394. 6 kt, respectively, accounting for 61–68% of the total reduction of the corresponding pollutants, and 36–48% of the reduction compared to the baseline scenario, respectively. The new aircraft application measure can reduce the emissions of air pollutants HC, CO, NOX, PM and SO2 by 5.7 kt, 77.6 kt, 513.8 kt, 14.2 kt and 164.4 kt, respectively, accounting for 28–34% of the total emission reduction of the corresponding pollutants, which can be reduced by 20%, respectively, compared to the baseline scenario. Under the stringent scenario, fuel efficiency improvement can reduce HC, CO, NOX, PM and SO2 emissions by 1.4 kt, 19.4 kt, 128.4 kt, 3.5 kt and 41.1 kt, respectively, accounting for 6% of the total emission reduction, a 5% decrease compared to the baseline emission. Aviation fuel improvement can reduce the figures by 16.7 kt, 217.3 kt, 1438.6 kt, 34.7 kt, and 460.1 kt, respectively, accounting for 62–65% of the total reduction, a 36–48% decrease compared to the baseline emission. The new aircraft application measure can lower the figures by 7.2 kt, 97 kt, 642.2 kt, 17.7 kt and 205.5 kt, respectively, accounting for 29–32% of the total emission reduction, a 25% decrease compared to the baseline emission.

3.4. Co-Reduced Effect of CO2 and Air Pollutants

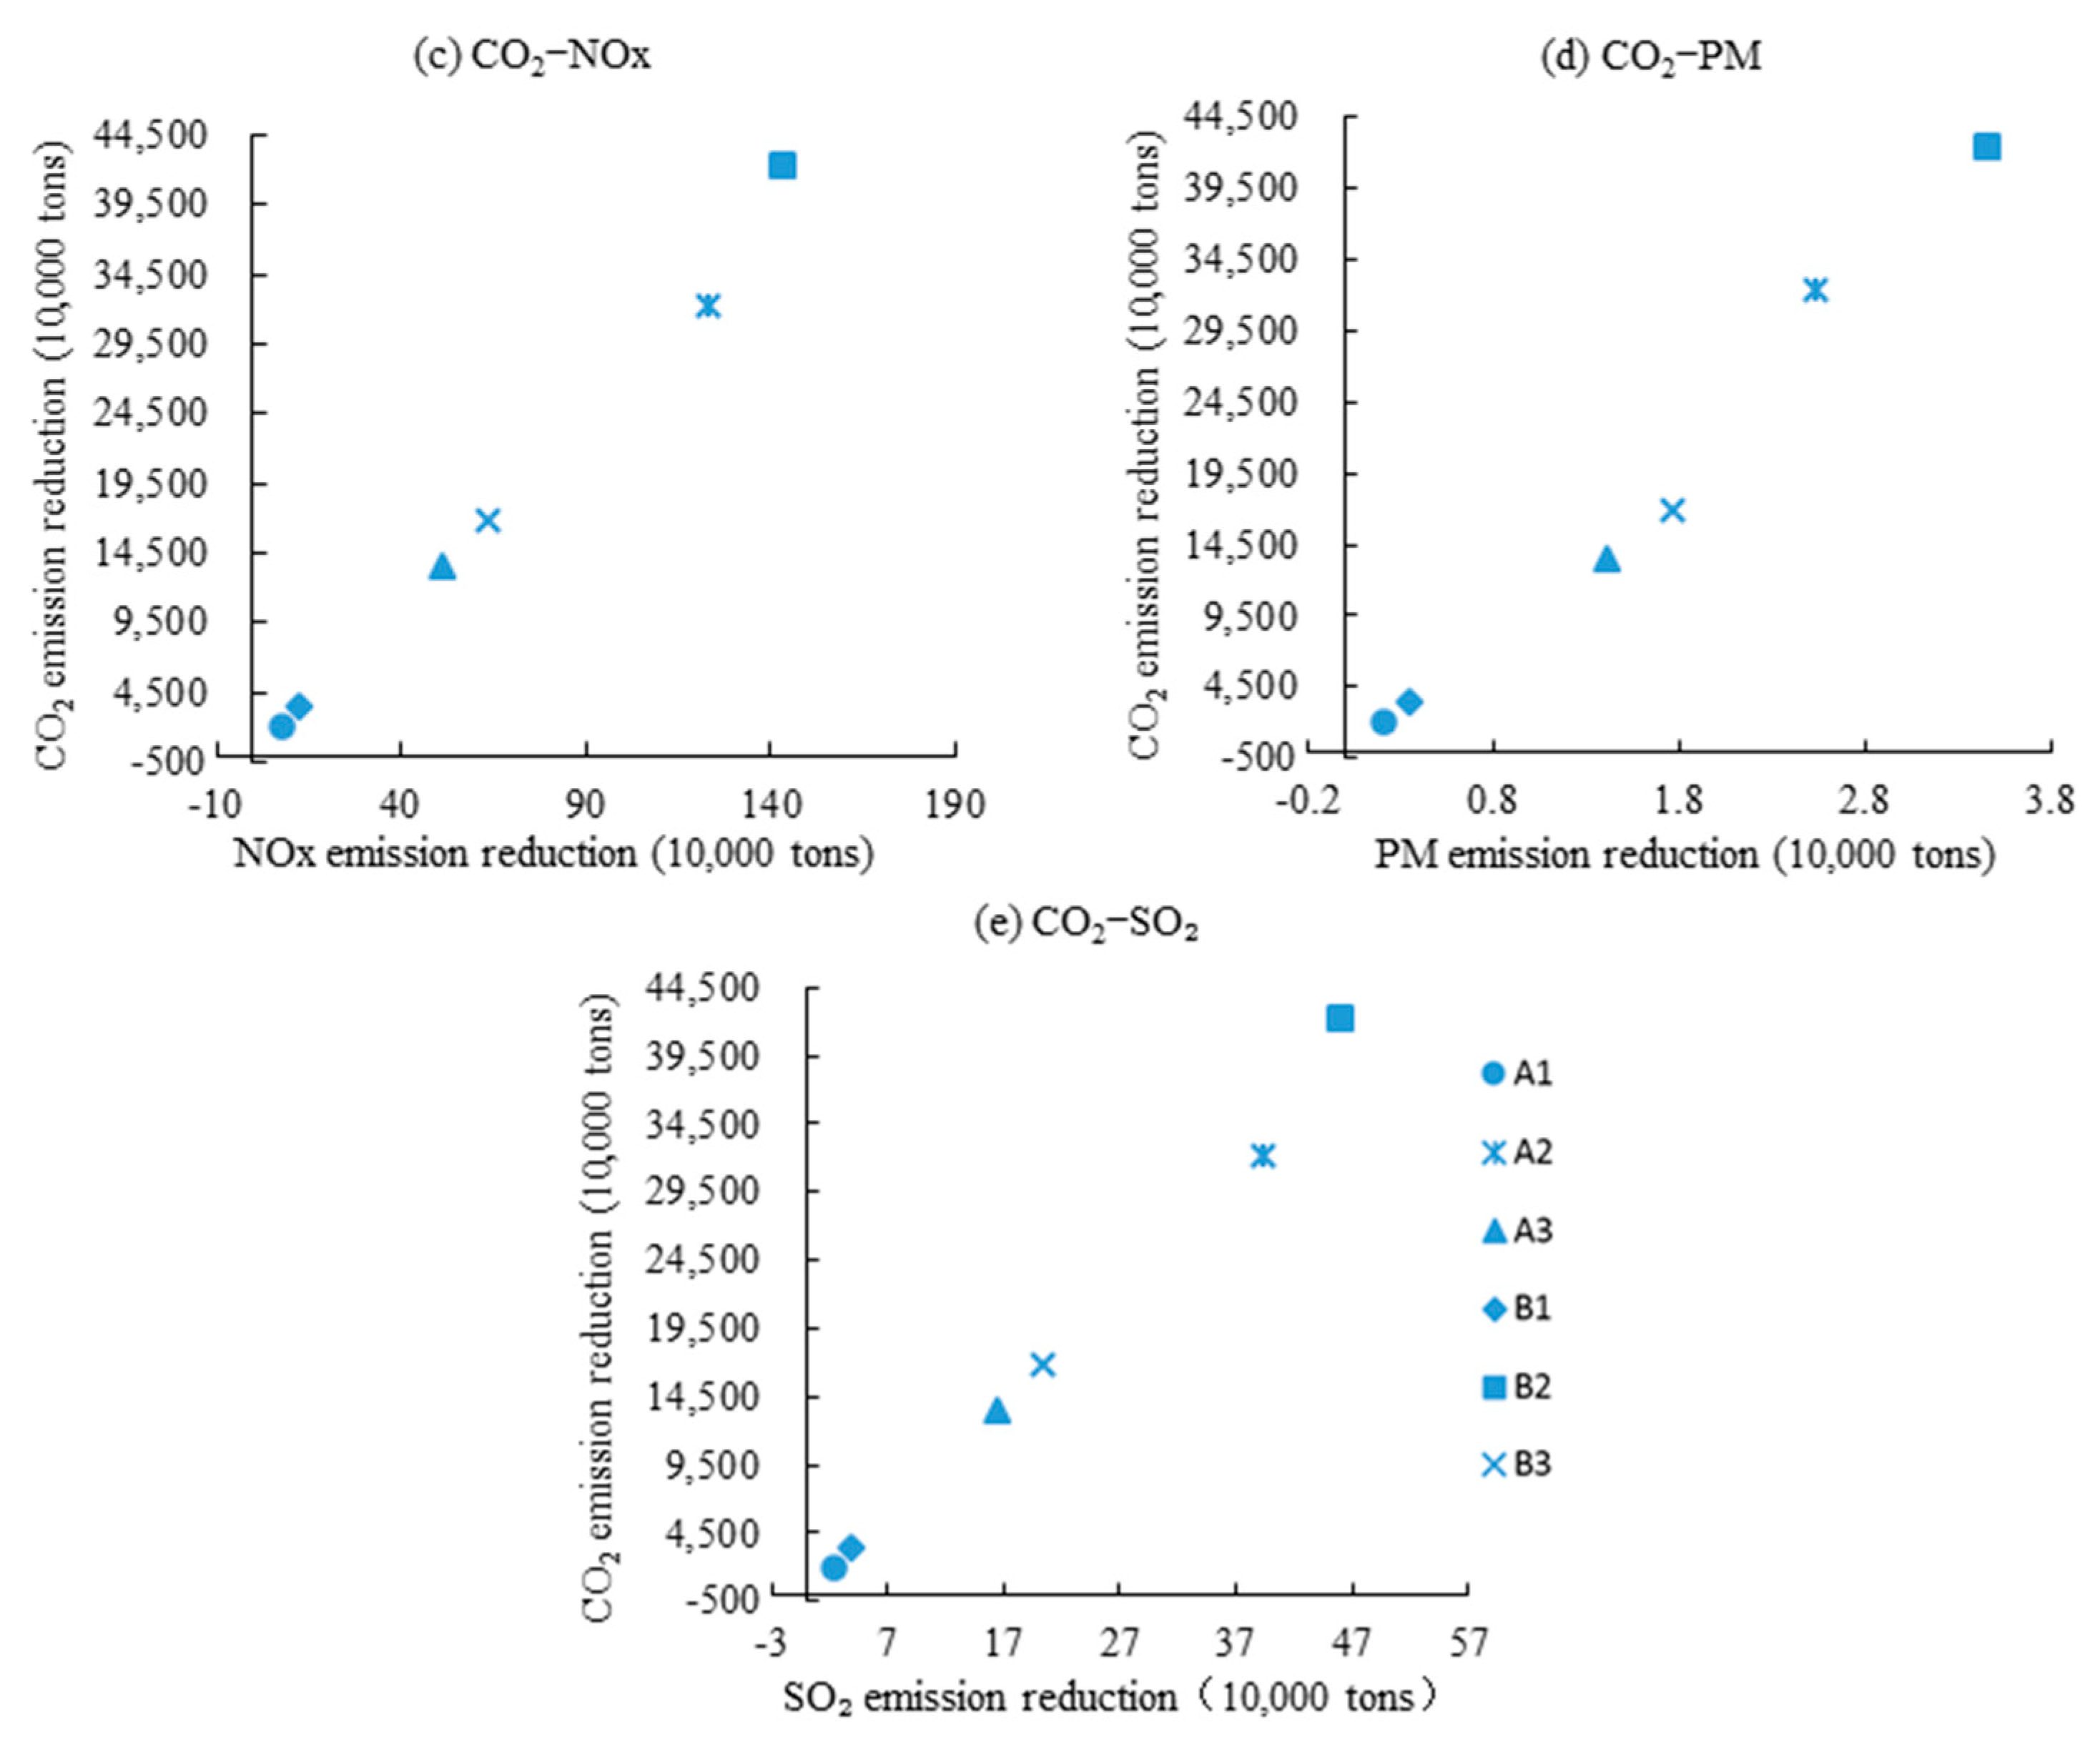
In this study, the co-effects of different measures on CO2 and air pollutants in China’s aviation sector in 2050 under the general and stringent scenarios are investigated using the assessment method of co-reduction emissions mentioned in 2.5, and as shown in Figure 15. It can be seen that the coordinates of HC, CO, NOX, PM, SO2 and CO2 are in the first quadrant under both the general and the stringent scenarios, indicating that fuel efficiency improvement, aviation fuel improvement and new aircraft application can not only reduce CO2 emissions, but also bring air pollutant reduction effects.
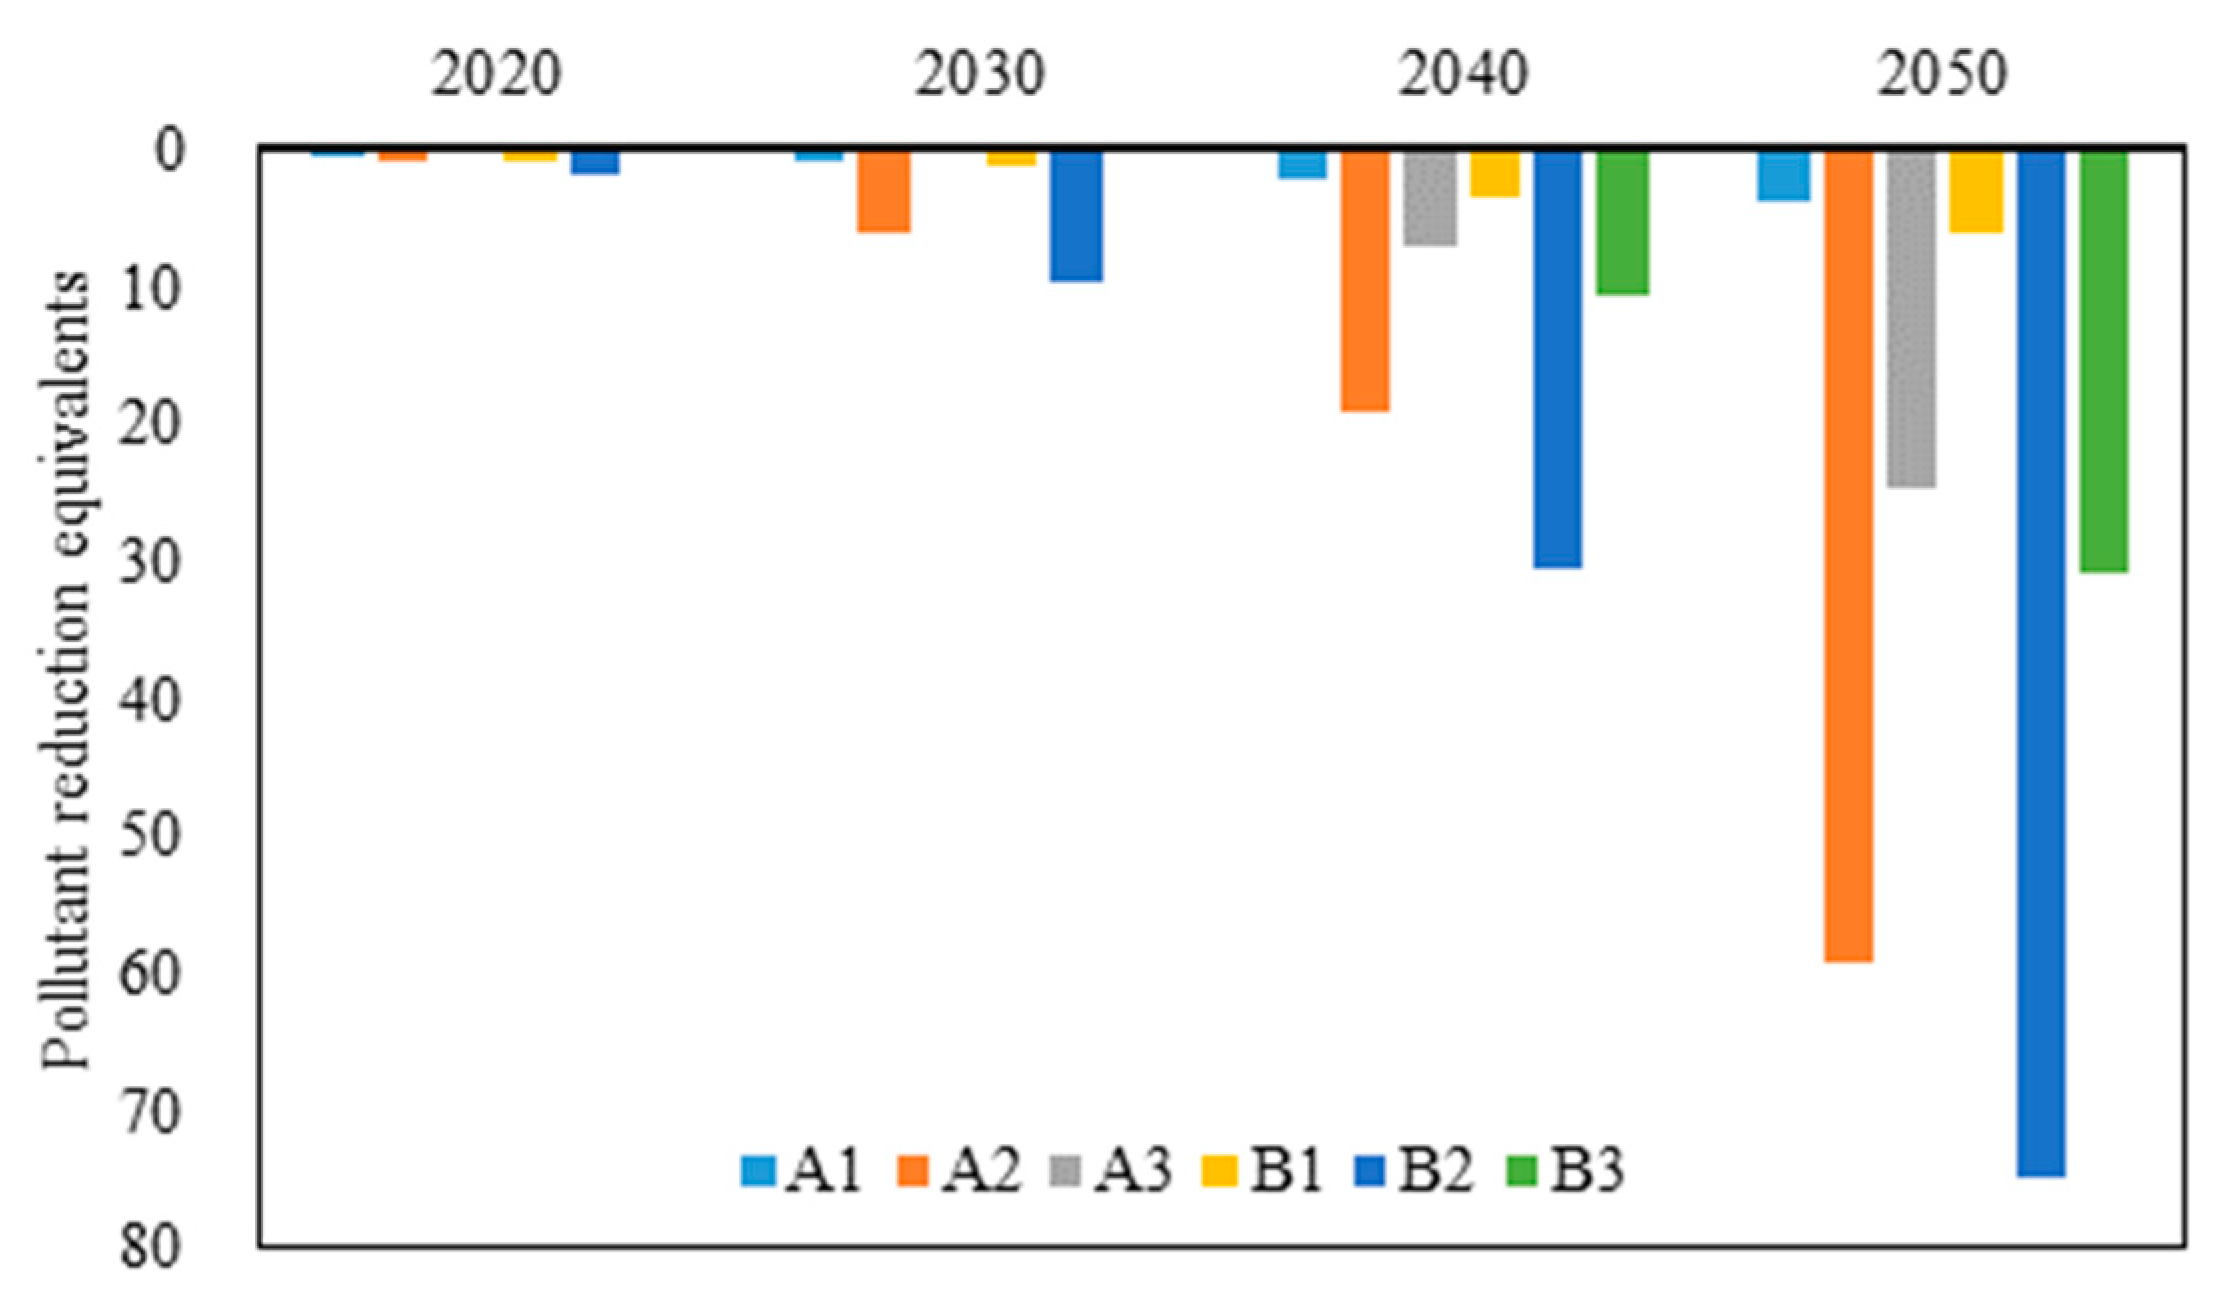
The equivalent values of emission reduction under different emission reduction measures in China’s civil aviation sector from 2020 to 2050 are calculated according to Equation (8), as shown in Figure 16. It can be seen that aviation fuel improvement > new aircraft application > fuel efficiency improvement in terms of emission reductions in 2035–2040, both in the general scenario and in the stringent scenario. A hydrogen-fueled aircraft will have difficulty entering the market in 2020–2030, so the three measures have not had an impact on the emissions during this period. However, they have a good co-effect on the reduction of CO2 and air pollutants, and aviation fuel improvement can reduce the pollutant equivalent value of 61.9 to the maximum by 2050 under the stringent scenario.

4. Conclusions and Recommendations

In this study, the emission inventories of greenhouse gases (CO2) and air pollutants (NOx, SO2, CO, PM, HC) from 235 airports in China in 2018 were estimated by constructing the pollutant emission calculation method for the full route of China’s civil aviation. Based on the latest national policies and the latest reports of aviation sector research issued by domestic and foreign institutions, the baseline scenario, general scenario and stringent scenario were set up to predict and analyze the possible development direction of the aviation industry in the future to achieve the carbon peak goal. The co-control effects coordinate system was used to quantitatively evaluate the co-reduction emission effect of CO2 and air pollutants under different scenarios and different measures, including fuel efficiency improvement, aviation fuel improvement and new aircraft application. The main conclusions of this study are summarized as follows.
In 2018, the emissions of CO2, NOx, SO2, CO, PM and HC were 117.23 × 10⁶ tons, 90.47 × 10⁴ tons, 14.37 × 10⁴ tons, 9 × 10⁴ tons, 1.29 × 10⁴ tons and 0.66 × 10⁴ tons, respectively. From the time distribution of pollutants, the annual average monthly discharge is not uniform and presents the characteristics of summer and autumn > winter and spring. In terms of spatial distribution, the emission of pollutants in all provinces is very uneven, showing spatial characteristics of high emission in eastern China, followed by central China and the lowest emissions are seen in western China. Under the baseline scenario, the emissions of CO2, NOx, SO2, CO, PM and HC were 663.89 × 10⁶ tons, 254.32 × 10⁴ tons, 81.39 × 10⁴ tons, 38.41 × 10⁴ tons, 7.01 × 10⁴ tons and 2.84 × 10⁴ tons, respectively. The emissions of CO2 and air pollutants increased by 331% to 472% compared with the baseline year. This further indicates that without effective measures or technologies to reduce emissions from the aviation industry, emissions from the aviation industry will increase dramatically in the coming years. Under the general scenario, the emission reduction of CO2 can reach 469.41 × 10⁶ tons, the emission reduction of air pollutants (NOx, SO2, CO, PM and HC) can reach 179.82 × 10⁴ tons, 57.55 × 10⁴ tons, 27.16 × 10⁴ tons, 4.11 × 10⁴ tons and 2.01 × 10⁴ tons, respectively. Compared with the baseline scenario, the emission reduction rates in the corresponding years were from 60% to 72%. Under the stringent scenario, the emission reduction of CO2 can reach 616.94 × 10⁶ tons; the emission reduction of air pollutants (NOx, SO2, CO, PM and HC) can reach 218.36 × 10⁴ tons, 69.88 × 10⁴ tons, 32.98 × 10⁴ tons, 5.52 × 10⁴ tons and 2.44 × 10⁴ tons, respectively. Compared with the baseline scenario, the emission reduction rates in the corresponding years were from 80% to 94%. The most effective aviation fuel improvements could reduce CO2 emissions by 89% and 68% by 2030 and 2050, respectively, and reduce air pollutants by 86% to 89% and 62% to 65%.
The factors affecting the accuracy of emission estimation mainly come from two aspects: activity levels and emission factors. In terms of activity levels, flights vary greatly due to the impact of specific weather extremes (heavy rain, snow and typhoons, etc.), airport adjustments, emergency landings and traffic control. However, the number of LTO cycles in civil aviation official statistics is less affected by these factors. The selection of emission factors is more uncertain than the activity levels. Firstly, the uncertainty of engine model matching directly leads to the uncertain selection of HC, CO, NOx and PM emission factors. Additionally, airlines, civil aviation official websites, aircraft manufacturers and so on will rarely publish the engine model of each aircraft, and each aircraft may be installed with different engine models. In addition, airlines will update and upgrade aircraft engines every year, so the number of engines counted at different times is not the same. Secondly, the effective height of aircraft emission defined by ICAO (3000 ft, about 915 m) was selected as the atmospheric boundary layer height in the calculation of pollutant emissions in the LTO phase. However, in the actual flight of the aircraft, due to meteorological factors and other reasons, specific circumstances will vary from the ICAO recommendations. Finally, there is great uncertainty about the selection of emission factors in the cruise. This study selects the results of Han et al. (2017) [39] based on the calculation of the emission factors of the whole flight process in a real flight, taking A320 as a typical model, as the results of this study. Therefore, the emission difference between different models is ignored, and there is a certain deviation compared with the real situation.
Through the use of different co-reduction assessment methods, this study analyzed three measures of fuel efficiency improvement, aviation fuel improvement and the application of a new aviation aircraft. These can not only reduce the CO2 emissions, but also bring about a reduction in air pollutants, having a good co-reduction effect. Therefore, this study suggests that the aviation sector should accelerate the research and development of bio-fuel and new energy sources including hydrogen energy, solar energy, wind energy and other power generation technologies to develop new electric or hybrid electric aircrafts. The sector should also commit to using hydrogen fuel in the aircraft, and to the realization of hydrogen turbines to achieve aviation net zero emissions. In addition, some of the measures already in place, such as reducing APU operating time, reducing taxiing time, electrifying ground equipment, jet engine cleaning and “wing tip” modification, can also work together to reduce fuel consumption, greenhouse gases and air pollutants. Therefore, the implementation of these measures needs to be further strengthened in the future. In addition, the application and development of some negative emission technologies, such as afforestation, bioenergy and carbon capture and storage, should also be strengthened. These technologies can complement emission reduction measures to make up for the carbon emissions that are difficult to reduce in the industry, so we can strive to achieve zero emissions.

Author Contributions

Conceptualization, X.G. and C.N.; methodology, X.G.; validation, Y.S.; formal analysis, C.N. and D.C.; investigation, D.C.; data curation, C.Y. and S.C.; writing—original draft preparation, C.N.; writing—review and editing, X.G. and D.C. All authors have read and agreed to the published version of the manuscript.

Funding

This was funded by the National Science Foundation of China (No. 51978011).

Institutional Review Board Statement

Not applicable.

Informed Consent Statement

Not applicable.

Data Availability Statement

Data sharing not applicable.

Acknowledgments

This paper represents the perspectives of the authors and does not necessarily represent the official views of our sponsors. We would like to appreciate the anonymous reviewers for their valuable comments and suggestions to improve the manuscript.

Conflicts of Interest

The authors declare no conflict of interest.

Abbreviation

Word (s)Abbreviation
carbon dioxideCO2
nitrogen oxidesNOx
sulfur dioxideSO2
carbon monoxideCO
particulate matterPM
hydrocarbonsHC
landing and takeoffLTO
Geographic Information SystemsGIS
Autoregressive Integrated Moving AverageARIMA
International Civil Aviation OrganizationICAO
Civil Aviation Administration of ChinaCAAC
Fuel Sulfur ContentFSC
National Aeronautics and Space AdministrationNASA
International Energy AgencyIEA
Revenue Passenger KilometerRPK
Aviation Industry Development Research CenterADR
Chinese Academy of Social Sciences CASS
General Electric CompanyGE

References

  1. Zhou, W.; Wang, T.; Yu, Y.; Chen, D.; Zhu, B. Scenario analysis of CO2 emissions from China’s civil aviation industry through 2030. Appl. Energy 2016, 175, 100–108. [Google Scholar] [CrossRef]
  2. Han, R.; Li, L.; Zhang, X.; Lu, Z.; Zhu, S. Spatial-temporal Evolution Characteristics and Decoupling Analysis of Influencing Factors of China’s Aviation Carbon Emissions. Chin. Geogr. Sci. 2022, 32, 218–236. [Google Scholar] [CrossRef]
  3. International Council on Clean Transportation (ICCT). Available online: https://theicct.org/publication/co2-emissions-from-commercial-aviation-2018/ (accessed on 24 November 2022).
  4. Environmental Defense Fund. Available online: http://www.cet.net.cn/html/news/CET/2020/0608/437.html (accessed on 24 November 2022). (In Chinese).
  5. Yim, S.H.; Lee, G.L.; Lee, I.H.; Allroggen, F.; Ashok, A.; Caiazzo, F.; Eastham, S.D.; Malina, R.; Barrett, S.R. Global, regional and local health impacts of civil aviation emissions. Environ. Res. Lett. 2015, 10, 034001. [Google Scholar] [CrossRef]
  6. Nascimento, B.N.O.; Lorena, D.C.G.D.; Tureta, Z.I. Evaluation of energy consumption and emissions of carbon dioxide of road transport of Brazil (2016–2026). Desenvolv. E Meio Ambiente 2020, 54, 22. [Google Scholar] [CrossRef]
  7. Bebkiewicz, K.; Chłopek, Z.; Lasocki, J.; Szczepański, K.; Zimakowska-Laskowska, M. The Inventory of Pollutants Hazardous to the Health of Living Organisms, Emitted by Road Transport in Poland between 1990 and 2017. Sustainability 2020, 12, 5387. [Google Scholar] [CrossRef]
  8. Liu, G.; Sun, S.; Zou, C.; Wang, B.; Wu, L.; Mao, H. Air pollutant emissions from on-road vehicles and their control in Inner Mongolia, China. Energy 2022, 238, 121724. [Google Scholar] [CrossRef]
  9. Wang, J.; Li, Y.; Zhang, Y. Research on Carbon Emissions of Road Traffic in Chengdu City Based on a LEAP Model. Sustainability 2022, 14, 5625. [Google Scholar] [CrossRef]
  10. Zhang, W.; Cao, S.Y.; Gu, Y.F. Reduction Potential of Carbon Emission from Inland Water Transportation Activities of Jiangxi Province. In Advanced Materials Research; Trans Tech Publications: Wollerau, Switzerland, 2012; Volume 524, pp. 3651–3654. [Google Scholar] [CrossRef]
  11. Andreoni, V.; Galmarini, S. European CO2 emission trends: A decomposition analysis for water and aviation transport sectors. Energy 2012, 45, 595–602. [Google Scholar] [CrossRef]
  12. Xu, X.; Kent, S.; Schmid, F. Carbon-reduction potential of electrification on China’s railway transport: An analysis of three possible future scenarios. Proc. Inst. Mech. Eng. Part F J. Rail Rapid Transit 2021, 235, 226–235. [Google Scholar] [CrossRef]
  13. Dincer, F.; Elbir, T. Estimating national exhaust emissions from railway vehicles in Turkey. Sci. Total Environ. 2007, 374, 127–134. [Google Scholar] [CrossRef]
  14. Simone, N.W.; Stettler, M.E.J.; Barrett, S.R.H. Rapid estimation of global civil aviation emissions with uncertainty quantification. Transp. Res. Part D: Transp. Environ. 2013, 25, 33–41. [Google Scholar] [CrossRef]
  15. Lyu, C.; Liu, X.; Wang, Z.; Yang, L.; Liu, H.; Yang, N.; Xu, S.; Cao, L.; Zhang, Z.; Pang, L.; et al. An emissions inventory using flight information reveals the long-term changes of aviation CO2 emissions in China. Energy 2023, 262, 125513. [Google Scholar] [CrossRef]
  16. Yu, J.; Shao, C.; Xue, C.; Hu, H. China’s aircraft-related CO2 emissions: Decomposition analysis, decoupling status, and future trends. Energy Policy 2020, 138, 111215. [Google Scholar] [CrossRef]
  17. Zeydan, O.; Sekertekin, Y.Y. GIS-based determination of Turkish domestic flights emissions. Atmos. Pollut. Res. 2022, 13, 101299. [Google Scholar] [CrossRef]
  18. Zhou, Y.; Jiao, Y.; Lang, J.; Chen, D.; Huang, C.; Wei, P.; Li, S.; Cheng, S. Improved estimation of air pollutant emissions from landing and takeoff cycles of civil aircraft in China. Environ. Pollut. 2019, 249, 463–471. [Google Scholar] [CrossRef]
  19. Tokuslu, A. Estimation of aircraft emissions at Georgian international airport. Energy 2020, 206, 118219. [Google Scholar] [CrossRef]
  20. Wang, M.X. Analysis to the Technology Path on Zero-Emission Aviation. ADR 2021, 18, 16–19. (In Chinese) [Google Scholar]
  21. Irving, M. Biofuels Can Slash Aircraft Particle Emissions and Reduce Contrails. Available online: https://newatlas.com/nasa-biofuel-impact-study-contrails/48433/ (accessed on 24 November 2022).
  22. Wise, M.; Muratori, M.; Kyle, P. Biojet fuels and emissions mitigation in aviation: An integrated assessment modeling analysis. Transp. Res. Part D-Transp. Environ. 2017, 52, 244–253. [Google Scholar] [CrossRef]
  23. Hassan, M.; Pfaender, H.; Mavris, D. Probabilistic assessment of aviation CO2 emission targets. Transp. Res. Part D-Transp. Environ. 2018, 63, 362–376. [Google Scholar] [CrossRef]
  24. Bicer, Y.; Dincer, I. Life cycle evaluation of hydrogen and other potential fuels for aircrafts. Int. J. Hydrogen Energy 2017, 42, 10722–10738. [Google Scholar] [CrossRef]
  25. Khalili, M.; Ali Dashtaki, M.; Nasab, M.A.; Reza Hanif, H.; Padmanaban, S.; Khan, B. Optimal instantaneous prediction of voltage instability due to transient faults in power networks taking into account the dynamic effect of generators. Cogent Eng. 2022, 9, 2072568. [Google Scholar] [CrossRef]
  26. Padmanaban, S.; Samavat, T.; Nasab, M.A.; Nasab, M.A.; Zand, M.; Nikokar, F. Electric Vehicles and IoT in Smart Cities. In Artificial Intelligence-Based Smart Power Systems; John Wiley & Sons, Inc.: New York, NY, USA, 2022; pp. 273–290. [Google Scholar] [CrossRef]
  27. Puliafito, S.E. Civil aviation emissions in Argentina. Sci. Total Environ. 2023, 869, 161675. [Google Scholar] [CrossRef] [PubMed]
  28. Liu, H.; Tian, H.; Hao, Y.; Liu, S.; Liu, X.; Zhu, C.; Wu, Y.; Liu, W.; Bai, X.; Wu, B. Atmospheric emission inventory of multiple pollutants from civil aviation in China: Temporal trend, spatial distribution characteristics and emission features analysis. Sci. Total Environ. 2019, 648, 871–879. [Google Scholar] [CrossRef] [PubMed]
  29. Van Pham, V.; Tang, J.; Alam, S.; Lokan, C.; Abbass, H.A. Aviation emission inventory development and analysis. Environ. Model. Softw. 2010, 25, 1738–1753. [Google Scholar] [CrossRef]
  30. Dmitrieva, T.M.; Grabar, V.A. Emissions from Russian domestic civil aviation in 2000–2012 and integrated assessment of their impact on the climate system. Russ. Meteorol. Hydrol. 2017, 42, 538–543. [Google Scholar] [CrossRef]
  31. Yang, H.J.; O’Connell, J.F. Short-term carbon emissions forecast for aviation industry in Shanghai. J. Clean. Prod. 2020, 275, 122734. [Google Scholar] [CrossRef]
  32. Owen, B.; Lee, D.S.; Lim, L. Flying into the future: Aviation emissions scenarios to 2050. Environ. Sci. Technol. 2010, 44, 2255–2260. [Google Scholar] [CrossRef]
  33. Schaefer, M. Forecast of air traffic’s CO2 and NOx emissions until 2030. Int. J. Aviat. Manag. 2015, 2, 256–273. [Google Scholar] [CrossRef]
  34. ICAO. International Standards and Recommended Practices, Environmental Protection Annex 16. Volume II Aircraft Engine Emissions, Second Ed. 1993. Available online: https://www.icao.int/environmental-protection/Documents/EnvironmentalReports/2022/ENVReport2022_Art17.pdf#search=International%20Standards%20and%20Recommended%20Practices%2C%20Environmental%20Protection%20Annex%2016%2E%20Volume%20II%20aircraft%20engine%20emissions (accessed on 20 April 2023).
  35. ICAO. Airport Air Quality Manual. 2016. Available online: https://www.icao.int/environmental-protection/Documents/Doc%209889.SGAR.WG2.Initial%20Update.pdf#search=operational%20LTO%20flight%20cycle%20 (accessed on 20 April 2023).
  36. Civil Aviation Administration of China. Statistical Data on Civil Aviation of China 2019; Civil Aviation Press of China: Beijing, China, 2020. Available online: http://www.caac.gov.cn/XWZX/MHYW/202006/P020200608350035195085.pdf (accessed on 20 April 2023). (In Chinese)
  37. Wayson, R.L.; Fleming, G.G.; Iovinelli, R. Methodology to Estimate Particulate Matter Emissions from Certified Commercial Aircraft Engines. J. Air Waste Manag. Assoc. 2009, 59, 91–100. [Google Scholar] [CrossRef]
  38. Wei, Z.Q.; Diao, H.Z.; Han, B. Research on calculating aircraft pollution emissions in cruise phase. Sci. Technol. Eng. 2014, 14, 122–127. (In Chinese) [Google Scholar] [CrossRef]
  39. Han, B.; Liu, Y.T.; Tan, H.Z.; Wang, Y.; Wei, Z.Q. Emission characterization of civil aviation aircraft during a whole flight. Acta Sci. Circumstantiae 2017, 37, 4492–4502. (In Chinese) [Google Scholar] [CrossRef]
  40. EEA. EMEP/EEA Air Pollutant Emission Inventory Guidebook 2019. Available online: https://www.eea.europa.eu/publications/emep-eea-guidebook-2019 (accessed on 24 November 2022).
  41. GB6537-2018; Jet fuel No.3; China Standard Press: Beijing, China, 2018.
  42. Schumann, U.; Arnold, F.; Busen, R.; Curtius, J.; Kärcher, B.; Kiendler, A.; Petzold, A.; Schlager, H.; Schröder, F.; Wohlfrom, K.H. Influence of fuel sulfur on the composition of aircraft exhaust plumes: The experiments SULFUR 1–7. J. Geophys. Res. Atmos. 2002, 107, AAC 2–1–AAC 2–27. [Google Scholar] [CrossRef]
  43. Li, C. Emissions Characteristics and Future Trends of Non-Road Mobile Sources in China. Ph.D. Thesis, South China University of Technology, Guangzhou, China, 2017. (In Chinese). [Google Scholar]
  44. Airbus. Global Market Forecast 2019–2038. Available online: https://www.britishaviationgroup.co.uk/news/airbus-global-market-forecast-2019-2038/ (accessed on 24 November 2022).
  45. Aviation Industry Releases Annual Report on Civil Aircraft China Market Forecast 2020–2039. 2020. Available online: http://www.textsharefiledownload.com/downloads1.asp?f=0420/638176296347139201.PDF (accessed on 20 April 2023). (In Chinese).
  46. Central People’s Government of the PRC. Outline of the Fourteenth Five-Year Plan for National Economic and Social Development of the PRC and Vision 2035. Available online: http://www.gov.cn/xinwen/2021-03/13/content_5592681.htm (accessed on 24 November 2022).
  47. Chinese Academy of Social Sciences. Economic Blue Book: Analysis and Forecast of China’s Economic Situation in 2021; Social Science Literature Press: Beijing, China, 2021. [Google Scholar]
  48. IEA. World Energy Outlook 2020. Available online: https://www.iea.org/reports/world-energy-outlook-2020 (accessed on 24 November 2022).
  49. IPCC. IPCC Guidelines for National Greenhouse Gas Inventories. Available online: https://www.ipcc.ch/report/2006-ipcc-guidelines-for-national-greenhouse-gas-inventories/ (accessed on 24 November 2022).
  50. Yu, J.L.; Gao, C.; Hu, H.Q. Characteristics of temporal and spatial distribution of air pollutant emissions from civil aviation aircrafts in mainland China. China Transp. Rev. 2019, 41, 70–75. (In Chinese) [Google Scholar]
  51. Xiurui, G.; Xiaoqian, G.; Yao, L.; Yiling, Z. Projections of the Emission Reductions of Carbon Dioxide and Conventional Pollutants in the Major Transport Sectors of the Beijing-Tianjin-Hebei Region, China. J. Resour. Ecol. 2023, 14, 372–382. [Google Scholar] [CrossRef]
  52. Mao, X.Q.; Xing, Y.K.; Gao, Y.B.; Feng, H.; An, Z.; Peng, K.; Tao, H. Study on GHGs and air pollutants co-control: Assessment and planning. China Environ. Sci. 2021, 41, 3390–3398. (In Chinese) [Google Scholar]
  53. Wang, Q.Y. Textbook of Energy Data 2019; Innovative Green Development Program: Beijing, China, 2019; p. 51. (In Chinese) [Google Scholar]
  54. Ministry of Ecology and Environment of the People’s Republic of China. Annual Report on Environmental Management of Mobile Sources in China. 2019. Available online: https://www.mee.gov.cn/xxgk2018/xxgk/xxgk15/201909/t20190904_732374.html (accessed on 24 November 2022).
  55. Zand, M.; Nasab, M.A.; Hatami, A.; Kargar, M.; Chamorro, H.R. Using Adaptive Fuzzy Logic for Intelligent Energy Management in Hybrid Vehicles. In Proceedings of the 28th Iranian Conference on Electrical Engineering (ICEE), Tabriz, Iran, 4–6 August 2020. [Google Scholar]
  56. Fan, W.; Sun, Y.; Zhu, T.; Wen, Y. Emissions of HC, CO, NOx, CO2, and SO2 from civil aviation in China in 2010. Atmos. Environ. 2012, 56, 52–57. [Google Scholar] [CrossRef]
  57. Fei, W.P.; Xiong, L.L.; Bian, X.H.; Song, G.H. Calculation and prediction analysis of air pollutant of civil aviation aircraft in China. J. Transp. Syst. Eng. Inf. Technol. 2020, 20, 33–40. (In Chinese) [Google Scholar] [CrossRef]
  58. Yu, J.L.; Jia, Q.; Gao, C.; Hu, H.Q. Air pollutant emissions from aircraft landing and take-off cycles at Chinese airports. Aeronaut. J. 2021, 125, 578–592. [Google Scholar] [CrossRef]
  59. Christodoulakis, J.; Karinou, F.; Kelemen, M.; Kouremadas, G.; Fotaki, E.F.; Varotsos, C.A. Assessment of air pollution from Athens International Airport and suggestions for adaptation to new aviation emissions restrictions. Atmos. Pollut. Res. 2022, 13, 101441. [Google Scholar] [CrossRef]
  60. Taghizadeh, S.A.; Shafabakhsh, G.H.; Aghayan, I. Evaluation of aircraft emission at Imam Khomeini International Airport and Mehrabad International Airport. Int. J. Environ. Sci. Technol. 2019, 16, 6587–6598. [Google Scholar] [CrossRef]
  61. Ekici, S.; Sevinc, H. Understanding a commercial airline company: A case study on emissions and air quality costs. Int. J. Environ. Sci. Technol. 2022, 19, 5139–5154. [Google Scholar] [CrossRef]
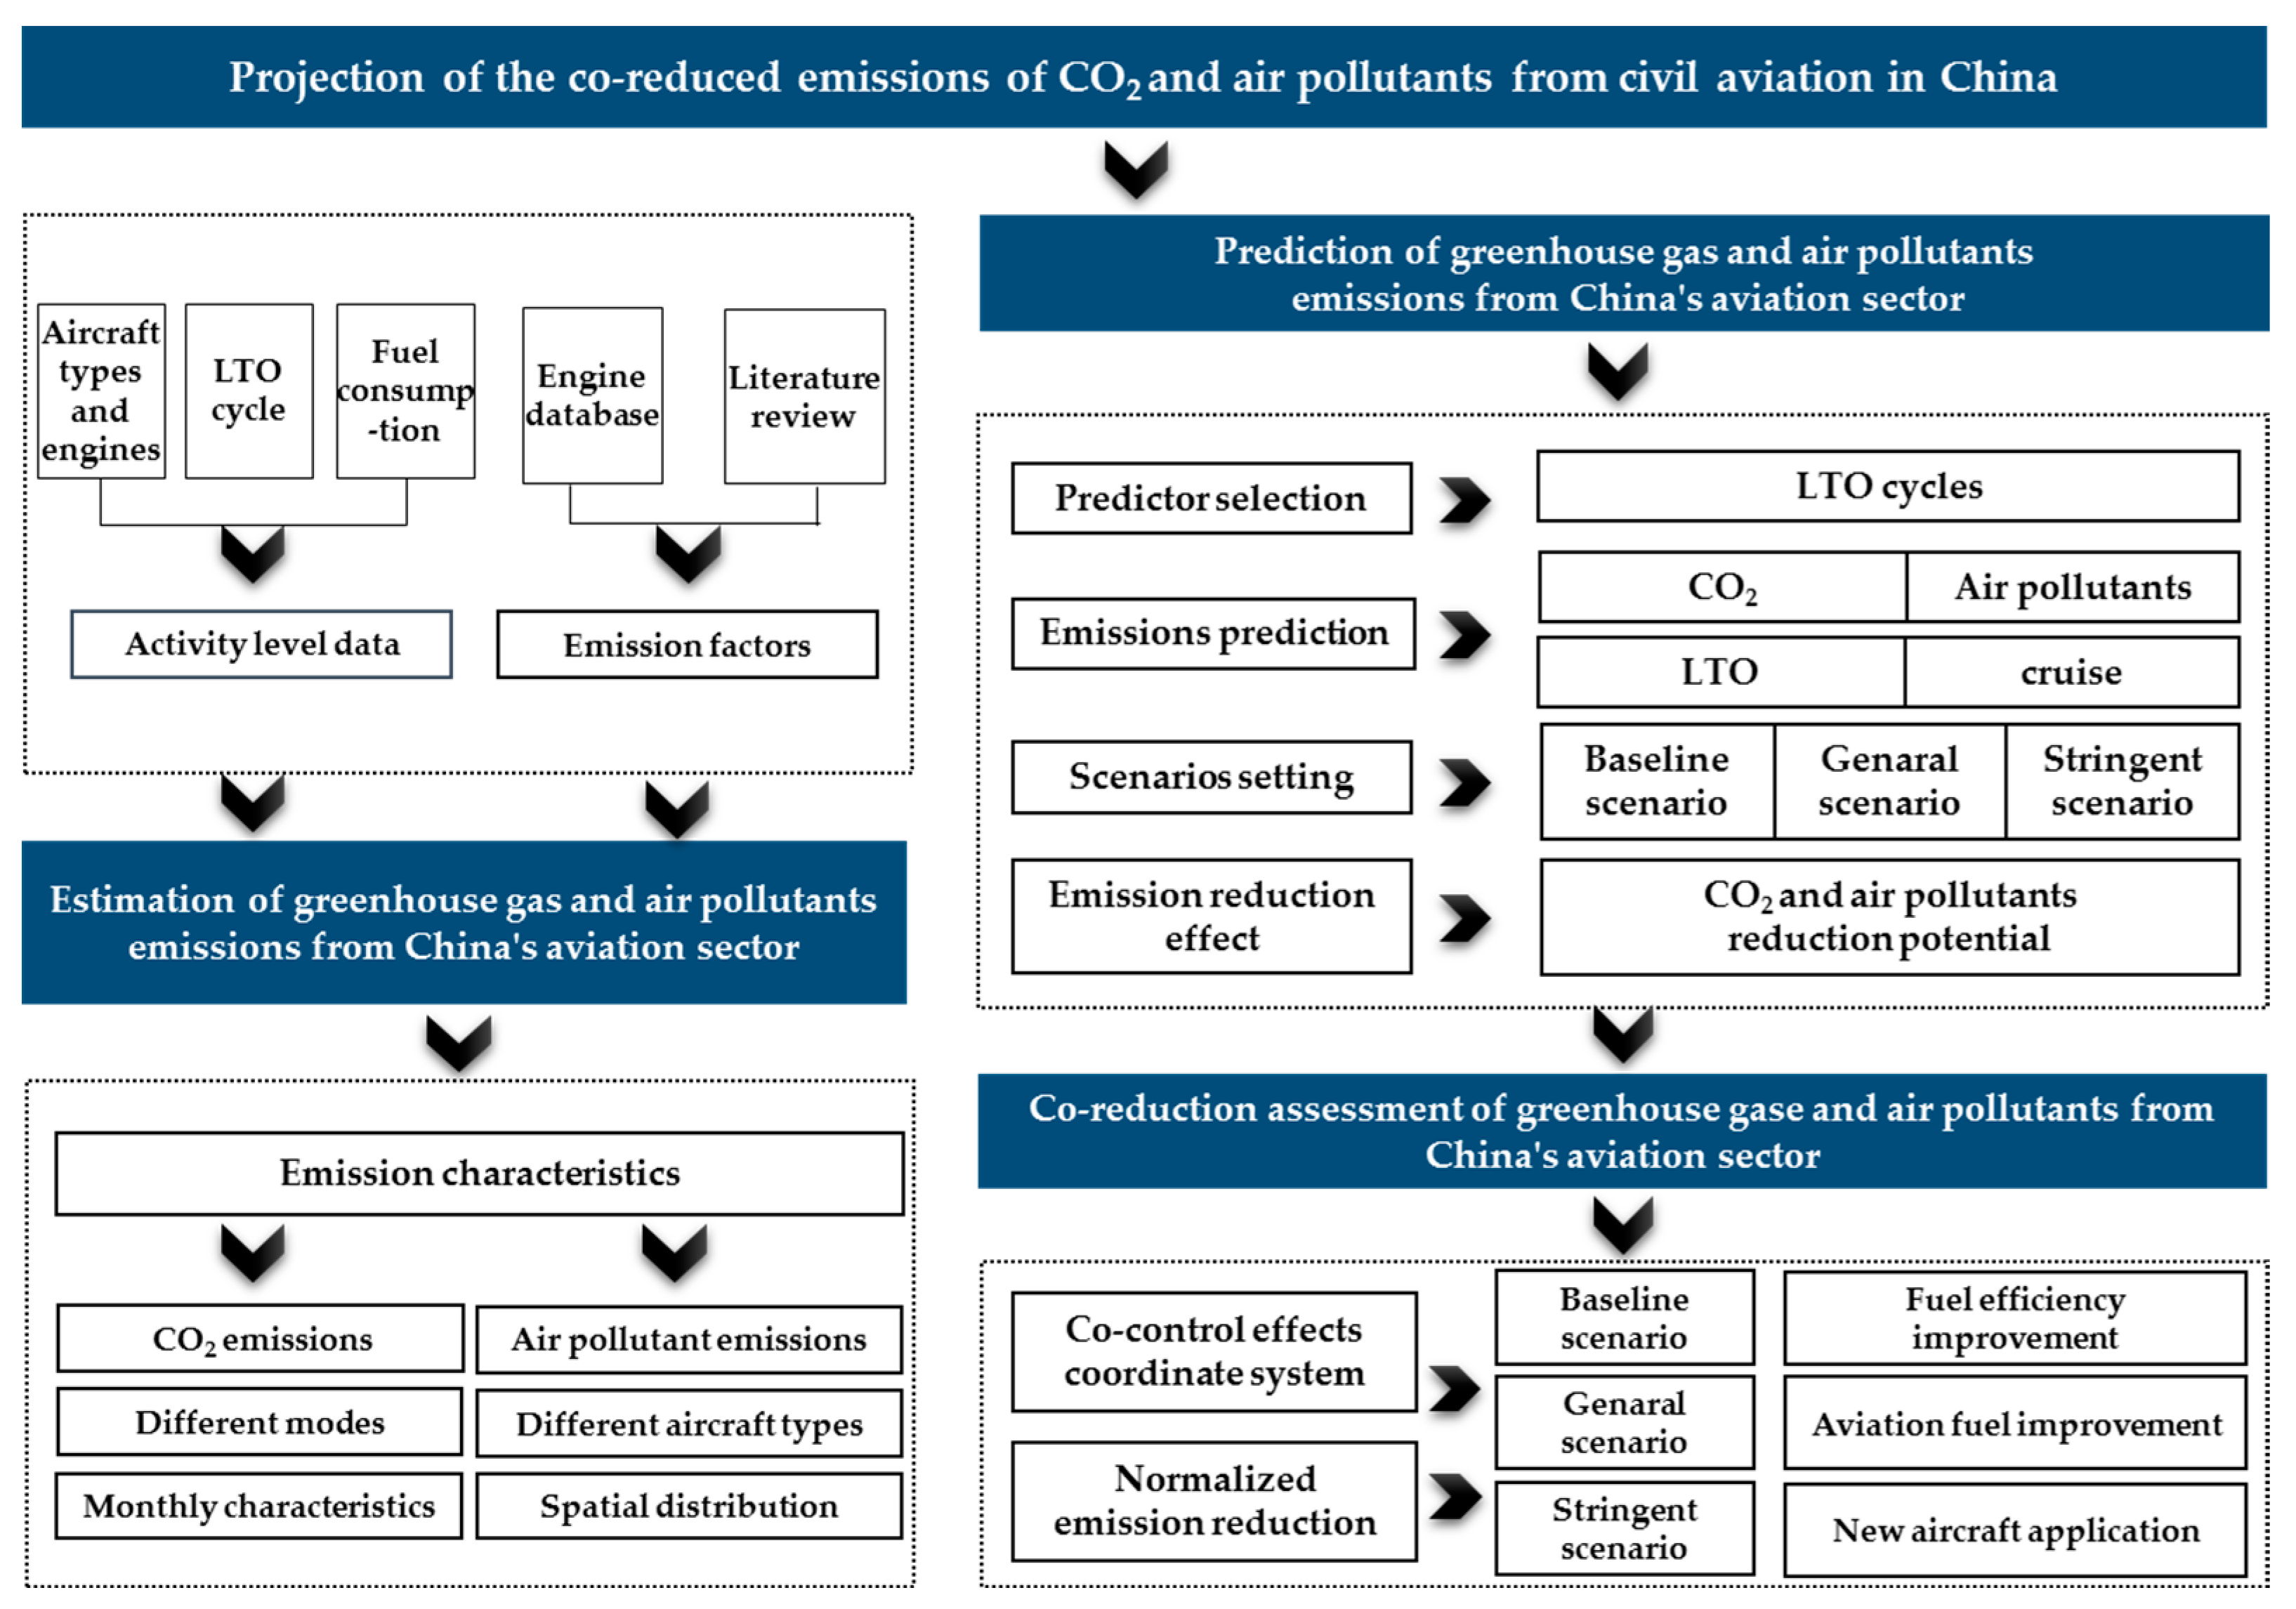
Figure 1. The flow chart of this study.
Sustainability 15 07082 g001
Figure 2. Percentage of aircraft types and engines of civil aviation in China in 2018. (a). Percentage of aircraft types of civil aviation in China in 2018. (b). Percentage of engines of civil aviation in China in 2018.
Sustainability 15 07082 g002
Figure 3. The LTO cycles and passenger throughput of civil aviation in China in 2018. (a). The LTO cycles of civil aviation in China in 2018. (b) Passenger throughout of civil aviation in China in 2018.
Sustainability 15 07082 g003
Figure 4. The co-control effects coordinate system.
Sustainability 15 07082 g004
Figure 5. Proportion of pollutant emissions under different modes of civil aviation in China in 2018. (a). Proportion of pollutant emissions under full route of civil aviation in China in 2018. (b). Proportion of pollutant emissions under LTO phase of civil aviation in China in 2018.
Sustainability 15 07082 g005
Figure 6. Proportion of pollutant emissions from different aircraft types in China’s civil aviation in 2018.
Sustainability 15 07082 g006
Figure 7. Characteristics of monthly average changes in pollutant emissions in China’s civil aviation in 2018.
Sustainability 15 07082 g007
Figure 8. Spatial distribution of pollutant emissions in China’s civil aviation in 2018.
Sustainability 15 07082 g008
Figure 9. The comparison between this study and other studies [17,18,28,50,56,57,58,59,60,61].
Sustainability 15 07082 g009
Figure 10. Projection of LTO cycles from civil aviation in China, 2019–2050.
Sustainability 15 07082 g010
Figure 11. Projection of CO2 and pollutant emissions from civil aviation in China, 2019–2050.
Sustainability 15 07082 g011
Figure 12. Prediction of air pollutant emissions from China’s civil aviation sector under different scenarios from 2018 to 2050.
Sustainability 15 07082 g012
Figure 13. CO2 peak target emissions reduction potential from civil aviation in China.
Sustainability 15 07082 g013
Figure 14. Reduction potential for each pollutant from civil aviation in China in 2050.
Sustainability 15 07082 g014aSustainability 15 07082 g014b
Figure 15. Co-reduced effect of CO2 and air pollutants under different scenarios and measures of China’s aviation sector in 2050 (A and B represent the general scenario and the stringent scenario, respectively; 1, 2 and 3 represent the three measures of fuel efficiency improvement, aviation fuel improvement and new aircraft application, respectively).
Sustainability 15 07082 g015aSustainability 15 07082 g015b
Figure 16. Pollutant and CO2 reduction equivalents under different scenarios and measures in China’s civil aviation (A and B refer to general scenario and stringent scenario, respectively; 1, 2 and 3 refer to the three measures of fuel efficiency improvement, aviation fuel improvement and new aircraft application, respectively).
Sustainability 15 07082 g016
Table 1. Average annual growth rate of LTO in China’s civil aviation in 2019–2050.
Year2019202020212022–20242025–20292030–20342035–20392040–2050
Average annual growth rate of RPK (%) a6.93.783.783.786.225.715.42
Average annual growth rate of LTO (%)5−223.74.486.445.95.685.8
a Data source: ADR. “Annual Report on China Civil Aircraft Market Forecast 2020~2039”.
Table 2. Emissions of CO2 and air pollutants from China’s civil aviation in 2018 (10,000 tons).
CO2NOxSO2COPMHC
Emissions 11,723.3090.4714.3791.290.66
Table 3. CO2 and air pollutant emissions from China’s civil aviation under different scenarios in 2050 (10,000 tons).
ScenariosCO2NOxSO2COPMHC
Baseline scenario66,388.89254.3281.3938.417.012.84
General scenario19,447.2574.5023.8411.252.900.83
Stringent scenario4694.1635.9611.515.431.490.40
Disclaimer/Publisher’s Note: The statements, opinions and data contained in all publications are solely those of the individual author(s) and contributor(s) and not of MDPI and/or the editor(s). MDPI and/or the editor(s) disclaim responsibility for any injury to people or property resulting from any ideas, methods, instructions or products referred to in the content.