1. Introduction
With the increase in the scale of urban settlement, cities are expanding horizontally as well as vertically [
1,
2,
3,
4,
5], and compact cities have gradually become the strategic guideline for sustainable urban development, placing higher demands on urban planning and architectural design [
6]. Urban residential areas are a major component of urban construction land. According to the hierarchy of urban residential areas, dwellings are the basic units of neighborhood blocks, and neighborhood blocks are the basic component units of urban residential areas. In China, a neighborhood block normally has a site area of 2–4 hm
2, with a total of 300–1000 dwellings [
7].
Because of the preference of people for living along waterways, riverfront neighborhood blocks in compact cities tend to be populated with high densities of residents [
8]. Natural water features can regulate the order of the urban form, while the visual interaction with natural water features can enhance residents’ sense of well-being [
9,
10,
11,
12,
13]. Survey data show that epidemic diseases cause people to stay in their neighborhood blocks for long periods of time, which increases the demand for high-quality living environments in urban centers [
14,
15]. Wen et al. studied residential neighborhoods near lakes and rivers, and they showed that prices are significantly spatially sensitive, with higher prices closer to the waterfront [
16,
17]. As a result, elements such as natural water views, comfortable courtyard spaces, and a good urban image for residents become important indicators of the residential quality of riverfront neighborhood blocks.
The objective of this study was to achieve a perfect integration of the building-group form of a riverside neighborhood block and good residential river views using a scientific approach. Urban designers have the responsibility to balance the relationship between people, nature, and building groups [
18,
19]. The process of designing a residential neighborhood requires balancing subjective creative factors with external landscape conditions [
20]. At the horizontal level, the building-group form of a neighborhood block mainly refers to the location relation of the residential buildings on the construction site, which typically includes three layout patterns: parallel determinant, nonparallel determinant, and three-sided enclosure. At the vertical level, the building-group form is a combination of the building heights as variables. The combination of these two levels forms the image of the residential neighborhood within the urban block and the courtyard spaces within the neighborhood. Because access to ideal natural landscape resources is the desire of all residents, the scientific design strategy for riverside neighborhood blocks is a responsive process of the dynamic coordination between the building layout and the visible measurements of the river views of the residents [
21,
22].
The classical theory of urban aesthetics and the theory of space syntax can be used to evaluate the forms of the building groups of neighborhood blocks and can form clear conclusions [
23]. The building-group form should involve decent urban imagery, a comfortable spatial feel, rich spatial hierarchies, and spatial order relations. The classical theory of urban aesthetics is the system of integrated aesthetic perception theory that combines intuition and association, experience and science, and quality and quantity [
24,
25,
26]. For example, the aesthetics of the image formed by the building groups can be evaluated with the help of gestalt psychology [
27], the theory of natural fractals, and the shape information entropy of the skyline [
26]. The ratio of the height of the surrounding buildings to the width of the courtyard space can be used to express the perception of the space [
24]. The theory of space syntax was originally created to analyze the logical relationship between human behavior and architectural space, and it shows that the spatial configuration has an organizational effect that motivates people to move naturally [
28,
29]. Convex space analysis graphs using space syntax theory can be used to represent the spaces of courtyards in neighborhood blocks in which people are more integrated or isolated [
30,
31].
Although urban designers have paid much attention to the analysis of the residential river-view visibility in riverfront neighborhood blocks, it is difficult to find literature on the precise measurements of it. Many designers have chosen the geometric analysis of local 2D sections to demonstrate the visibility of river views based on intuitive experience [
22]. For example, architect Serge Salat suggested that “Buildings along a waterside are lower than behind buildings, and taller buildings could enjoy water views” [
32]. Obviously, these approaches can only help designers make crude one-sided judgments about the visibility of river views for occupants. In more accurate analysis methods, 3D virtual simulations are used for the landscape visibility experience, and these approaches are applicable to special landscape observation points, as well as to landscape visibility measurements for set tour routes [
33,
34]. However, the simulation of thousands of dwellings in a neighborhood leads to excessive modeling efforts and tedious point selection simulations. Therefore, it is difficult to obtain comprehensive per-house river visibility results using 3D simulation.
The concept of isovists originated from Gibson’s optical array experiments. An isovist is an informative representation of the visual perception of an object’s surface using visual light [
35,
36]. Essentially, an isovist is a collection of innumerable rays of light filling all visible surfaces emanating from a vantage point located in a 3D spatial environment [
37]. The 3D isovist structure is easy to understand but difficult to express and generate. Therefore, isovists are generally abstracted as 2D isovists, which intercept the 3D field of view to a 2D plane containing the initial viewpoint [
38,
39]. Indeed, 2D isovists cannot represent the real visual environment, which has thus necessitated studies on 3D isovist representation [
40], which mainly include the analysis of the spatial openness using the spherical view intersected with cubes that are filled with space [
41], the use of digital elevation models to express the building blocks and topography to form 3D isovists [
42,
43], and analysis methods to transform urban environments into 3D voxels [
44]. However, in all of these methods, it is difficult to achieve the desired representation results and computational accuracy [
45,
46].
With the increasing arithmetic power of computers and the intervention of parametric modeling methods in 3D modeling software, the 3D isovist method for visibility measurement has been enhanced by using 3D modeling software and its parametric plugins. Bhatia et al. used Sketchup and Ruby plugins to generate a 3D isovist, and they applied it to calculate architectural visibility data for interior spaces [
47]. The 3D isovist generated with the help of 3D modeling software and auxiliary plugins is itself a 3D geometric structure that is composed of a certain density of lines of sight. In this way, the structure can perform Boolean operations with 3D geometric surfaces to obtain the visibility measurements of geometric objects. This 3D isovist approach overcomes the problem of the digital elevation model, which cannot express multiple Z-values, and it is also more computationally efficient and accurate than the method of using 3D voxels. Hence, it has received some generalizations and further developments. Currently, this method of generating line-of-sight structures has shifted more to the 3D isovists generated by the Rhinoceros and Grasshopper 3D software platforms and by running parametric dynamic programming in Grasshopper [
48,
49].
Most 3D-isovist-based representations of landscape visibility are expressed by accumulating the sum of the lengths of the lines of sight from which the target object can be seen [
47,
48,
50]. This approach considers that the cumulative sum of the line-of-sight lengths is approximately equal to the visible volume of the landscape object viewed from the viewpoint, and it can thus be used to express the visibility quality of the landscape at the viewpoint location. However, there are some difficulties in calculating the visibility quality of the river views of individual dwellings. The computational effort involved in obtaining views of the river from the exterior walls of all dwellings is too great. In addition, the angle between the line of sight and the water surface is small from the point of view of an inhabitant; thus, the method of accumulating the lines of sight has a large error. Therefore, the determination of the vantage points for generating 3D isovists was difficult in this study. Thus, we formulated a virtual River Surface Curve (RSC) and established a new quantitative expression for the visibility of a residential river view.
In this paper, we developed a novel 3D isovist measurement method to match the river-view-visibility measurements of riverfront dwellers, and we applied parametric design thinking to achieve a good integration of the building-group morphology and ideal river view for each dwelling. On the Rhinoceros 3D software platform, Grasshopper can be used to summarize two types of data information: (1) information data on 3D geometric models of the surrounding environment and residential buildings, including reference, scale, and location information for each geometric model; and (2) a line-of-sight set of 3D isovists generated at the location of the vantage point, which includes the data information on the full line-of-sight structure. In this way, the measurement process of the occupancy river-view visibility is a filtering process that corresponds to both types of data. These conditions lead to an optimized building layout design idea, a combination of traditional classical urban design methods, a dynamic building-by-building layout process, and an iterative analysis of multiple sets of 3D isovist line-of-sight data.
2. Materials and Methods
The river-view visibility of a dwelling includes the width of the visible river-view field and the distribution on the exterior walls of the dwelling’s river-view points. We used Grasshopper software for dynamic programming in the Rhinoceros 3D model environment to generate 3D isovists, and to measure the river-view visibilities of all households in a neighborhood block. A 3D isovist is a graphical representation of all of the visible information of a point of view. First, an RSC hypothesis is proposed to express the width of the river field of view. Then, components such as 3D isovists and Data Recorder are run to measure and record the visible data. Third, all of the data are classified and filtered. Finally, the building layout of the neighborhood block is evaluated, analyzed, and adjusted based on the river-view-visibility results (
Figure 1).
2.1. Initial Building Layout Scheme of Actual Riverfront Neighborhood Block
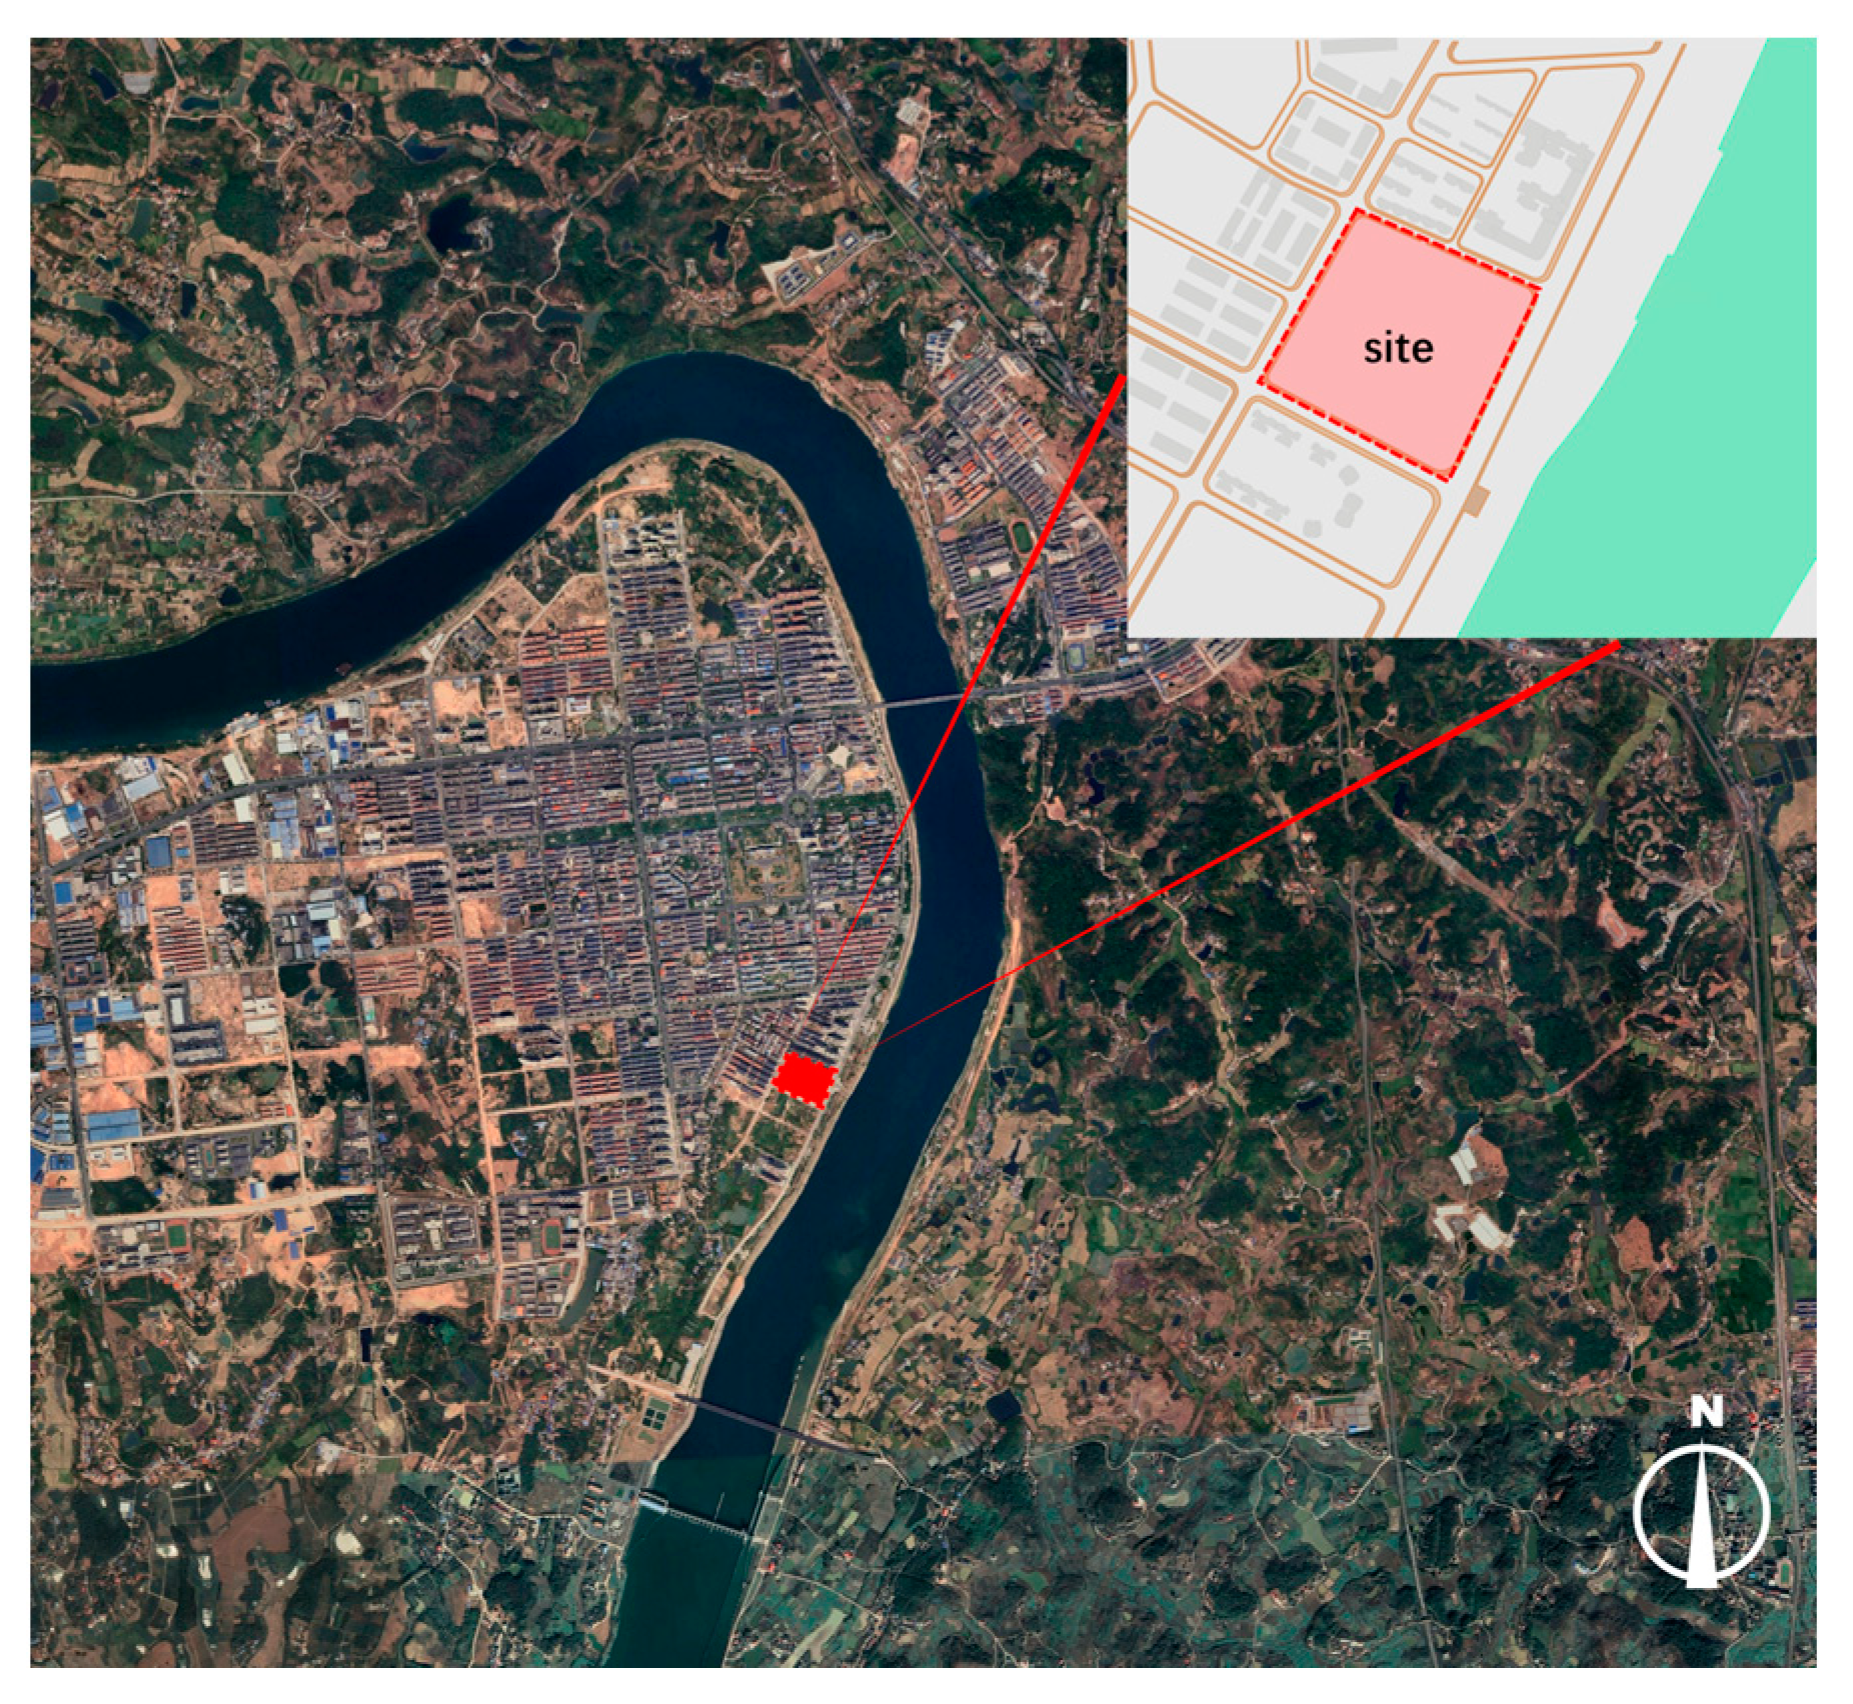
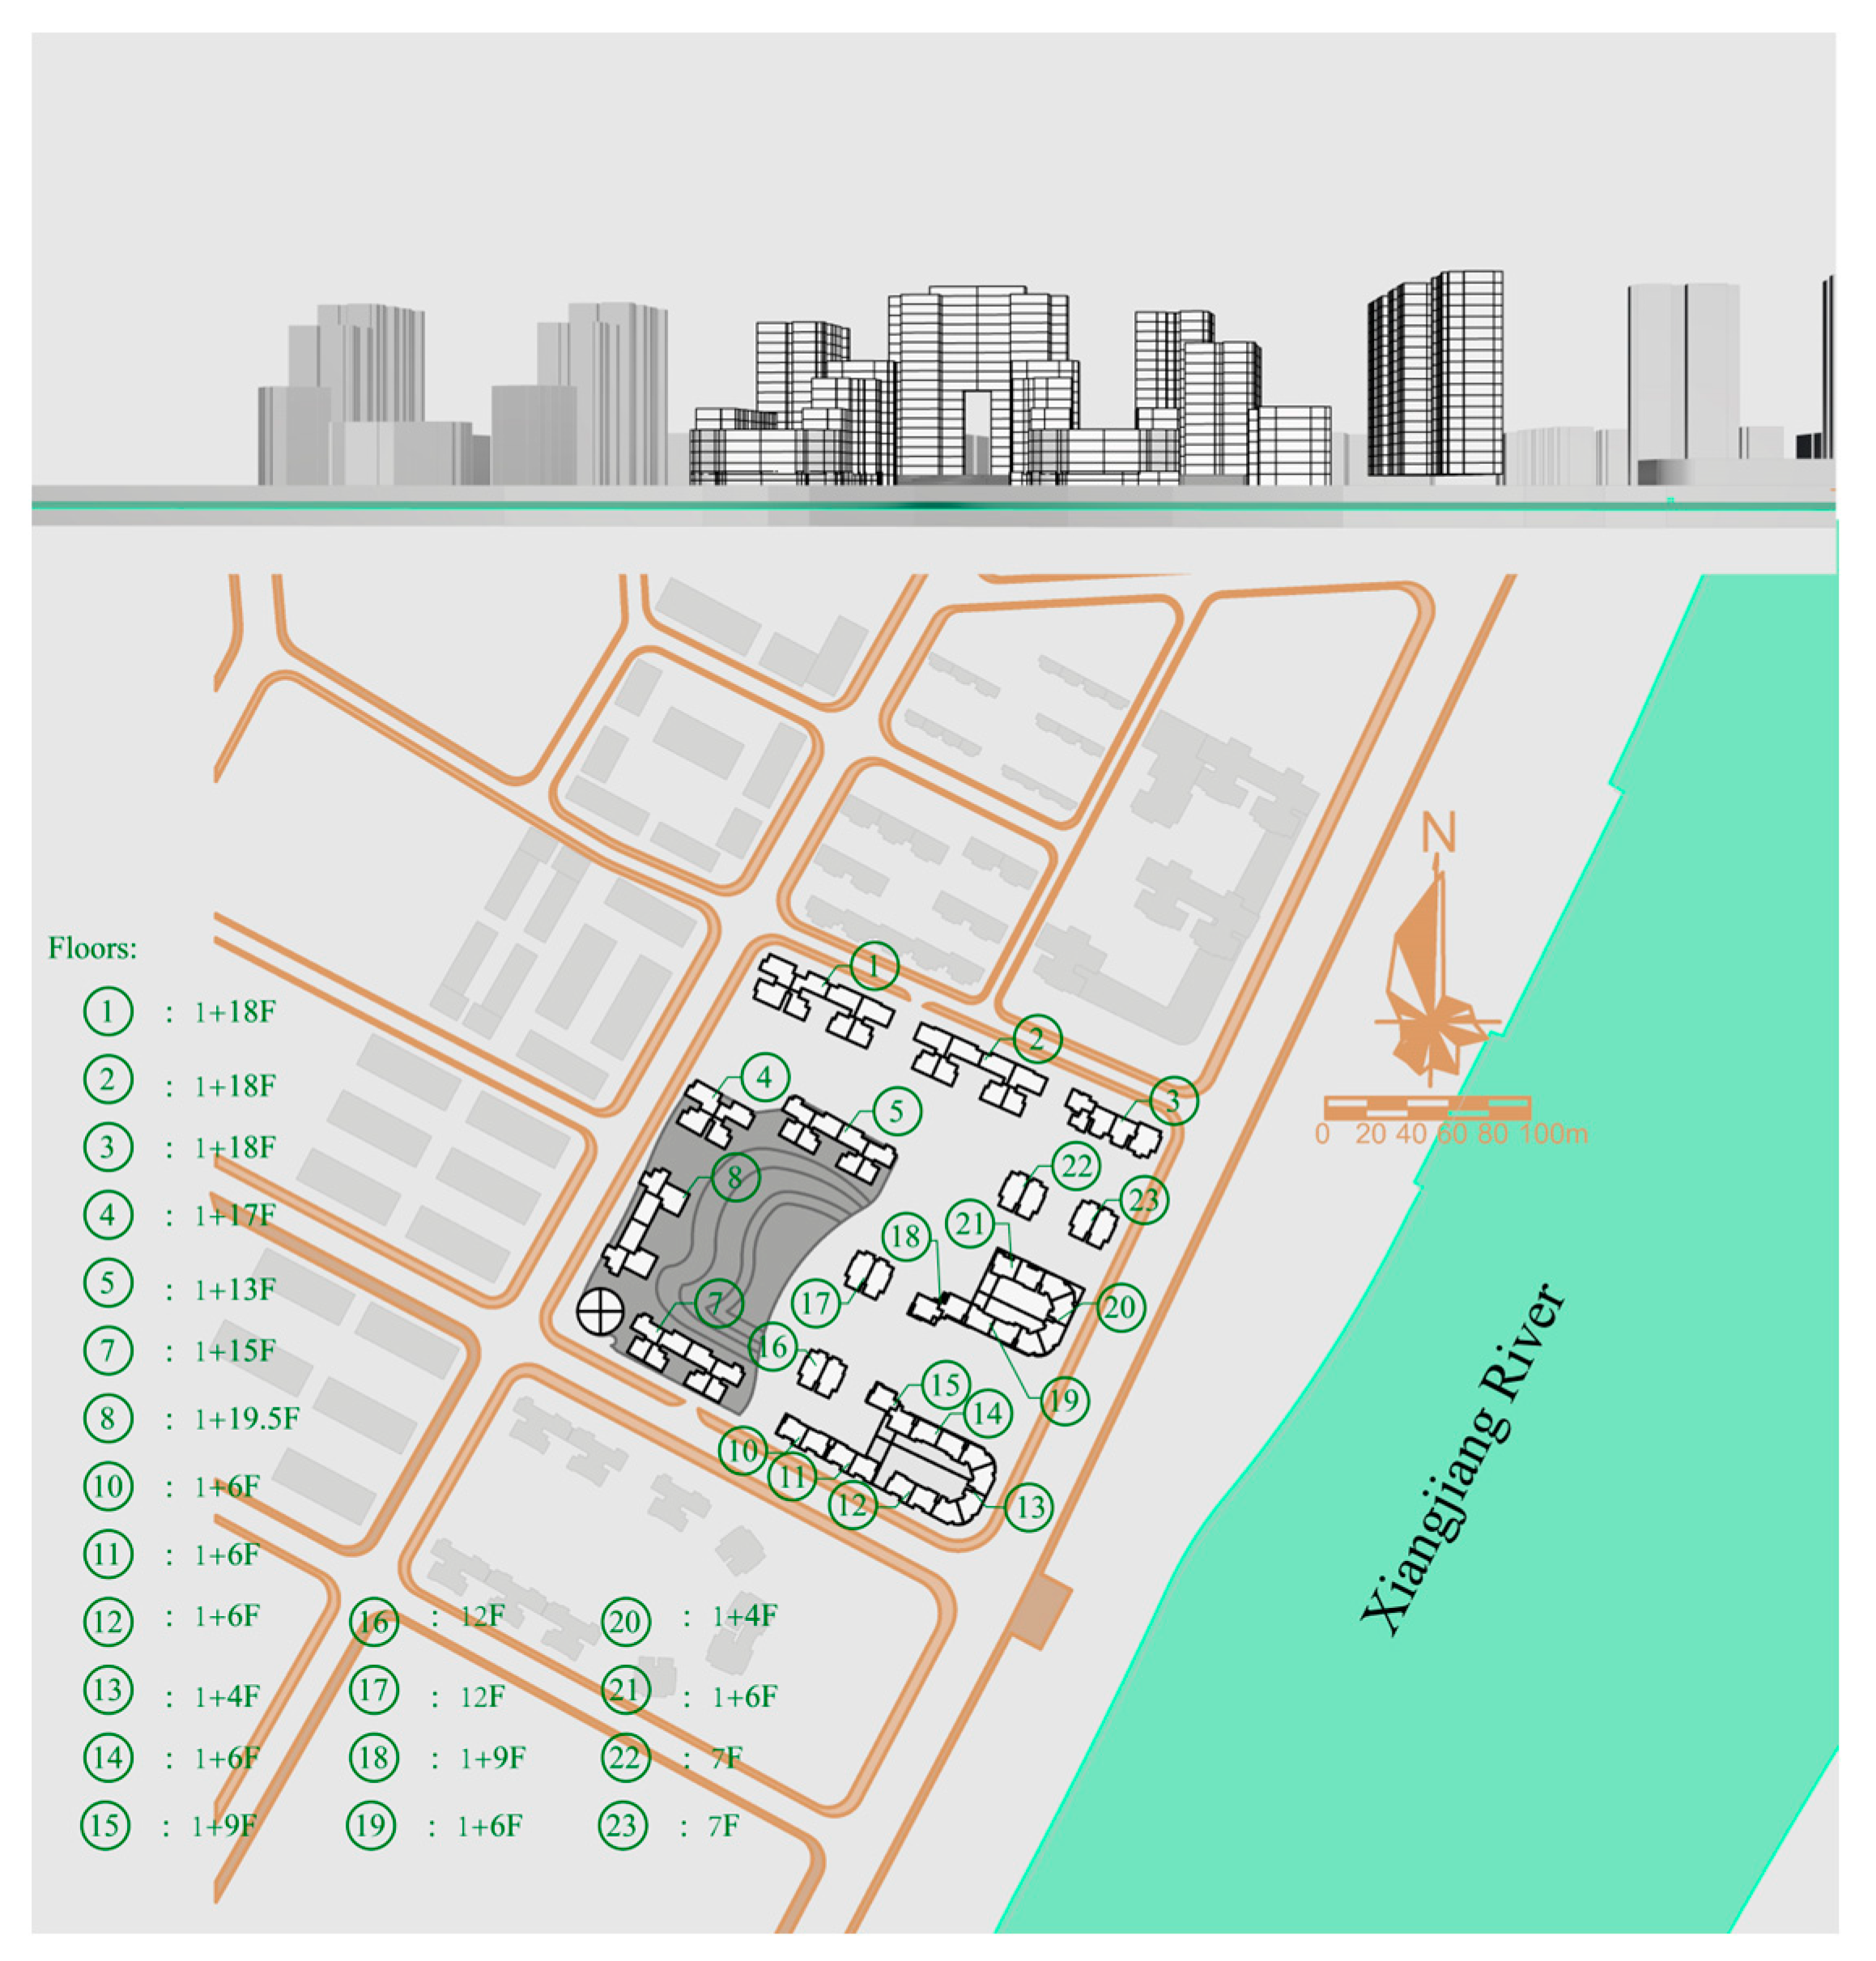
The case study was selected in the riverside urban area of Hengnan County, Hunan Province, China, where the Xiangjiang River, with a river width of over 300 m, passes through the urban area, and with a resident population of 212,906 in the 8.9 km
2 urban area east of the Xiangjiang River. The area is a high-density mixed high-rise and multistory building group with a population density of 239 people/hm
2, which is typical of new compact urban areas, according to the United Nations population index for the Habitat [
6,
51]. The selected sample neighborhood block is located on the southeast side of the city, west of the Xiangjiang River, and the remaining three directions are urban commercial and residential areas, with relatively flat square lots with an effective land area of 5.28 hm
2 (
Figure 2).
The planning index for the site is a proposed mix of residential and commercial buildings, with a total floor area of approximately 150,000 m
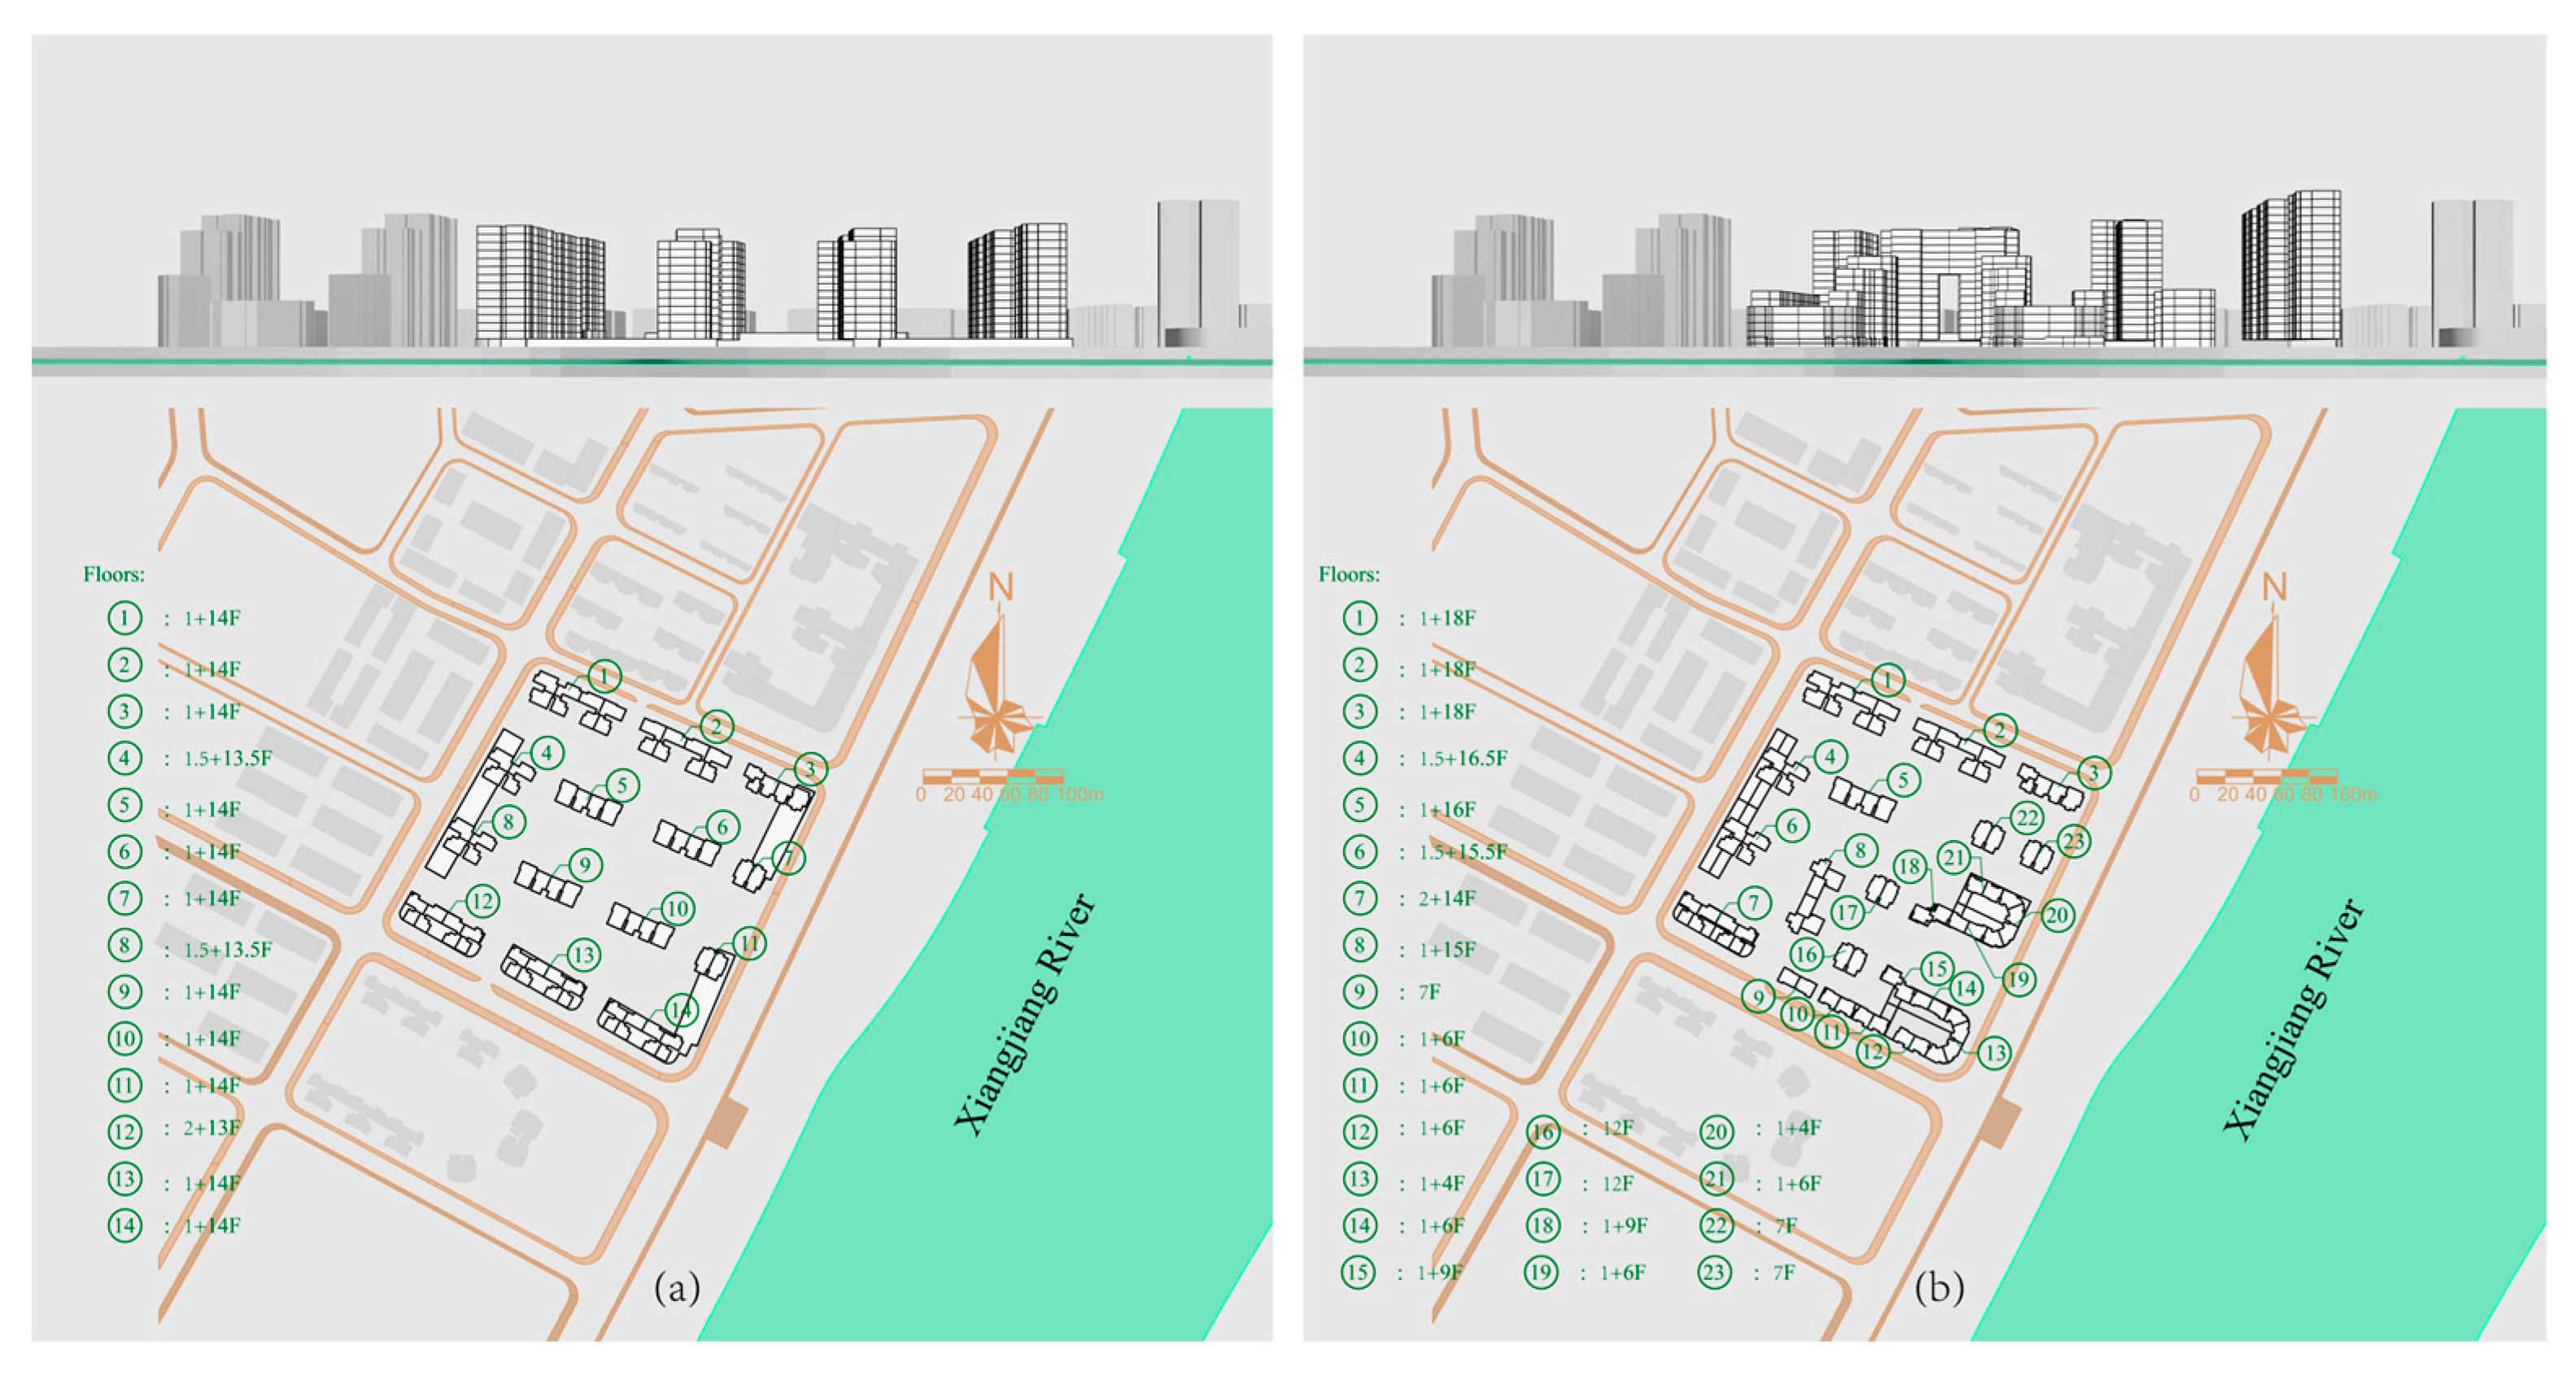
2 and a building height limit of 60 m, which is planned to accommodate 1002 dwellings. Two initial schemes (
Figure 3) with obvious differences in the combinations of building groups were laid out, each with a total number of 1002 dwellings. Scheme 1 (
Figure 3a) is the simple layout form, and Scheme 2 (
Figure 3b) is the complex layout form.
In terms of urban neighborhood image, Scheme 2 is better than Scheme 1. Scheme 1 has the same building heights, the skyline formed by the building silhouettes is relatively monolithic, and the overall image is not highly recognizable. Scheme 2 has an undulating skyline, which adds to the permeability of the urban space, and the combined forms of the building groups have a more pronounced imageability.
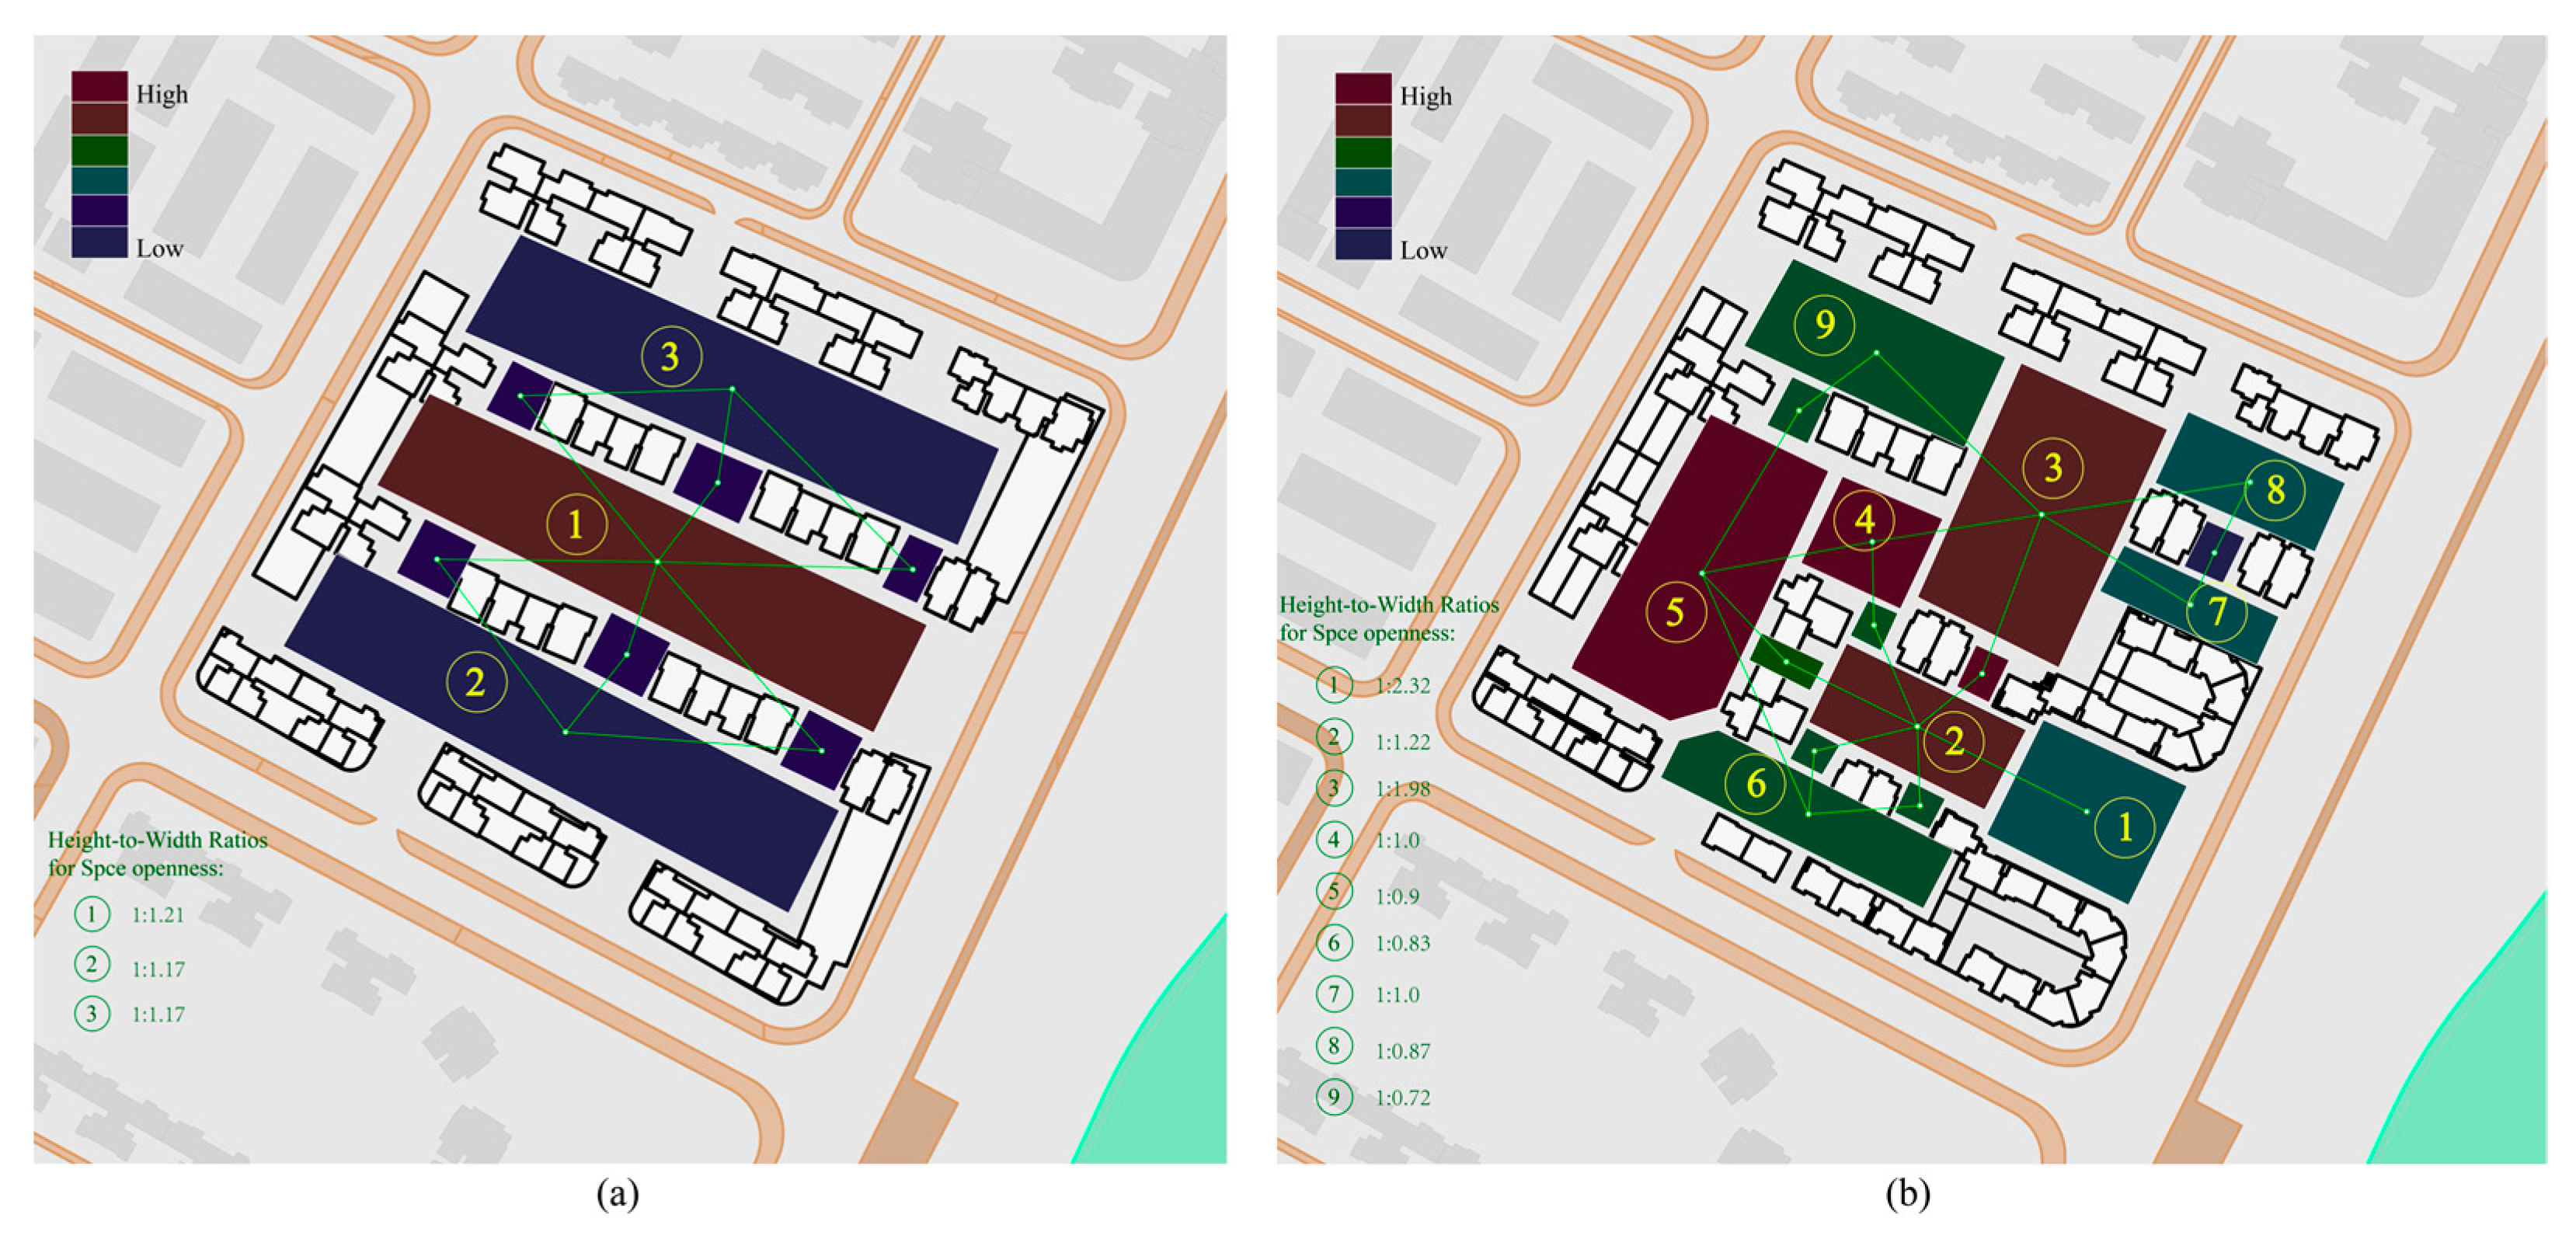
The spatial openness and integration degree are used to express the morphological characteristics of each courtyard space in the neighborhood block (
Figure 4). The height-to-width ratios of the courtyard spaces are used to express the spatial openness, where the width is the average of the short-side distances of the courtyard space, and the height is the average of the combined heights of the buildings surrounding the space. Referring to the spatial openness index of Sitte and Cullen [
23,
24,
25,
52], the intervals are defined as follows:
1:0.5–1:0.7: claustrophobic space;
1:0.7–1:1: closed space;
1:1–1.5: semi-open space;
1:1.5–1:2: open space;
1:2–1:2.5: full-open space.
The numbering of each courtyard space and its openness in both schemes are indicated in
Figure 4. The analytical results show that Scheme 2 has a richer type of courtyard space compared with that Scheme 1. The space syntax principle was applied to analyze the spatial connection of each courtyard space within the neighborhood block and to determine the integration and isolation characteristics of the space [
29,
30]. With the help of DepthmapX software [
53], a convex spatial analysis map was used to calculate the integration degree of the individual courtyard and contact spaces [
54] and to compare the courtyard space relationships within the clusters of the two schemes. A total of six colors, ranging from warm to cold, are used in
Figure 4 to represent the integration of the spatial nodes in the graphical spatial analysis graph. The comprehensive comparison results (
Table 1) show that Scheme 2 has more spatial hierarchy types compared with Scheme 1, and it has more connection and penetration relationships between spaces. Therefore, the combinatorial form of the building group in Scheme 2 is better than that in Scheme 1.
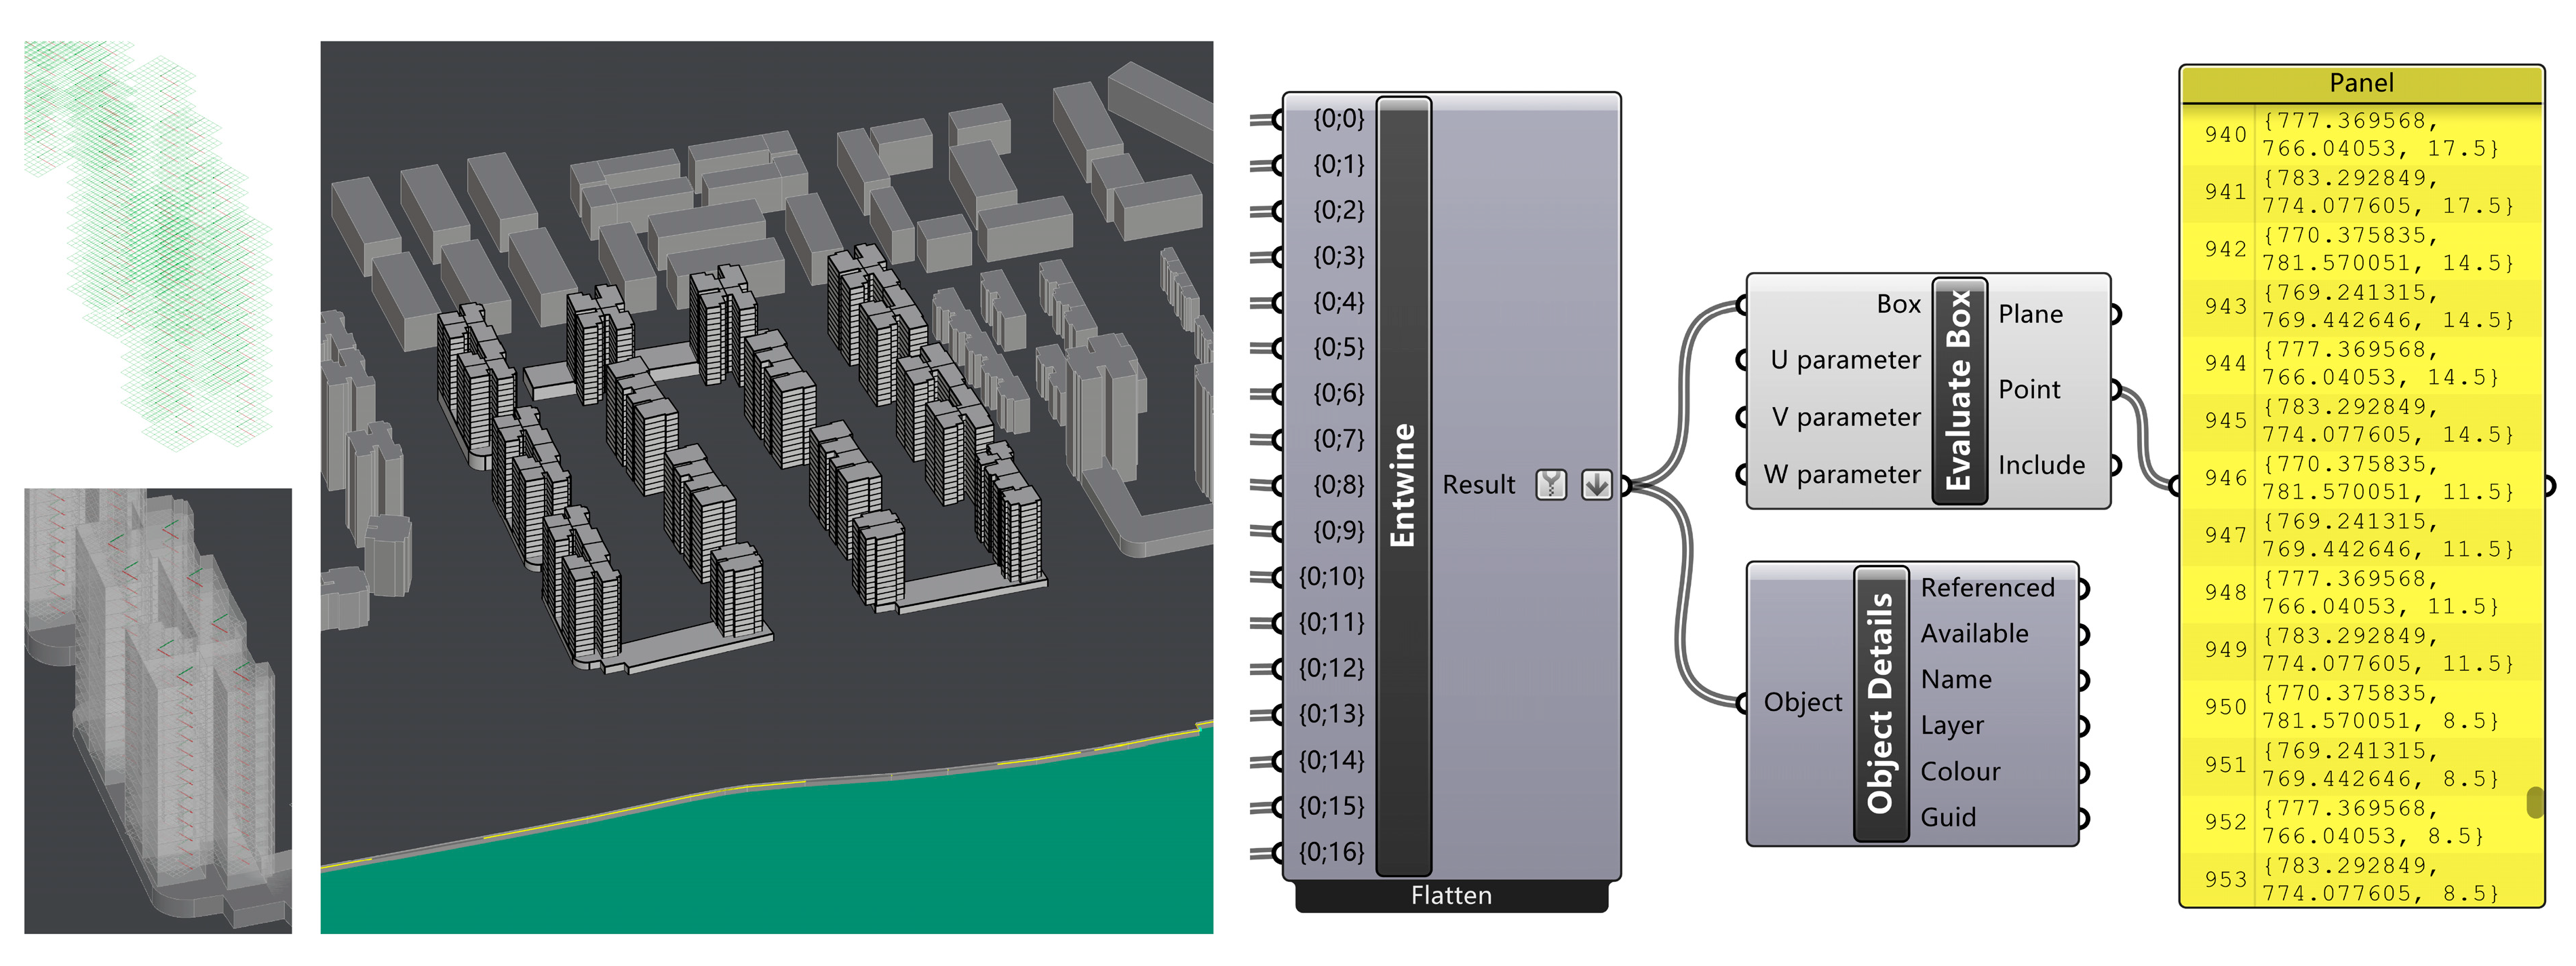
The first task of the residential river-view analysis was the 3D modeling of the residential group and its surroundings on the platform of Rhinoceros 3D modeling software and Grasshopper dynamic programming software. The dwellings are the most basic unit of the residential group, and a geometry model (Breps) of each dwelling should be created for residential buildings. The surrounding-environment model includes the surrounding buildings, ground, river, shoreline, etc. Because the site selected for the study was relatively flat, the topographic height difference was ignored in the ground model, and the elevation of the Xiangjiang River is 2.9 m below the surface. In addition, the first floors of the residential buildings are stores or elevated, and the effect of plants on the river views was neglected to simplify the analytical model. Various types of geometric models were grouped in the Grasshopper platform, and the data of each geometric model, such as the layers, serial numbers, names, etc., were recorded in the groups. The occupants were spatially positioned using their geometric centers, and the “Evaluate Box” component was run to record the geometric-center coordinates of each geometry (
Figure 5).
2.2. Generation of 3D Isovists
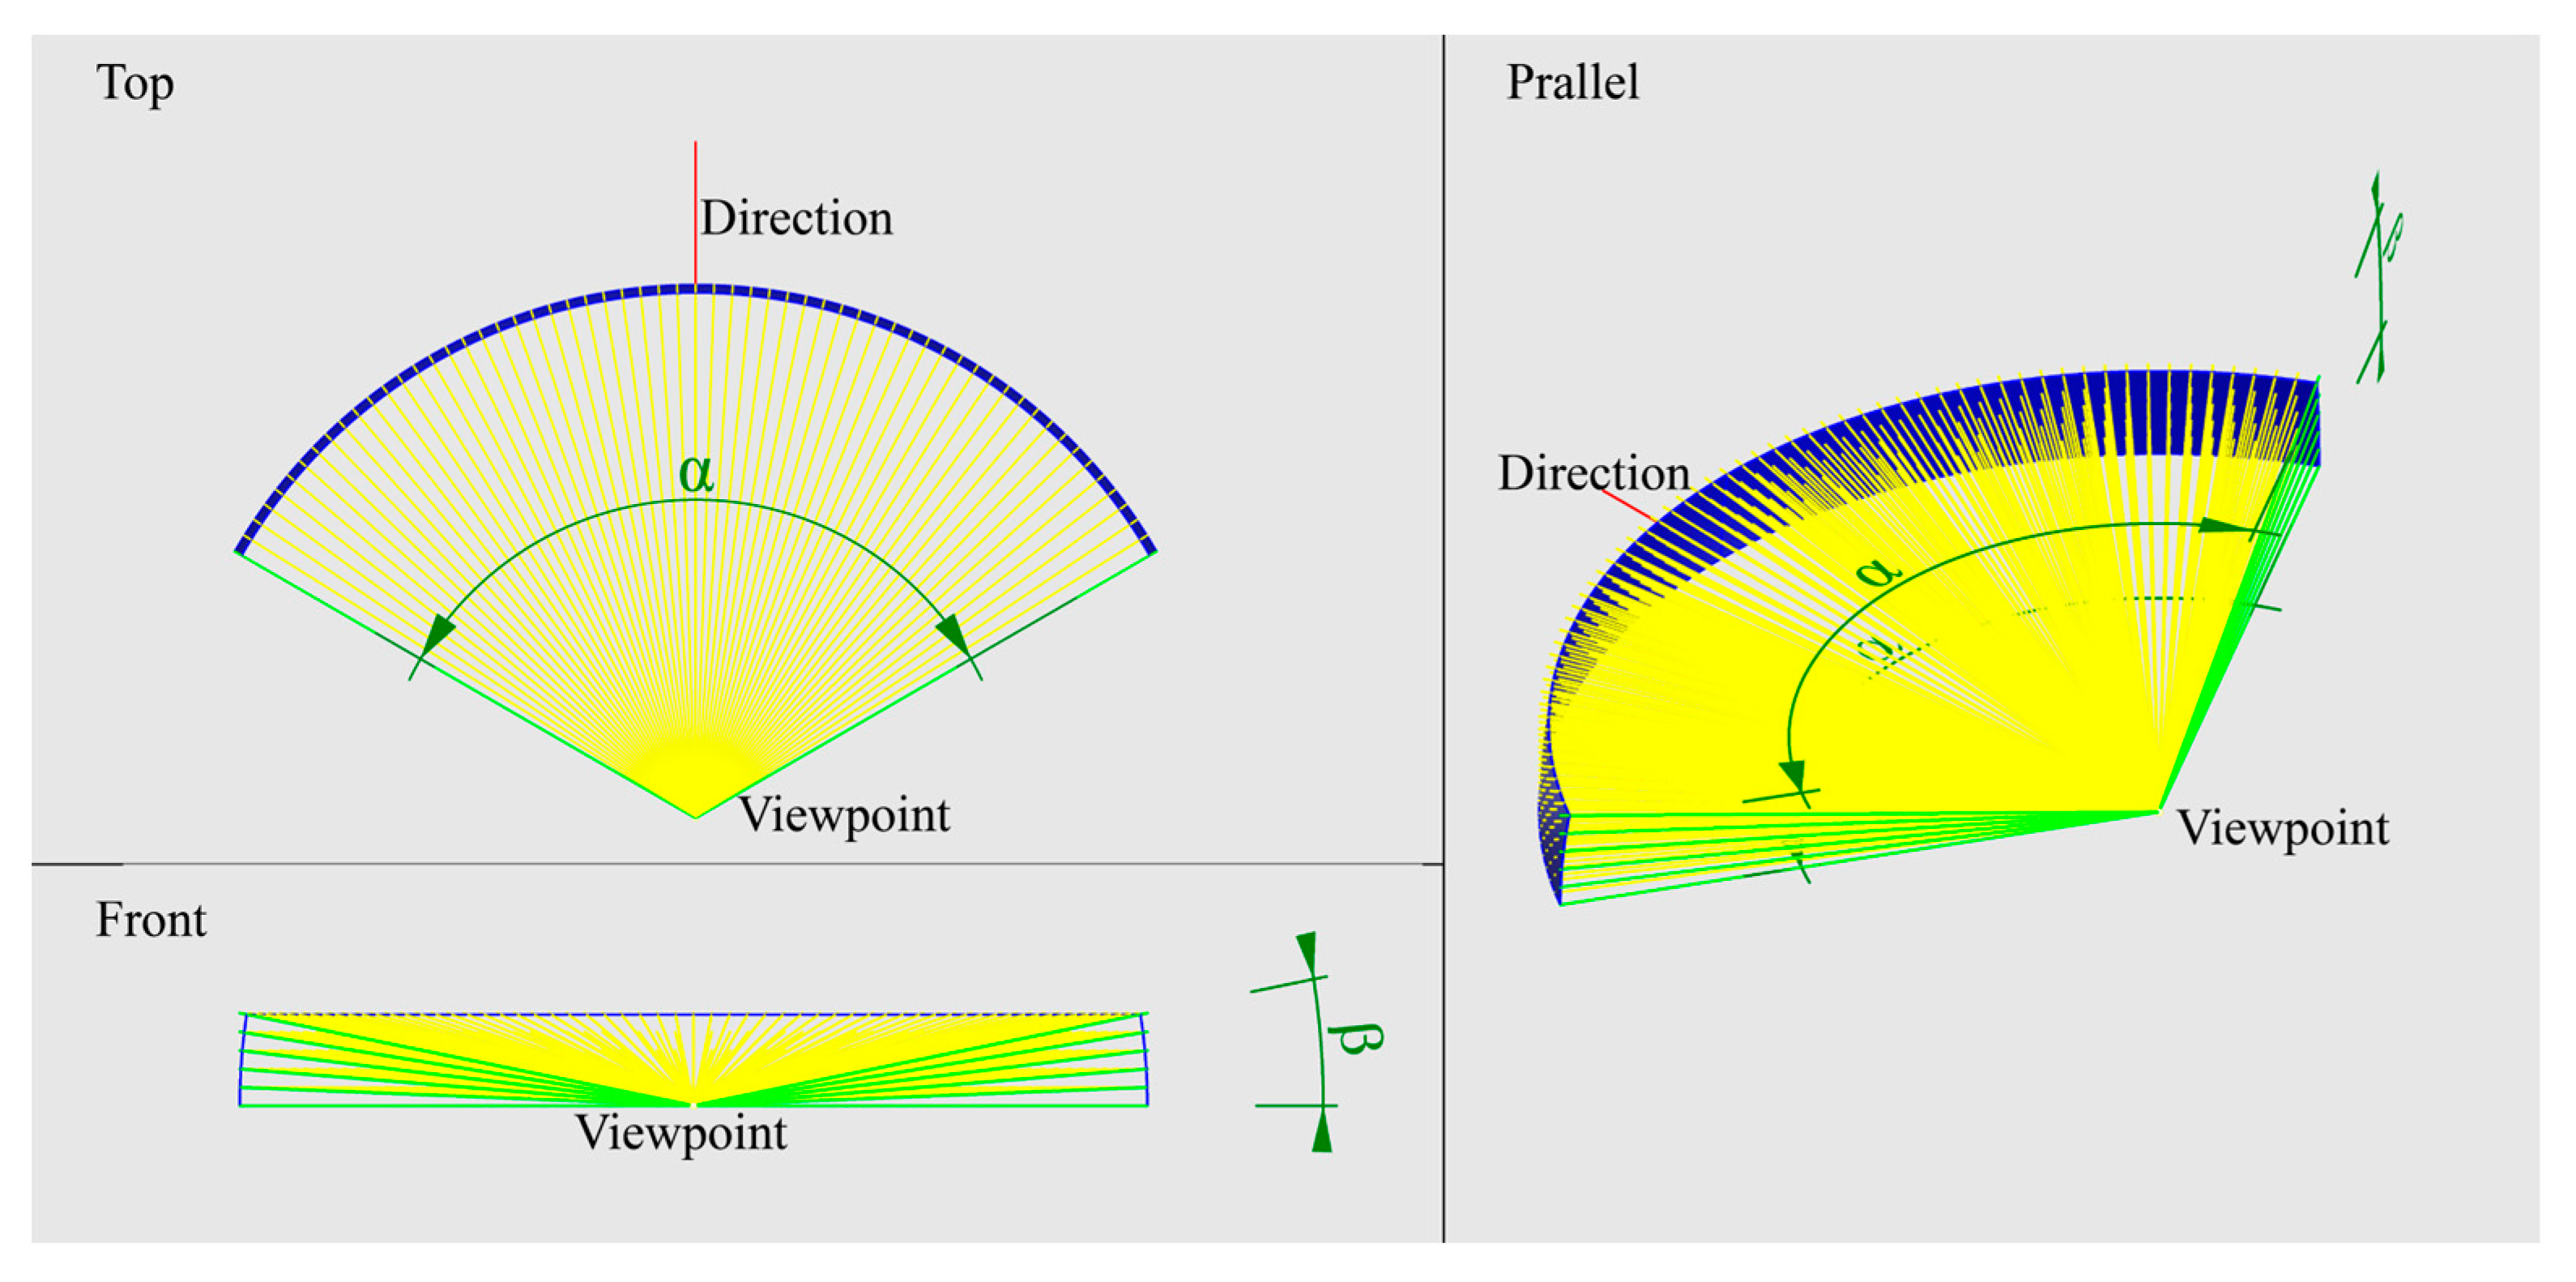
A 3D isovist is a collection of lines of sight that is generated by the 3D software Rhinoceros and Grasshopper, and that expresses the 3D information of a field of view through the structure of the lines of sight (
Figure 6), all of which originate from the point of view (the observer’s eye). Provided there is no line-of-sight occlusion, and assuming one has a finite line-of-sight distance, the end of the line of sight should fall on a sphere of radius equal to the line of sight. The 3D isovist in the unobstructed state is a spherical cone, and we define this spherical cone as the full free field of view.
The Boolean operation of the line-of-sight set with 3D Breps can determine whether the viewpoint is visible to the target object. When a line of sight does not fall on any geometry, the end of the line of sight is the sky that is visible from the viewpoint. When a line of sight falls on the surface of a geometry, it is determined that the geometry is an object that can be seen from the viewpoint.
The 3D software can only simulate the dispersion of light from one source using as many lines of sight as possible [
35,
36,
50]. The determination of the visibility of a target at the viewpoint position is related to the density of the generated lines of sight. The visible target is missed when the target is between the line-of-sight slits. Thus, a higher density of the generated lines of sight implies a more accurate measurement result. That is, the density of the lines of sight is a 3D isovist precision metric. Let the horizontal view of a 3D isovist be
α and the vertical view be
β. If 1° is divided into
q segments, then we have the following:
where
Tlos is the total lines of sight;
α is the horizontal angle of view (the unit is deg);
β is the vertical angle of view (the unit is deg);
q is a positive rational number.
For a cross-section with a vertical viewing angle embodied as a 2D sector, let β = 10°. If every 1° is divided into four equal segments, then the number of lines of sight of a 2D sector is 4 × 10 + 1 = 41. When the sight distance is 5000 m, the calculation shows that the distance between the ends of two sight lines is 21.8 m, which indicates that a cube with a side length of 20 m may be missed when it is close to 5000 m from the viewpoint, even if the target is within the visual field. The 3D isovist module converts the separation of 1° into the separation number of a whole circle (i.e., the integer value of 360 × q is used to express the setting precision). The line-of-sight structure generated by the 3D isovist component operation contains the following data:
All lines of sight take the isovist vantage point as their starting point;
Each line of sight is a geometry in three dimensions; that is, it contains the reference number and length;
The correspondence between the line-of-sight endpoint and the reference number of the visible object can be recorded.
2.3. Hypotheses of RSC
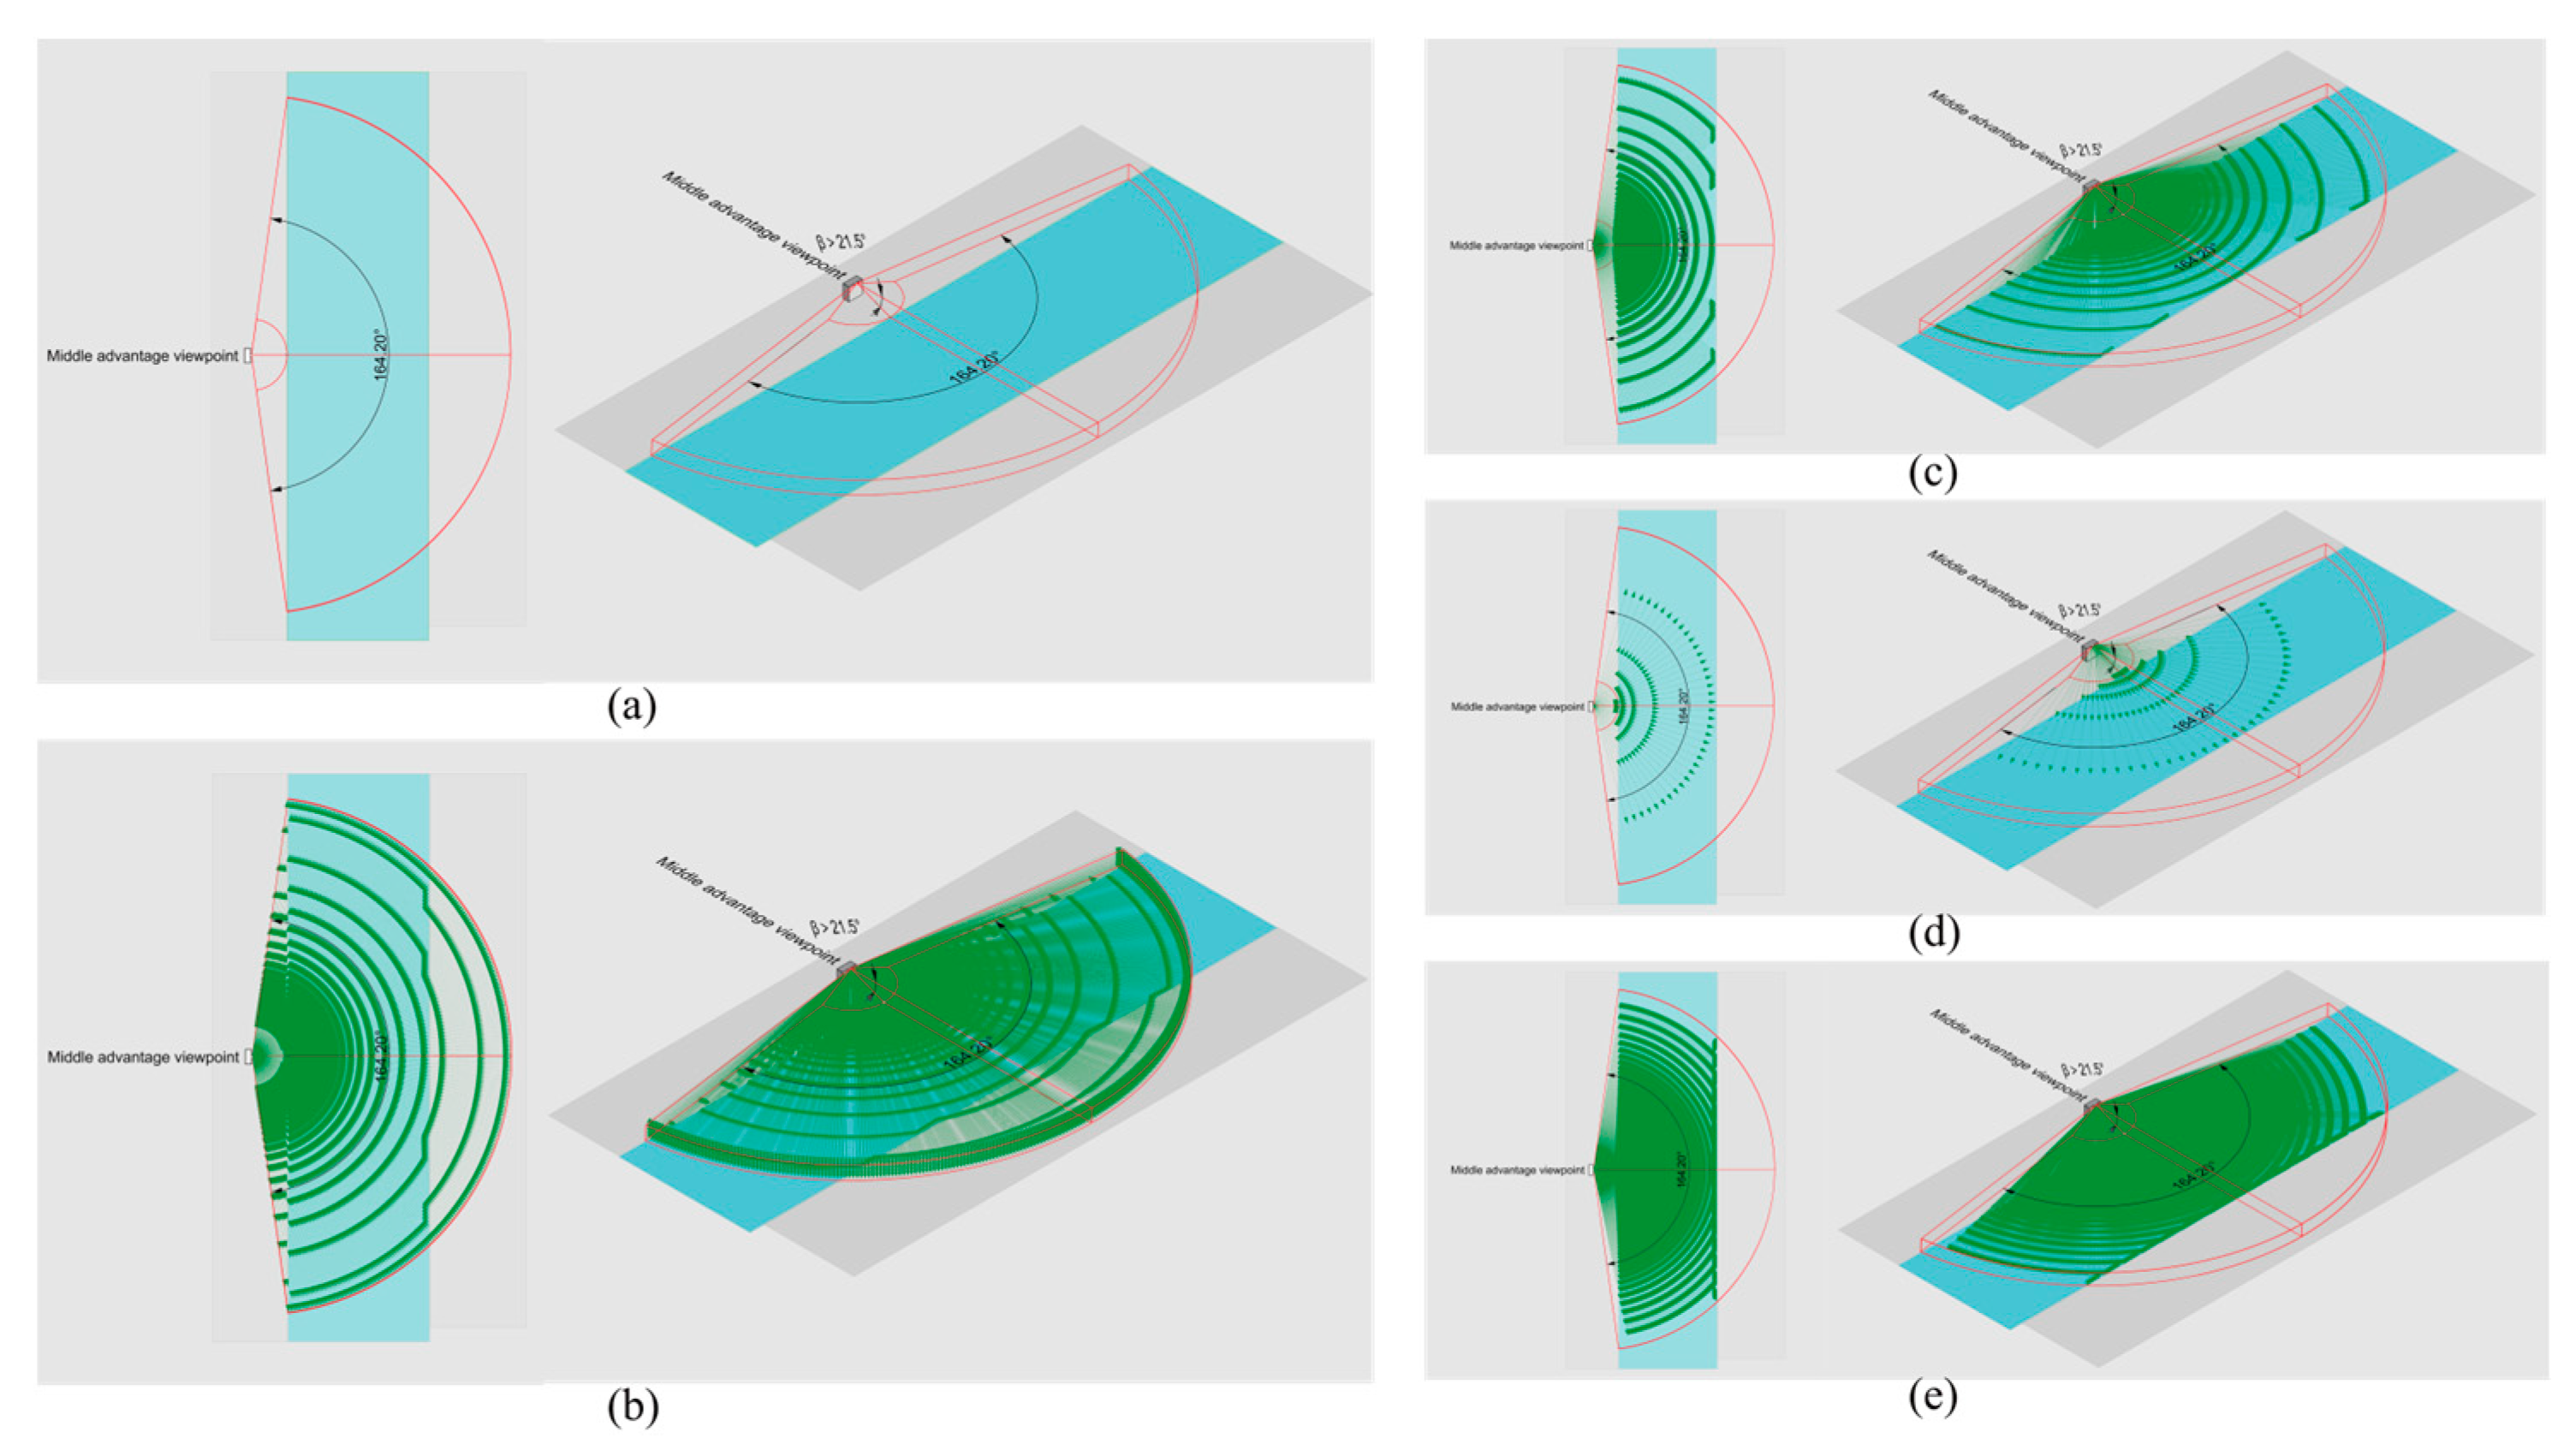
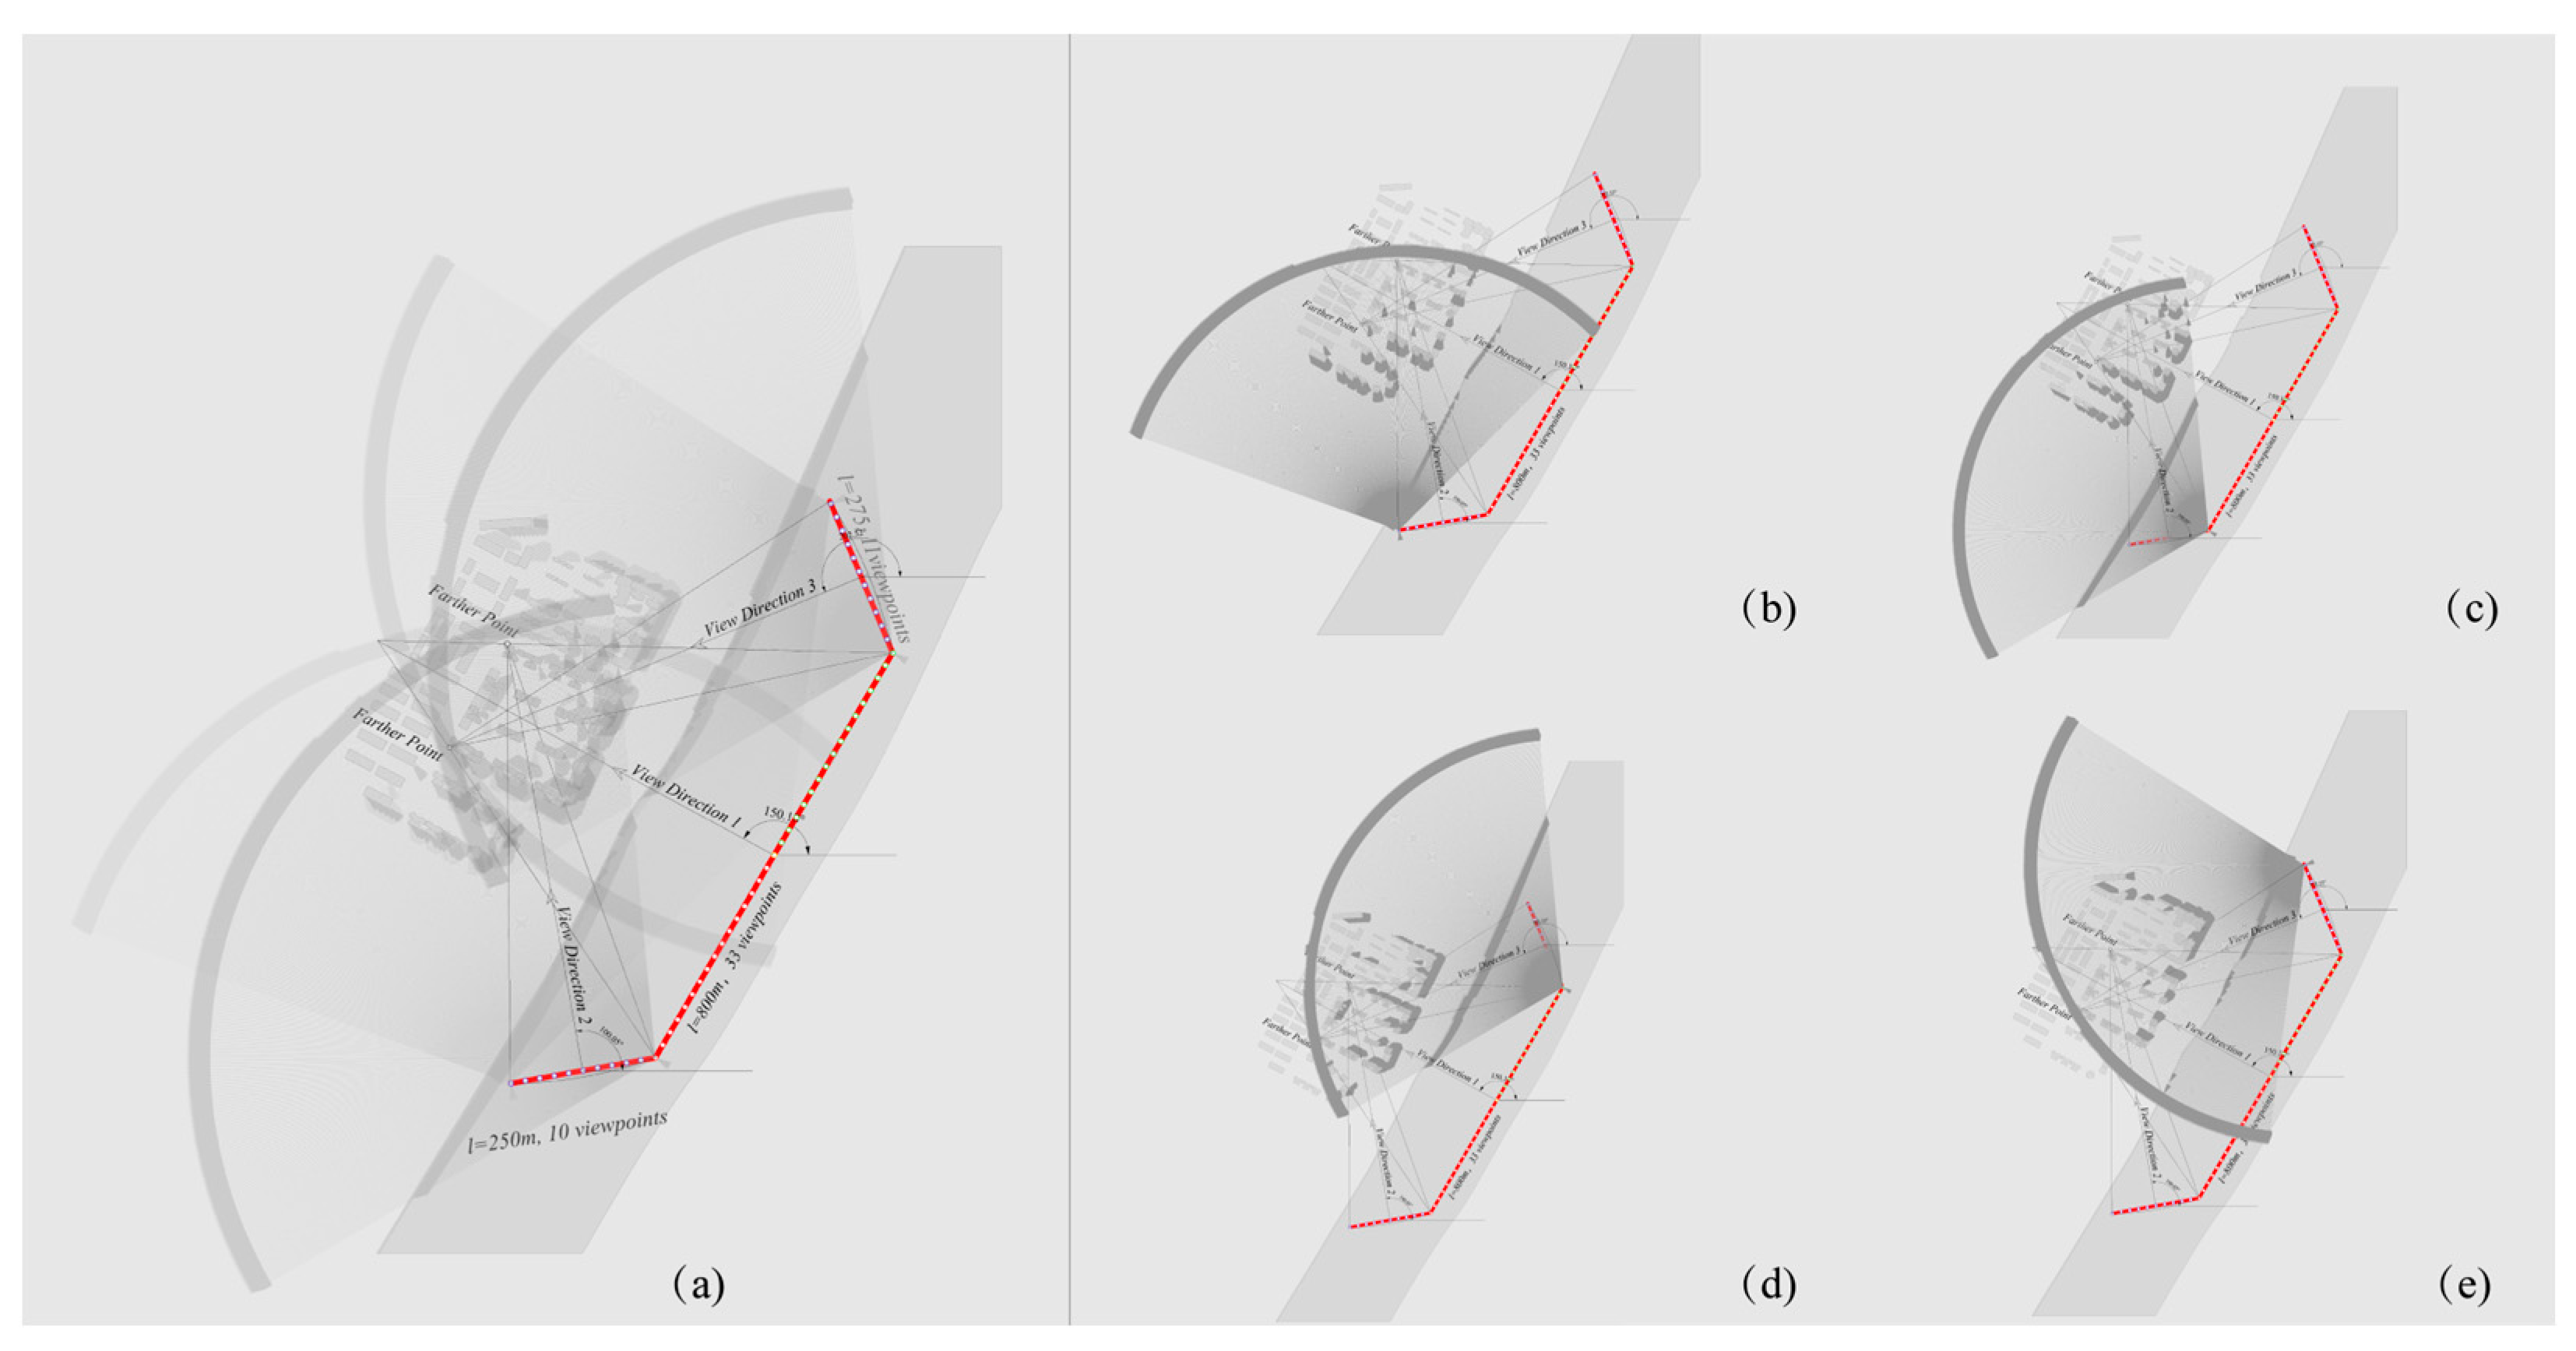
The setting of the vantage points for generating 3D isovists is a critical issue in the measurement of the visibility of river views for the residents of a neighborhood. The near-river viewpoint located in the middle of the top edge of the building and unobstructed by other buildings is selected to generate the 3D isovist [
49] (
Figure 7), and the parameters are set according to the following requirements:
Viewing range: the boundary range of the river-view analysis that can be reached to meet the most unfavorable points of the neighborhood block;
Horizontal viewing angle: the horizontal viewing angle satisfies the shore triangle with the bottom of the shoreline and the maximum line-of-sight distance on either side, and the horizontal angle is the top angle of the triangle;
Viewing direction: typically, the vertical direction of the river shoreline;
Vertical viewing angle: only horizontal downward views are considered, and the shortest line-of-sight length meets the distance from the viewpoint to the riverbank line;
Precision setup: Due to the small angle between the line of sight and the water surface, visible measurements of the water surface can produce significant errors.
Figure 8b–e mask the sky and ground sight lines, reflecting the differences in the viewing range of the river for the different setup precisions.
According to the analysis in
Figure 7 and
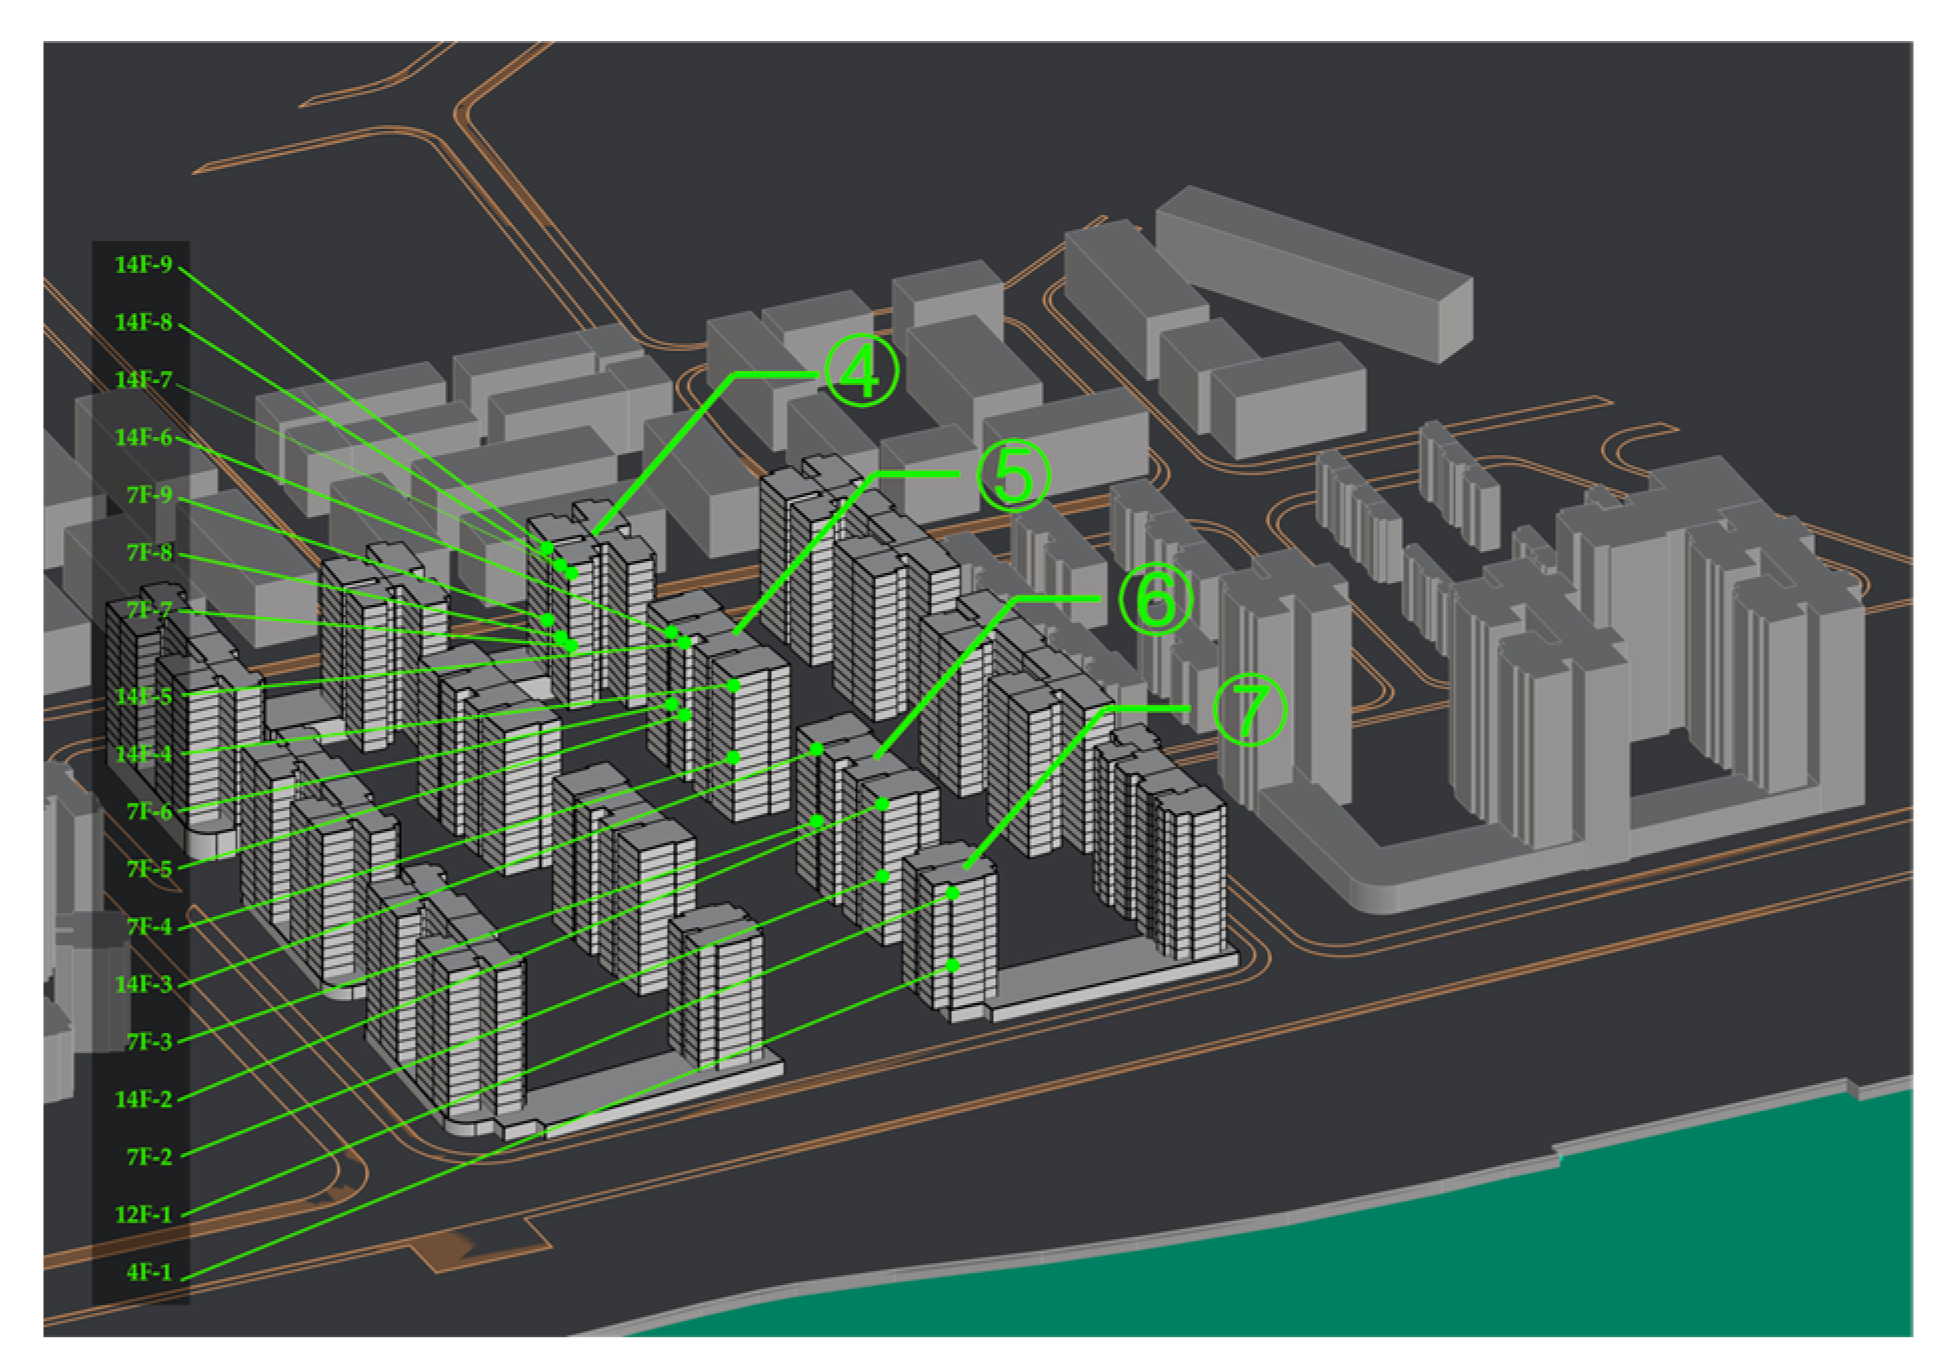
Figure 8, the point of view closest to the riverbank and highest in the residential group is the most advantageous point. Therefore, we established the first hypothesis: In the residential group, when the viewpoint moves from the most advantageous position to the direction away from the riverbank, or moves down to the ground direction, the river view obtained by the new viewpoint is included in the river-view range of the initial viewpoint. The first hypothesis (
Figure 9 and
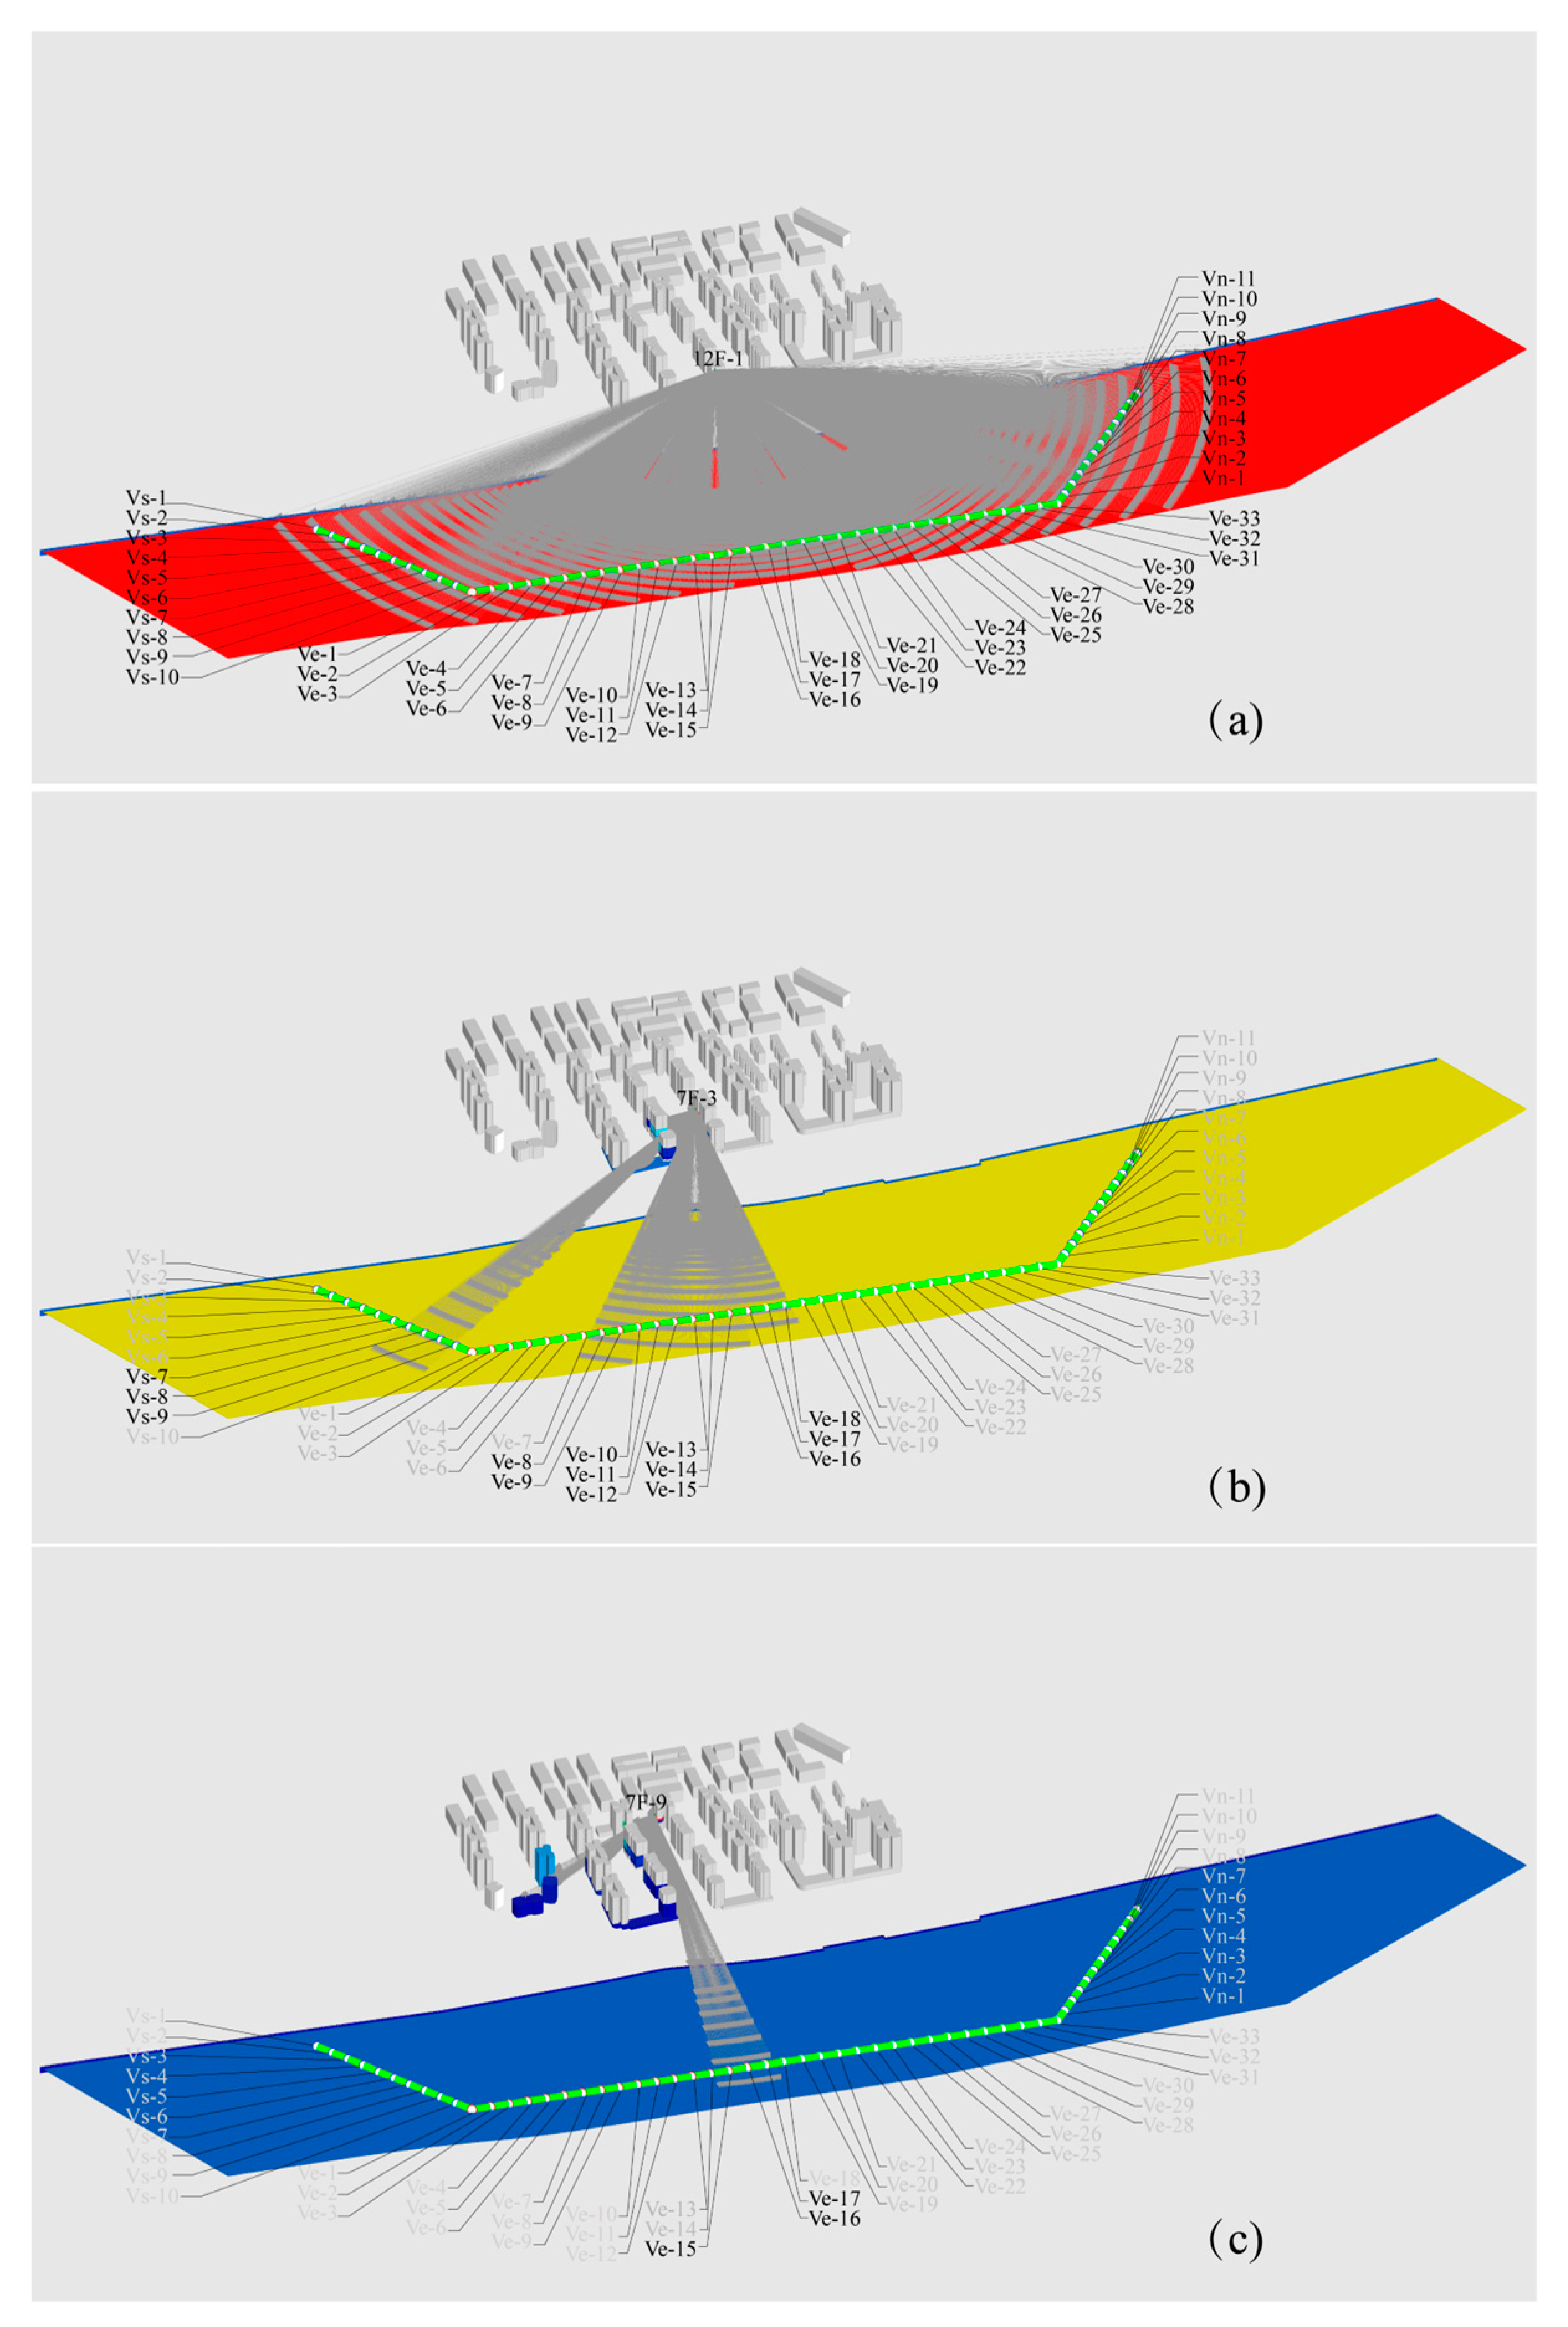
Figure 10) was proven by selecting the 3D isovist generated from 18 viewpoints in Scheme 1. The most advantageous point (12F-1) was set at the southeast corner of Building 7, and the view parameters were set according to
Figure 8e to generate the river views. Then, by moving to the south exterior walls of Buildings 6, 5, and 4, in turn, 9 viewpoints were accumulated. Copying the 9 points to the position 21 m below resulted in 18 river views. It can be seen from
Figure 9 that the river-view fields generated by 17 viewpoints, excluding 12F-1, are subsets of the river-view fields generated by 12F-1. From a geometrical point of view, the full free view of a 3D isovist is a spherical cone with a fixed shape. The view of the river from the most advantageous point is the greatest extent of the river view from the nearest and highest point in this direction. Even if the point of view is far away, or moved downward without any architectural shelter, the river view does not extend beyond the river view of the original location, which shows that the position of the most advantageous point is the one with the largest extent of river view in the same direction.
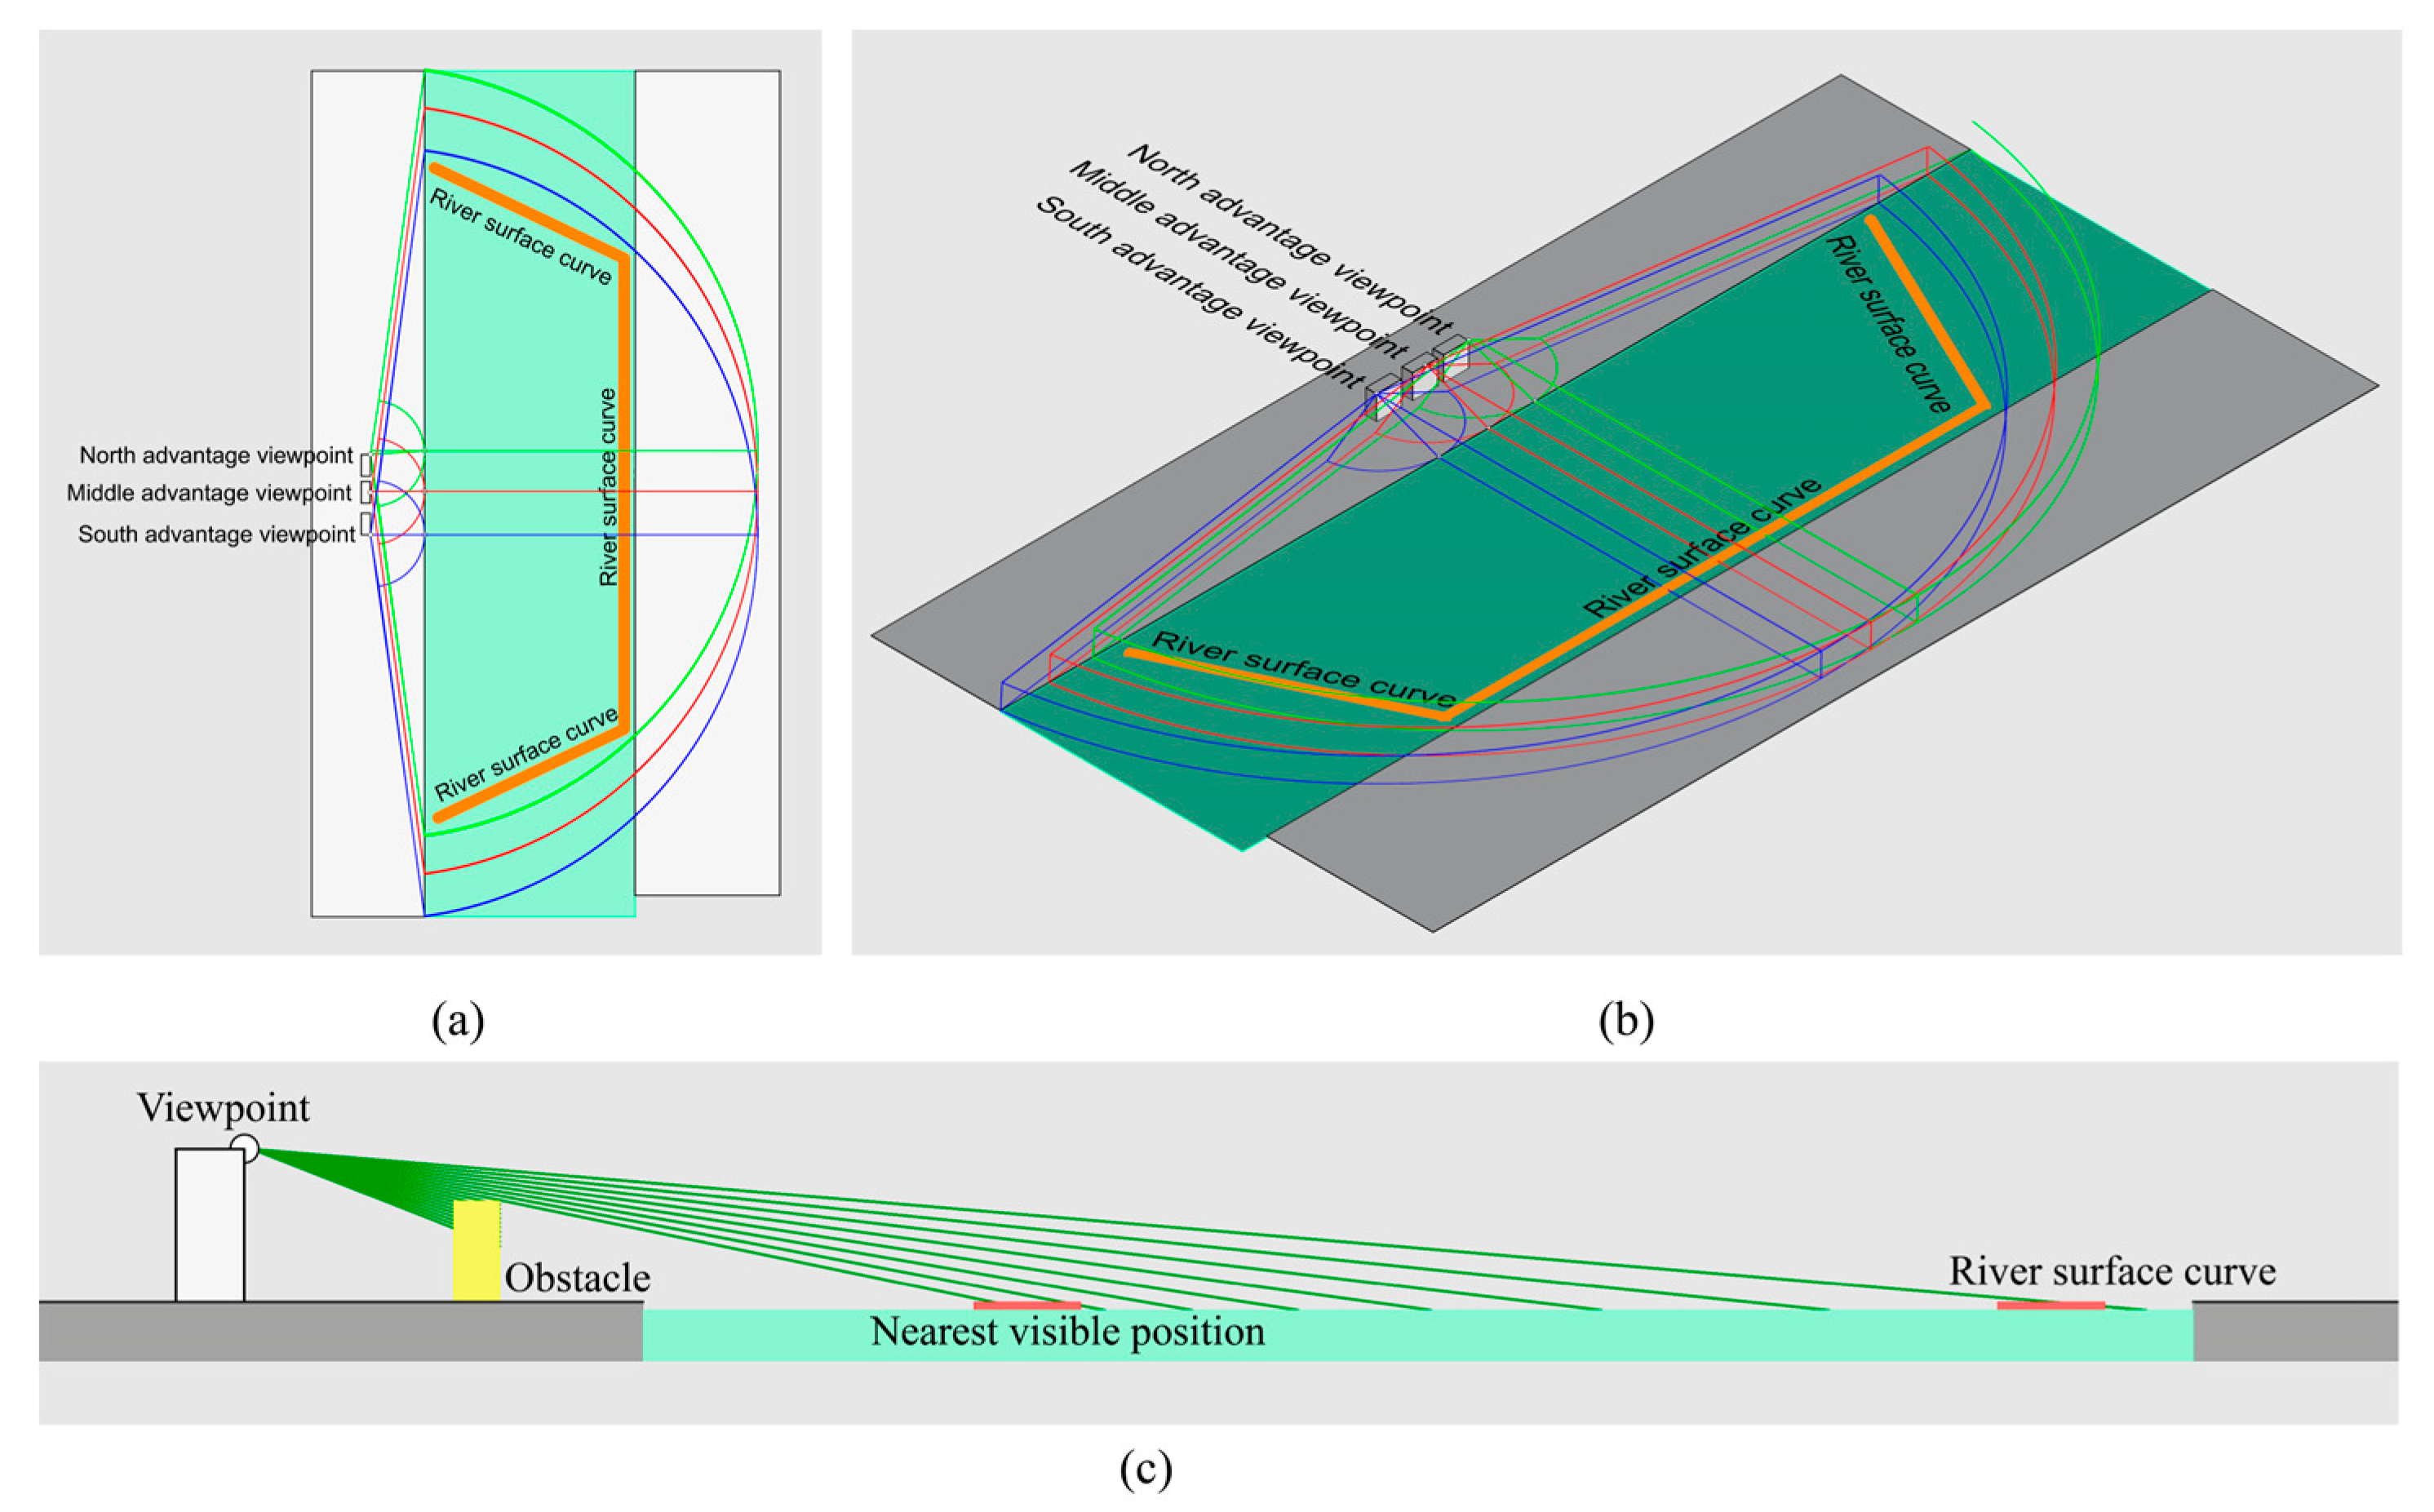
The second hypothesis states that the RSC is a curve that is set at the edge of the intersection range of the river-view sight lines from all of the most advantageous points. This curve represents the extent of the river view, and it is used to measure the visible width of the river view from all viewpoints within the residential group.
The process of generating the RSC is as follows:
The maximum river-view range of the residential group is obtained. From the first hypothesis, it is known that a residential group consists of multiple buildings near the riverbank; thus, the north–south-flowing river view there must have the most advantageous viewpoints at the southernmost, middle, and northernmost ends (
Figure 11). According to Hypothesis 1, the intersection of the river-view field of the three 3D isovists is the maximum visible river-view range common to all of the most advantageous points;
The RSC is located close to the edge of the intersection range, and its vertical elevation is consistent with that of the riverbank;
The RSC is farther away from the neighborhood block because the initial viewing range is much larger than the neighborhood block width;
The main feature of the RSC is that it can be seen in the distance if the viewpoint provides a view of the nearby river. When there is an obstruction in front of the viewpoint of the residential building, a vertical cross section over the viewpoint (
Figure 11c) is made to obtain the cross-sectional river-view set of 3D isovists.
Figure 11c shows that if closer points on the river can be seen from the section, then the visibility depth of the river view of the section is approximately equal to the distance from the nearest visible position on the river to the RSC.
The RSC is equally divided at a certain interval. The 1325 m long RSC is divided into 53 equal segments at 25 m intervals, and 54 points are accumulated for the neighborhood blocks. The RSC can be used as a scale ruler to measure the width of the visible range of a river view. Let a point denote the 25 m width of the river view. For the 18 viewpoints in
Figure 10, the river views of viewpoints 12F-1, 7F-3, and 7F-9 have widths of 1350 m, 350 m, and 75 m, respectively (
Figure 12).
The purpose of an RSC is to generate 3D isovists that measure the river visibility of all dwellings in a neighborhood using the points of the curve. The generation of 3D isovists by directly selecting vantage points on the facades of residential buildings to measure the river visibility is too tedious. First, because a person can only see, at most, three sides of a cube at the same time, it is impossible to visually determine from how many exterior surfaces of a dwelling that the Xiangjiang River can be seen based on the existing 3D model. If a certain density of viewpoints is set on the facade of a dwelling, then at least thousands of viewpoints are needed. Second, the angle between the river surface and sight lines is too small, which requires a high-precision setting for 3D isovist generation, which the computing power of ordinary computers cannot reach. However, the above difficulties can be solved by looking at the residential buildings from the RSC. Because of the mutuality of visibility, the 54 points on the RSC become the viewpoints from the river surface, the cumulative number of viewpoints for the 3D isovist generation is only 54, and the angle between the view line and vertical surface of the building is much larger than the angle with the horizontal surface; therefore, more precise calculations can be obtained.
The position of an equipartition point on the RSC from which a dwelling can be seen is a sufficient condition for being able to see the river from that dwelling. Therefore, the range of river views that can be seen from a dwelling is approximately equal to the product of the number of visible points on the RSC and the length of the equidistant segments of the curve. To ensure computational accuracy, the computer was equipped with an Intel® Core™ i7-11700 CPU, with 128 GB of RAM and an NVIDIA GeForce GTX 1660 graphics card for parallel computing.
The following steps were followed to measure the visibility of the river views for both schemes:
Step 1: The parameters of the viewing direction were set based on the segmentation of the RSC. The viewing direction was the horizontal dominant direction of the 3D isovist (i.e., the angular bisector of the horizontal view), and it remained perpendicular to the river curve. If the RSC adopted an arc, then the viewing directions for the residential buildings from the RSC were continuously adjusted. To simplify the setting of the RSC, the curve consisted of three straight lines, and the viewing directions corresponded to 150.18°, 100.05°, and 202.52°, corresponding to the east direction.
Step 2: The horizontal viewing angle was set as
α = 120°, and the vertical viewing angle was set as
β = 10°. The line-of-sight distance was set as D = 800 m because the distance from the 4 endpoint positions of the RSC to the farthest point of the neighborhood block was about 750 m. Taking the accuracy parameter of 1500 lines of sight per 360° plane, the accumulated 3D isovist had 21,042 lines of sight (
Figure 13);
Step 3: The RSC was picked up on the Grasshopper platform, and the parameter slider was moved at 25 m intervals. The 3D isovist component performed calculations that corresponded to the data of the parameter slider, and Data Recorder was used to record the measurement data of 54 3D isovists on the RSC (
Figure 14). The total number of generated lines of sight was 1,136,268.
Step 4: All line-of-sight measurements were filtered and matched with the number referenced for each dwelling geometry by Data Tree of the Grasshopper software (
Figure 15). This method stores the 3D isovist data for the 54 equipartition points on the RSC, which includes the references of the obstacles corresponding to each line of sight. The data are then processed to match the viewpoint on the river curve for each dwelling unit. For example, if a dwelling unit corresponds to three viewpoints, it means that the river view width of the unit is 75 m.
3. Results and Discussion
The results of the river visibility measurements of the dwellings show that all of the dwellings in Scheme 1 have river views, while 31 households in Scheme 2 do not have river views. The 3D isovists generated from 54 viewpoints on the RSC have a total number of 1,136,268 sight lines, with 114,129 points falling on the facades of 1002 dwellings in Scheme 1 (simple layout), and 112,021 points falling on the facades of 971 dwellings in Scheme 2 (complex layout). In the following, a new optimization scheme is proposed, and a comprehensive comparison is made, starting from an analysis of the visibility measurements of the river views of the dwellings.
3.1. River-View Widths of All Dwellings
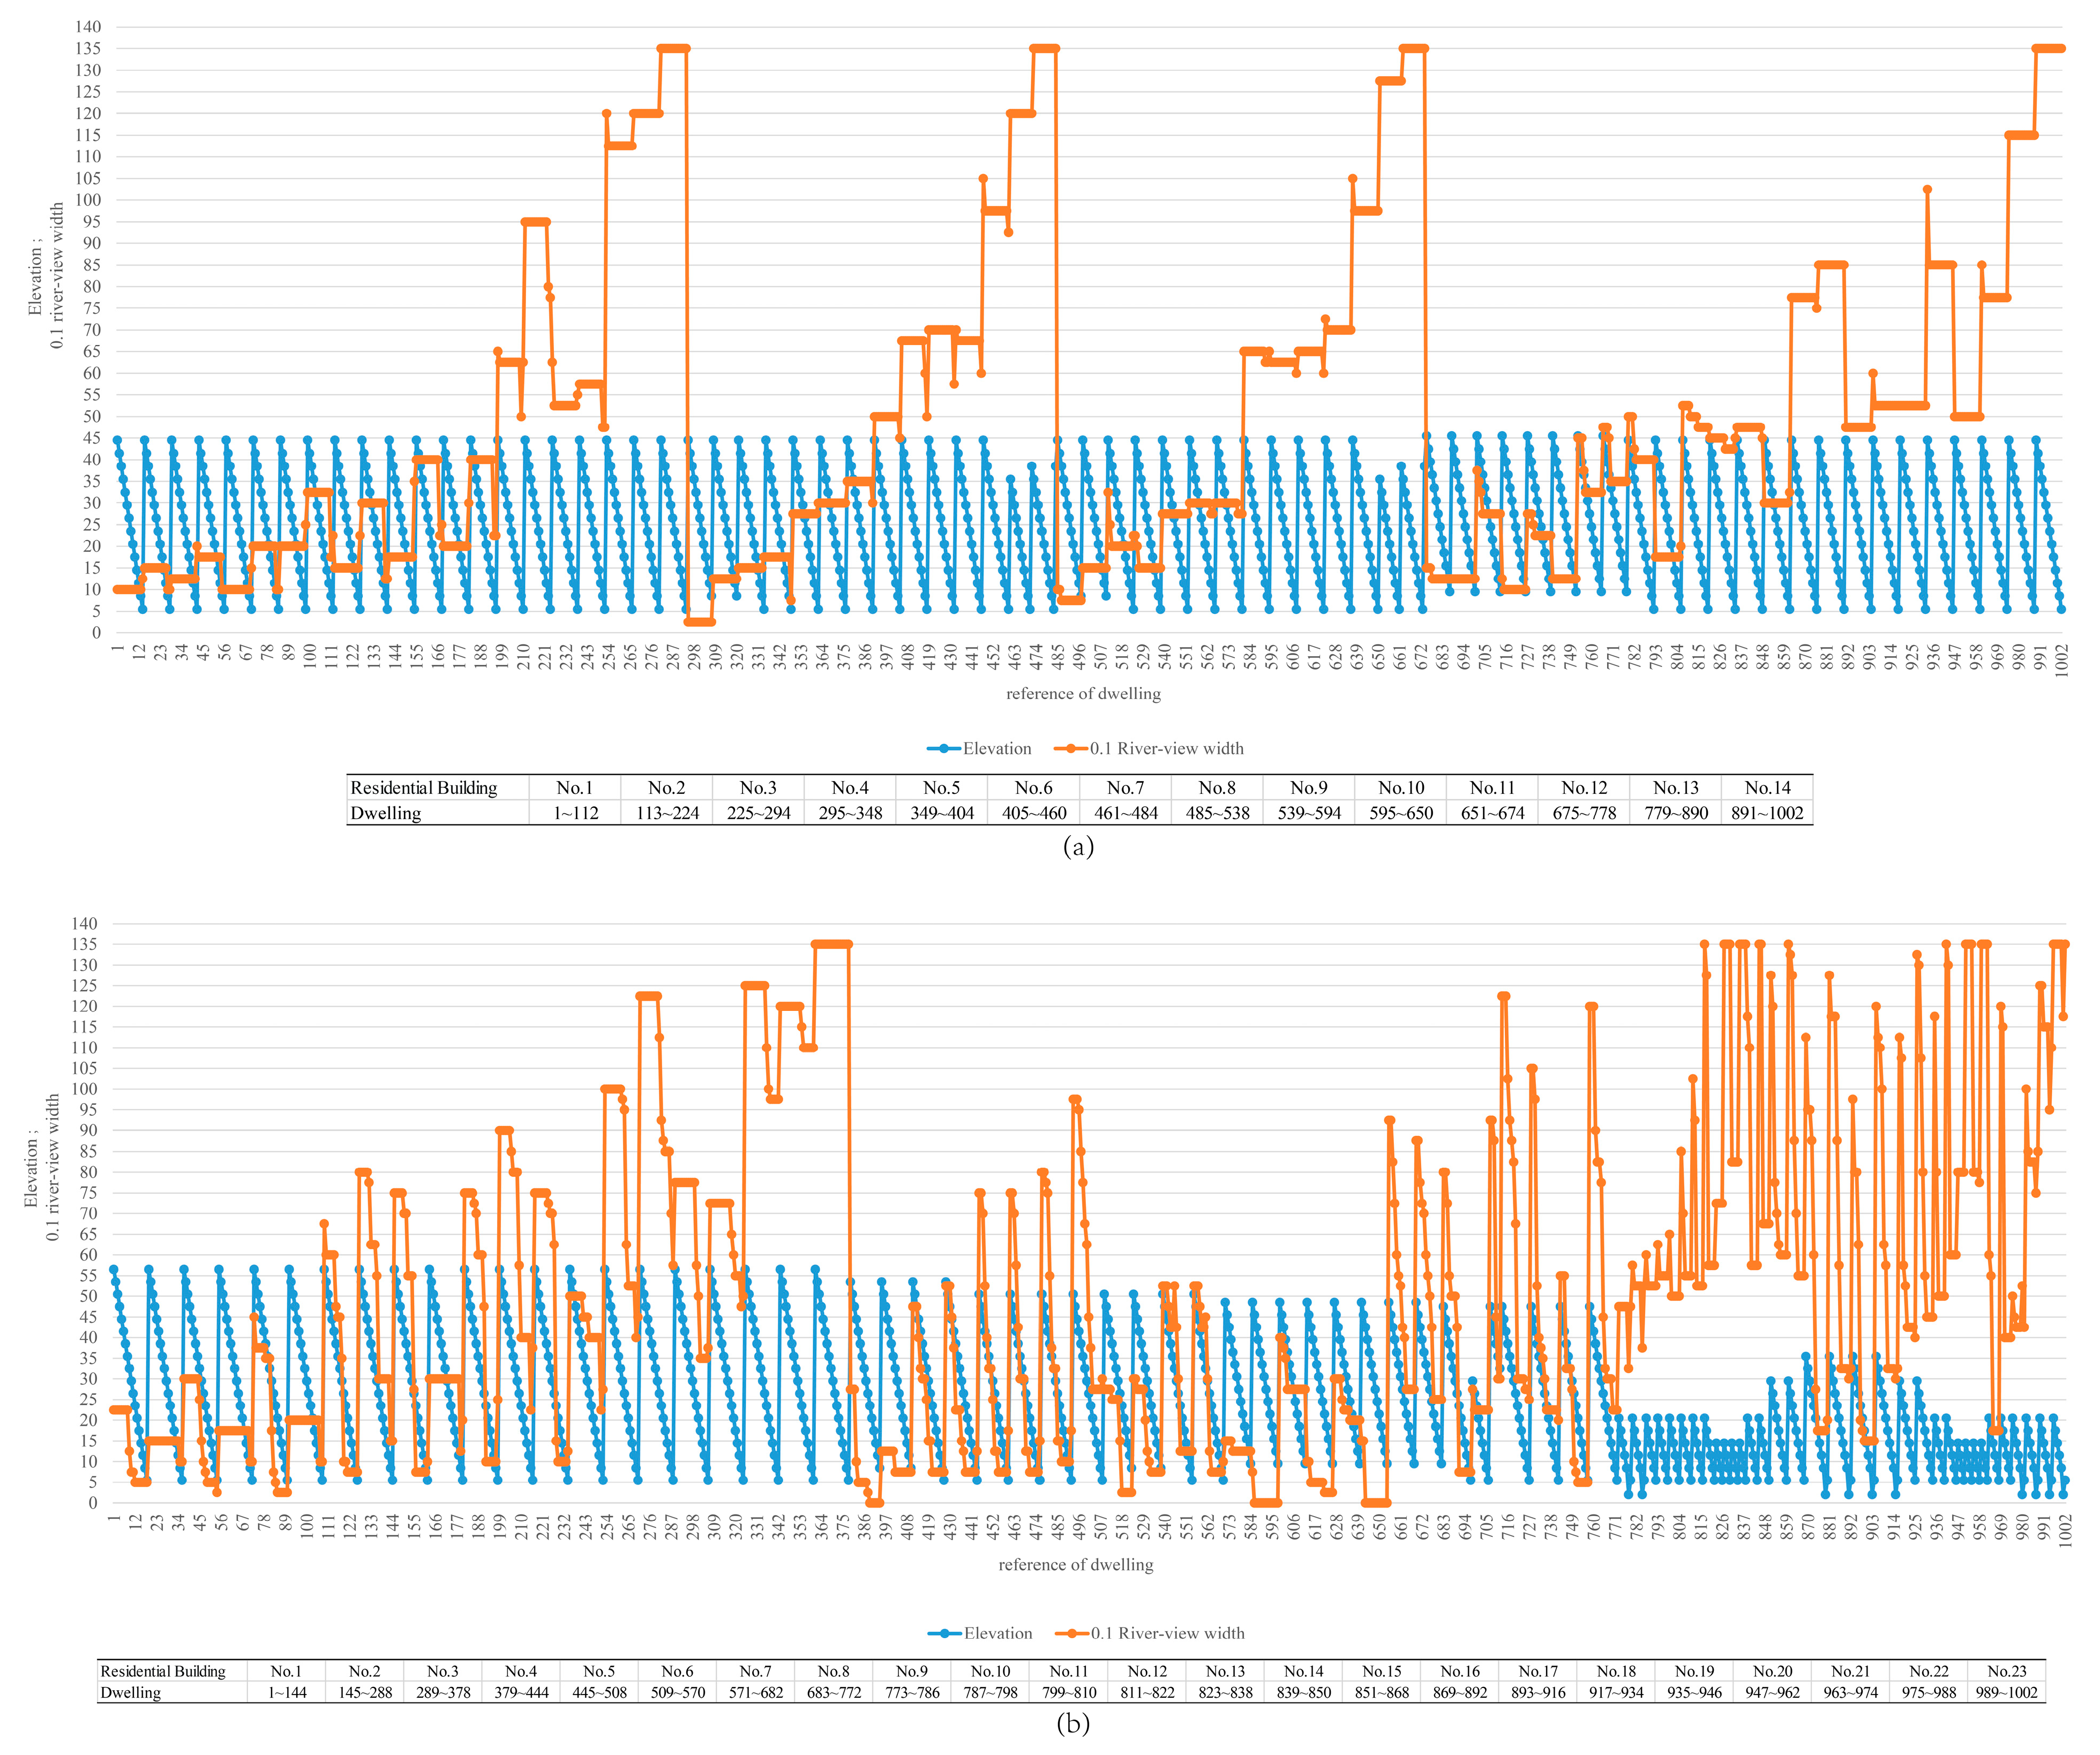
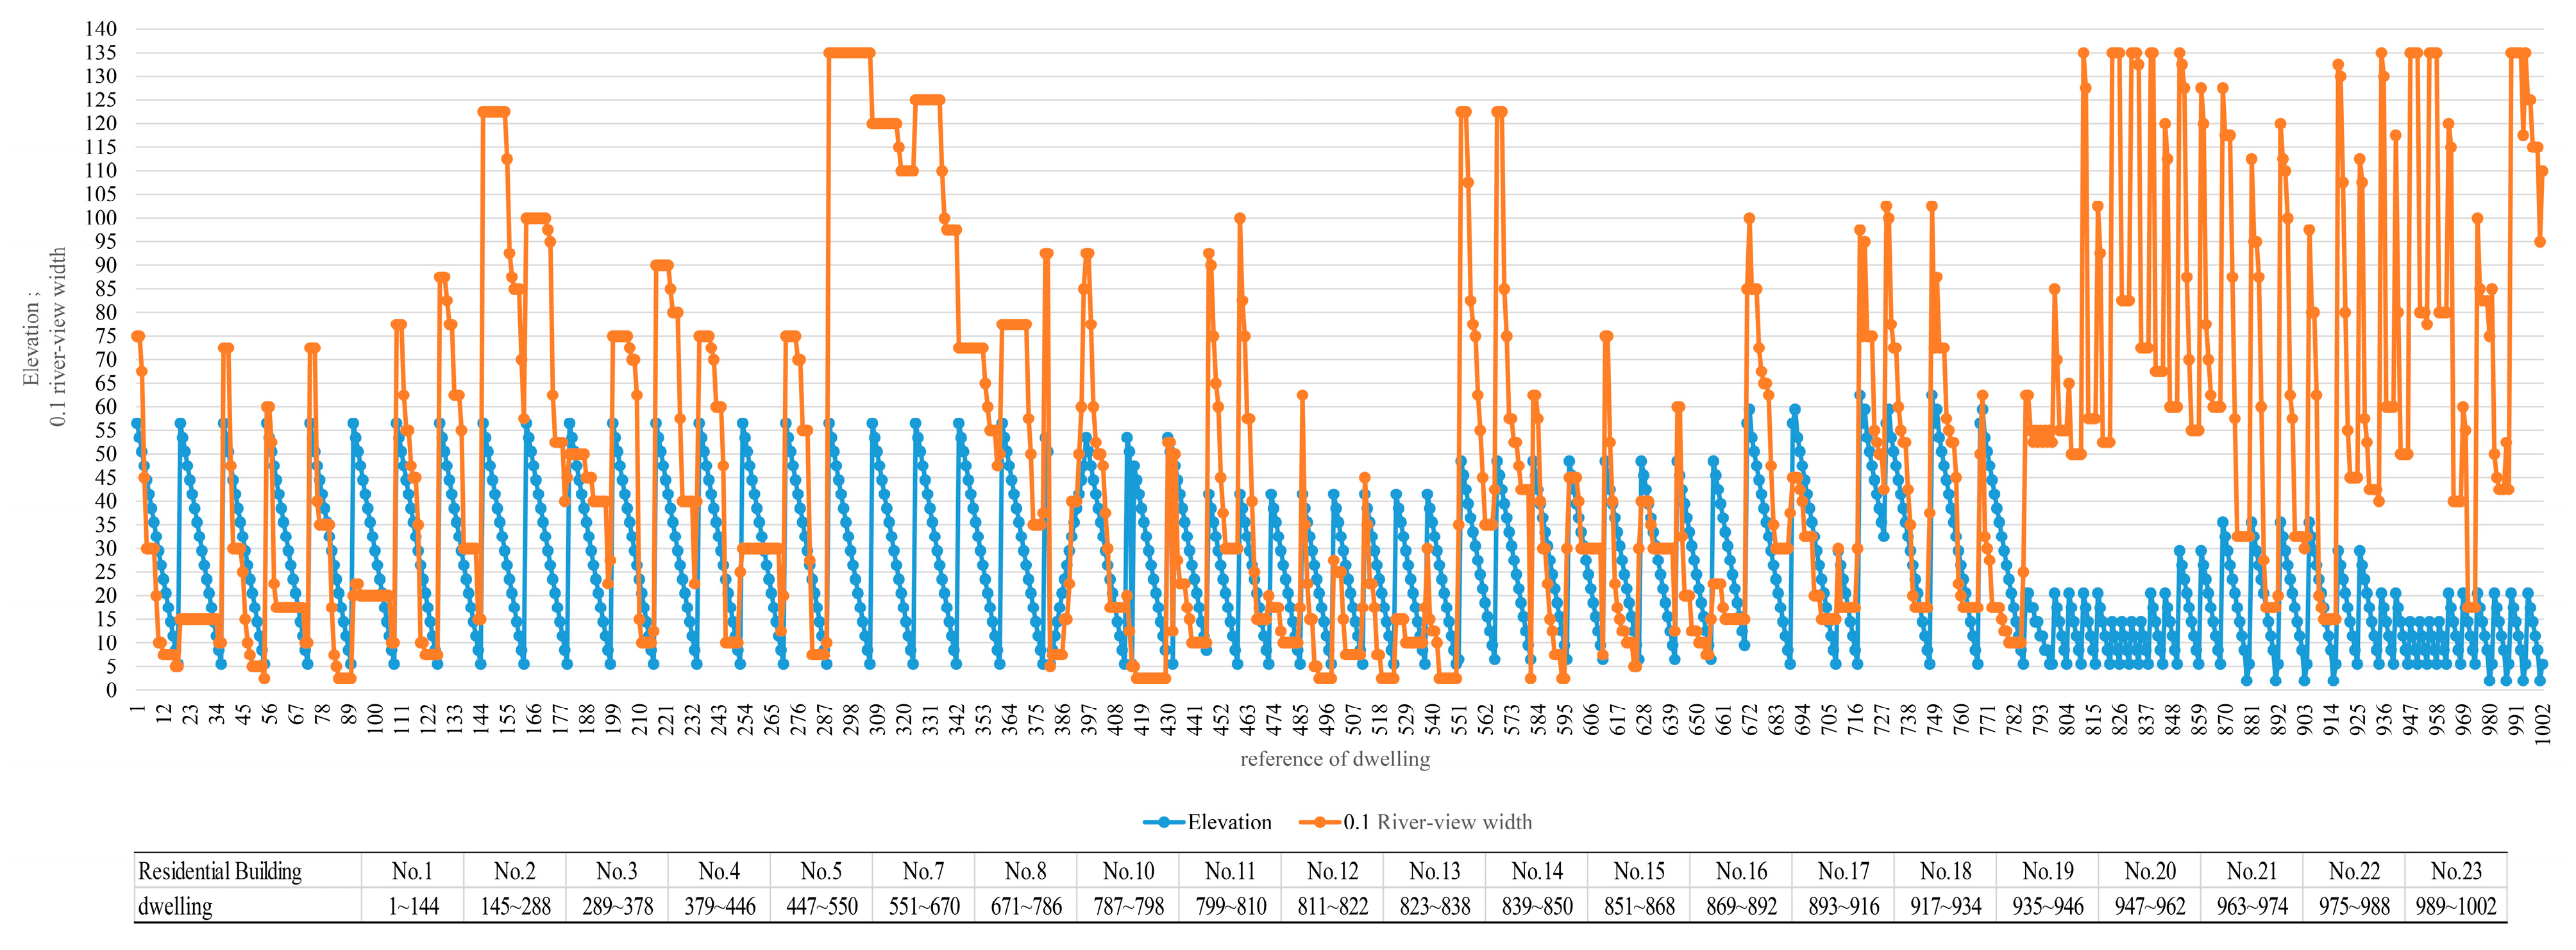
The river-view width of a dwelling is an indicator of the quality of the dwelling’s river view. The occupant-river-view folding diagram (
Figure 16) shows the river-view widths of all occupants in the simple and complex building layouts (for the corresponding vertical elevations of the occupants, the river-view widths were reduced to 0.1 times). The dwellings in Scheme 1 show a gradual decay of the river-view widths from high to low values, and from near to far from the riverbank. The quality of the river views of the dwellings in Scheme 2 was polarized, with more dwellings with high and low values of river-view widths than those in Scheme 1, and 31 dwellings with no river views. That is, Scheme 2 has a superior courtyard mixing relation to that of Scheme 1; however, Scheme 2 does not have an advantage in terms of the level of river views for the dwellings.
The relationship between the building layout and river-view visibility can be found in the generated graphical results of the 3D isovists from 54 viewpoints:
A parallel determinant layout perpendicular to the riverbank could easily satisfy the number of river-view dwellings;
A near-low and far-high building layout tends to increase the number of high-quality river-view dwellings relative to the riverbank;
A three-sided-enclosure layout improves the quality of the river views for the buildings facing the bank, but it also obscures the buildings behind them.
The building layout was repeatedly adjusted according to the above rules, and the visibilities of the river views of the dwellings were measured in parallel using 3D isovists, which resulted in an optimized building layout scheme (
Figure 17). This scheme still maintains 1002 dwellings (
Figure 18). As seen in
Figure 18, the optimized layout scheme achieves river views for all of the dwellings and increases the number of high-quality river-view dwellings. The courtyard space of the optimized layout is optimized based on Scheme 2. First, the four-level openness of the space is maintained, and Space 5 corresponding to the location of Scheme 2 is expanded into a large and enclosed integration space. Second, the convex spatial analysis graph indicates that four contact spaces connect nine courtyard spaces and maintain four integrated levels of courtyard spaces. Finally, the spaces have a stronger spatial permeability relationship, and the space located at No. 5 creates a direct visual connection with multiple courtyard spaces.
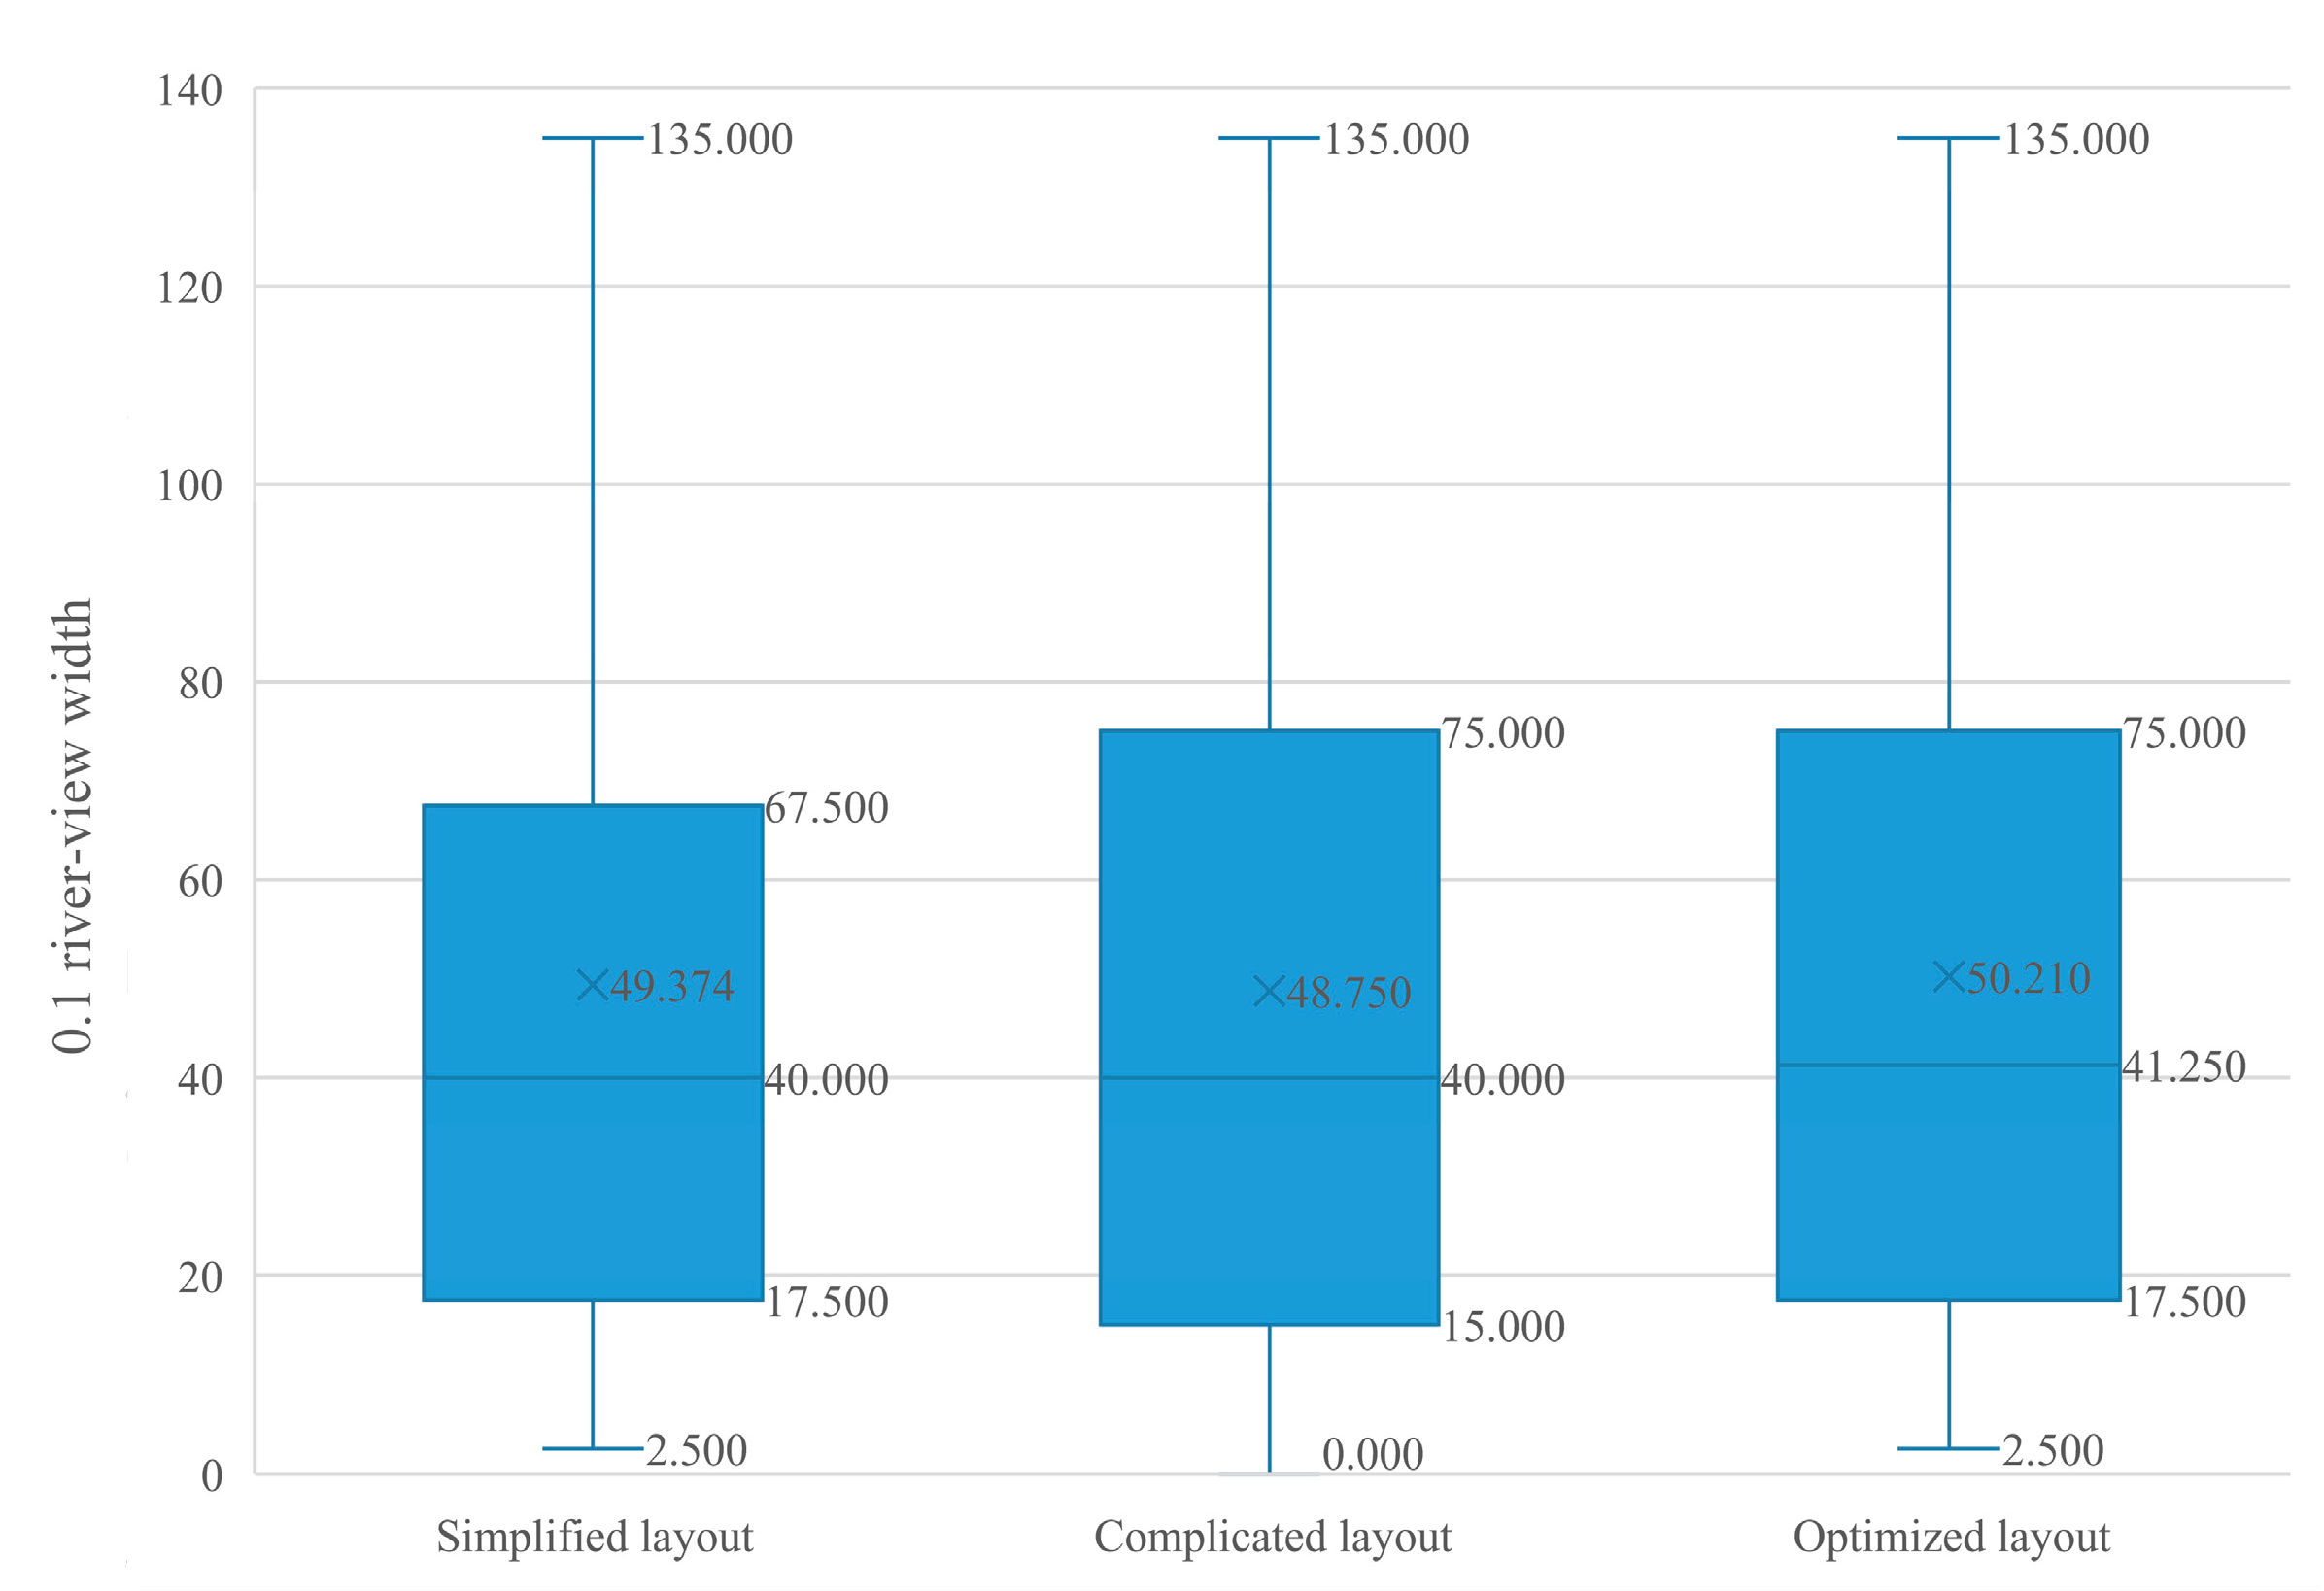
The box plot directly expresses the results of the river views for the dwellings in the three schemes (
Figure 19), showing the means, maximums, minimums, medians, and upper and lower quartiles of the river-view width data for the 3006 households in the three schemes. First, the average and median river-view widths of the optimized schemes are larger than those of the two original schemes. Second, the lower quartile is consistent with the simple layout, and the upper quartile is consistent with the complex layout (i.e., the optimization method absorbs the advantages of the two original schemes). Therefore, the river-view visibilities of the residents in the optimized scheme are the best compared with those of the two initial schemes.
3.2. Hierarchical Analysis of River-View-Visibility Quality in Dwellings
The establishment of a comparative river-view hierarchy of dwellings is a comprehensive need for compact cities [
55]. From a design point of view, there are many dwellings in a neighborhood, and so it is convenient to categorize the river-view dwellings by the measurement results. From the perspective of residential project development, this also facilitates the selection of the residents’ river-view needs, and the determination of the housing prices [
56].
The river-view visibility was divided into nine levels according to the river-view widths of the dwellings (
Table 2). Level 0 represents no river view, and Level 8 represents the highest level of river view.
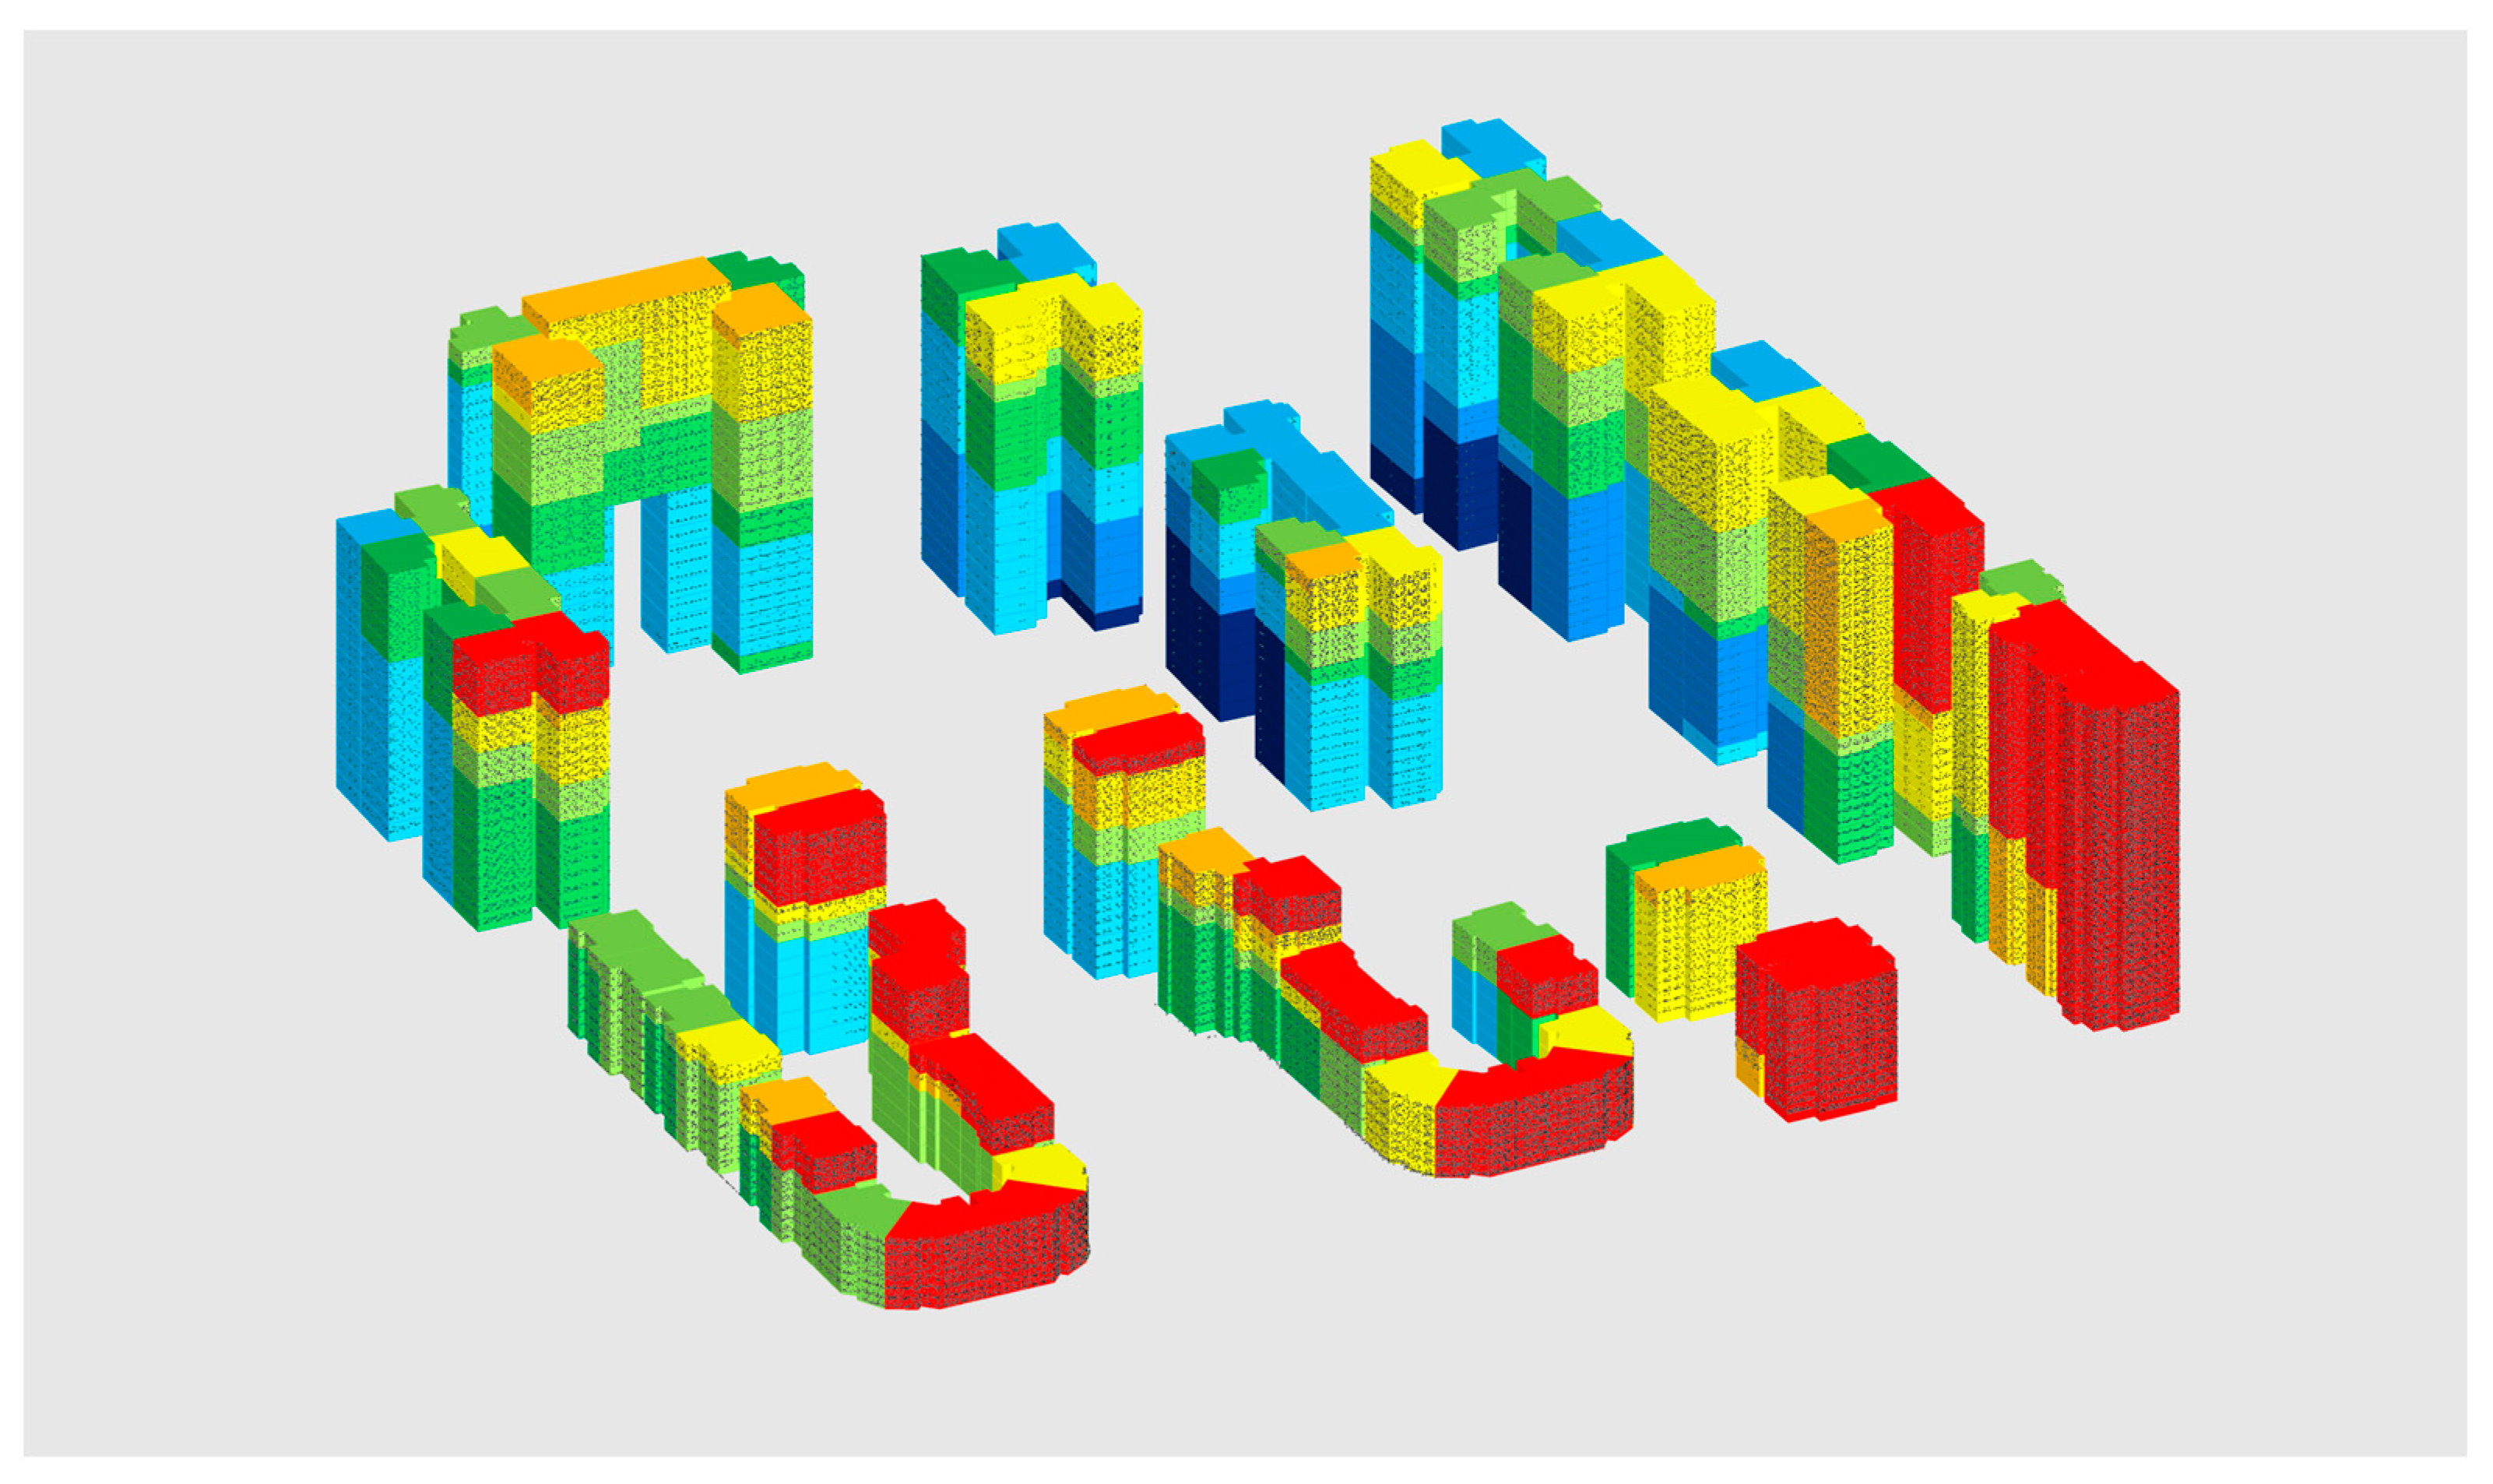
Table 2 shows the number of dwellings at each level of each scheme and its proportion to the total number of dwellings in the neighborhood. On the Grasshopper software platform, the first step was to classify the dwellings according to the nine levels of river-view visibility. Then, the geometries of the corresponding level dwellings were rendered using different colors, from warm to cool colors to define the levels from 8 to 1, respectively, to express the visibility of the river views of the dwellings, and the gray color to express the dwellings without river views. Finally, a hierarchy diagram of the dwelling river-views was formed on the Rhinoceros platform (
Figure 20).
The river-view hierarchy shows not only the number of river-view dwellings at all levels, but also the distribution of the dwellings within a neighborhood block. From the perspective of the combinatorial form of building groups, the optimized layout achieves the desired urban architectural image and multilevel courtyard combined space. From the perspective of the river-view visibility, the number and distribution range of the high-level river-view visibilities in the optimized scheme are better than those in the other two schemes. Thus, the optimized layout scheme achieves the optimization goal of the residential building layout.
3.3. Viewpoint Clouds of River Views on Dwelling Exterior Walls
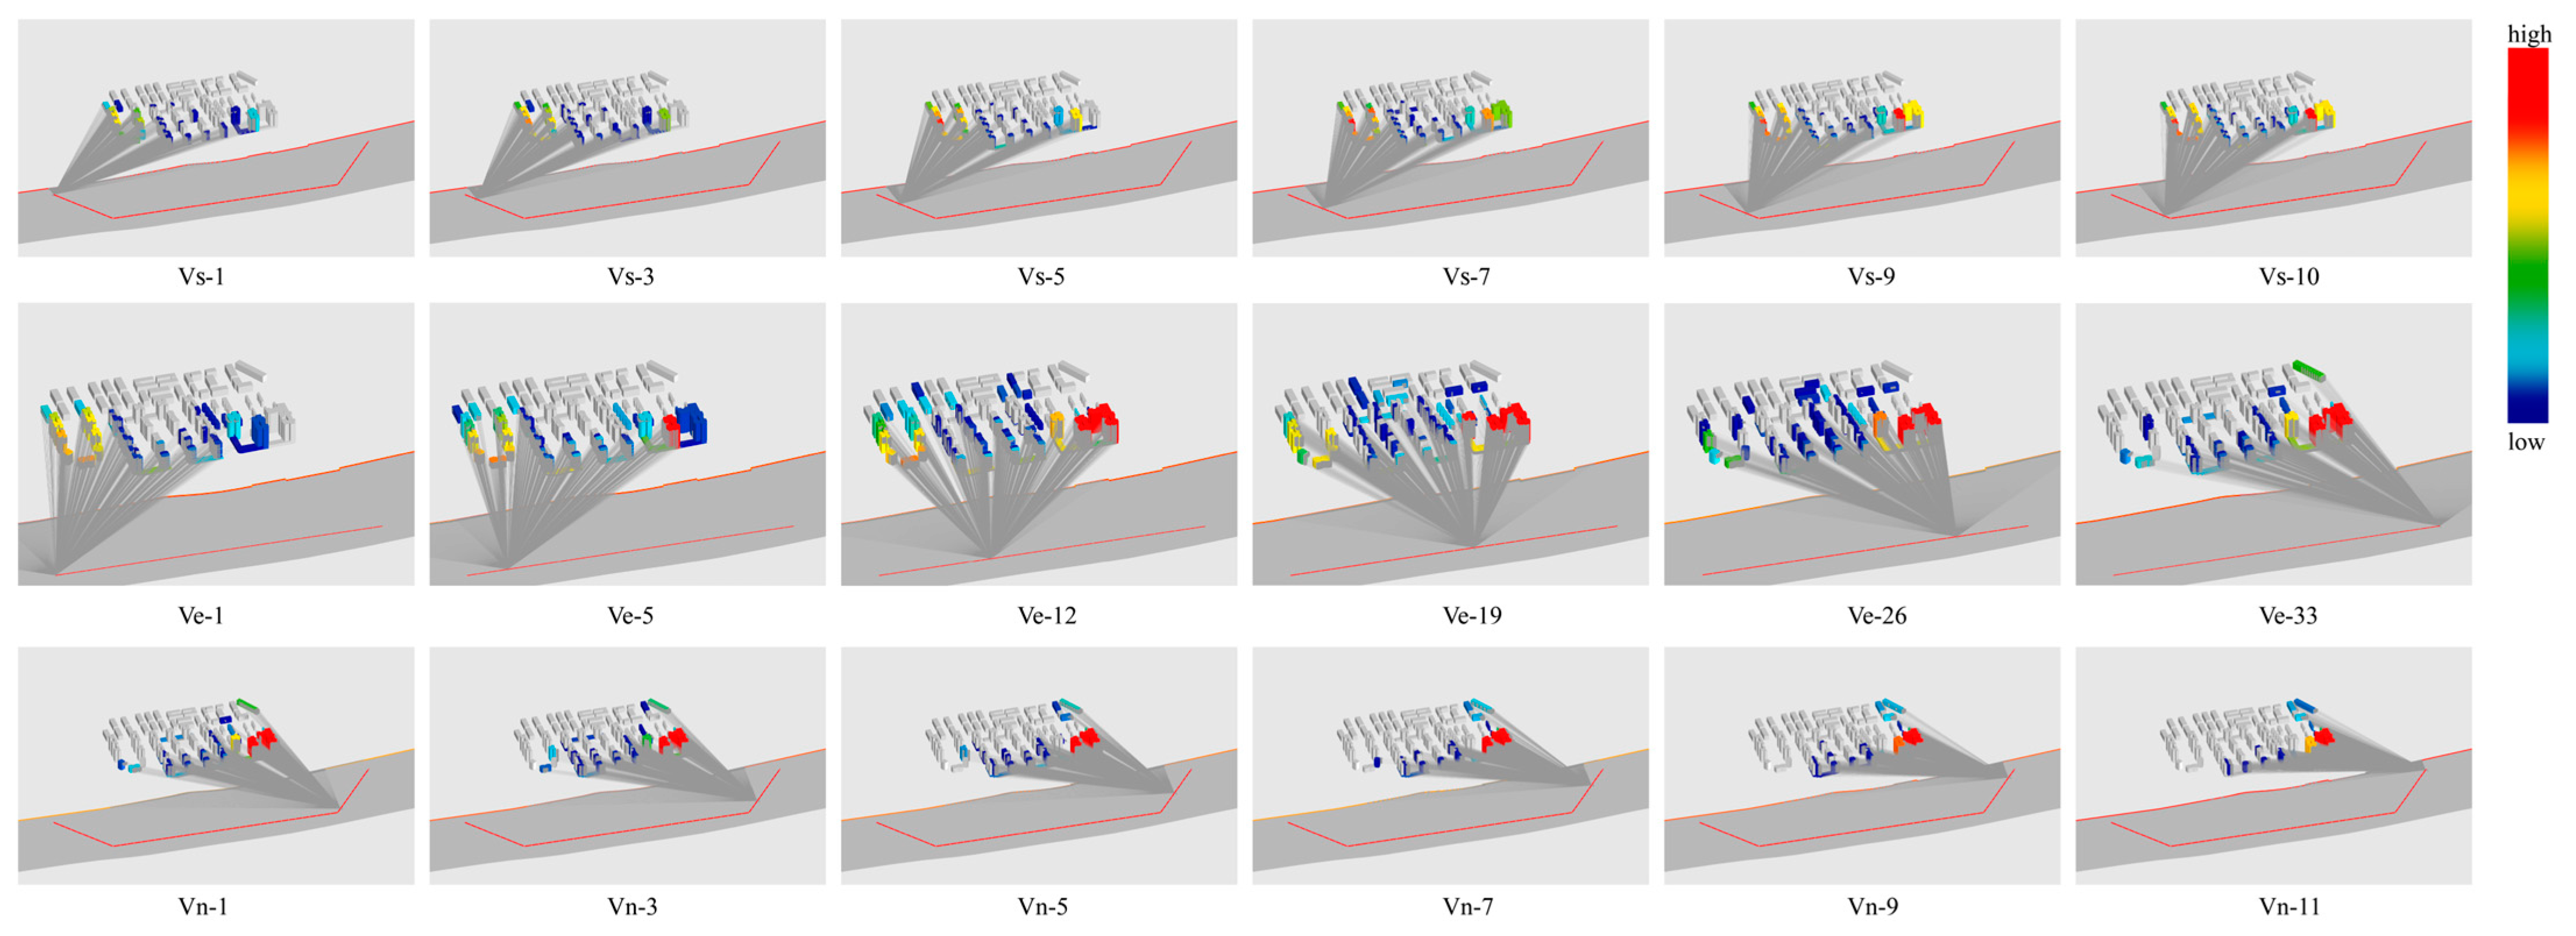
The 3D isovist dataset on the equipartition points of the RSC can be used to locate the viewable points of the river views on the facades of dwellings. For the optimized scheme, the 3D isovists generated from the 54 viewpoints of the RSC have 113,073 lines of sight projected onto the facades of 1002 dwellings in the neighborhood block. On the Grasshopper platform, the data-filtering component is run to select the sight lines of the dwellings, and the endpoint coordinates of the sight lines are used to generate the viewpoint clouds of the river views on the dwelling exterior walls (
Figure 21).
Figure 21 represents both the river-view hierarchy and river-view viewpoint cloud for each dwelling in the neighborhood block. Because the viewpoint cloud has a visibility relation with the equipartition points on the RSC, the viewpoint cloud on the exterior wall of the dwelling represents the set of all locations on the exterior wall of the dwelling from which the river can be seen.
Models overlaid with river-view levels and viewpoint clouds provide architects and landscape architects with an accurate design basis. For a dwelling, the only way to obtain a view of the river is to set up a window or a balcony on an exterior wall with viewpoint clouds. The higher the density of viewpoint clouds on the exterior wall of a dwelling, the higher the level of the river view.
These laws have obvious implications for the design of residential buildings. First, for the floor plan design of residential buildings, functional spaces with high landscape requirements should be set up in the rooms with high-density river-view viewpoint clouds on the outer walls, such as living rooms, master bedrooms, landscaped balconies, etc. Second, the density of the viewpoint clouds on the exterior wall can guide the window design of the building facade. For an outer wall with a high density of viewpoint clouds, the window-viewing behavior of the residents should be fully analyzed, and window-opening and compartment design should be carried out. For low-density facades, the viewpoint clouds on the outer walls should be fully analyzed, and corner windows should be used as much as possible to increase the chances of obtaining river views. Finally, the density-varying properties of the viewpoint clouds on different floors should be fully considered, and the plan and facade design of the building should be grasped from an overall perspective.
The results generated from this approach can also provide designers with guidance on designing surrounding green landscapes [
57]. For the landscape design, the river viewpoint clouds on the facades of residential buildings favor landscape plant configurations. First, tall trees should not be arranged in positions that affect the river-view sight penetration, such as by building parallel and staggering the layout of the cavity location; however, they can be arranged near the outer wall of the high-density river-viewpoint clouds with the help of the better sight penetration of tall trees or arranged in the courtyard space of the enclosed layout for buildings with poor river views. Second, the landscape configuration is an important, though complementary, addition to the group of riverfront residences, and it can be optimized for the landscape configurations of dwellings with poor river views, thus fulfilling the purpose of landscape compensation. Finally, the comprehensive landscape layout of each external element, with scientific data and associations [
21,
22], highlights the landscape theme of the residential group.
4. Conclusions
Planning and design of residential areas is a process of repeated coordination between the layout of building groups and river-view visibility measurements. The novel approach developed in this paper can accurately and efficiently measure the river-view visibility of each dwelling in the block, reflecting the impact of the building group layout on the river-view visibility of dwellings. It can also assist in optimizing building design layout and achieve a dynamic matching process between building group layout and river view visibility.
At a time when the quest for block comfort is on the rise, the visual interaction of natural water views as an important indicator to enhance the comfort of compact urban blocks should be accurately analyzed by urban designers in terms of river-view visibility in riverfront residential areas.
This study used the river surface curve as a standard measurement rule for the river-view width of individual dwellings in a neighborhood block, and achieved a description of the river-view quality for each dwelling. It also extrapolates the river viewable point clouds on the exterior walls of the dwelling. These can help designers enhance their understanding of the river-view visibility experience of a dwelling from a more comprehensive perspective, and assist in building layout design and facade design for riverside neighborhoods.
With this type of design integration, the benefits of natural river landscape resources and the spatial permeability of compact urban areas are enhanced, reflecting the advantages of parametric-assisted building and landscape design. It provides practical guidance for the urban planning, architecture, and landscape design of riverside residential neighborhoods, contributing to sustainable urban development.
For future urban design, this approach can be extended to analyze the visibility of more natural and even urban landscapes, providing data support and assisting design in other areas of urban design research.

