1. Introduction
According to the report to the 20th National Congress of the Communist Party of China, high-quality development is the core objective in establishing a modern socialist country. Promoting green innovation development actively, as well as driving green and low-carbon transformation of the economy and society, are critical approaches to achieving high-quality development [
1]. China’s digital economy has experienced explosive growth over the last decade. The digital economy was only CNY 11 trillion in 2012, but by 2021, it had grown to CNY 45.5 trillion, positioning itself as a new engine to drive quality reform and promote integrated economic growth [
2]. China’s Yangtze River economic belt, as the golden support belt of China’s transformation and growth, is the primary carrying region of China’s digital economy development. Promoting its green transformation and innovation development is of great strategic significance to China’s high-quality development [
3]. However, its present development has obstacles in industrial transformation and upgrading, as well as the effective allocation of resources in space, which necessitates more powerful driving forces to break through the constraints of existing resources. In this context, what are the key factors for the rising digital economy’s position as a new driving force? Can it support China’s Yangtze River economic belt’s green innovation development, and what is the unique mechanism? Is there a spatial relationship? We conducted an in-depth study into the aforementioned issues. The purpose of this study was to discover the temporal and spatial distribution and dynamic evolution of the urban digital economy and its impact on the urban green innovation development in the Yangtze River economic belt from the perspective of driving force. More importantly, this study attempts to provide theoretical and practical references for future policy formation and improvement to support high-quality green innovation development and fully utilize the role of the new driving force of the digital economy in China’s Yangtze River economic belt cities.
The digital economy refers to a growing economic form in which digital information is a key input component; the Internet is the essential carrier, and digital technology is the driving force of innovation and economic structure optimization [
4,
5]. The research on the digital economy at home and abroad primarily consists of two aspects: the first is the research on the measurement of the digital economy’s own development, which primarily measures and analyzes its development level [
5,
6,
7], development size [
8], and output efficiency [
9]. The second is the research on the influence of the digital economy on economic and social growth. On the one hand, it studies the impact of the digital economy on high-quality sustainable development [
10,
11], energy transition [
12], and political corruption [
13] from a macro perspective. On the other hand, it studies the impact of the digital economy on total factor productivity [
14] and financial institution [
15] rates from a micro perspective.
With the world’s increasing focus on green innovation, the focus of research on green innovation is constantly shifting, from focusing on the connotation characteristics [
16] and environmental benefits [
17,
18,
19] of green innovation itself, to paying attention to external influencing factors [
20] and spatial evolution network characteristics [
21]. Green innovation efficiency, as a key indicator for measuring the level of development of green innovation, merges technological innovation, environmental friendliness, and resource conservation into a single evaluation framework, with relevant studies focusing on analyzing its spatiality and influencing factors [
22,
23,
24,
25,
26]. According to research on the relationship between the digital economy and green innovation, the digital economy can promote resource sharing, improve the resource utilization rate, reduce enterprise innovation cost and ecological environmental pollution, and thus contribute to green innovation development [
1,
10,
27]. The research of the interaction mechanism between the two is mostly conducted at the intra-city level, focusing on factors such as industrial structure [
28], R&D investment [
29], and entrepreneurial activity [
27].
The existing literature has at least the following deficiencies in the areas of the digital economy and urban green innovation development. First, researchers have investigated and measured the digital economy development level at the national and provincial levels, but few have measured it at the city level and performed a spatial analysis from the perspective of the nature of the digital economy as the new driving energy and new engine. Second, most recent researches have focused on the function of intra-city mediators in the relationship between the digital economy and green innovation development. Third, the growth of different river basins in China’s Yangtze River economic belt has evident regional variability, while there is very little research on the spatial influence of the digital economy promoting urban green innovation in China’s Yangtze River economic belt.
Overall, the contribution provided herein can be summarized in the following three aspects. Firstly, this paper develops an index system for measuring the urban digital economy development based on the five driving force dimensions, then examines its temporal and spatial distribution and evolution. Secondly, from the perspective of knowledge flow, the mechanism of the digital economy driving urban green innovation development is explored. Finally, this paper studies the driving effect and spatial effect of the digital economy on urban green innovation development.
The rest of this paper proceeds as follows.
Section 2 analyzes how the digital economy affects urban green innovation development and provides the research hypothesis.
Section 3 describes the methods and data.
Section 4 performs the spatial and temporal distribution and dynamic evolution of the urban digital economy development level in China’s Yangtze River Economic Belt.
Section 5 presents the empirical results and provides a thorough discussion.
Section 6 summarizes the conclusion and implications of the study.
2. Theoretical Analysis and Research Hypotheses
The digital economy, with its high technology and strong permeability, is the major driving factor supporting green innovation development [
30]. Firstly, at the enterprise level, the digital economy drives resource sharing and information circulation in all areas of enterprise production and operation. As a result, it lowers the cost of information communication and improves enterprise profitability, laying a material foundation for enterprises to engage in green innovation. Moreover, digitalization accelerated by the digital economy improves environmental information transparency and provides the governance foundation for the government to accurately control carbon emissions. Therefore, it can increase the intensity of environmental supervision and enterprise willingness to promote green innovation, and promotes the development of urban environmental green governance and green innovation. Secondly, at the industrial level, the digital economy encourages industrial digital transformation and innovative production technology development in the direction of green environmental protection, and it further deepens industry-university-research collaborations to increase the degree of green innovation by using digital information as an important input factor. Furthermore, the digital economy is concentrated on the environment-friendly Information and Communication Technology industry. It has the potential to minimize energy consumption and environmental pollution by restricting the expansion of highly polluting enterprises, while encouraging green innovation [
31]. Thirdly, at the consumer level, the digital economy accelerates the construction of consumers’ green consumption conceptions, raises the market share of green innovation goods, and facilitates urban green innovation development. Therefore, the following hypothesis is suggested.
H1. The digital economy drives urban green innovation development.
The digital economy drives urban green innovation development through multidimensional integration. First of all, within the city, the core of the digital economy aims to realize digital industrialization and industry digitization. According to the industrial agglomeration theory, the digital economy accelerates the recombination of inter-industry and intra-industry products and services, encourages the digital intelligent transformation of traditional industries, and then accomplishes industrial structure upgrading [
32]. According to the synergistic effect theory, industrial structure upgrading improves the productivity and utilization rate of factor resources, greatly reduces the damage to the urban ecological environment in the production process, and then encourages urban green innovation development. Therefore, industrial structure upgrading is an effective way for the digital economy to drive green innovation development.
Secondly, among cities, the digital economy broadens the range of digital application. On the one hand, the digital economy strengthens city connections and introduces sophisticated technological knowledge through cooperation and imitation, which accelerates the knowledge spillover created by city-to-city R&D collaboration. On the other hand, the expansion of the digital economy allows each subject to have access to more diverse information, and accelerates the knowledge spillover caused by scientific and technical innovation. Furthermore, new economic geographers argue that the spread and diffusion of knowledge between cities weakens economic activity boundaries, which has a significant impact on the spatial distribution of innovation activities, and encourages collaborative green technology innovation and intercity green innovation development. Cities can thus enjoy the benefits of the digital economy development on a larger scale, while also nurturing a healthy environment of innovative and sustainable development [
33]. As a result, knowledge spillover is a crucial way for the digital economy to drive urban green innovation development. In conclusion, we propose the following hypotheses:
H2. The digital economy contributes to industrial structure upgrading, which in turn promotes urban green innovation development.
H3. The digital economy facilitates knowledge spillover, which in turn boosts urban green innovation development.
Relying on information networks and data resources, the digital economy has formed a new economic form, which enhances the correlation of economic activities among cities in both breadth and depth [
34], and promotes the green innovation development of surrounding cities. Firstly, the digital economy overcomes the constraints of conventional economic transaction activities, increases cross-space connection across cities, which can establish a mutual penetration and high digital connectivity link, and generates the spatial spillover effect. Secondly, the digital economy accelerates the process of industrial digitization among industries via digital technologies such as artificial intelligence. As a result, it promotes the rapid and efficient flow of resource elements, enables adjacent cities to directly introduce advanced elements to each other, and promotes a virtuous cycle of urban green innovation development [
35]. Thirdly, as the digital economy develops, big data resources can be used to build a digital innovation system of information exchange and sharing. It can break down traditional information barriers and promote the space overflow of green innovation knowledge and the coordinated development of urban green innovation development. Based on this logic, the following hypothesis is proposed.
H4. The digital economy benefits green economic efficiency, not only in the local city but also in neighboring cities through the spatial spillover effect.
5. Empirical Results of the Digital Economy Driving Urban Green Innovation Development in China’s Yangtze River Economic Belt
5.1. Baseline Model Results
The benchmark regression results of the influence of the digital economy on urban green innovation development in China’s Yangtze River Economic Belt are shown in
Table 6. The control variables are added in column (2) on the basis of column (1), and the results all show that the digital economy development level significantly and positively promotes urban green innovation development, which verifies H1.
In
Table 6, columns (3), (4) and (5) test the driving effect of the urban digital economy development level on green innovation development in China’s Yangtze River economic belt by regions. The results show that the influence of urban digital economy development level on the green innovation development of downstream cities is significantly higher than that of other regions, demonstrating significant regional diversity.
Furthermore, in order to investigate the core driving factors of digital economy regional diversity, a regression analysis is performed on the driving effects of five digital economy driving dimensions on green innovation development in upstream, midstream, and downstream cities, respectively (the table is not listed due to the length limitation of this paper). The results show that for upstream cities, the driving force of the digital economy’s industrial foundation has a greater driving effect on green innovation development, while for midstream and downstream cities, the driving force of the digital economy’s information application has a greater driving effect on green innovation development. In other words, the digital economy’s driving effect is inclusive, with a general expanding tendency from developed to developing cities. The core driving factors point to a shift from the driving force of industrial foundation to the driving force of information application, and gaps in the digital economy development opportunities among cities may promote the formation of a green development trend in which the stronger will become stronger.
5.2. Mediating Effect Test
Table 7 shows the results from testing the mechanism function of industrial structure upgrading and knowledge spillover in which the digital economy drives urban green innovation development. According to the results in columns (1) and (2), the digital economy has a significant positive impact on industry structure upgrading and knowledge spillover. Columns (4) and (5) reveal that the mediating effects of industrial structure upgrading and knowledge spillover are both positive and significant, with the former having a bigger mediating effect, verifying H2 and H3.
Furthermore, in order to confirm whether there are significant differences in the mechanism function by which different driving forces drive urban green innovation development, the mediating effects are examined (the table is not listed due to the length limitation of this paper). The results indicate that knowledge spillover has the greatest mediating effect on green innovation development driven by the innovation development driving force, and industrial structure upgrading has the greatest mediating effect on green innovation development driven by the industrial foundation driving force, indicating that the mechanism effect of which the digital economy different driving forces drive green innovation development has significant structural differences.
5.3. Spatial Durbin Model Estimation Test
Prior to doing the spatial econometric analysis, the Moran test, LM test, and Hausman tests are performed, and the spatial and temporal fixed effect model is determined to be superior based on the maximum likelihood value. The Wald test and LR test are then conducted, and both pass the 5% significance level, suggesting that the SDM model outperformed the SAR and SEM models. To summarize, the SDM model is used in this paper to investigate the spatial effect of urban green innovation development driven by the digital economy (the results are shown in
Table 8). The results of Column (1) show that the spatial autoregressive coefficient and the interaction term coefficient are significantly positive for the full sample of China’s Yangtze River economic belt cities, demonstrating that the green innovation development of China’s Yangtze River economic belt not only has its own internal interaction effect, but also has an external digital economy interaction effect.
Furthermore, the total effect of the digital economy on urban green innovation development is decomposed. The direct effect is significantly positive, showing that there is a feedback effect, and the influence on the city can also benefit other cities. At the same time, the indirect effect is significantly positive, indicating that there is a significant spillover effect, with cities having a higher digital economy development level driving the green innovation development in surrounding cities. Columns (2), (3), and (4) indicate that the conclusions for the upper, midstream, and downstream regions are consistent with the conclusions for the full sample cities. Meanwhile, the indirect effect coefficient of the digital economy driving urban green innovation development in downstream cities is relatively large, indicating that the digital economy’s spatial spillover effect has significant regional heterogeneity. Above all H4 is verified.
Moreover, there can be local heterogeneity of spatial spillover effect of different urban economic profiles and industrial activities, which deserves further discussion. Firstly, given the significant differences of cities in preferential policies, innovation resources, and financial support at different administrative levels, we classify municipalities directly under the central government, sub-provincial cities, and provincial capitals as central cities, and other cities as peripheral cities. Columns (1) and (2) of
Table 9 show the results of the heterogeneous spatial spillover effect of digital economy development on urban green innovation development at various administrative levels. The digital economy has a significantly positive direct effect on both central and peripheral cities’ green innovation development. The spatial spillover effect is significantly positive in central cities but insignificant in peripheral cities. The possible reason is that central cities are frequently in the heart of regional economic development, with positive policy benefits and high-quality innovation elements. On the one hand, it can fully utilize the advantages of the digital economy and attract enough creative talent and R&D resources for urban green innovation development. On the other hand, it can rely on the digital platform to stimulate information flow and continuously lower the cost of green technology innovation, which can boost the urban green innovation development of its own as well as surrounding cities. For peripheral cities, they can shorten the geographical distance of technology exchange by relying on digital information networks and boost urban green innovation development. However, the digital economy develops slowly. and is mostly dependent on the radiating driving effect of central cities, making it difficult to generate a spillover effect to drive the development of surrounding cities. Therefore, in comparison to peripheral cities, the digital economy in the central cities starts earlier and develops quickly, and the technology is more mature, so these cities have the “first-mover advantage” and may reap more advantages from the digital economy.
Secondly, given the differences in the industrial structure of different urban development types, we adopt the division method recommended by the “National Strategy for Sustainable Development of Resource-Based Cities (2013–2020)”, published by the State Council, in which cities are categorized into resource-based and non-resource-based. The results of the heterogeneous spatial spillover effect of the digital economy on urban green innovation development of different development types are shown in Columns (3) and (4) of
Table 9. For non-resource-based cities, the direct effect and spillover effect of the digital economy on green innovation development are significantly positive. For resource-based cities, the direct effect of the digital economy on green innovation development is significantly positive, but the spillover effect is not significant. The reason may be that resource-based cities can improve production efficiency and reduce environmental pollution through the digital economy, promoting green innovation development, but the spillover effect is limited by a scarcity of scientific and technological skills and an imbalanced distribution of innovation sources between cities. Non-resource cities have an abundance of innovation resources and a highly developed digital economy development level, which decreases geographical spatial restrictions between cities, increases information overflow, and successfully encourages green innovation development in their own and surrounding cities.
5.4. Robustness Test
The following robustness tests were performed to confirm the results’ robustness and reliability:
- (1)
Replace the independent variable.
For regression analysis, the five driving factors of the digital economy are employed to replace the digital economy. The results are shown in columns (1) and (2) in
Table 10. (Only the first two with large coefficients are listed due to the length limitation of this paper). The five digital economy driving forces all have a significant influence on urban green innovation development (with the information application driving force having the greatest impact), which are consistent with the baseline regression results, and they have passed the robustness test.
- (2)
Replace the dependent variable.
The regression analysis was carried out using technology transformation efficiency instead of green innovation development efficiency, and the results are given in column (3) of
Table 10, which are consistent with the baseline regression results and pass the robustness test.
- (3)
Instrumental Variable Method.
To avoid the effect of internal issues such as the reverse causality relationship, the explanatory variable GIE’s first-order lag term is used as the instrumental variable for regression. Columns (4) and (5) of
Table 10 reveal the results. The
p-values of the KP-LM statistic are 0.000, significantly rejecting the null hypothesis that there is insufficient identification of instrumental variables. Meanwhile, the CD-Wald F statistic values are greater than the critical value at the 10% level of the stock-Yogo weak recognition test, rejecting the null hypothesis that there is weak recognition of instrumental variables. Overall, the chosen instrumental variable is effective. The regression results are consistent with the baseline regression, indicating that the research results are still robust after accounting for internal issues.
5.5. Discussion
The digital economy is an essential driving force supporting high-quality green development. China’s Yangtze River economic belt, as the golden support belt of China’s transformation and growth, is the primary carrying region of China’s digital economy development. Promoting its green transformation and innovation development is of great strategic significance to China’s high-quality development. However, its present development has obstacles in industrial transformation and upgrading, as well as the effective allocation of resources in space, which necessitates more driving forces to break through the constraints of existing resources. Our study results show that the digital economy not only directly drives urban green innovation development, but it also indirectly drives it by stimulating intra-city industrial structure upgrading and inter-city knowledge spillover. Furthermore, through the diffusion effect and spatial spillover effect, the digital economy affects urban green innovation development of its own and surrounding cities.
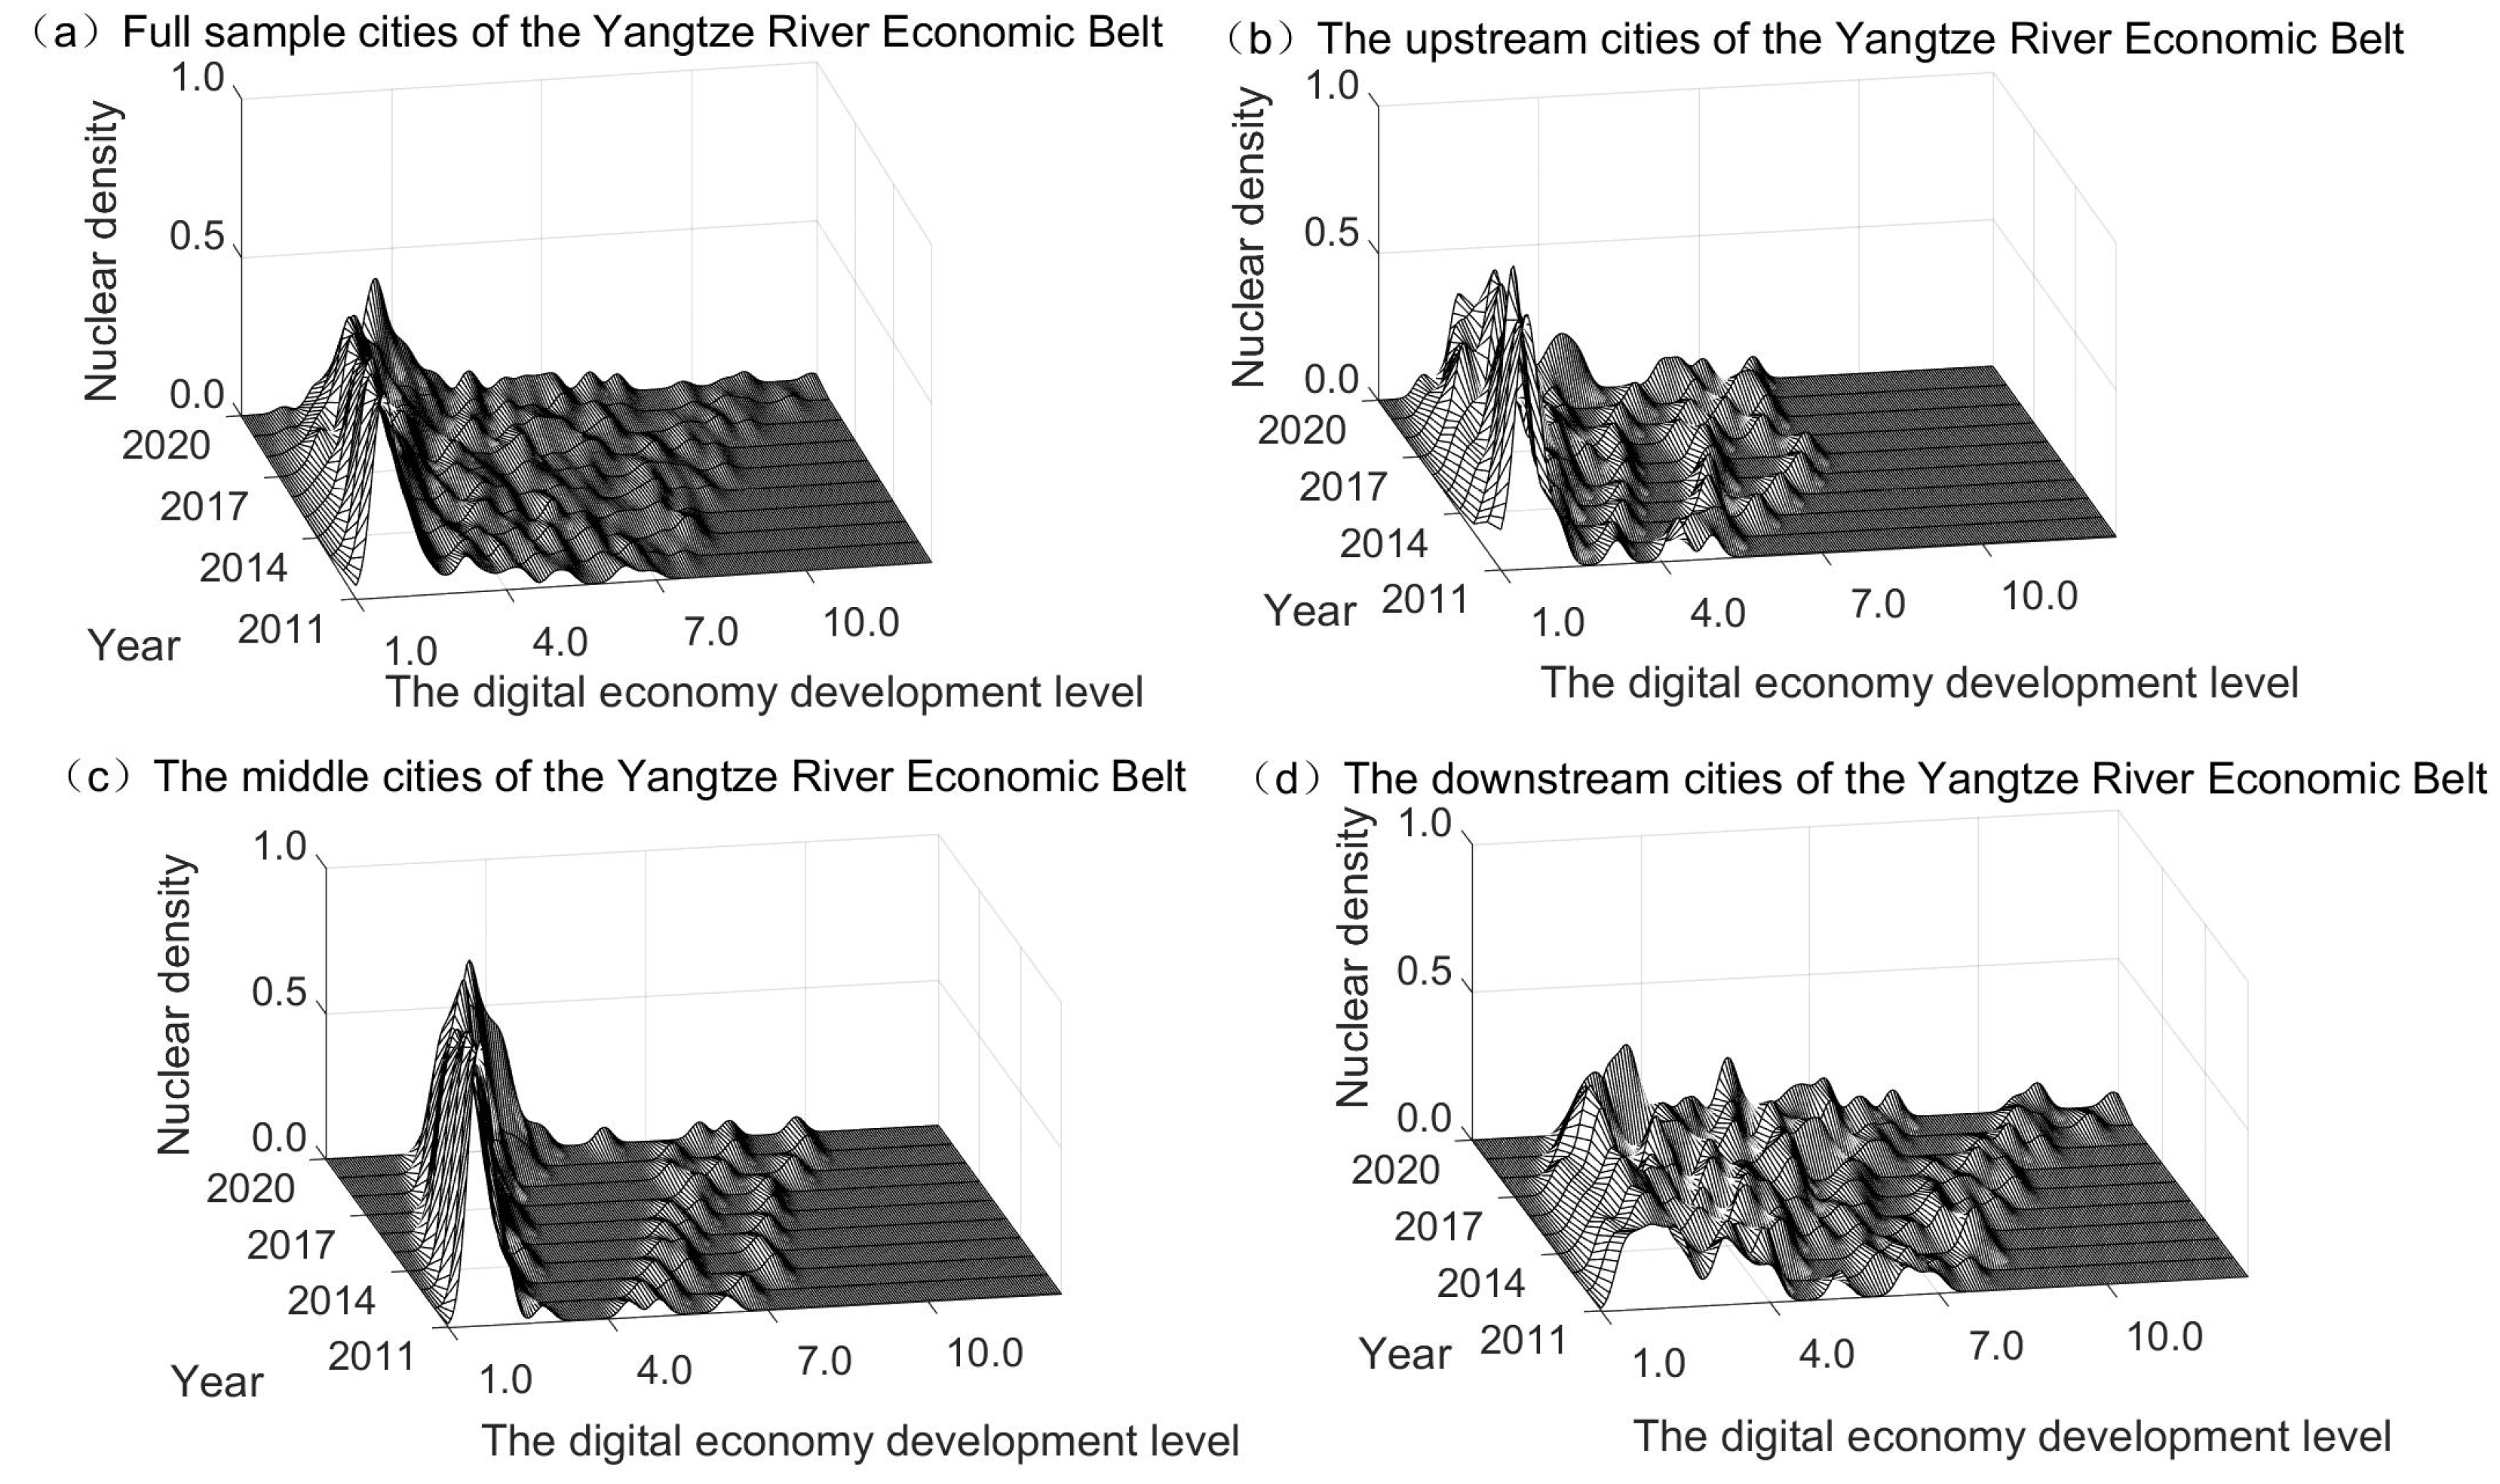
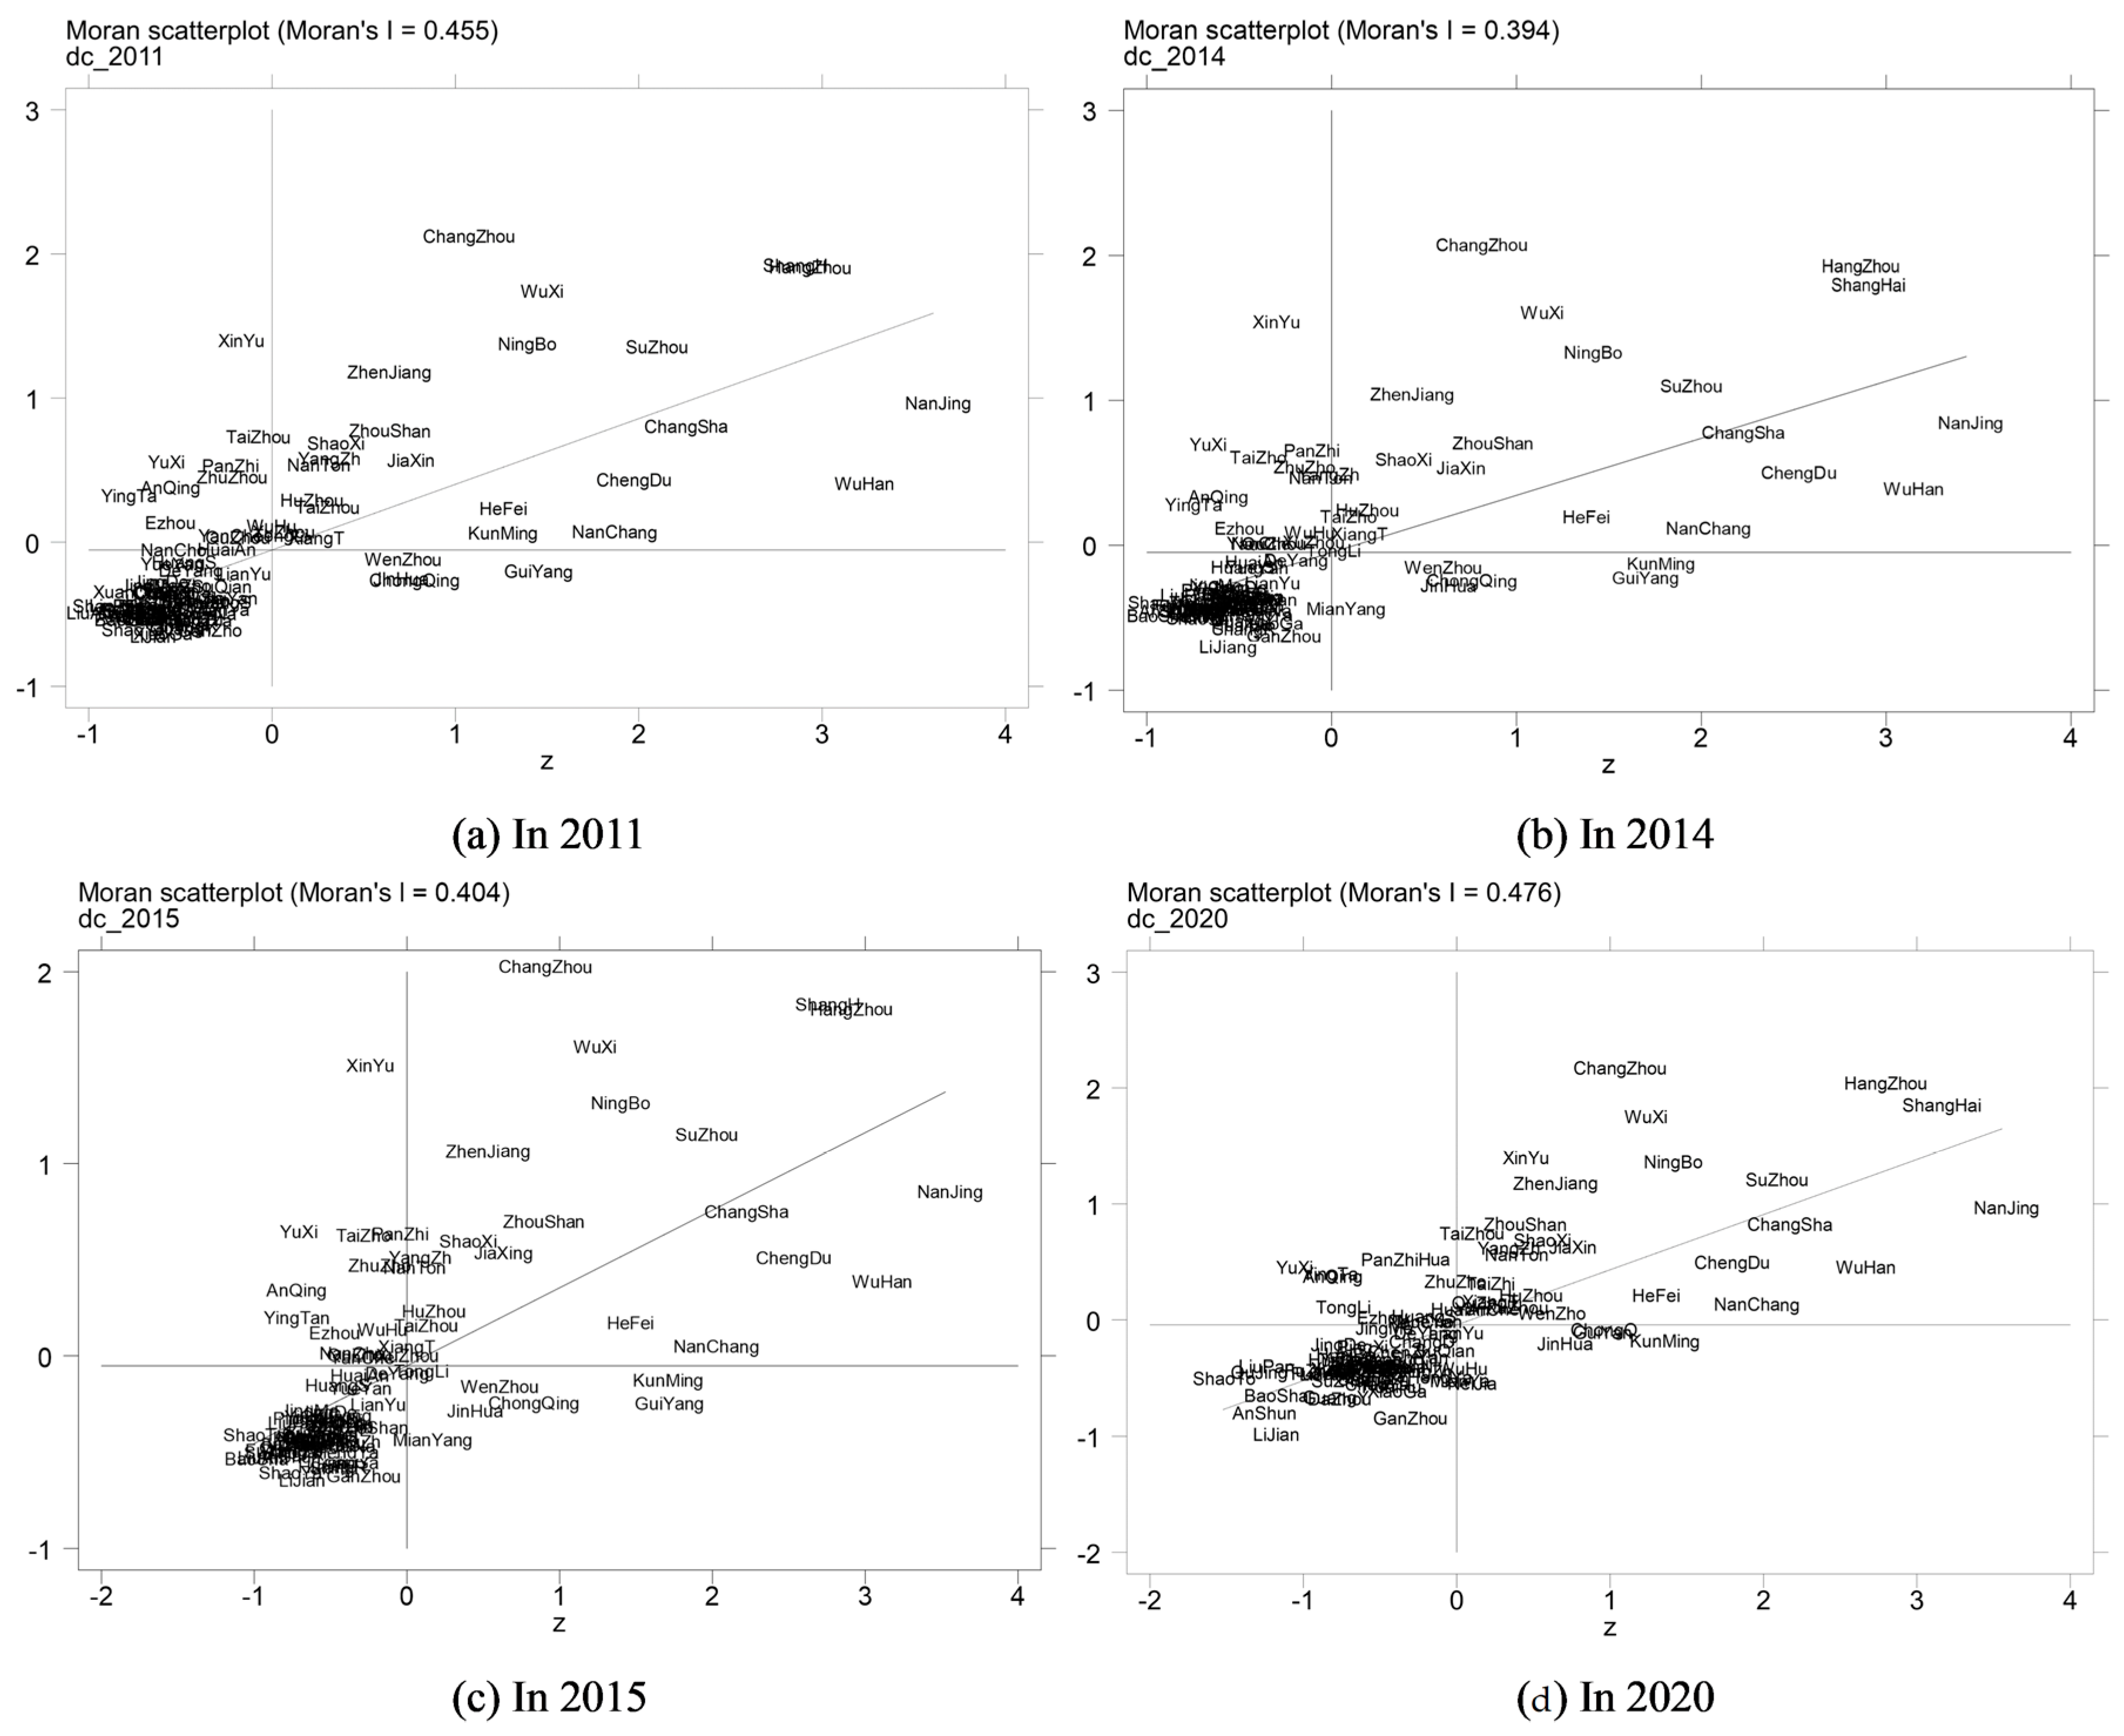
Although the result that the digital economy has a positive impact on green innovation development is consistent with existing research, there are many differences. First, this study developed an index system for measuring the urban digital economy development in China’s Yangtze River Economic Belt from 2011 to 2020 based on the five driving forces of market demand, information application, innovation development, industrial foundation, and policy system. It was measured at the city level and performed spatial analysis from the perspective of the nature of it as the new driving energy and new engine in this study, although researchers usually investigate and measure the digital economy development level at the national and provincial levels. Based on this, we discovered that the urban digital economy development in China’s Yangtze River economic belt has a clustering effect, and the gap is growing year by year. In terms of the upstream and midstream regions, the results are consistent with the full sample of cities, while the urban digital economy development level in downstream regions is unstable and changes often, and the absolute difference among the cities is minor. The urban digital economy development has a significant spatial dependence, and the spatial correlation decreases slightly and then gradually increases. This study scientifically describes the spatial and temporal distribution and dynamic evolution of the urban digital economy development level in Yangtze River economic belt.
Second, we discovered that the digital economy in China’s Yangtze River economic belt directly drives urban green innovation development and has structural and regional differences. The industrial foundation driving force is greater in upstream cities, whereas the information application driving force is greater in midstream and downstream cities. The digital economy also can indirectly promote urban green innovation development by stimulating intra-city industrial structure upgrading and inter-city knowledge spillover. Knowledge spillover has a stronger mediating effect on the driving effect of the innovation development driving force, while the industrial structure upgrading has a stronger mediating effect on the driving effect of the industrial foundation driving force. Previous studies have mostly focused on the function of intra-city mediators in the relationship between digital economy and green innovation development.
Third, the growth of different river basins in China’s Yangtze River economic belt has evident regional variability, while there are very few previous studies on the spatial influence of the digital economy promoting urban green innovation in China’s Yangtze River economic belt. This study results show that through the diffusion effect and spatial spillover effect, the digital economy affects urban green innovation development of its own and surrounding cities, with the spatial spillover effect of downstream cities being more significant. Moreover, the spatial spillover effect of the digital economy on urban green innovation development varies by urban administrative level and urban development type.
6. Conclusions and Implications
This study builds an indicator system for evaluating the digital economy development level from five driving force dimensions and investigates its temporal and spatial distribution and dynamic evolution. Based on this, we examine the driving effect, mechanism path, and spatial effect of the digital economy on urban green innovation development from the perspective of the driving force in China’s Yangtze River economic belt. The results indicate the following: Firstly, the urban digital economy development in China’s Yangtze River economic belt is characterized by a significant regional gradient difference of downstream > midstream > upstream, and the difference in the digital economy development level of upstream and midstream cities is increasing year by year, while the absolute difference in the digital economy development level of downstream cities is relatively small. In terms of space, the urban digital economy development is spatially dependent, and the overall tendency is toward high agglomeration evolution, with the agglomeration effect first marginally diminished and then steadily reinforced. Secondly, the digital economy in China’s Yangtze River economic belt significantly drives urban green innovation development and has structural and regional differences. The industrial foundation driving force is greater in upstream cities, whereas the information application driving force is greater in midstream and downstream cities. Thirdly, the digital economy can promote urban green innovation development by stimulating the industrial structure upgrading within cities and the knowledge spillover between cities. Knowledge spillover has a stronger mediating effect on the driving effect of innovation development driving force, while the industrial structure upgrading has a stronger mediating effect on the driving effect of the industrial foundation driving force. Fourthly, through the diffusion effect and the spatial spillover effect, the digital economy affects urban green innovation development of its own and surrounding cities, with the spatial spillover effect of downstream cities being more significant; that is, cities with higher digital economy levels in China’s Yangtze River Economic Belt can drive the green innovation development of surrounding cities. Fifthly, the spatial spillover effect of the digital economy on urban green innovation development varies according to a city’s administrative level. In the central cities with relatively high economic development levels, the spatial spillover effect of the digital economy plays a significant role in improving green innovation development, while in the peripheral cities, with a relatively regressive economy, this role is not significant. Sixthly, the spatial spillover effect of the digital economy on urban green innovation development varies by the city’s development type. In the non-resource-based cities with relatively significant innovation resources and a higher level of digital economy, the spatial spillover effect of the digital economy plays a significant role in improving green innovation development, while the effect is not significant in the source-based cities.
Based on the above research conclusions, this study provides the following policy implications, which are not only suitable for the Yangtze River Economic Belt, but also for other economically related regions and cities. First, the government can vigorously encourage the urban digital economy development in China’s Yangtze River Economic Belt, utilizing the digital economy’s position as a new engine for green development. On one hand, the government can guide the overall layout of the digital economy by regions and cities based on local circumstances. The government can increase the digital application level in manufacturing, e-commerce, and Internet finance in China’s Yangtze River economic belt’s downstream and midstream cities (or other cities with medium or low digital economy development levels). Meanwhile, companies are actively encouraged to carry out green technology innovation through industry-university-research collaborations to boost the supply of green digital technology and its digital content. For upstream cities (or other cities with relatively high digital economy development levels), the government can increase investment in the information and communication industries, as well as new digital infrastructures such as 5G base stations. Digital technologies should be deeply integrated with green manufacturing and pollution control, accelerating the overall layout of green innovation. On the other hand, the government can deepen the degree of internet application in government affairs, guide consumers’ consumption intentions with regard to green digital products, and ensure the positive and green investment in innovation, which can improve the urban green innovation efficiency.
Second, the government should fully use the multi-mechanism function of the digital economy’s driving force and improve top-level design. On the one hand, inside China’s Yangtze River economic belt cities, the government can strengthen the application of digital technology in the real economy and increase the number of electronic information manufacturing enterprises and Internet enterprises. It can strengthen the industrial foundation driving force of the digital economy, driving the transformation of various industries into green development and digitalization. On the other hand, among China’s Yangtze River economic belt cities, the government can highlight digital talent cultivation, and encourage and support cross-city technology R&D cooperation and communication for scientific research. It can increase the intensity of digital economy research and development and better utilize the green value and development payout of the digital economy. The suggestion is equally applicable to cities with a foundation for digital economy development. Meanwhile, different river basins of the Yangtze River Economic Belt have offered references at different stages of the digital economy development.
Finally, the government can pay attention to the digital economy’s development gap and stimulate the collaborative innovation development. To avoid a significant digital gap caused by unequal development opportunities among cities in China’s Yangtze River Economic Belt, the government can fully utilize the gradually increasing spatial dependence and agglomeration among cities, accelerating the radiating and driving role of cities with higher digital economy development levels. Meanwhile, based on the differences in policy tendency and industrial development in different regions of China’s Yangtze River Economic Belt, the government can adjust the development pace and resource orientation of the digital economy. Furthermore, the government can reinforce the overall linkage and resource allocation network among cities in China’s Yangtze River economic belt, improving overall green and innovative development. Cities at various development levels can share the benefits and dividends of green digital economy development. The recommendation also applies to a country or region that is dealing with the challenge of bridging the digital gap.
Although the study has enriched and supplemented the relevant research on the digital economy and green innovation development, and provided significant theoretical and practical implications for future policy formation and improvement to support the high-quality green innovation development of cities in China’s Yangtze River economic belt, there are still some limitations to the study that require improvement. First, since this study examines the driving effect of the digital economy on green innovation development using the city-level panel data of China’s Yangtze River economic belt, the research scope of follow-up studies can be expanded to the national or more micro-enterprise level to enrich the research in this field. Second, this study examines the mechanism of the digital economy on green innovation development from the two perspectives of inter-city knowledge spillover and intra-city industrial structure upgrading, without considering other variables (such as the proportion of state-owned enterprises in cities, etc.). Further studies can explore additional mechanisms and moderating variables in which the digital economy affects urban green innovation development. Third, the methods used in this paper are all relatively mature methods that are recognized by scholars in this field. Future research can try to use innovative methods to enrich the research results.


