Article

The Spatiotemporal Dynamic Impact Mechanism of Soil Greenhouse Gases under Precipitation Based on Environmental Law

1
Department of Humanity and Law, Wuhan Technology and Business University, Wuhan 430065, China
2
School of Civil Engineering, Shaoxing University, Shaoxing 312000, China
*
Authors to whom correspondence should be addressed.
Sustainability 2023, 15(8), 6959; https://doi.org/10.3390/su15086959
Submission received: 10 March 2023 / Revised: 10 April 2023 / Accepted: 12 April 2023 / Published: 20 April 2023

Abstract

:
There is a chain reaction between precipitation patterns and atmospheric greenhouse gases. Understanding the impact mechanism of the spatiotemporal dynamics of soil greenhouse gases under precipitation changes is of great significance, allowing for a more accurate assessment of soil greenhouse gas budgets under future precipitation patterns. In view of this, the research uses sensors to collect environmental sample data and gas concentration data, using Conv-LSTM to achieve data analysis. The research also introduces the kernel DM model to optimize the gas distribution modeling problem. Compared to manual periodic monitoring or gas monitoring using a single mobile robot, the gas distribution model used in this study is innovative. The innovation lies in its ability to capture global gas flow trends in data sampling and predictive analysis. The results show that when soil moisture changes between 5% and 35%, the soil carbon dioxide gas flux after the water addition treatment takes a 20% soil moisture level as the inflection point, showing a trend of first increasing, and then decreasing. This indicates that the mathematical model proposed in this study is effective in collecting and analyzing environmental data.

1. Introduction

Sustainable development refers to development that meets the needs of contemporary people without jeopardizing the ability of future generations to meet their own needs. In the “ecological crisis” facing mankind, ecological legal systems have been formulated to address and prevent major ecological issues. It is of great significance to establish and improve the ecological legal system to protect ecosystems such as forests and grasslands [1]. In recent years, global warming caused by the global greenhouse effect has been a hot issue in academia and the Internet. However, in the construction of sustainable development, there are both global warming and changes in precipitation, which are often ignored. Therefore, it is necessary to establish sound environmental laws in the legal system to ensure the sustainable development of ecosystems such as forests and grasslands. Significantly altered precipitation can also lead to serious climate crises, with irreversible effects on the structure and function of ecosystems [2]. A sustained decrease in precipitation can lead to droughts, while a sustained increase in precipitation can lead to floods. In addition, uneven distribution of precipitation will directly affect soil temperature and humidity and alter the amount of greenhouse gas emissions (GHG) or dispersion in the soil. For example, increased precipitation increases the enzymatic activity of many soil micro-organisms. The activation of enzymatic activity increases the rate of emission of nitrogenous and carbonaceous gases from the soil. Thus, the concentration of GHG, such as carbon dioxide and nitrous oxide, will increase after precipitation has occurred. In fact, soil microbial activity is interactive with plant roots, exerting a synergistic effect on soil GHG emissions. Moreover, the emission or diffusion of GHG varies from one depth of soil to another. However, studies have focused more on the processes of GHG fluxes in shallow or surface soils and have neglected the changes in the vertical direction of GHG in soils due to depth factors. Therefore, this study exhibits novelty. It focuses on studying the impact mechanism of different precipitation effects and different depths of soil on the spatiotemporal dynamic changes of GHG, and it also relies on and utilizes time series methods and recurrent neural networks to establish a model to describe the dynamic changes of soil GHG fluxes. Meanwhile, the kernel DM model optimizes the modeling of gas distribution. This allows the research object to be expanded in consideration of soil depth factors and the research method to be optimized in the spatiotemporal monitoring of gas distribution.
Many scholars have meticulously studied the direction of GHG dynamics. Wang B et al. argued that soil aggregation needs to be studied at a finer scale and used agglomerates as a micro-environment for soil matrices. The conclusions show that aggregate reactions significantly affect soil–atmosphere GHG exchange and may have global implications for carbon and nitrogen cycling [3]. Seager R. et al. proposed a new climate prediction model to study the impact of the tropical Pacific Ocean on regional climate variability. The conclusions show that the increase in GHG reduces the sea surface temperature gradient from west to east and from warm to cold in the equatorial Pacific. Meanwhile, it showed that using a simple formulation of tropical Pacific Ocean dynamics would provide an answer consistent with their observations [4]. D’Agostino R. et al. studied the precipitation and circulation patterns of the Northern Hemisphere monsoon. This study decomposes water vapor equilibrium into thermal and dynamic contributions. This suggests that the weaker response of the African, Indian, and North American monsoons to future global warming is due to a trade-off between these two components. The dynamic component is mainly governed by changes in the net terrestrial energy balance. It determines much of the response of the mid-Holocene terrestrial monsoon precipitation [5]. The team of Elveny M. et al. used an unstructured grid with complex geometry to numerically solve for heat and mass flux transfer to mitigate GHG pollution from plants. Results showed that NOx concentrations in the system increased with increasing temperature [6]. Tan L et al. conducted a global meta-analysis using a database of 209 sites to investigate the dynamic effects of natural wetland degradation on GHG. The results showed that this change in land use would lead to a reduction in CO2 consumption compared to that of natural wetlands [7]. Søndergaard M. et al. conducted high frequency measurements and monitoring of a 5 m deep eutrophic lake in Ormstrup (Denmark) over two years to study the dynamics of temporary stratification and its effects on oxygen concentration, nutrient cycling, GHG emissions, and fish habitat use. The results showed that during periods of hypoxia, GHG accumulated significantly at depths greater than 2–3 m [8].
Scholars have conducted diverse studies addressing the relationship between the role of precipitation and grassland ecosystems. Broderick C.M. et al. studied a modified long-term irrigation experiment to assess how past rainfall regimes affected carbon cycling in tall-grass grasslands. The results showed that positive legacy effects of irrigation on subsurface primary productivity persisted for at least three years and were evident in both high and dry water years. This is related to changes in the functional composition of plants [9]. The team of Matos I.S. et al. used a meta-analytic approach to assess the overall stability of grasslands in terms of resistance, resilience, and recovery. The results showed that grasslands were resilient and showed a trade-off between low resistance and high resilience [10]. Shi Y. et al. designed a three-element holistic analysis experiment to understand the relationship between nitrogen deposition and the role of precipitation. The results showed that reduced precipitation increased N2O emissions in arid and semi-arid nitrogen-limited ecosystems [11]. Griffin-Nolan R.J. et al. investigated the effect of precipitation on ecosystem dynamics in relation to the magnitude and timing of precipitation. The results showed that removing variability in the magnitude of precipitation is more effective in changing ecosystem dynamics than smoothing the time pattern of events, but the effect was greatest when both types of variability were removed [12]. Al-Yaari A. et al. studied the response of ecosystem productivity to climate variables in different biomes using three climate datasets for precipitation, temperature, or drought intensity. The results showed that shrubs, and to a lesser extent, evergreen forests, had persistent positive asymmetries. The (natural) grasslands appeared to have shifted from positive to negative anomalies over the last decade [13]. Shi Y. et al. conducted a three-factor experiment to understand the effects of changes in precipitation and nitrogen deposition on plant productivity. The results showed that the combined treatment of increased nitrogen fertilizer and reduced precipitation increased terrestrial primary productivity by 46% [14]. Pastore M.A. et al. designed preliminary experiments to assess the response of four functional groups of five perennial grassland species to individual and interactive global changes. The results showed that reduced precipitation increased photosynthesis in three functionally distinct species, possibly due to adaptation to low soil moisture. The impact of climate change on photosynthesis depends on species and precipitation, whether positive, neutral, or negative [15].
In summary, scholars have studied the dynamics of GHG mainly from the perspective of the micro-environment of the soil matrix and the dynamics of the tropical Pacific Ocean; in terms of the relationship between the role of precipitation and grassland ecosystems, scholars have mainly designed irrigation experiments or three-factor experiments for analysis. Fewer studies have modeled the mathematical analysis of environmental factors, as well as gas concentrations. It can be seen that there are few reports on the response of soil GHG fluxes to precipitation changes in the current profile. With the change in precipitation, biological and abiotic factors have also undergone collaborative changes. However, the relationship between these biological and abiotic factors and the spatiotemporal variability of soil GHG emissions is still unclear. It is necessary to understand the synergistic changes of biological and abiotic factors under rainfall changes and their relationship with the spatiotemporal dynamics of soil GHG. It is also of great significance for revealing soil GHG fluxes and their impact mechanisms in grassland ecosystems. In view of this, the present study will build a model based on time series and Conv-LSTM for analyzing the spatial and temporal dynamics of soil GHG to investigate the effects of temperature, humidity, and biological factors on GHG under the influence of precipitation.

2. Model Design for Dynamic Analysis of Soil GHG under Precipitation

2.1. Model Construction for Characterizing the Dynamics of Soil GHG Fluxes

The diffusive movement of GHG is a dynamic process in space and time [16,17]. It is essential to efficiently acquire and process information data on environmental factors and GHG concentration values. Consequently, the study combines a time series approach and a recurrent neural network. Both environmental data and GHG concentration values are sampled with the aid of sensors [18,19]. The sample acquisition system is shown in Figure 1. The system consists of data pre-processing, an abstracted graph structure of the spatial distribution of the sensors, a mapping unit, and an output sequence.
The spatial arrangement of the sensors consists of expressing the graph structure, constructing the sensor adjacency matrix, defining the connectivity, and the spatio-temporal data sequence [20,21]. Equation (1) is a mathematical expression for the abstract graph structure.
G = ( V , E ) V = v 1 , v 2 , , v N
In Equation (1), G represents the graph structure consisting of vertices and edge lengths; V represents the set of sensor nodes; and N represents the total number of sensor nodes. E is the set of edge lengths formed by two nodes connected to each other, and it is used to represent the effect that different sensors have on each other [22,23,24]. Equation (2) is the mathematical expression of the adjacency matrix.
A = R N × N , A E
In Equation (2), A represents the adjacency matrix, which serves to store node connectivity information. The adjacency matrix is attributed to the set of edge lengths. To reduce the number of parameters and increase the speed of the model calculation, the adjacency matrix will be shared in the network [25,26,27]. Equation (3) yields the sensor node connectivity definition.
a i j = 1 d i j 2 , a i j A
In Equation (3), a i j represents the connectivity; d i j represents the spatial distance between the sensor i and the sensor j . The longer the sensor node spacing, then the smaller the relationship between these two nodes acting on each other [28,29,30]. Equation (4) is a sequence of GHG concentration data.
X = x t n T , x t ( n 1 ) T , , x t , X R N × F , x t I R N × F
In Equation (4), n indicates the number of cycles; x t indicates the GHG concentration value collected by the sensor at t . Once the sensor data has been collected, the data needs to be analyzed using intelligent techniques. The time period of monitoring environmental data and GHG concentration data is long, and the spatial distribution of these data is wide. Hence, a Conv-LSTM neural network with time-expanded learning capability and spatial information analysis capability was chosen for the study [31,32]. Figure 2 shows the working principle of the LSTM neurons.
In Figure 2, c t indicates the amount of internal memory of the neuron, which serves to provide information about the data required for the next time step. h t denotes the state of the hidden layer; x t denotes the input data; and x denotes the processed data obtained by the activation function mapping. σ denotes the Sigmoid activation function. It is not difficult to determine that the LSTM neuron achieves control of the amount of the neuron state through the gating action, which results in a refined output [33,34,35]. Equation (5) is the mathematical expression for the input gate i t , the forgetting gate f t , and the output quantity o t after Conv-LSTM optimization.
i t = σ ( W x i x t + W h i H t 1 + W c i C t 1 + b i ) f t = σ ( W x f x t + W h f H t 1 + W c f C t 1 + b f ) o t = σ ( W x o x t + W h o H t 1 + W c o C t 1 + b o )
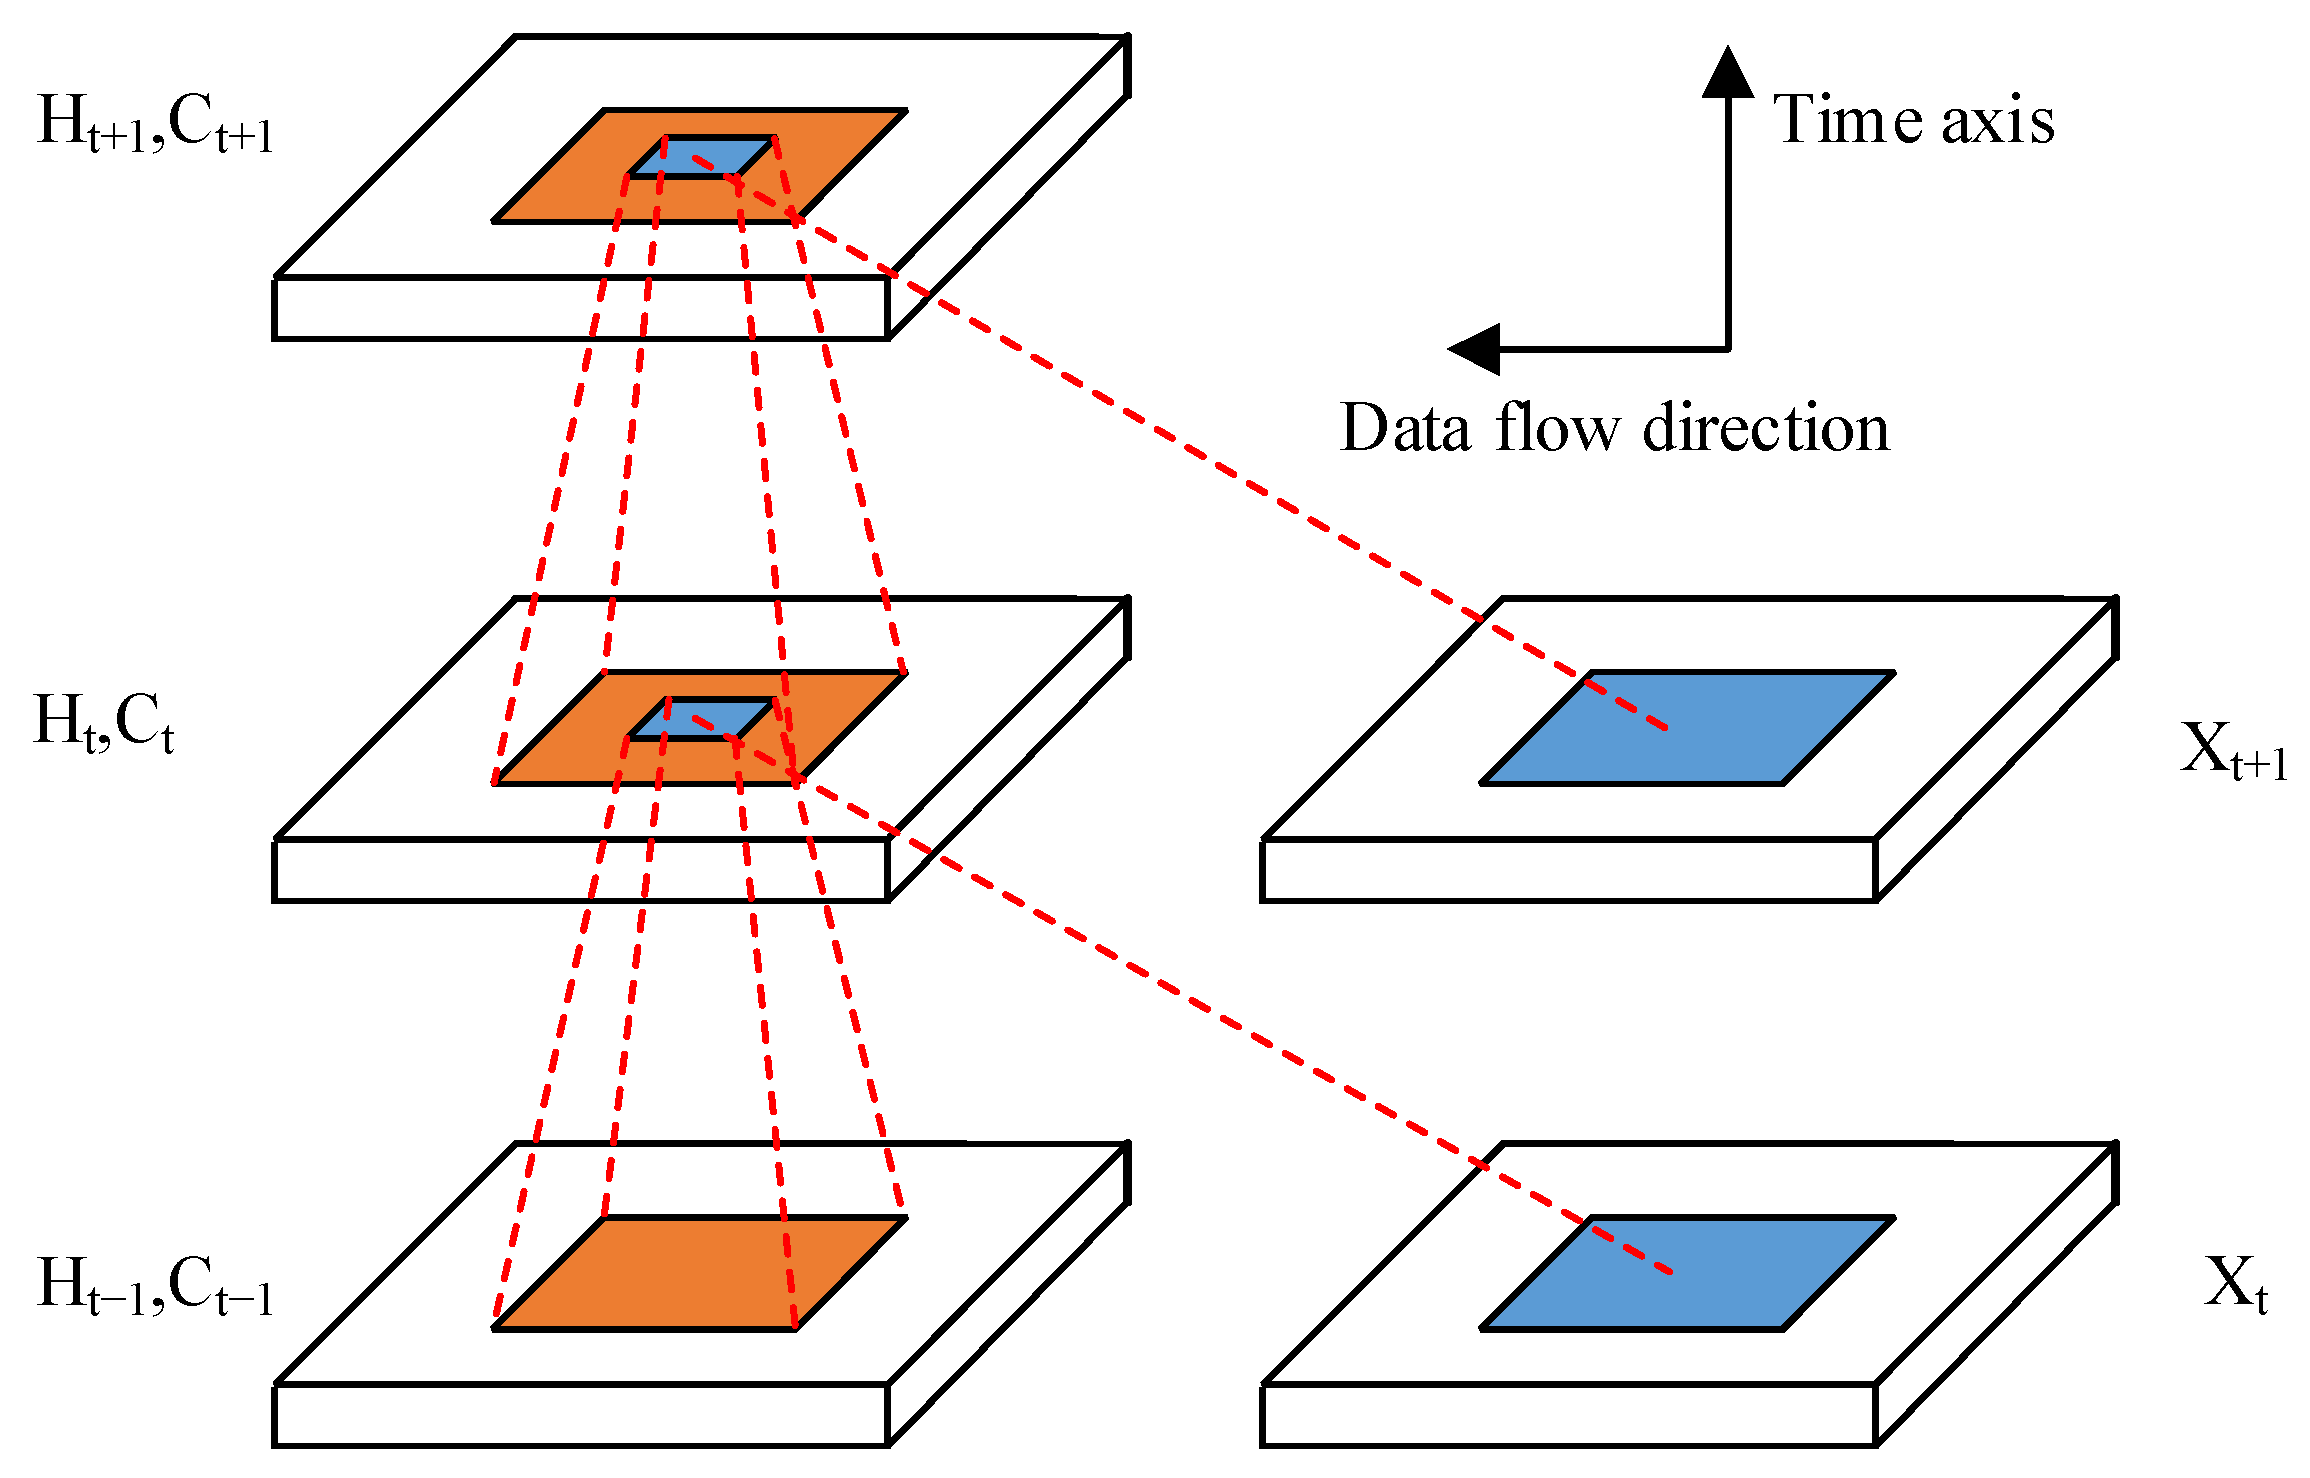
In Equation (5), W x , W h and W c are the weight values used to condition the sequence data, b The Conv-LSTM neural network has the ability to use the convolutional structure in the updating or transforming of state quantities. The full use of the convolution kernel is the core operation of the Conv-LSTM. Figure 3 shows the internal structure of the Conv-LSTM.
The grey shaded area in Figure 3 represents the convolution kernel. The larger the convolution kernel, the faster the model can capture dynamic data; the smaller the kernel, the more subtle the dynamic information that the model can capture. In addition, the model uses a fully connected layer for closure, so that a three-dimensional vector can be obtained from the input, the implied layer state, and the output. This enables the model to analyze spatial data information. To further capture the dynamic data features, this study introduces the spatial domain convolution method to create a feature structure map of the sampled points. Equation (6) is the mathematical expression.
x w t = j = k k x i + j w j + k + b
In Equation (6), x i + j denotes a univariate time series; w j + k denotes the weight values of discrete points in the univariate time series; denotes the sign of the convolution calculation; and x w t denotes the result of the convolution calculation of the t time series. To learn the level of importance of GHG concentrations at each moment in time, the study uses attention mechanisms to efficiently retrieve information. Attention mechanisms are usually divided into two categories: soft and hard. Soft attention mechanisms do not select a single piece of information, as do hard attention mechanisms, but calculate a weighted average of all input information. This feature makes it possible to cope with long periods of slowly changing gas movement processes. Hence, the soft attention mechanism was chosen for the study. Equation (7) is its corresponding mathematical expression.
C t = i = 1 n α i h i
In Equation (7), C t denotes the weighted sum of the series; α i denotes the weights; and h i denotes the sequence characteristics.

2.2. Construction of Spatiotemporal Variability Analysis Model for Soil GHG Flux

It is essential to gain a more comprehensive understanding of the variability of GHG driven by spatial and temporal variability. Consequently, optimizing gas distribution modeling is investigated, based on the kernel DM model. The kernel DM models were first used in applications such as tracing the sources of gases. Later, with the introduction of variance maps, they enabled the prediction of gas trends [36,37]. The principle of the model is essentially a density estimation. Figure 4 shows the overall flowchart for incorporating gas distribution modeling.
Figure 4 indicates that the model includes three parts: the sampling system, Conv-LSTM, and the gas distribution model. The gas distribution modeling Kernel DM serializes the collected gas concentration data in time to calculate the average concentration and average variance corresponding to the grid. Equation (8) is the modeling function for this model.
N x i x ( k ) , σ = 1 σ 2 π e x i x ( k ) 2 2 σ 2
In Equation (8), x i represents an arbitrary point in the environment; r i denotes the size of the weight of the measurement at the i point. k denotes the total number of cells obtained after the representative environment has been divided into several sub-environments [38]. Equation (9) is the formula for calculating the confidence map.
α ( k ) = 1 e ( Ω ( k ) ) 2 σ Ω 2
In Equation (9), Ω ( k ) indicates the importance weight of the weighted readings; σ Ω denotes the kernel width; and α ( k ) represents the confidence level of the k environmental cell. Equation (10) is the average gas concentration of the environmental cell [39].
r ( k ) = α ( k ) R ( k ) Ω ( k ) + 1 α ( k ) r 0
In Equation (10), R ( k ) indicates the weighted reading of the sensor; r ( k ) indicates the average gas concentration. The average concentration consists of the average of the sensor baseline concentration r 0 and the weighted average gas concentration R ( k ) Ω ( k ) . It should be noted that if the confidence level for an environmental cell is high, then the average gas concentration in that area will tend to be the weighted average concentration. Equation (11) shows the formula for calculating the cumulative weighted variance and the mathematical expression for the mean variance [40].
V ( k ) = i = 1 n N x i x ( k ) , σ r i r ( k ( i ) ) 2 v ( k ) = α ( k ) V ( k ) Ω ( k ) + 1 α ( k ) v 0
In Equation (11), r ( k ( i ) ) represents the predicted mean value of the environmental unit closest to the location x i . v ( k ) represents the mean variance, which is a combination of the mean variance of the whole population and the weighted variance. When in a high confidence region, v ( k ) tends to the weighted variance V ( k ) Ω ( k ) , and when in a low confidence region, v ( k ) tends to the overall mean variance v 0 . Since the gas concentration values do not represent flux values, the study needs to achieve a transformation between the two scales. Equation (12) is the mathematical expression for the GHG emission flux [41,42].
F ˜ = 16380 P M H 22691.2 ( 273 + T ) × d c d t
In Equation (12), F ˜ represents the GHG emission flux in m g m 2 h . P represents the atmospheric pressure; h P a M denotes the molecular mass of carbon or nitrogen atoms in one mole of GHG on average [43]. g m o l T denotes the sampling temperature in °C; H denotes the sampling height in m [44]. d c d t denotes the rate of change in gas concentration in μ L L min . Equation (13) reflects the non-linear relationship between soil temperature and soil GHG.
F ˜ = β e b T ¯
In Equation (13), T ¯ indicates the temperature of the soil layer at different soil depths. β , b denotes the temperature coefficient. Equation (14) is a mathematical expression for the diffusion flux of soil GHG [45].
F = D d C d Z
In Equation (14), F represents the GHG diffusion flux in units of m g m 2 h at different soil depths. D denotes the gas diffusion coefficient.

3. Results and Discussion

3.1. Influence of Abiotic Factors on GHG Fluxes in Grassland Soils under Precipitation

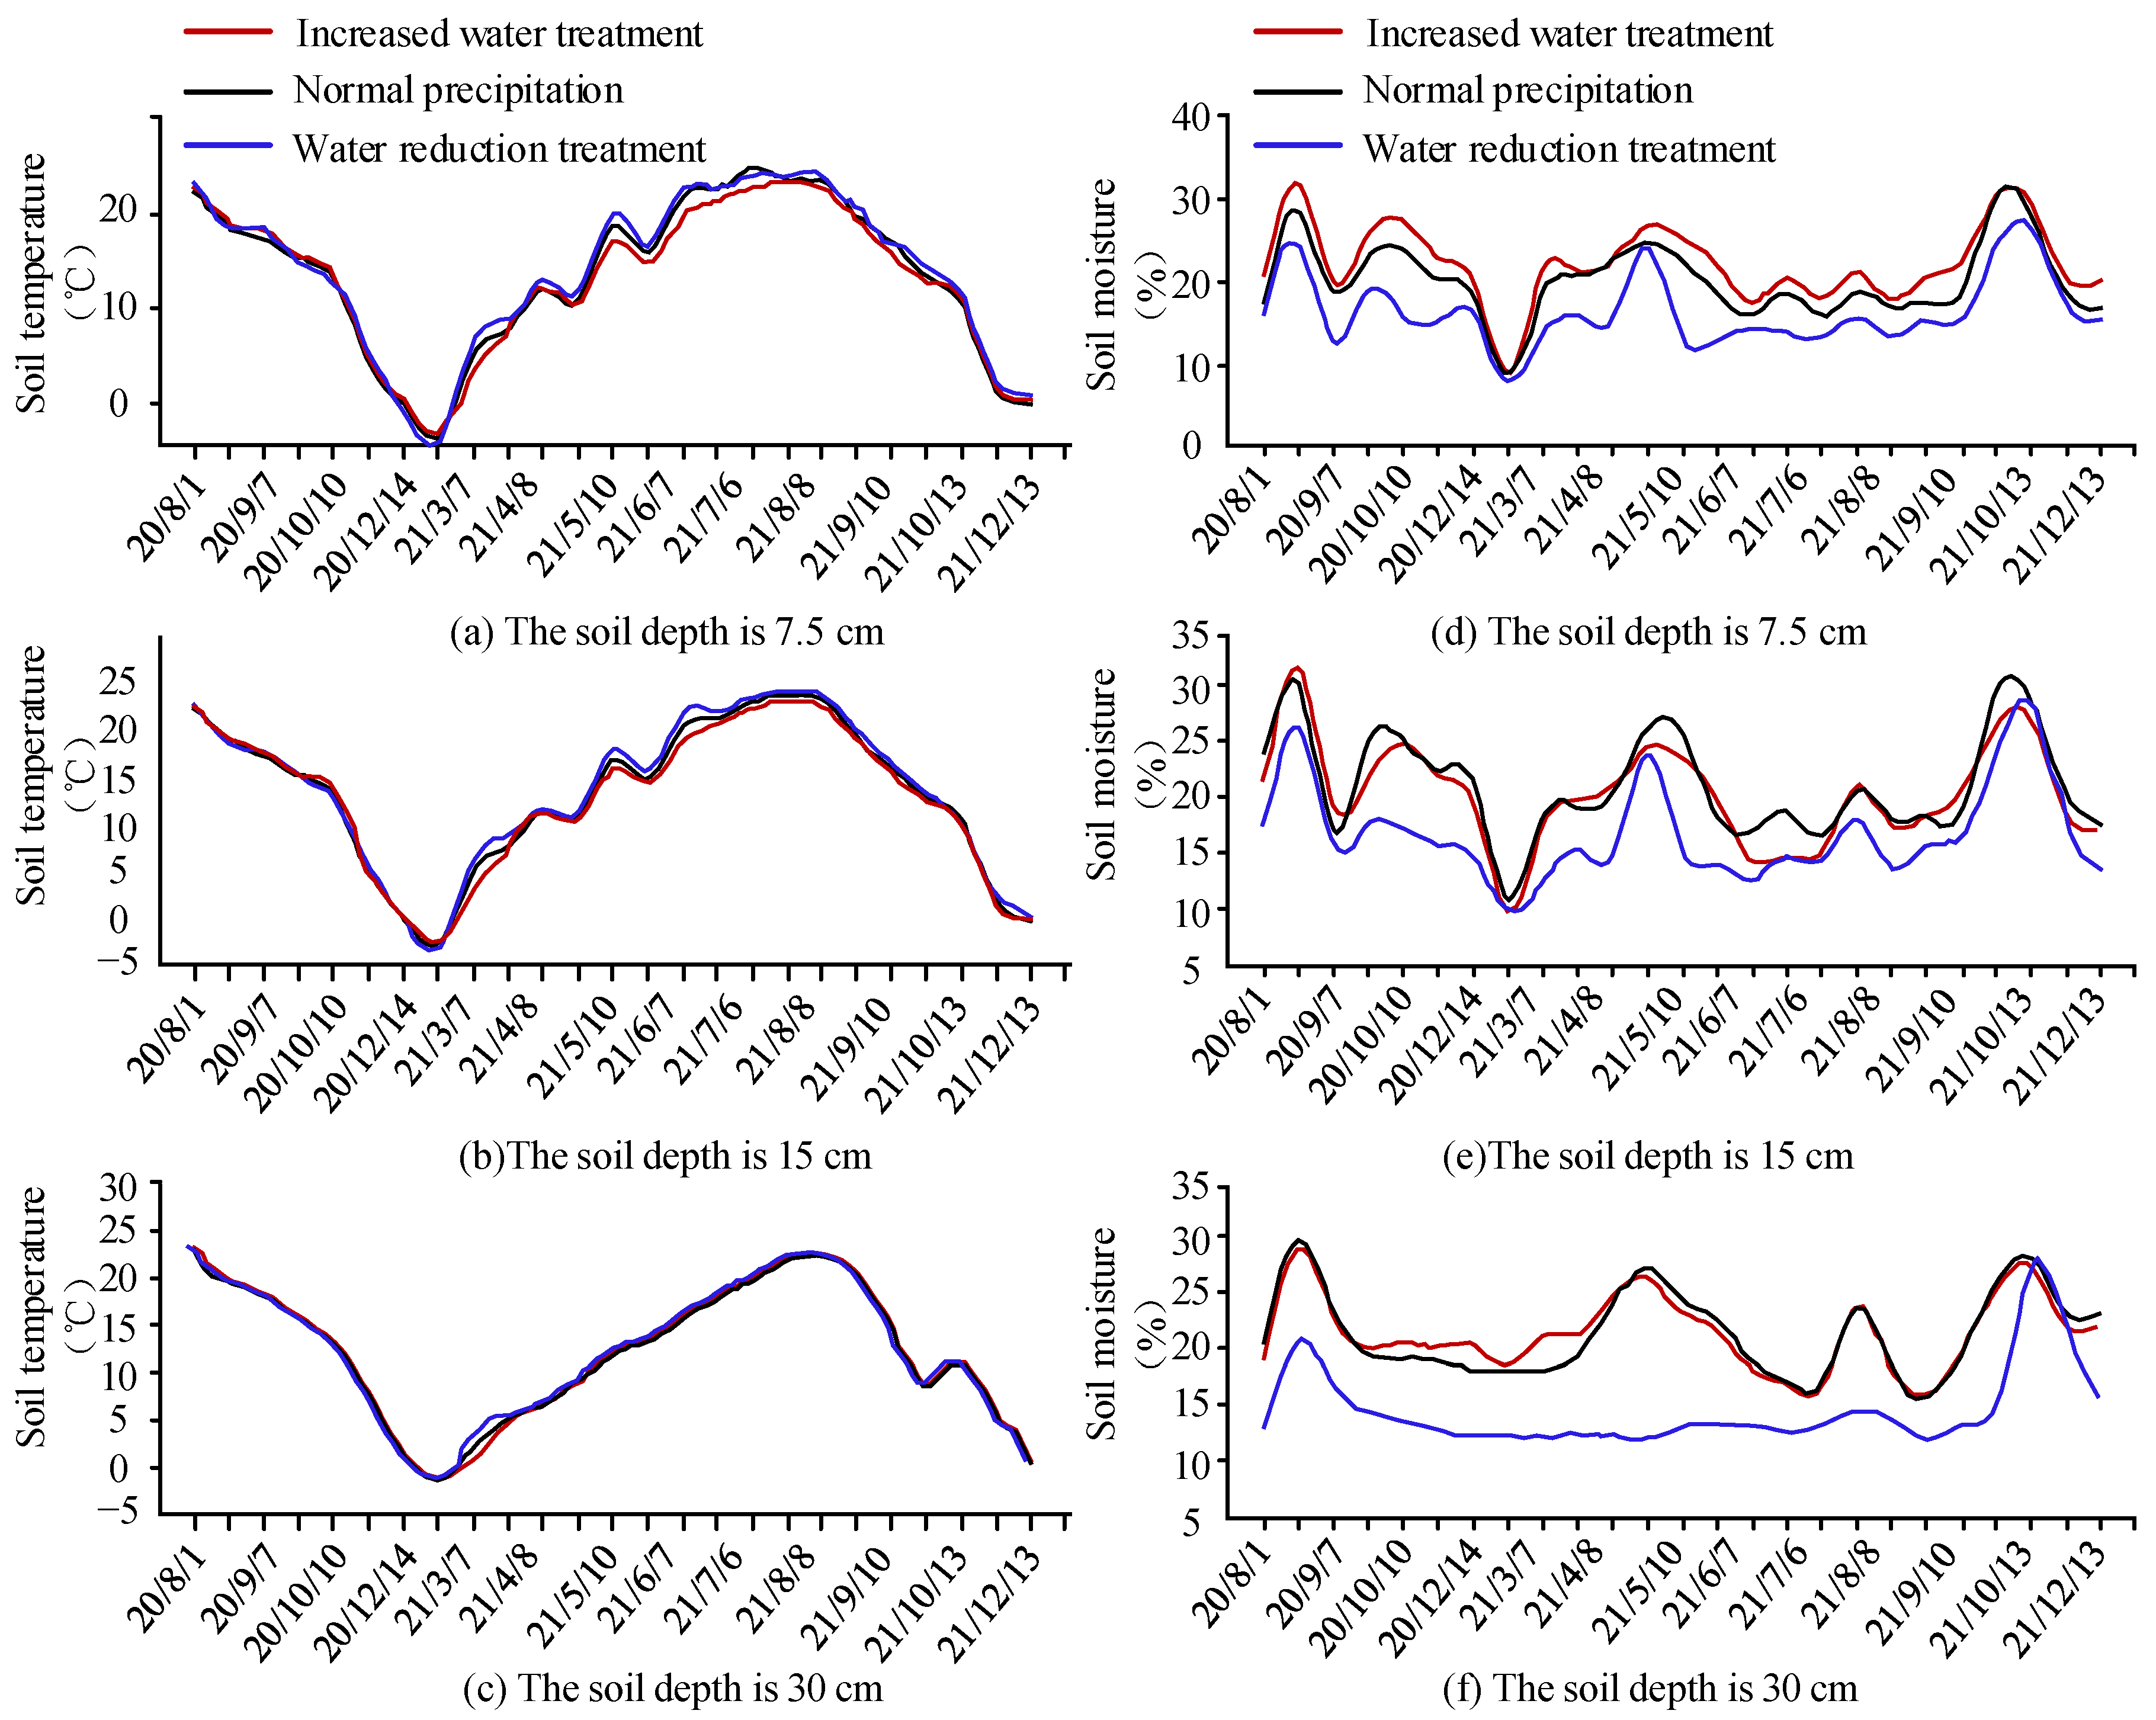
An agricultural grassland ecosystem in northwest China was selected for the study as a field observation. The average annual precipitation at this site is higher than 550 mm, and its total summer precipitation accounts for more than half of the total annual precipitation. The mean annual temperature at this site is below 10 °C. The soil type of the site is predominantly yellow cotton soil. Ten environmental units were randomly selected for the study, and the area of the environmental study unit was set at 4 * 3.5 m. The farmland grassland community was dominated by early grassland communities. Before planting, 45 g of urea and 300 g of compound fertilizer were applied to the soil to cover about 0.9. To control the variation in precipitation, the study used rain shelves, water storage buckets, and liquid drip irrigation devices to collect and distribute water in the environmental units in a controlled manner. The distribution of precipitation is divided into three control categories: normal precipitation, a 30% reduction in precipitation, and a 30% increase in precipitation. Temperature and humidity are important abiotic factors affecting soil GHG fluxes. The study first shows the temperature and humidity profiles at three soil depths for different precipitation levels, as seen in Figure 5.
The temperature dynamics curve on the left side of Figure 5 illustrates that temperature changes are more influenced by seasonal factors and less influenced by precipitation.
For the periods observed before 14 December 2020 and after 22 July 2021, the intervals of temperature change at all three soil depths (7.5 cm, 15 cm and 30 cm depth) for the three precipitation treatment conditions converged. Significant fluctuations occur sporadically as discrete points, and the maximum temperature difference between the normal precipitation condition and the other two conditions did not exceed 1.5 °C. For the intervals between these two periods, there is a certain continuity in soil temperature variation due to changes in precipitation, but the fluctuations are relatively small. When the soil depth is 7.5 cm, the maximum temperature difference between the normal precipitation condition and the increased and reduced water conditions is 2.6 °C and 1.8 °C, respectively. This maximum temperature difference value decreased by 1.1 °C and 0.7 °C; when the soil depth doubled, it decreased by 1.5 °C and 0.9 °C. This indicates that temperature trends hardly change with increasing soil depth. The doubling of soil thickness, however, cuts the temperature-altering effect of different precipitation amounts, but soil moisture showed large fluctuations with changes in working precipitation conditions. The soil moisture curve on the right-hand side of Figure 5 shows that, regardless of the precipitation condition, the soil moisture is significantly higher in the increased condition than in the normal and reduced conditions. For example, at a depth of 7.5 cm, the former soil moisture increased by a maximum of 4.2% and 9.8%, respectively, compared to the latter two. In addition, the soil moisture in the water-increasing condition tends to decrease as the soil depth multiplies, i.e., when the soil depth increased from 7.5 cm to 15 cm, the average soil moisture for this condition decreased by 2.1%. The average soil moisture for the water-reducing condition tends to increase and then decrease as the soil depth increases. Figure 6 shows the relationship between soil temperature and carbon dioxide gas flow at three soil depths.
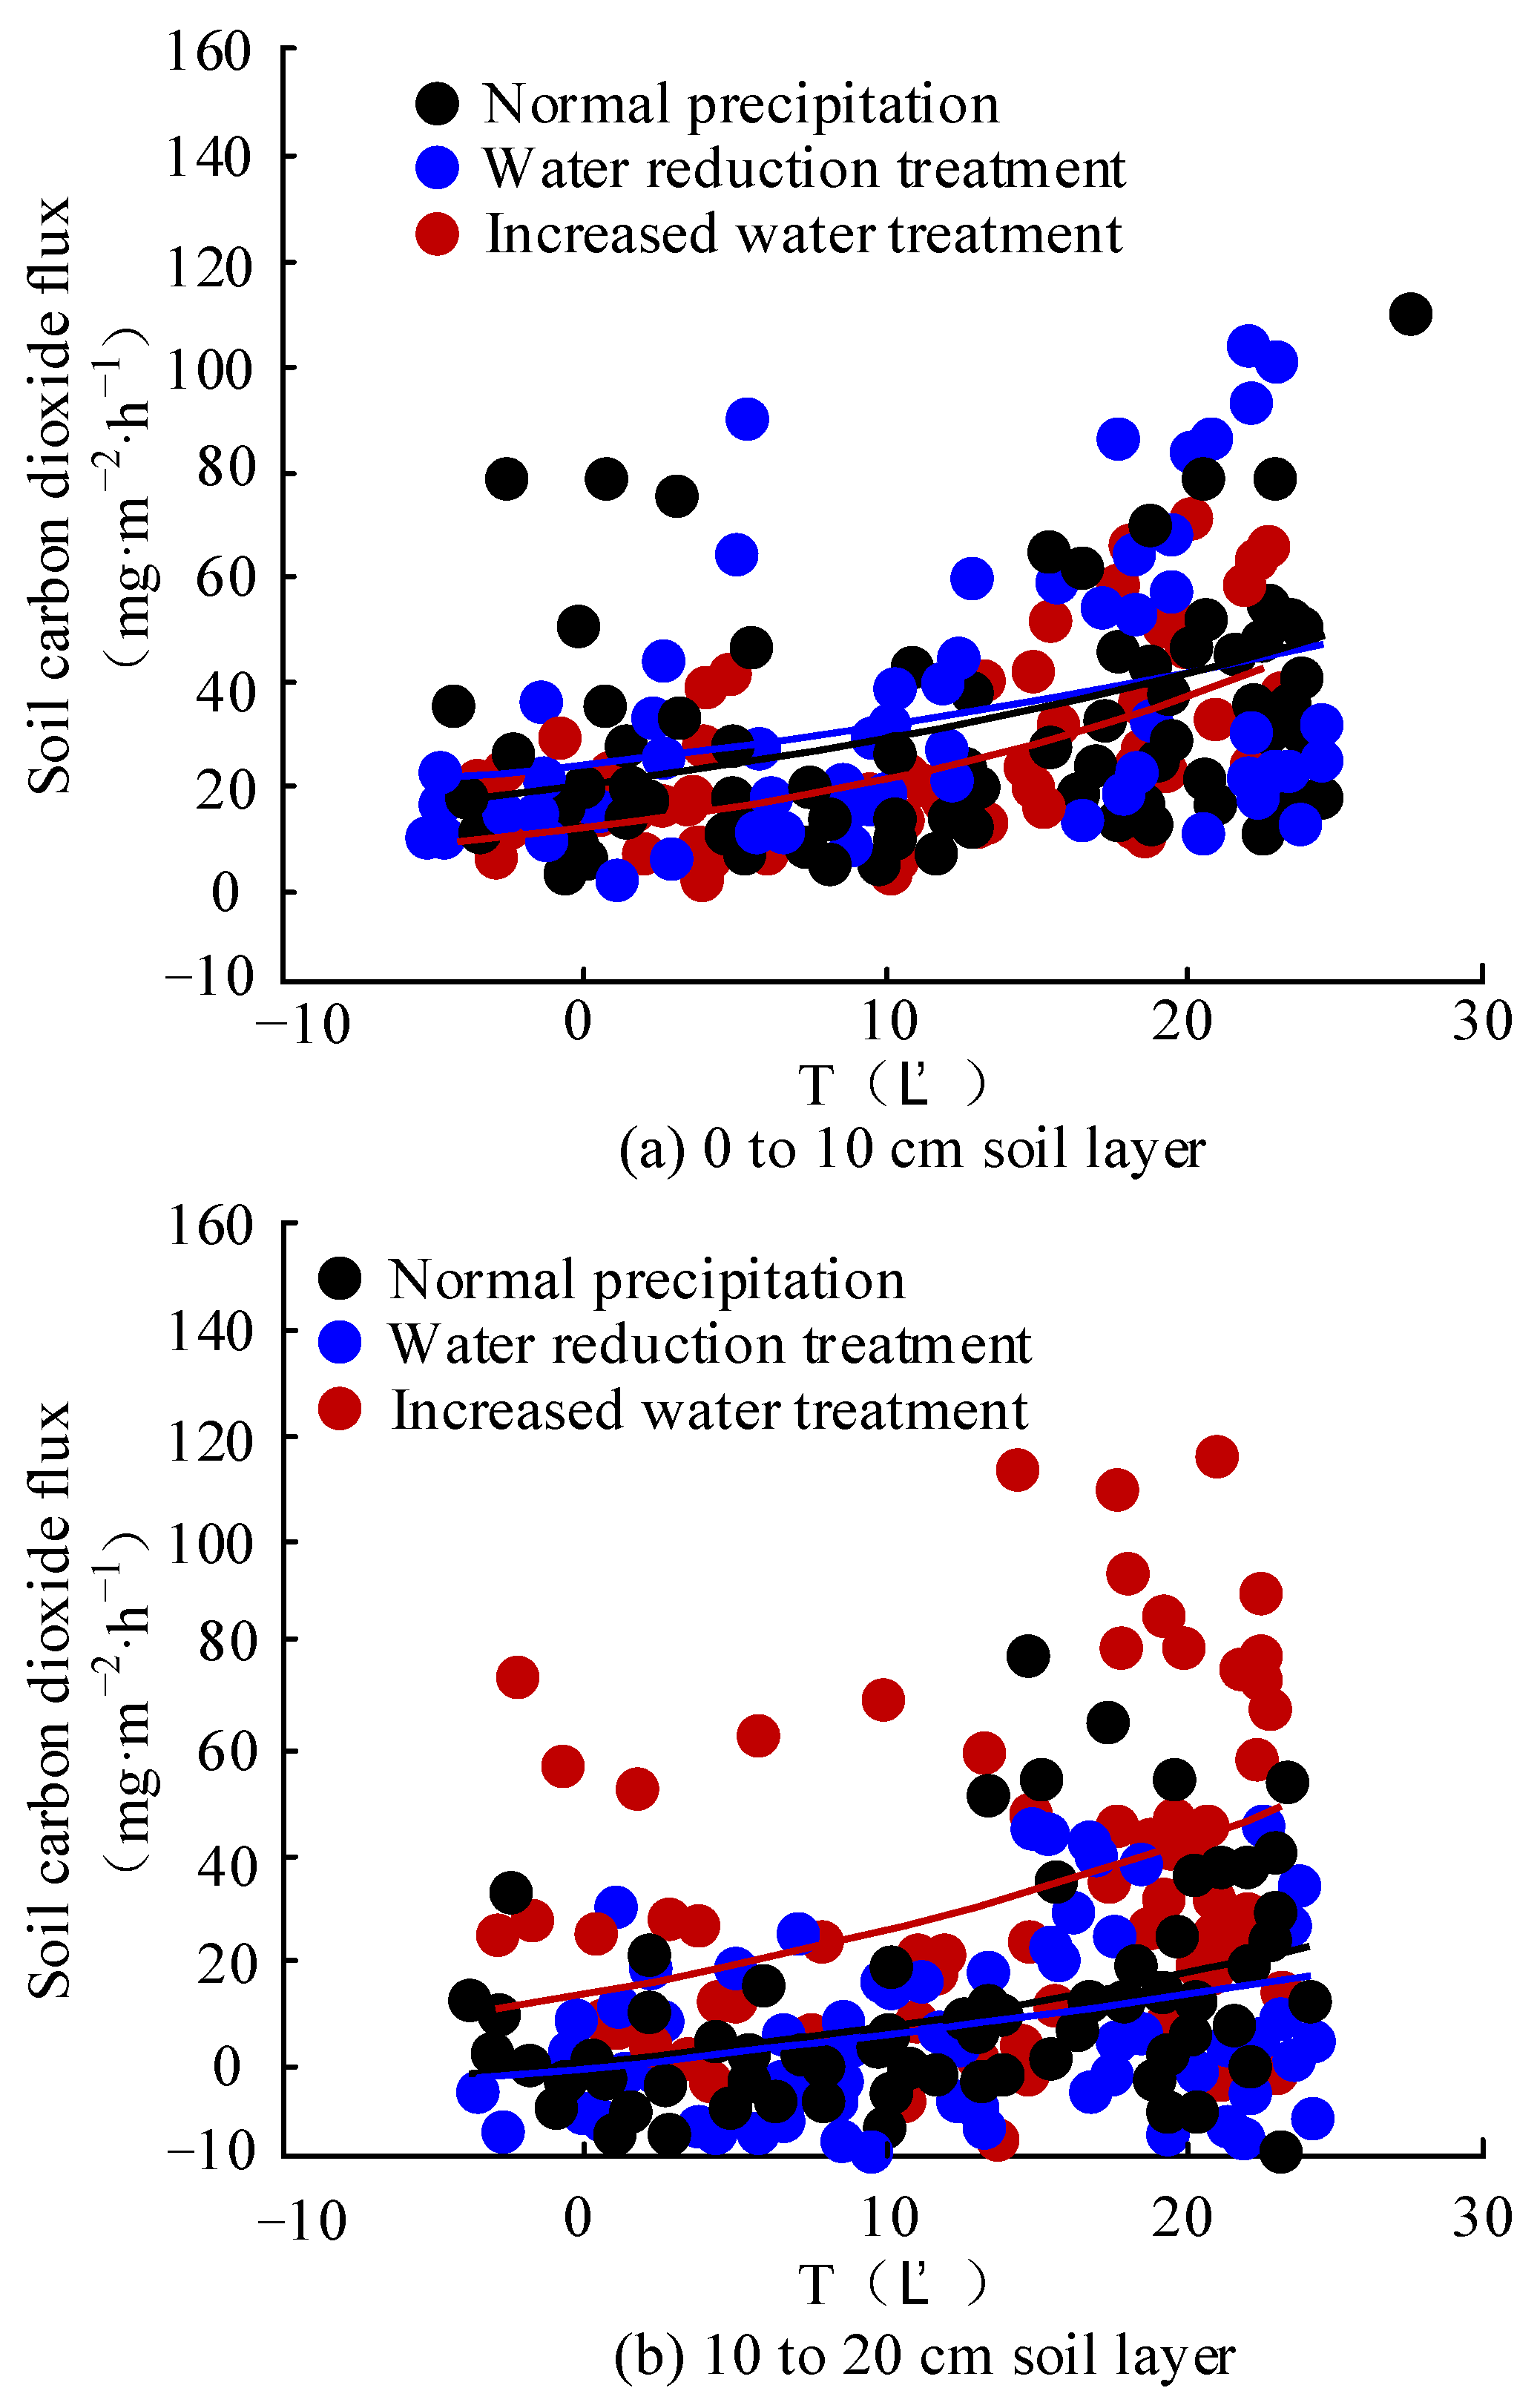
Figure 6 demonstrates that an increase in soil temperature brings about an increase in soil CO2 gas fluxes under varying amounts of precipitation and varying soil depths. For example, when increasing precipitation was applied to soils from 0 to 10 cm in depth and the soil temperature varied between [−10, 30] °C, the soil CO2 gas flux varied in the range of [10, 46] mg·m−2·h−1. When water reduction was applied to soils at this depth and the temperature varied in the same range, the CO2 flux varied in the range of [21, 45] mg·m−2·h−1. This also indirectly suggests that for soils at depths of 0–10 cm, increasing the precipitation treatment increases the temperature sensitivity of the soil. When the soil depth was increased by 10 cm (with no change in temperature interval), the flux of soil carbon dioxide gas after the water addition treatment ranged from [30, 67] mg·m−2·h−1, but at this point, the flux of soil carbon dioxide gas after the water reduction treatment ranged from [18, 38] mg·m−2·h−1. However, the water reduction treatment did not result in significant changes in GHG fluxes with increasing depth. Figure 7 shows the relationship between soil moisture and CO2 gas fluxes at different soil depths.
Figure 7a reflects the fitted curve of CO2 gas flux variation for soils from 0 to 10 cm in depth under different moisture conditions and different working precipitation treatment conditions. For this soil depth, when soil moisture varied between 5% and 35%, the soil CO2 gas flux after the water addition treatment showed an increasing trend, indicating a decreasing trend, with 20% soil moisture as the inflection point. When the soil moisture was in the [5%, 20%] range, the CO2 gas flux after the water increase treatment slowly climbed from 17 mg·m−2·h−1 to 36 mg·m−2·h−1; when the soil moisture was in the [20%, 35%] range, the gas flux gradually decreased from 36 mg·m−2·h−1 to 0 mg·m−2·h−1. At this time, the CO2 gas flux corresponding to the normal precipitation treatment was decreasing. As the quadratic curve was chosen as the fitted curve for this study, the plot does not show the fitted curve after the water reduction treatment. Figure 7b shows the CO2 flux curves for soils from 10 to 20 cm in depth for different precipitation treatments and for different soil moisture conditions. At this point, the fitted curves of gas fluxes obtained for both the water addition and normal precipitation treatments show a monotonically decreasing trend. When the soil moisture varied between 5% and 35%, the CO2 gas fluxes varied between [86, 37] mg·m−2·h−1 after the water enrichment treatment and [58, 27] mg·m−2·h−1 after the normal precipitation treatment.

3.2. Effect of Biotic Factors on GHG Fluxes in Grassland Soils under Precipitation

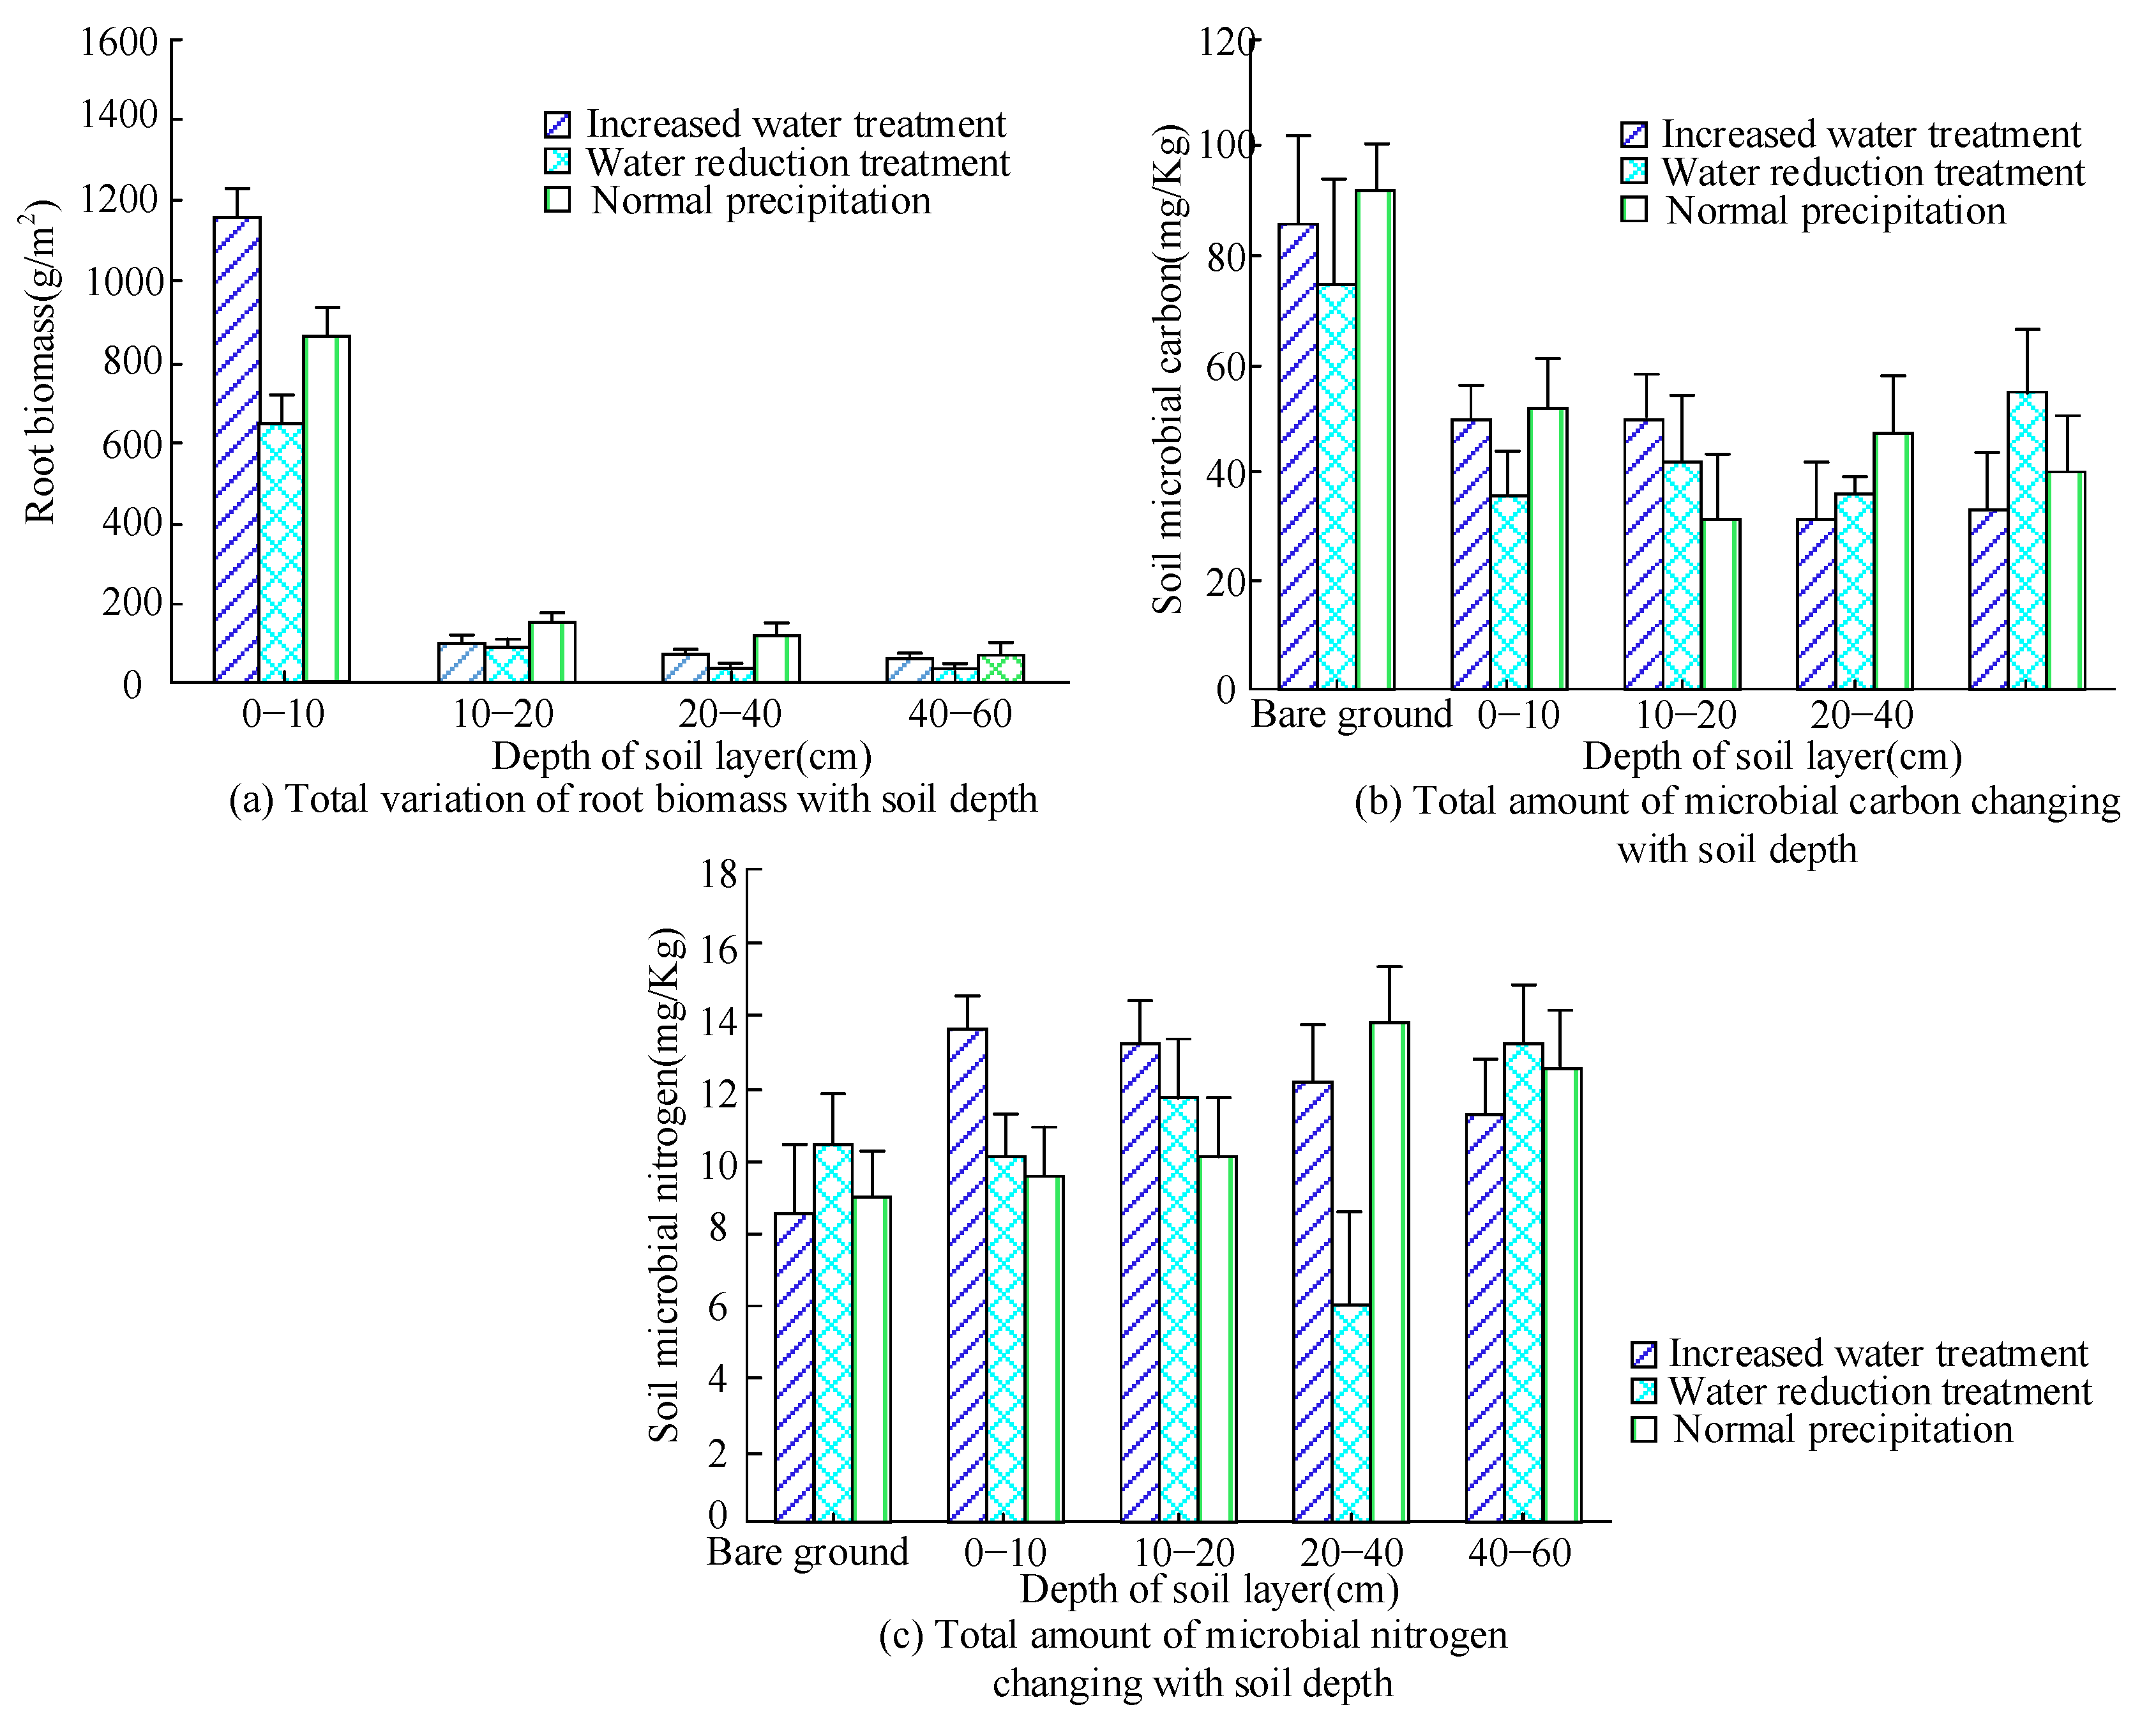
Abiotic factors such as temperature and humidity have a significant effect on soil GHG fluxes. Moreover, biotic factors, such as root biomass, soil microbial content, and soil enzymes, also have a quantitative relationship with soil GHG fluxes. Figure 8 shows the total variation of these three biotic factors with soil depth under different precipitation levels.
Figure 8a demonstrates that soil depths of 0 to 10 cm produce the highest root biomass, and the content is much higher than in deeper soil layers. This indicates that the grass roots in the study area are mainly located at a position of 0 to 10 cm. At this depth, the root biomass of the 0–10 cm soil layer under precipitation changes is characterized by increased water treatment (1160 g/m2) > normal precipitation (850 g/m2) > reduced water treatment (650 g/m2). This indicates that the root biomass is very sensitive to precipitation changes. Figure 8b illustrates that bare land has the highest microbial carbon content. When the soil depth is between 0 and 10 cm, the biological carbon content under normal precipitation treatment (52 mg/kg) > under increased water treatment (49 mg/kg) > under reduced water treatment (34.3 mg/kg). The fluctuation range is 3 mg/kg and 14.7 mg/kg. This indicates that increasing precipitation decreases soil microbial carbon. When soil moisture is high, it significantly inhibits soil microbial diversity, thereby reducing soil microbial biomass. Figure 7c illustrates that the soil biological nitrogen content fluctuates significantly under different precipitation treatments. When the soil depth is between 0 and 10 cm, the biological nitrogen content of increasing water treatment (13.8 mg/kg) > normal precipitation (9.5 mg/kg) > reduced precipitation (10.3 mg/kg), with the difference range of 0.8 mg/kg and 3.5 mg/kg. Unlike soil microbial carbon, soil microbial nitrogen in the 0–10 cm grassland treated with increased water is higher than that in the reduced water treatment and normal precipitation levels. This indicates that precipitation changes have different impacts on soil microbial groups. Table 1 shows the correlation coefficients between soil root biomass, biogenic carbon and nitrogen content, and soil GHG for the three precipitation treatments using Pearson analysis.
There was a significant correlation between root biomass and soil N2O fluxes under rainfall changes, with a correlation of 0.350, but there was no significant correlation between root biomass and soil CO2 and CH4 fluxes; There was no significant correlation between soil microbial carbon and nitrogen content and soil GHG flux under rainfall changes. Soluble organic carbon and soluble organic nitrogen are the direct sources of C and N nutrients required by plants. They are unstable in soil, easily decomposed and utilized by soil microorganisms, and they directly participate in the soil carbon and nitrogen cycle. Therefore, the reason for the above results may be that precipitation changes interfere with nitrification and denitrification in soil. Table 2 shows the results of the Pearson analysis of the correlation coefficients between soil biomass and soil GHG for the three precipitation treatments.
Table 2 illustrates that there was a significant correlation between BG, CBH, and LAP and soil N2O fluxes under precipitation changes. Only CBH had a significant correlation with soil CO2 fluxes. From the perspective of different precipitation treatments, there was no significant correlation between soil enzyme activity and soil GHG flux under increased water treatment; There was a significant correlation between BG, CBH, LAP, and NAG activities and soil N2O flux under reduced water treatment. There was a significant correlation between LAP activity and soil CO2 flux under normal precipitation.

4. Conclusions

The results showed that the doubling of soil thickness reduced the effect of different precipitation levels on temperature changes. With the doubling of soil depth, the soil moisture under increasing water conditions shows a decreasing trend. After increasing the depth, the increasing water treatment significantly increases greenhouse gas flux. In addition, the correlation detection results showed that there was no correlation between soil root biomass and carbon dioxide and methane gas fluxes. There is no correlation between biological enzymes and greenhouse gas flux under increased precipitation conditions. Therefore, this indicates the validity of the model proposed in the study for monitoring environmental data, as well as gas distribution. Due to the fact that the study area was experiencing a wet year during the test period, the results of water reduction treatment are more significant. Therefore, it is necessary to conduct longer time scale in situ observation tests to obtain more accurate changes in soil GHG under precipitation changes. In addition, the impact of the legacy effects of precipitation changes on soil GHG fluxes and soil biological and abiotic factors is still unclear; therefore, these effects will become an important research direction in the future.

Author Contributions

W.Z. and F.Z. conceived the research idea and designed the study. W.Z. collected the data. W.Z. and F.Z. performed data analysis. W.Z. wrote the paper. All authors have read and agreed to the published version of the manuscript.

Funding

This research received no external funding.

Institutional Review Board Statement

Not applicable.

Informed Consent Statement

Not applicable.

Data Availability Statement

The data used to support the findings of this study are available from the corresponding author upon request.

Conflicts of Interest

The authors declare no conflict of interest.

References

  1. Smith, P.; Soussana, J.F.; Angers, D.; Schipper, L.; Chenu, C. How to measure, report and verify soil carbon change to realize the potential of soil carbon sequestration for atmospheric greenhouse gas removal. Glob. Chang. Biol. 2020, 26, 219–241. [Google Scholar] [CrossRef] [PubMed]
  2. Post, A.K.; Knapp, A.K. The importance of extreme rainfall events and their timing in a semi-arid grassland. J. Ecol. 2020, 108, 2431–2443. [Google Scholar] [CrossRef]
  3. Nissen, S.; Cretney, R. Retrofitting an emergency approach to the climate crisis: A study of two climate emergency declarations in Aotearoa New Zealand. Environ. Plan. C Politics Space 2022, 40, 340–356. [Google Scholar] [CrossRef]
  4. Rosenbach, M.; Barbieri, J.S. The Climate Crisis Affects Us All. JAMA Dermatol. 2023, 159, 23–24. [Google Scholar] [CrossRef] [PubMed]
  5. Tschakert, P. More-than-human solidarity and multispecies justice in the climate crisis. Environ. Politics 2022, 31, 277–296. [Google Scholar] [CrossRef]
  6. Elveny, M.; Jalil, A.T.; Davarpanah, A. CFD-based simulation to reduce greenhouse gas emissions from industrial plants. Chem. React. Eng. 2021, 19, 1179–1186. [Google Scholar] [CrossRef]
  7. Tan, L.; Ge, Z.; Zhou, X.; Li, S.H.; Li, X.Z.; Tang, J.W. Conversion of coastal wetlands, riparian wetlands, and peatlands increases greenhouse gas emissions: A global meta-analysis. Glob. Chang. Biol. 2020, 26, 1638–1653. [Google Scholar] [CrossRef]
  8. Søndergaard, M.; Nielsen, A.; Skov, C.; Baktoft, H.; Reitzel, K. Temporarily and frequently occurring summer stratification and its effects on nutrient dynamics, greenhouse gas emission and fish habitat use: Case study from Lake Ormstrup (Denmark). Hydrobiologia 2023, 850, 65–79. [Google Scholar] [CrossRef]
  9. Smith, M.D.; Blair, J.M.; Broderick, C.M.; Wilkins, K. Climate legacies determine grassland responses to future rainfall regimes. Glob. Chang. Biol. 2022, 28, 2639–2656. [Google Scholar] [CrossRef]
  10. Matos, I.S.; Menor, I.O.; Rifai, S.W. Deciphering the stability of grassland productivity in response to rainfall manipulation experiments. Ecol. Biogeogr. 2020, 29, 558–572. [Google Scholar] [CrossRef]
  11. Shi, Y.; Wang, J.; Ao, Y.; Han, J.Y.; Guo, Z.H.H. Responses of soil N2O emissions and their abiotic and biotic drivers to altered rainfall regimes and co-occurring wet N deposition in a semi-arid grassland. Glob. Chang. Biol. 2021, 27, 4894–4908. [Google Scholar] [CrossRef]
  12. Griffin-Nolan, R.J.; Slette, I.J.; Knapp, A.K. Deconstructing precipitation variability: Rainfall event size and timing uniquely alter ecosystem dynamics. J. Ecol. 2021, 109, 3356–3369. [Google Scholar] [CrossRef]
  13. Al-Yaari, A.; Wigneron, J.P.; Ciais, P.; Ballantyne, A.; Ogée, J. Asymmetric responses of ecosystem productivity to rainfall anomalies vary inversely with mean annual rainfall over the conterminous United States. Glob. Chang. Biol. 2020, 26, 6959–6973. [Google Scholar] [CrossRef]
  14. Shi, Y.; Ao, Y.; Sun, B.; Zhang, J.W.; Guo, Z.H.H. Productivity of Leymus chinensis grassland is co-limited by water and nitrogen and resilient to climate change. Plant Soil 2022, 474, 411–422. [Google Scholar] [CrossRef]
  15. Pastore, M.A.; Lee, T.D.; Hobbie, S.E.; Peter, B.R. Interactive effects of elevated CO2, warming, reduced rainfall, and nitrogen on leaf gas exchange in Plant. Cell Environ. 2020, 43, 1862–1878. [Google Scholar] [CrossRef]
  16. Rajamani, L.; Jeffery, L.; Höhne, N.; Hans, F.; Ganti, G.; Glass, A.; Geiges, A. National ‘fair shares’ in reducing greenhouse gas emissions within the principled framework of international environmental law. Clim. Policy 2021, 21, 983–1004. [Google Scholar] [CrossRef]
  17. Garske, B.; Stubenrauch, J.; Ekardt, F. Sustainable phosphorus management in European agricultural and environmental law. Rev. Eur. Comp. Int. Environ. Law 2020, 29, 107–117. [Google Scholar] [CrossRef]
  18. Ye, M. Building an enabling legal environment: Laws and policies on social enterprises in China. J. Asian Public Policy 2021, 14, 182–199. [Google Scholar] [CrossRef]
  19. Law, K.L.; Narayan, R. Reducing environmental plastic pollution by designing polymer materials for managed end-of-life. Nat. Rev. Mater. 2022, 7, 104–116. [Google Scholar] [CrossRef]
  20. Buns, M.A. Making a model: The 1974 Nordic Environmental Protection Convention and Nordic attempts to form international environmental law. Scand. J. Hist. 2023, 48, 93–115. [Google Scholar] [CrossRef]
  21. Howard, T.M. Regulatory resistance to environmental law in rural Australia: Land clearing, murder and the media. Local Environ. 2020, 25, 130–146. [Google Scholar] [CrossRef]
  22. Fang, Z.; Kong, X.; Sensoy, A.; Cui, X.; Cheng, F.C. Government’s awareness of environmental protection and corporate green innovation: A natural experiment from the new environmental protection law in China. Econ. Anal. Policy 2021, 70, 294–312. [Google Scholar] [CrossRef]
  23. Gschwend, P.; MacFarlane, J.; Jensen, D.; Soo, J.; Saparbaiuly, G.; Borrelli, R.; Vago, F. In situ equilibrium polyethylene passive sampling of soil gas VOC concentrations: Modeling, parameter determinations, and laboratory testing. Environ. Sci. Technol. 2022, 56, 7810–7819. [Google Scholar] [CrossRef] [PubMed]
  24. Haupenthal, A.; Brax, M.; Bentz, J.; Jungkunst, H.F.; Schützenmeister, K.; Kroener, E. Plants control soil gas exchanges possibly via mucilage. J. Plant Nutr. Soil Sci. 2021, 184, 320–328. [Google Scholar] [CrossRef]
  25. Samuel, T.D.; Farai, I.P.; Awelewa, A.S. Soil gas radon concentration measurement in estimating the geogenic radon potential in Abeokuta, Southwest Nigeria. J. Radiat. Res. Appl. Sci. 2022, 15, 55–58. [Google Scholar] [CrossRef]
  26. Bakhshian, S.; Romanak, K. DeepSense: A Physics-Guided Deep Learning Paradigm for Anomaly Detection in Soil Gas Data at Geologic CO2 Storage Sites. Environ. Sci. Technol. 2021, 55, 15531–15541. [Google Scholar] [CrossRef]
  27. Osterholt, L.; Kolbe, S.; Maier, M. A differential CO2 profile probe approach for field measurements of soil gas transport and soil respiration. J. Plant Nutr. Soil Sci. 2022, 185, 282–296. [Google Scholar] [CrossRef]
  28. Chamindu Deepagoda, T.K.K.; Clough, T.J.; Jayarathne, J.; Thomas, S.; Elberling, B. Soil-gas diffusivity and soil-moisture effects on N2O emissions from repacked pasture soils. Soil Sci. Soc. Am. J. 2020, 84, 371–386. [Google Scholar] [CrossRef]
  29. Eskander, S.M.S.U.; Fankhauser, S. Reduction in greenhouse gas emissions from national climate legislation. Nat. Clim. Chang. 2020, 10, 750–756. [Google Scholar] [CrossRef]
  30. Azadi, M.; Northey, S.A.; Ali, S.H.; Edraki, M. Transparency on greenhouse gas emissions from mining to enable climate change mitigation. Nat. Geosci. 2020, 13, 100–104. [Google Scholar] [CrossRef]
  31. Weech, S. Changing Climate, Changing Terrain: The Stasis Metaphor and the Climate Crisis. J. Tech. Writ. Commun. 2022, 52, 94–109. [Google Scholar] [CrossRef]
  32. Ziegler, F.; Jafarzadeh, S.; Skontorp, H.E.; Winther, U. Greenhouse gas emissions of Norwegian seafoods: From comprehensive to simplified assessment. J. Ind. Ecol. 2022, 26, 1908–1919. [Google Scholar] [CrossRef]
  33. Xu, X.; Sharma, P.; Shu, S.; Lin, T.; Ciais, P. Global greenhouse gas emissions from animal-based foods are twice those of plant-based foods. Nat. Food 2021, 2, 724–732. [Google Scholar] [CrossRef]
  34. Nicholson, S.R.; Rorrer, N.A.; Carpenter, A.C.; Beckham, G. Manufacturing energy and greenhouse gas emissions associated with plastics consumption. Joule 2021, 5, 673–686. [Google Scholar] [CrossRef]
  35. Zhai, H.; Xiong, W.; Li, F.; Yang, J.; Su, D.Y.; Zhang, Y.J. Prediction of cold rolling gas based on EEMD-LSTM deep learning technology. Assem. Autom. 2021, 42, 181–189. [Google Scholar] [CrossRef]
  36. Gambiroža, J.Č.; Mastelić, T.; Kovačević, T.; Čagalj, M. Predicting low-cost gas sensor readings from transients using long short-term memory neural networks. IEEE Internet Things J. 2020, 7, 8451–8461. [Google Scholar] [CrossRef]
  37. Shu, L.; Liu, Z.; Wang, K.; Zhu, N.N.; Yang, J. Characteristics and Classification of Microseismic Signals in Heading Face of Coal Mine: Implication for Coal and Gas Outburst Warning. Rock Mech. Rock Eng. 2022, 55, 6905–6919. [Google Scholar] [CrossRef]
  38. Wang, D.; Zhao, L.; Hao, T.; Du, Y.; Shen, J.T. Multiple Sequence Long and Short Memory Network Model for Corner Gas Concentration Prediction on Coal Mine Workings. ACS Omega 2022, 7, 37980–37987. [Google Scholar] [CrossRef]
  39. Liu, J.; Cheng, L.; Yao, D.; Wang, K.K.; Zhao, X.T.; Xu, W.X. Polluted gas quantitative detection in multi-gas sensor based on bidirectional long-short term memory network. Int. J. Model. Identif. Control. 2020, 36, 24–33. [Google Scholar] [CrossRef]
  40. Sun, J.; Tian, L.; Chang, J.; Kolomenskii, A.; Schuessler, H.A. Adaptively optimized gas analysis model with deep learning for near-infrared methane sensors. Anal. Chem. 2022, 94, 2321–2332. [Google Scholar] [CrossRef]
  41. Jung, H.T. The present and future of gas sensors. ACS Sens. 2022, 7, 912–913. [Google Scholar] [CrossRef] [PubMed]
  42. Dike, V.N.; Lin, Z.; Fei, K. Evaluation and multimodel projection of seasonal precipitation extremes over central Asia based on CMIP6 simulations. Int. J. Climatol. 2022, 42, 7228–7251. [Google Scholar] [CrossRef]
  43. Georgescu, M.; Broadbent, A.M.; Balling, R.C., Jr. Effect of increased greenhouse gas concentration on mean, extreme, and timing of precipitation over Arizona (USA). Int. J. Climatol. 2022, 42, 3776–3792. [Google Scholar] [CrossRef]
  44. Zhu, Y.; Yu, K.; Wu, Q. Seasonal precipitation and soil microbial community influence plant growth response to warming and N addition in a desert steppe. Plant Soil 2023, 482, 245–259. [Google Scholar] [CrossRef]
  45. Zhou, J.; Zhang, J.; Lambers, H. Intensified rainfall in the wet season alters the microbial contribution to soil carbon storage. Plant Soil 2022, 476, 337–351. [Google Scholar] [CrossRef]
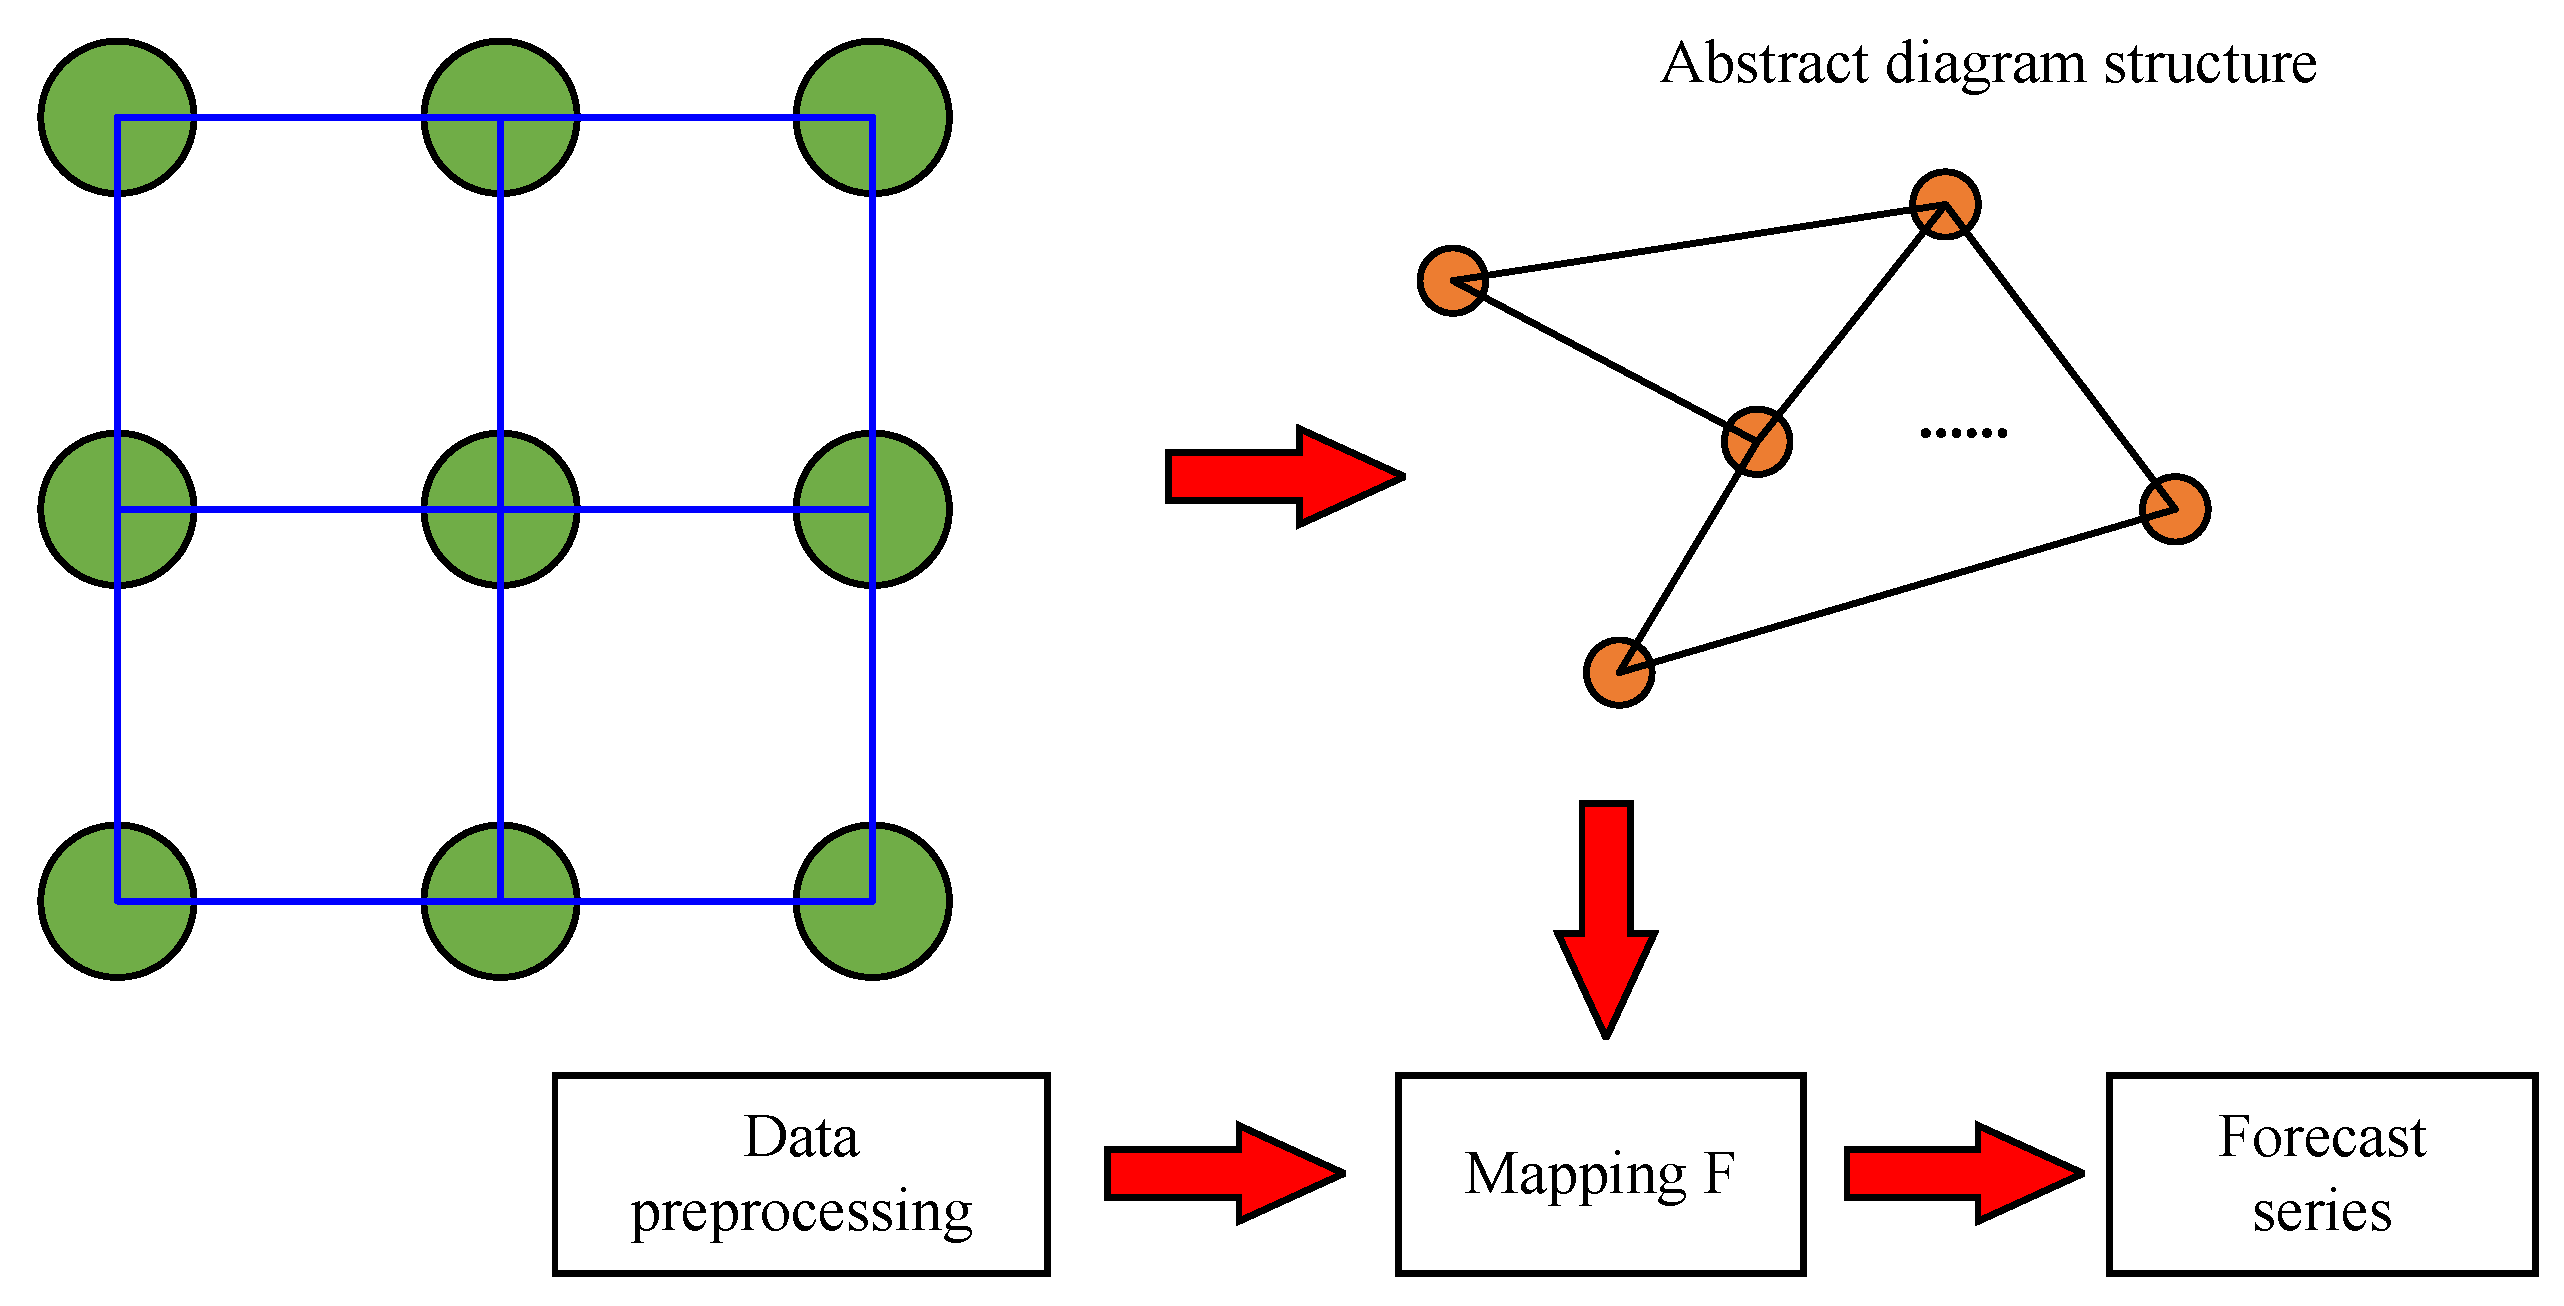
Figure 1. Sample collection system.
Sustainability 15 06959 g001
Figure 2. Schematic diagram of the working principle of LSTM neurons.
Sustainability 15 06959 g002
Figure 3. Conv-LSTM internal structure diagram.
Sustainability 15 06959 g003
Figure 4. Overall flow chart incorporating gas distribution modeling.
Sustainability 15 06959 g004
Figure 5. Temperature and humidity change curves of three soil depths under different precipitation levels.
Sustainability 15 06959 g005
Figure 6. Results showing the relationship between soil temperature and carbon dioxide gas flux at different soil depths.
Sustainability 15 06959 g006
Figure 7. The results showing the relationship between soil moisture and carbon dioxide gas flux at different soil depths.
Sustainability 15 06959 g007
Figure 8. Total results of changes in these three biological factors with changes in soil depth under different precipitation levels.
Sustainability 15 06959 g008
Table 1. Results of correlation coefficients between soil root biomass, biological carbon and nitrogen content, and soil GHG under three precipitation treatments.
GHGProcessing MethodRoot BiomassSample SizeMicrobial
Carbon
Microbial
Nitrogen
Sample Size
CO2ALL0.101960.047−0.094192
Increased water
treatment
−0.138320.197−0.14164
Water reduction
treatment
0.417320.03−0.05564
Normal precipitation0.208320.103−0.03864
N2OALL0.35 *960.081−0.067192
Increased water
treatment
0.118320.219−0.07864
Water reduction
treatment
0.753 **320.2160.06964
Normal precipitation0.45632−0.158−0.04964
CH4ALL0.059960.057−0.157192
Increased water
treatment
−0.175320.075−0.15964
Water reduction
treatment
−0.187320.1720.07964
Normal precipitation0.371320.172−0.20764
Note: * and ** indicate significance to the level of p < 0.05 and p < 0.01, respectively.
Table 2. Results of the correlation coefficient between soil biological enzymes and soil GHG under three precipitation treatments.
Enzyme TypeGHGALLIncreased Water TreatmentWater Reduction TreatmentNormal
Precipitation
BGCO20.054−0.0690.305−0.291
CH4−0.0470.027−0.082−0.142
N2O0.352 **0.1380.596 **−0.025
CBHCO20.264 *0.2410.3370.144
CH40.0170.04−0.0410.042
N2O0.366 **0.2640.423 *0.291
APCO2−0.144−0.191−0.02−0.212
CH4−0.060.08−0.062−0.178
N2O0.0890.0090.2170.024
LAPCO2−0.071−0.1610.163−0.398 *
CH4−0.0440.0730.042−0.339
N2O0.244 *0.0250.453 *−0.011
NAGCO2−0.048−0.2760.315−0.056
CH4−0.128−0.119−0.026−0.164
N2O0.205-0.0970.59 **0.295
Note: * and ** indicate significance to the level of p < 0.05 and p < 0.01, respectively.
Disclaimer/Publisher’s Note: The statements, opinions and data contained in all publications are solely those of the individual author(s) and contributor(s) and not of MDPI and/or the editor(s). MDPI and/or the editor(s) disclaim responsibility for any injury to people or property resulting from any ideas, methods, instructions or products referred to in the content.