Article

The Effect of Sequential and Simultaneous Supplementation of Waste-Derived Volatile Fatty Acids and Methanol as Alternative Carbon Source Blend for Wastewater Denitrification

1
Swedish Centre for Resource Recovery, University of Borås, 501 90 Borås, Sweden
2
Department of Environmental Engineering, Istanbul Technical University, Istanbul 34469, Turkey
*
Author to whom correspondence should be addressed.
Sustainability 2023, 15(8), 6849; https://doi.org/10.3390/su15086849
Submission received: 7 March 2023 / Revised: 3 April 2023 / Accepted: 16 April 2023 / Published: 19 April 2023
(This article belongs to the Special Issue Advances in Technologies for Wastewater Treatment and Reuse)

Abstract

:
Supplementation of alternative carbon sources is a technological bottleneck, particularly in post-denitrification processes due to stringent effluent nitrogen levels. This study focuses on enhancing the sustainability of wastewater treatment practices by partially replacing conventionally used fossil-derived methanol with organic waste-derived volatile fatty acids (VFAs) in moving bed biofilm reactors (MBBRs). In this regards, results of denitrification batch assays with sequential or simultaneous addition of VFA effluent from acidogenic fermentation of potato starch residue (AD-VFAPPL) and chicken manure (AD-VFACKM), simulated synthetic VFAs solutions (sVFAs), and methanol as carbon source were presented and discussed. Although methanol has proven superior in the conversion of nitrate to nitrite, VFAs are more effective when it comes to reducing nitrite. Although solely added AD-VFAPPL had a slower denitrification capability (0.56 ± 0.13 mgNOx-N removed/m2/day) than methanol (1.04 ± 0.46 mgNOx-N removed/m2/day), up to 50% of the methanol can be replaced by waste-derived AD-VFAPPL and achieve comparable performance (1.08 ± 0.07 mgNOx-N removed/m2/day) with the pure methanol. This proves that the co-addition of VFAs together with methanol can fully compete with pure methanol in performance, providing a promising opportunity for wastewater treatment plants to potentially reduce their carbon footprint and become more sustainable in practice while benefiting from recovered nutrients from waste.

1. Introduction

An increase in the population almost always leads to an increase in key challenges worldwide. The protection of the aquatic environment and the conservation of surface waters are no exceptions [1]. The rise in harmful nutrients in municipal wastewater has compelled policymakers to take action and enact stringent legislation and regulations to prevent nutrient release. This is to avoid further certain issues, such as eutrophication and the degradation of rivers and lakes. The treatment of contaminated wastewater is a critical step in preventing these issues. Surface water protection requires the application of mechanical, chemical, and biological wastewater treatment systems [2]. The objective of managing wastewater is two-fold, namely, to reduce the negative impacts on the environment and economy caused by its disposal, as well as to extract energy and resources from this waste flow. By doing so, we can create a more sustainable system that not only minimizes environmental damage but also provides economic benefits through increased resource efficiency [3].
Biological nutrient removal, which removes nutrients, such as nitrogen, and phosphorus, is one of the most important processes in a wastewater treatment plant (WWTP). The biological nutrient removal process often contains three consecutive stages: phosphorus removal, nitrification, and denitrification [4]. Nitrogen removal consists of two main steps of nitrification and denitrification. Nitrification is facilitated by specialized autotrophic bacteria, such as ammonia-oxidizing bacteria and nitrite-oxidizing bacteria, that convert ammonium to nitrate under aerobic conditions [5]. Following nitrification, the denitrification process then receives the wastewater and utilizes heterotrophic microorganisms to convert nitrate to nitrogen gas via a sequence of biological reactions [5].
Fixed film post-denitrification processes, such as deep-bed denitrifying filters, fluidized bed reactors, submerged attached growth filters, and moving bed biofilm reactors, are likely to be installed in order to meet final total nitrogen criteria close to the technological limit [6].
The MBBR process, distinct from other fixed films systems, combines the benefits of both a normal activated sludge process and other biofilm processes by using free-floating polyethylene medium (carriers) to give significant surface area for attached biomass growth without the use of internal recycling. MBBRs have been utilized in industrial wastewater treatment since their introduction in Norway in the late 1980s [7]. Pre-denitrification, post-denitrification, and combinations of the two have all been denitrification processes in which MBBRs have been employed. A combination configuration is used by the majority of plants, particularly those in northern Europe, which allows for operational flexibility in extreme cold climates to increase the nitrification/denitrification capacity in an existing plant. However, by the time wastewater enters the post-denitrification process, it has been depleted of soluble organic material. Low carbon to nitrogen ratios (C/N) in wastewater are a common issue for WWTPs, reducing denitrification effectiveness. As a result, more carbon sources are needed for efficient denitrification, requiring external carbon source addition to elevate the C/N ratio to a suitable level for effective denitrification [8].
Conventionally, methanol, ethanol, or acetate are used to substitute for the lack of carbon source in the denitrification process [8]. Due to its effectiveness, methanol is the most often used option for removing nitrate through denitrification [9]. The use of methanol in conventional denitrification processes has been judged as unsustainable due to its fossil-based production and associated costs, which can account for up to 70% of WWTP operating and maintenance costs [10]. Zhang et al. [11] tested differed carbon sources to find a greener and cheaper alternative. Although solid carbon sources, such as paper, wood, and straw were investigated, they were found to be less effective than methanol, resulting in very low denitrification rates. Previous studies have investigated alternative specific waste resources that show promising denitrification values [12,13,14]. It is known that heterotrophic nitrate reducers can also use organic acids as electron donors in addition to a variety of other carbon sources. Acetate, propionate, butyrate, valerate, and caproate, collectively known as volatile fatty acids (VFAs), are additional substrates for denitrifiers [15]. VFAs are essential intermediates produced through acidogenic fermentation of organic waste. Hence, waste-derived VFAs are acknowledged as a sustainable and affordable external carbon source for biological nutrient removal processes [16].
Livestock manure is currently the greatest organic waste stream in most countries, with a variety of detrimental environmental effects. However, employing chicken manure as a readily available biomass for acidogenic fermentation process could reduce its negative impact on the environment while at the same time creating valuable end products, such as VFAs [17]. In addition to animal manure, industrial waste streams have also shown great potential for use in the production of VFAs, owing to their high concentrations of proteins, carbohydrates, and lipids. For example, the production of potato starch, one of the common industries in southern Sweden, leaves behind a significant amount of potato pulp and liquor in which the proteinaceous component of it is coagulated by steam treatment and separated using a decanter. The residual potato liquor—which primarily contains the soluble portion of the waste from the manufacturing of potato starch—is concentrated and forms the potato protein liquor (PPL) that still has 40% solids [18]. It has been proven that the properties of such feedstocks are promising for VFA production [19,20], which may then be employed as a carbon source in a denitrification process.
Although there are number of reports on the application of VFAs for denitrification [1,21,22,23], the application of waste-derived VFAs along with methanol or in a stepwise manner as a carbon source for the post-denitrification biofilm process has not been studied in the literature according to the authors’ knowledge.
In the current research, the feasibility and performance of VFAs originating from different waste resources of fermented potato protein liquor (PPL) effluent and chicken manure (CKM)- used as electron donors in the post-denitrification process were evaluated. Moreover, the potential of sole addition and partial substitution of conventionally used carbon sources with VFA effluents was evaluated to propose solutions for potentially greener, more sustainable, and fossil source-independent wastewater treatment process.

2. Materials and Methods

2.1. Carbon Source Characteristics

In this study, organic carbon sources/electron donors included both traditional carbon sources, namely methanol and ethanol from the category of alcohols, and heat shock-treated various waste streams through anaerobic fermentation effluents, namely chicken manure-derived VFA effluent (AD-VFACKM) and potato protein liquor-derived VFA effluent (AD-VFAPPL) from the category of organic acids. AD-VFAs were created beforehand from the anaerobic fermentation of chicken manure [20] and potato protein liquor [19]. Because methanol (≥99.8%, Sigma-Aldrich) and absolute ethanol (≥99.8%, VWR Chemicals) are routinely utilized carbon sources, they were used as reference carbon sources for denitrification tests.
For the biological production of AD-VFAs, an immersed membrane bioreactor with robust cleaning capabilities was built to digest the complex anaerobic digestion medium for continuous product recovery at high yields. The process details for anaerobic digestion and VFA extraction in the membrane bioreactor are described by Sapmaz et al. [19] and Yin et al. [20]. The separation of the metabolized VFAs mixture from the suspended solid contents (i.e., the undigested substrate and the microorganism) was helped by a microfiltration process that occurred in the membrane bioreactor concurrently with the anaerobic digestion of the chicken manure and potato protein liquor. To be thorough, synthetically produced VFAs (sVFACKM and sVFAPPL) were evaluated alongside the biologically produced AD-VFAs (AD-VFACKM and AD-VFAPPL). The membrane bioreactor (MBR) was operated in a similar design to the one described in [24] for the production of AD-VFACKM and AD-VFAPPL. The recovered/extracted AD-VFAs were collected and stored in a freezer (−18 ± 2 °C) to be used as an external carbon source for denitrification. As for the preparation of synthetic VFAs, solutions of AD-VFA effluents were mimicked using laboratory-grade acetic, propionic, butyric, iso-butyric, valeric, and caproic acids (Sigma-Aldrich). For all denitrification tests, the total amount of carbon sources added was based on a C/N ratio of 9.5, as recommended by Gryaab WWTP according to operational procedures.
The properties of each AD-VFA and carbon source used are listed in Table 1.

2.2. Post-Denitrifying MBBR Operation

A lab-scale moving bed biofilm reactor (MBBR) system, as shown in Figure 1, was built-up and operated with four identical glass reactors the same way as described in Sapmaz et al. [25]. The setup consisted of four identical glass reactors with a total capacity of 2 L. Each reactor contained 1 L of non-acclimated AnoxKaldnesTM K1-type carriers.
The denitrification rate (DNR) [26] and denitrification capacity was calculated in the same way that was presented by Sapmaz et al., as follows [25]:
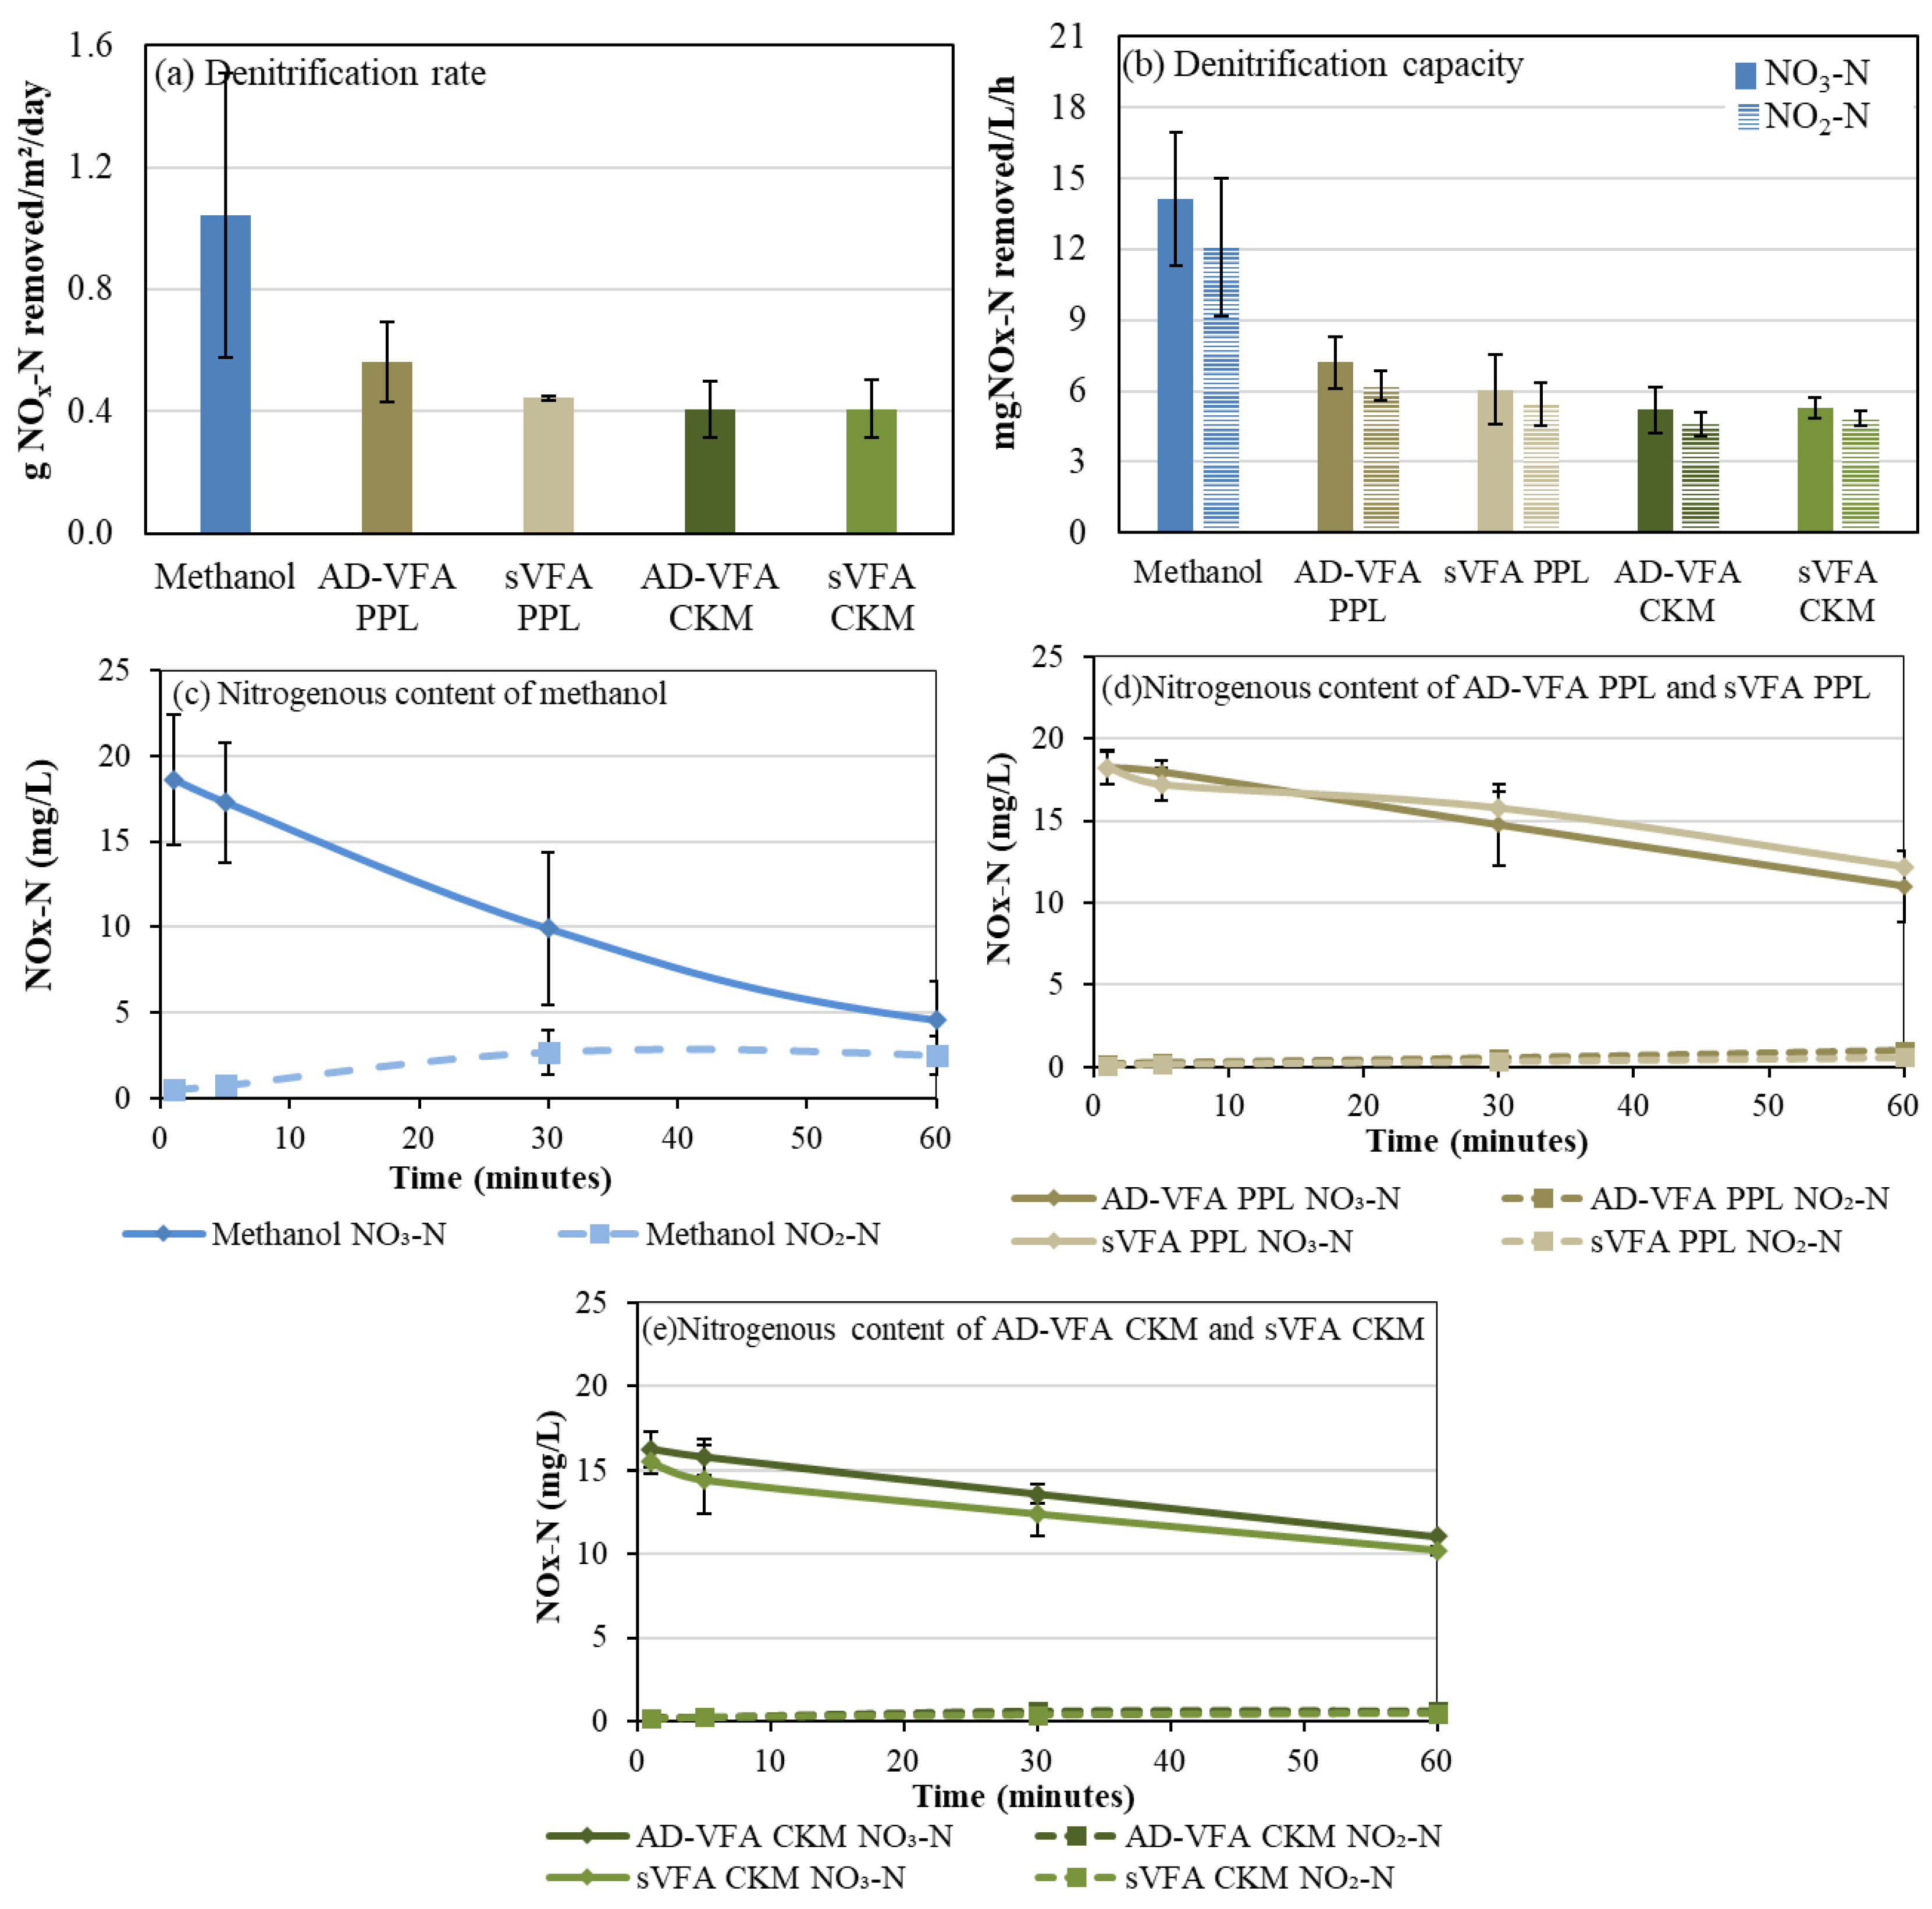
  • Denitrification rate was calculated as follows:
D N R g N O x / m 2 / d = k m g / L / m i n × 60 m i n × 24 h × V s L A c a r r i e r m 2 × 1000 m g
where k, Vs, and Acarrier are as follows:
k (mg/L/min) = NOx removal rate
Vs (L) = V0 (L) − (Vsample/2) − (Vcarriers(L) × bulk volume of the carriers (14%)
A carrier = V carriers (1 L) × specific surface area of carriers (500 m2/m3)
  • Denitrification capacity
To determine the denitrification capacity for NO2-N in a system containing both NO3-N and NO2-N, the NO3-N and NO2-N concentrations measured at the beginning and after 60 min were used. The amount of NO3-N removed during the 60 min period is estimated by subtracting the initial NO3-N concentration from that of the 60 min sample (2). This value is then used to calculate the denitrification capacity for NO2-N by subtracting it from the final NO2-N concentration after 60 min (3).
D c a p ( N O 3 - N ) = m g ( N O 3 - N ) ( 1   m i n ) m g ( N O 3 - N ) ( 60   m i n ) = m g N O 3 - N   r e m o v e d / L / h
D c a p ( N O 2 - N ) = D c a p ( N O 3 - N ) ( N O 2 - N ) ( 60   m i n ) = m g N O 2 - N   r e m o v e d / L / h

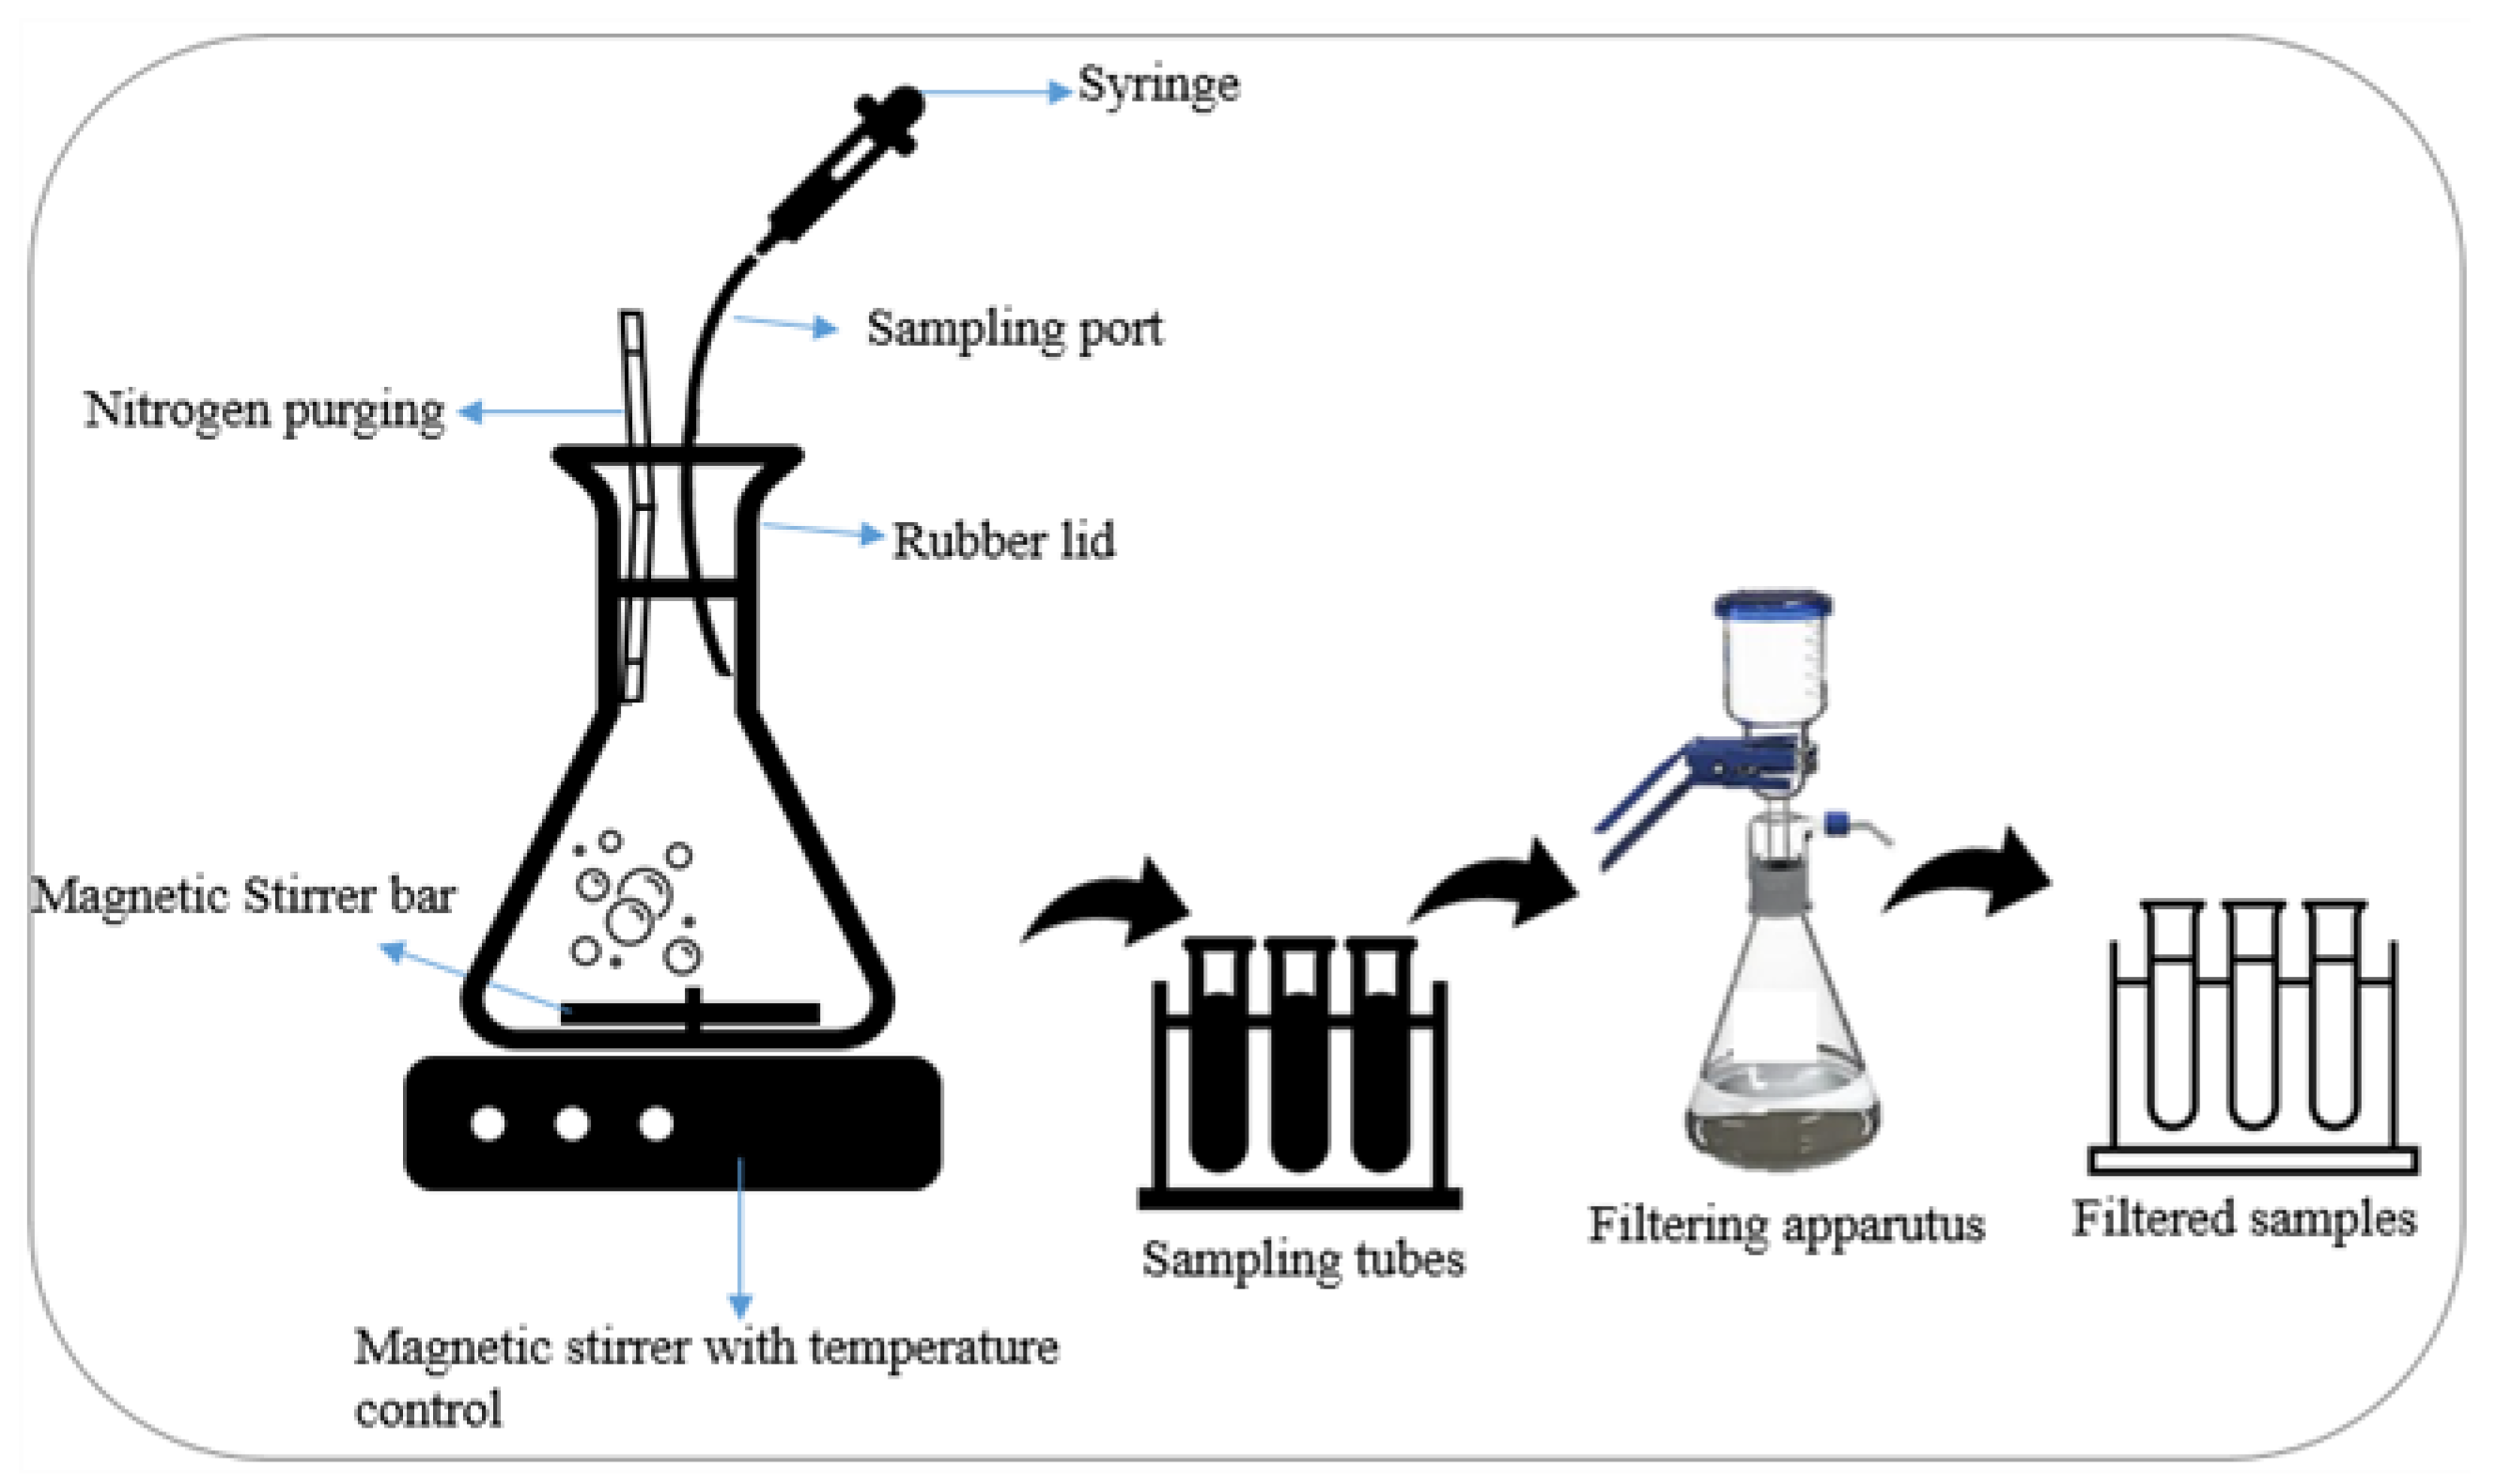
2.3. Sampling and Analytical Methods

At various time intervals (1, 5, 10, and every 10 min until 60 min) throughout the denitrification process, samples were collected to analyze the levels of nitrogenous compounds, COD, PO4-P, and pH. Before storing the samples for analysis, samples were filtered using 1.6 μm glass microfiber filters first, and prior to kit analysis, they were filtered again with 0.45 μm syringe filters to remove turbid materials. NANOCOLOR® tube tests were used to measure the amounts of NO3-N, NO2-N, NH4+-N, PO4-P, and COD (MACHEREY-NAGEL GmbH & Co. KG, Düren, Germany) according to the manufacturer’s instructions. Gas chromatography (GC) (Clarus 550, PerkinElmer, Norwalk, CT, USA) with a hydrogen flame ionization detector and capillary column (Elite-Wax ETR, 30 m × 0.32 mm × 1.00 µm, PerkinElmer, Norwalk, CT, USA) was used to calculate VFA profiles, with 1 g/L butanol used as an internal reference. Temperature and pH were routinely measured at the start and end of denitrification with a digital thermometer and a pH electrode (S400, Mettler Toledo, Switzerland). To acquire trustworthy results, all measurements were carried out in parallel. The chemical analyses were performed in triplicate, and the denitrification study data were conducted in duplicate. Statistical significance of the obtained results was calculated using one-way analysis of variance (ANOVA, p < 0.05). At the same time, all data points were calculated according to the mean and together with standard deviations. In statistical analyses, p-values of less than 0.05 were considered significant.

3. Results and Discussion

The supplied VFA effluents from anaerobic MBR of chicken manure and potato protein liquor substrates were tested as alternative carbon sources for enhanced nitrogen removal in wastewater treatment. AD-VFAs can replace the fossil-based and conventionally used methanol or ethanol in the wastewater denitrification process, potentially reducing carbon footprints and boosting sustainable development. To evaluate the denitrification potential of AD-VFACKM and AD-VFAPPL and compare it to commonly used methanol and ethanol, this study first evaluated the impact of different waste-derived VFAs (AD-VFACKM, sVFACKM AD-VFAPPL, and sVFAPPL), then evaluated partial substitution/replacement of methanol and ethanol with co-fed and sequential addition of AD-VFAPPL.

3.1. Source of VFA Effluents as the Sole Carbon Source on Denitrification

To explore the efficiency of proposed carbon sources as external carbon sources for nitrogen removal, VFAs were added into lab-scale anoxic denitrification reactors, and commercial methanol was used as the control. For all denitrification tests, the total amount of carbon sources added was based on a C/N ratio of 9.5. The effects of using AD effluents of PPL and CKM substrates as carbon sources on denitrification were investigated by using carriers provided by the WWTP that had previously been fed with methanol. This section of the study compares the denitrification potential of AD-VFAPPL, AD-VFACKM, sVFAPPL, and sVFACKM solutions as the sole carbon source, and methanol as a reference.
The compositions of AD-VFAs were measured in this study (Table 1). There was no apparent variation in VFA effluents properties regarding VFA composition, as is shown in Table 1, indicating the viability of comparing these AD-VFAs for advanced nitrogen removal. The overall VFA concentration was roughly 6 g/L for VFAPPL and 7 g/L for VFACKM, respectively. Acetic acid was the predominant product in both AD-VFAs and accounted for 69.4% and 63% of the total VFAs in AD-VFAPPL and AD-VFACKM, respectively. Butyric and propionic acid made up 11% and 8.4% in AD-VFAPPL, and 4.9% and 10.7% in AD-VFACKM, respectively (Table 1). Distribution of individual VFAs in the mixture influences the pace of denitrification as there is a utilization pattern [27]. On the other hand, as shown in Table 1, there were differences in the concentrations of PO4-P and NH4+-N in the AD-VFAs used. While AD-VFAPPL contained only 485.0 mg/L ammonium and 33.0 mg/L phosphate, the values of these nutrients were 2540 mg NH4+/L and 1747 mg PO4/L in the AD-VFACKM (Table 1). Because the C/N ratio of 9.5 was used, the required volume of carbon sources were affected by the total concentration of VFAs in the effluents for denitrification to achieve equivalent sCOD loading, which defines the impurity in the reactor. Depending on how or whether contaminants affect denitrification, and the process configuration of the WWTP, the VFA effluent with the lowest nutrient content may be preferable to avoid external deterioration and meet nutrient discharge standards [28].
The results of the denitrification assays are illustrated in Figure 2. When methanol was used as the carbon source, the denitrification rate peaked at 1.06 mg NOx-N removed/m2/day, while AD-VFAPPL and AD-VFACKM had 0.56 and 0.41 mg NOx-N removed/m2/day, and sVFAPPL and sVFACKM had 0.44 and 0.41 mg NOx-N removed/m2/day, respectively. Each level mean in this result is in the same control level (not moderately significant, p value > 0.05), demonstrating the naturally occurring AD-VFAs from PPL and CKM and their synthetic counterpart, sVFAs, as a potential carbon source for denitrification.
Fluctuations in denitrification rates for methanol, as indicated by changes in standard deviation, could be attributed to variations in the microbial population and diversity of microorganisms present on the carriers, which may have changed between the two consecutive days on which the experiments were conducted. The carriers used in this experiment were acquired from the post-denitrification stage, which involves the use of methanol as an external source of carbon. Understanding the microbial culture of the denitrifying community is necessary to comprehend the denitrification rate theory [29]. In order to achieve the highest possible denitrification rates, it is believed that the link between bacterial culture and denitrification ability is crucial. More research is needed to obtain firmer results, because few studies have been performed on comparative analyses of various microbial cultures. In a study conducted on an anammox batch reactor that was analyzing the change in bacterial phyla following the addition of glucose as a carbon source, a wider variety of microbial cultures were seen when organic solids with various amounts of organic material were introduced. The microbial community’s diversity was drastically decreased when glucose was added as the sole carbon source. This shows that only the bacteria that can metabolize a given carbon source becomes predominant in a denitrification system [30]. The microbial population in the carriers that has been used in this study has long been adapted to methanol utilization. Hence, the lower denitrification efficiency of AD-VFAPPL and AD-VFACKM as carbon source is primarily due to the microbial community involved in the process and their biochemical reaction rates when using VFAs as electron donors. The yield and carbon utilization rates for VFAs were substantially lower than expected and lower than methanol, as opposed to what was previously reported in [11,23,31,32], indicating that suspended growth methods may have an advantage in terms of carbon utilization rates over attached growth processes. Higher biomass concentrations (with greater specific surface area) in smaller reactor volumes and shorter HRTs are generally advantages of attached growth methods over suspended growth; nevertheless, it is more difficult to transport substrates (mass transfer) to the biofilm as an electron donor due to diffusion and advection [33,34]. Furthermore, microbial culture adaptation to a certain carbon source may be one of the reasons why methanol reaches even higher denitrification rate and capacity as unacclimated carriers were used in this study.
The denitrification rates and capacities observed for AD-VFAs and sVFAs were almost identical (as shown in Figure 2a,b), indicating that the presence of other components in the AD-VFA effluent did not have any negative impact on the denitrification performance. These results align with previous studies that investigated the feasibility of using food waste fermentation liquid as the external carbon source [16]. The ammonium nitrogen and phosphate in fermentation liquid did not cause any external deterioration of ammonium removal and also enhanced the nutrient removal [16].
In Figure 2c–e, the nitrate and nitrite concentrations of the tests are plotted against time. Figure 2c shows that while methanol had a faster nitrate removal rate compared to VFAs, it resulted in the highest nitrite accumulation. On the other hand, the removal of nitrite was almost as fast as nitrate disappearance for VFAPPL and VFACKM, as seen in Figure 2d,e. The most favorable outcome was obtained with the application of AD-VFAPPL, where the amount of removed nitrate was quite similar to that of nitrite. Hence, the optimal outcome was attained when AD-VFAPPL was utilized, as the amount of nitrate removed was comparable to that of nitrite. This suggests that the VFAs are more effective than methanol, owing primarily to nitrate conversion, and particularly in terms of reducing nitrite. This corresponds to a study carried out by Kim, Kim, Shin, Hwang, and Lee [31] that also observed faster removal of nitrite (in terms of reaction rate and lag length) with the fermentation filtrates as a denitrification carbon source among those tested [31]. Therefore, the hypothesis that the impurities even in AD-VFACKM did not cause deterioration in the denitrification efficiency is further supported by the observation of improved nitrate removal performance over time when AD-VFAPPL, AD-VFACKM, sVFAPPL, or sVFACKM are utilized.
In the denitrification experiments, the operating parameters, such as pH and temperature, were not adjusted. The reason was to see what effect the addition of carbon sources had on pH change and denitrification. Furthermore, the denitrification tests have been performed in a manner that could be similar to the traditional approach, with the pH not being altered. The need to alter the pH in the WWTPs would result in high economic costs; hence, it could be challenging.
The denitrification process functions the best at neutral pH. As microbial denitrification is a biological respiration process that uses various enzymes to reduce nitrogenous substances, all enzymes that function properly at an ideal pH are affected by the change in pH [35]. As a result, the pH range for most denitrifying bacteria is between 7.5 and 9.5 [35]. All experiments show that the pH of denitrification ranges from 6.94 to 7.71, primarily reflecting the pH of the influent wastewater to the denitrification tanks. The denitrification tests’ final pH values (Table 2) were all slightly raised on the basis that denitrification reaction causes alkalinization, raising pH during the denitrification process [35,36]. Although VFAs are weak acids, adding them as carbon source had little effect on the reactors’ pH because all final pH values were close to the neutral pH of 7.
Regarding temperature, at the beginning of the experiment, the temperature was between 15.0 to 16.0 °C. This can be thought of as the average temperature that happens spontaneously during the traditional denitrification process, as the temperature of the incoming wastewater might vary from 7 to 25 °C due to seasonal changes. Initial temperatures rose to around 18.0 °C for final temperature measurements and remained between 17.5 and 18.5 °C. As the temperature was not controlled, it is not clear from this study if temperature affects denitrification efficiency. However, according to a study by Elefsiniotis and Li [1] on the effect of temperature on denitrification, regardless of temperature, none of the carbon sources evaluated, including VFA and methanol, demonstrated a tendency to lose denitrification efficiency throughout a range of temperatures studied (10–30 °C). This may suggest that the maintained temperature may not be necessary to demonstrate that one carbon source is more efficient than another; rather, maintaining a temperature within a closer range is enough to see results that are comparable to those obtained by maintaining the same temperature for all. In contrast to these, as the process originated in Scandinavia, emphasis has been placed on studying carbon sources (methanol and ethanol) at low temperatures in MBBRs as well. The use of methanol in pilot-scale denitrifying MBBRs at 10 °C was examined by Rusten et al. [37], and a maximum denitrification rate of 1.4 g NO3-N/m2/day found with the 4.55 g CODused/g NO3-Neq removed ratio. Similar experiments were conducted by Aspegren et al. [38] at 16 °C, and they reported a maximum denitrification rate of 2.0 g N/m2/day with the ratio of 4–5 g COD/g NO3-Neq.
Analysis of the initial nutrient contents of the denitrification experiments showed a variation in the ammonium initial values. Ammonium nitrogen and phosphate phosphorus are the nutrients considered. To achieve the required C/N ratio of 9.5, the carbon source’s sCOD value, which represents the amount of carbon source that must be added, is also presented in Table 2. Due to the different characteristics of the carbon sources utilized in denitrification, the starting nutrient concentration values displayed variances. Additionally, compared to methanol, AD-VFAs as carbon source had a lower COD due to the low VFA concentrations, hence a larger volume of them was needed to maintain the same C/N ratio of 9.5. When AD-VFA effluents were employed instead of synthetically prepared solutions and methanol, a greater amount of nutrients was provided during denitrification due to the addition of higher volumes (19.04 mL for AD-VFAPPL and 16.41 mL for AD-VFACKM). With an initial concentration of 19.0 mg/L ammonium and 4.3 mg/L phosphorus compared to 8.1 mg/L ammonium and 3 mg/L phosphorus when the sVFACKM was employed, AD-VFACKM had the higher nutrient concentrations, as shown by the initial characteristics (Table 2). Ammonium concentrations were around 8 mg/L and phosphorus concentrations were 2.1–3.4 mg/L when employing methanol and sVFAs (Table 2). A slight increase in concentrations was observed, but the change in ammonium and phosphorus concentrations was not significant and remained the same throughout the test. This could be due to the agitation that leads to the breaking of some of the biofilm to be broken up by the carriers, which would release some nutrients into the mixture.

3.2. Effect of Co-Fed Carbon Sources on Denitrification

The goal of this stage of work is to analyze the effect of a mixed carbon source in a co-fed denitrification and its possibility of facilitating a partial substitution of conventionally used carbon sources. For this reason, denitrification tests were analyzed, taking the opportunity to mix various carbon sources together in a co-fed denitrification process. The mixture or partial replacement of methanol may indicate if it is possible to replace a portion of the added carbon source with VFA effluents and hint at a way to adapt the MBBR denitrification carriers to the new carbon source by gradually increasing the amount of VFA effluent parallel to decreasing the amount of methanol. The evaluated carbon sources in this regard are ethanol, methanol and sVFAPPL, and AD-VFAPPL.
The denitrification rate for ethanol presented a value of 1.1 g NOx-N removed/m²/day with a denitrification capacity of 17.3 mg nitrate removed/L/h (Figure 3a,b). The value reflects similarities with the denitrification efficiencies of methanol. One reason can be a similar metabolic pathway in which both ethanol and methanol are alcohols and are metabolized into their corresponding aldehydes [39]. However, the metabolic pathway of ethanol metabolizes acetaldehyde into acetic acid which then follows a similar pathway that the VFAs undergo through beta oxidation. If the ethanol is accrued to VFAs, one can observe a significantly better denitrification rate and denitrification capacity when using ethanol.
The most efficient value observed under denitrification when using sole VFAs was observed at 0.56 g NOx-N removed/m2/day (Figure 3). One assumption of the limiting factor for VFAs as a carbon source can be the first steps of the biochemical pathway. Since ethanol and VFAs undergo beta oxidation, the limiting factor can be the first steps of the pathway for VFAs when they are metabolized into acyl-adenylate. This can also reflect on the microbial diversity of the used carriers which do not have a well-established enzymatic network to metabolize VFAs, which creates long lag phase to adapt to a certain carbon source. This, in turn, negatively reflected on the denitrification capacities. When comparing methanol and ethanol in a 1:1 ratio on a C/N ratio of 9.5 (Figure 3), one can observe a denitrification rate of 0.53 g NOx-N removed/m²/day. This value is significantly lower than when using purely methanol or ethanol. When observing the denitrification capacity (Figure 3), a value of mg NO2-N removed /L/h is obtained, which is similar to what was observed when using pure methanol or ethanol. The reason for this is because of the high accumulation of NO2-N when specifically using methanol purely or in combination. When ethanol was used, a NO2-N accumulation of 4 mg/L was observed. For the combined methanol and ethanol, a value of 8 mg/L was observed. This indicates that when using methanol as a carbon source, a slower intermediate stage of NO2-N conversion is observed, which affects the denitrification rate negatively. This also further strengthens the argument that VFAs can have a better NO2-N conversion rate than methanol. This can be observed when methanol and sVFAPPL are combined. The denitrification rate is observed at 1.05 g NOx-N removed/m²/day in a 1:1 ratio with a C/N of 9.5, and only 3 mg/L NO2-N was accumulated (Figure 3). This value was similar to when using pure methanol and ethanol separately. This indicates that co-digestion together with VFA effluent can be beneficial, increasing the conversion rate of NO2-N in comparison to when only methanol is used.
The combination of carbon sources in a co-fed denitrification showed promising results. When ethanol and sVFAPPL was combined in a 1:1 ratio with a C/N ratio of 9.5, a denitrification rate of 1.4 NOx-N removed/m²/day was obtained, with a denitrification capacity of 16.8 mg/L/h NO2-N removed. This value was the highest obtained denitrification rate and highlights the potential of co-digestion of denitrification. This indicates that when VFA effluent and ethanol are fed together, a higher denitrification efficiency is obtained. This may indicate that ethanol and VFA effluents have a boosting effect on each other. Another argument can be that a carbon source with diverse contents can be better utilized by the diverse microbial quality of the denitrifying microorganisms. These results show that when VFA effluents are co-fed into a denitrification process, a high denitrification rate can be observed. This work can be related to what has been stated by He et al. [40], in which they used granular sludge as denitrifying media. They tested the effect of a mixture of different mixed carbon sources, mixing acetate and sodium succinate and comparing this to using pure acetate or pure sodium succinate. This study stated that a mixture of carbon sources for denitrification had a great impact on the denitrification rate and generally performed better than adding a pure carbon source. This can strengthen the arguments that mixing VFAs together with methanol or ethanol can have boosting effects on denitrification efficiencies and further affect the denitrification rate positively. However, this study conducted simultaneous nitrification and denitrification with phosphorus removal in a suspended growth process, which is a slightly different type of biological nutrient removal than the suspended growth process; nevertheless, the purpose of the carbon source is the same in both studies, which validates the relevance of comparison. It is important to mention that the results did not only show improved denitrification but further eased the facilitation of integrating VFAs in a current conventional denitrification process. With the understanding that replacing a portion of the carbon source with VFA effluents, one can gradually increase the ratio of VFAs to an optimal ratio that suits the specific conventional process.
To further elaborate on denitrification and the effect of co-fed denitrification, a further set of tests were carried out comparing methanol with AD-VFAPPL in a 1:1 ratio with a C/N ratio of 9.5 against methanol together with sVFAPPL, as is shown in Figure 3. The reason for this is to evaluate if the portion that is set to be the VFA effluent in the carbon source mixture has any effect on the denitrification regarding other material existing in the effluent, such as nutrients. This is carried out by comparing this to a carbon source mixture, with the VFA portion being a synthetic VFA mixture.
Similar figures are shown for the denitrification efficiency of the mixed carbon sources. In comparison to the synthetic mixture, which had a denitrification rate of 1.03 g NOx-N removed/m2/day, the carbon source employing methanol and AD-VFAPPL effluent had a denitrification rate of 1.08 g NOx-N removed/m2/day, demonstrating that the denitrification rate is unaffected by contaminants in the actual effluent at the specified quantities (Figure 4). The mixture had identical nitrate and nitrite removal capabilities, with AD-VFA effluent mixtures having 18.75 and 18.65 and synthetic mixtures having 18.55 and 18.42, respectively (Figure 4).
The temperature, pH, and nutrient contents all follow the same patterns as previously described in Section 3.1. The initial and final pH range from 6.98 to 7.7 and 7.33 to 7.71, respectively (Table 3). The temperatures range from 14.6 to 18.7 and 17.3 to 19.7 for initial and final, respectively (Table 3). The ammonium content ranged from 9.5–7.7 mg/L ammonium. The phosphorus content is generally lower than previous sets ranging from 2.3–3.4 mg/L (Table 3). The reason for this can be the quality of the wastewater collected from the nitrification outlet in the wastewater treatment plant. Seasonal fluctuations in the characteristics of the incoming wastewater to the denitrification tank may be the cause of the different values.
Similar pH values of 7.06 for methanol with AD-VFAPPL and 6.98 for methanol with synthetic sVFAPPL were observed with mixed carbon sources employing methanol and AD-VFAPPL in combination. When employing methanol and AD-VFAPPL effluent or methanol and sVFAPPL, a rise in pH was seen during denitrification for both mixed carbon sources, with values of 7.71 and 7.51, respectively (Table 3). This indicates that denitrification took place in both experiments. The denitrification’s ammonium content differed from the synthetic version in terms of initial values and the nutrients present in the AD-VFA effluent. The initial phosphate content for both has been seen to be similar (Table 3).

3.3. Effect of Sequential Addition of Co-Fed Carbon Sources

To better understand the effect of combination, a mixture of carbon sources containing methanol and AD-VFAPPL were set to be analyzed and added to the denitrification in a sequential manner. Hence, a sequential addition was set up to compare adding methanol first and the VFA effluent after 30 min and vice versa in order to better comprehend the idea of combined VFAs and the previously described potential boosting impact. To investigate their sequential addition effect, the carbon sources were added separately at the beginning of denitrification and then again 30 min later. The C/N ratio was 9.5. In the initial test, AD-VFAPPL effluent was employed as the initial carbon source addition, and methanol was added 30 min later (1. AD-VFAPPL + 2. methanol). In the second test, methanol was supplied first, and then, 30 min later, AD-VFAPPL effluent (1. methanol + 2. AD-VFAPPL) was added.
There was no discernible difference between the pH and temperature change. The same carbon sources were employed, but they were introduced at different periods during the denitrification process, resulting in negligible changes in the initial and final nutrient concentrations as well as pH and temperature variations (Table 4).
When AD-VFAPPL was added first and then methanol, the measured denitrification rate was equal to a value of 1.0 g NOx-N removed/m2/day, and this value was 1.06 g NOx-N removed/m2/day when methanol was added before AD-VFAPPL (Figure 5a). Denitrification capacities were similar, removing 17.7 mg/L/h of nitrate when AD-VFAPPL was added first and then methanol was added afterwards, and 17.9 mg/L/h of nitrate when methanol was applied first and then AD-VFAPPL. The nitrite levels showed the most change. When AD-VFAPPL was added second, nitrate quickly decreased and reached a final value of 0.125 mg/L after 120 min; however, when methanol was processed second, an accumulation of nitrite was visible at 1.6 mg/L (Figure 5b). This further supports the claim that VFAs are superior to methanol in the elimination of nitrite, and that methanol may have some inhibitory effects on nitrite removal. Not only do the alternative carbon sources need to be increased to have more soluble substrates, but the adjustment strategy (mixed carbon sources) is required to increase the rate of nitrogen removal. Therefore, given that mixed carbon sources perform similarly to simple methanol and even better when compared in terms of nitrite removal rates, this emphasizes the potential for combined carbon sources to be widely applicable. A reduced rate of denitrification was noticed for up to 30 min when AD-VFAPPL was applied first (Figure 5c). A significantly greater rate of denitrification was seen with the addition of methanol. An accelerated rate of denitrification was seen when methanol was added first. Moreover, the denitrification rate significantly increased with the addition of AD-VFAPPL. These results also lend credence to the idea that, when the rate of denitrification is considered, methanol and ethanol can speed up VFA metabolism.

4. Conclusions

There is considerable potential in the application of waste-derived VFAs as alternative carbon source for nitrogen removal in wastewater treatment process either by simultaneous application together with methanol or sequential addition. Animal excreta (chicken manure) or industrial side-streams (potato protein liquor fermentation effluent) stand out as large, organic sources for sustainable external carbon production. VFAs combined with methanol had a high denitrification rate and could be used more easily by denitrifiers than single VFAs. Furthermore, at the applied conditions (C/N: 9.5 and 17–18 °C), the addition of VFAs to methanol did not necessitate a lengthy acclimation period to acquire its full denitrification capacity. When the AD-VFAPPL was introduced after 30 min post-methanol addition, the denitrification capacity was superior in terms of NO2-N reduction. The co-fed AD-VFAPPL and methanol (1:1) test revealed highly promising denitrification rates, but more research needs be carried out to evaluate the addition of alternative ratios as well as full scale applications. The MBBR denitrification study using VFAs derived from waste revealed that fossil-based methanol could be successfully replaced to a large extent with waste-derived VFAs to obtain the same nitrogen removal effectiveness as pure methanol during the post-denitrification process.

Author Contributions

T.S.: data curation, formal analysis, methodology, validation, investigation, writing—original draft, writing—review and editing, supervision. R.M.: data curation, formal analysis, investigation. A.M.: conceptualization, investigation, writing—review and editing, supervision. Assoc. D.Y.K.-I.: conceptualization, resources, supervision. M.J.T.: conceptualization, funding acquisition, resources, supervision. All authors have read and agreed to the published version of the manuscript.

Funding

This research received funding (Funding number: 2020-03664) from Sweden’s Innovation Agency.

Institutional Review Board Statement

Not applicable.

Informed Consent Statement

Not applicable.

Data Availability Statement

The data presented in this study are available on request from the corresponding author.

Acknowledgments

The authors would like to thank Sweden’s Innovation Agency, the Swedish Research Council for Sustainable Development, and the University of Borås for their technical and financial support of this work. The authors would like to express their sincere gratitude to Dag Lorick, Lucica Enache, and Ann Mattsson (Gryaab AB, Gothenburg, Sweden) for their kind technical and scientific support. The first author (T.S.) is sponsored via a PhD grant from the Scientific and Technological Research Council of Türkiye.

Conflicts of Interest

The authors declare that they have no known competing financial interests or personal relationships that could have appeared to influence the work reported in this paper.

References

  1. Elefsiniotis, P.; Li, D. The effect of temperature and carbon source on denitrification using volatile fatty acids. Biochem. Eng. J. 2006, 28, 148–155. [Google Scholar] [CrossRef]
  2. Anderson, D.M.; Glibert, P.M.; Burkholder, J.M. Harmful algal blooms and eutrophication: Nutrient sources, composition, and consequences. Estuaries 2002, 25, 704–726. [Google Scholar] [CrossRef]
  3. Cecconet, D.; Capodaglio, A.G. Sewage Sludge Biorefinery for Circular Economy. Sustainability 2022, 14, 14841. [Google Scholar] [CrossRef]
  4. Swinarski, M.; Makinia, J.; Czerwionka, K.; Chrzanowska, M.; Drewnowski, J. Comparison of the effects of conventional and alternative external carbon sources on enhancing the denitrification process. Water Environ. Res. 2009, 81, 896–906. [Google Scholar] [CrossRef] [PubMed]
  5. Metcalf, E.; Abu-Orf, M.; Bowden, G.; Burton, F.; Pfrang, W.; Stensel, H.; Tchobanoglous, G.; Tsuchihashi, R.; AECOM (Firm). Wastewater Engineering: Treatment and Resource Recovery, 5th ed.; McGraw-Hill Education: New York, NY, USA, 2014; ISBN 978-00-7340-118-8. [Google Scholar]
  6. Akter, J.; Lee, J.; Kim, I. A Fixed-Film Bio-Media Process Used for Biological Nitrogen Removal from Sewage Treatment Plant. Nitrogen 2022, 3, 528–538. [Google Scholar] [CrossRef]
  7. Odegaard, H.; Rusten, B.; Siljudalen, J. The development of the moving bed biofilm process- from idea to commercial product. Eur. Water Manag. 1999, 2, 36–43. [Google Scholar]
  8. Wei, Y.; Ji, M.; Li, R.; Qin, F. Organic and nitrogen removal from landfill leachate in aerobic granular sludge sequencing batch reactors. Waste Manag. 2012, 32, 448–455. [Google Scholar] [CrossRef]
  9. Dhamole, P.B.; D’Souza, S.; Lele, S. A review on alternative carbon sources for biological treatment of nitrate waste. J. Inst. Eng. (India) Ser. E 2015, 96, 63–73. [Google Scholar] [CrossRef]
  10. MacDonald, D.V. Denitrification by Fluidized Biofilm Reactor. Water Sci. Technol. 1990, 22, 451–461. [Google Scholar] [CrossRef]
  11. Zhang, H.; Jiang, J.; Li, M.; Yan, F.; Gong, C.; Wang, Q. Biological nitrate removal using a food waste-derived carbon source in synthetic wastewater and real sewage. J. Environ. Manag. 2016, 166, 407–413. [Google Scholar] [CrossRef]
  12. Cappai, G.; Carucci, A.; Onnis, A. Use of industrial wastewaters for the optimization and control of nitrogen removal processes. Water Sci. Technol. 2004, 50, 17–24. [Google Scholar] [CrossRef] [PubMed]
  13. Fernández-Nava, Y.; Marañón, E.; Soons, J.; Castrillón, L. Denitrification of high nitrate concentration wastewater using alternative carbon sources. J. Hazard. Mater. 2010, 173, 682–688. [Google Scholar] [CrossRef]
  14. Rodriguez, L.; Villasenor, J.; Fernández, F. Use of agro-food wastewaters for the optimisation of the denitrification process. Water Sci. Technol. 2007, 55, 63–70. [Google Scholar] [CrossRef] [PubMed]
  15. Pang, Y.; Wang, J. Various electron donors for biological nitrate removal: A review. Sci. Total Environ. 2021, 794, 148699. [Google Scholar] [CrossRef]
  16. Feng, X.-C.; Bao, X.; Che, L.; Wu, Q.-L. Enhance biological nitrogen and phosphorus removal in wastewater treatment process by adding food waste fermentation liquid as external carbon source. Biochem. Eng. J. 2021, 165, 107811. [Google Scholar] [CrossRef]
  17. Ngo, T.; Shahsavari, E.; Shah, K.; Surapaneni, A.; Ball, A.S. Improving bioenergy production in anaerobic digestion systems utilising chicken manure via pyrolysed biochar additives: A review. Fuel 2022, 316, 123374. [Google Scholar] [CrossRef]
  18. Sar, T.; Larsson, K.; Fristedt, R.; Undeland, I.; Taherzadeh, M.J. scale production of protein-rich fungal biomass from potato protein liquor for use as innovative food and feed products. Food Biosci. 2022, 47, 101637. [Google Scholar] [CrossRef]
  19. Sapmaz, T.; Uwineza, C.; Mahboubi, A.; De Wever, H.; Koseoglu-Imer, D.Y.; Taherzadeh, M.J. Towards maximum value creation from potato protein liquor: Volatile fatty acids production from fungal cultivation effluent. Biomass Convers. Biorefin. 2023, 1–14. [Google Scholar] [CrossRef]
  20. Yin, D.M.; Uwineza, C.; Sapmaz, T.; Mahboubi, A.; De Wever, H.; Qiao, W.; Taherzadeh, M.J. Volatile Fatty Acids (VFA) Production and Recovery from Chicken Manure Using a High-Solid Anaerobic Membrane Bioreactor (AnMBR). Membranes 2022, 12, 1133. [Google Scholar] [CrossRef]
  21. Elefsiniotis, P.; Wareham, D.G.; Smith, M.O. Use of volatile fatty acids from an acid-phase digester for denitrification. J. Biotechnol. 2004, 114, 289–297. [Google Scholar] [CrossRef]
  22. Lee, W.S.; Chua, A.S.M.; Yeoh, H.K.; Ngoh, G.C. A review of the production and applications of waste-derived volatile fatty acids. Chem. Eng. J. 2014, 235, 83–99. [Google Scholar] [CrossRef]
  23. Mahmoud, A.; Hamza, R.A.; Elbeshbishy, E. Enhancement of denitrification efficiency using municipal and industrial waste fermentation liquids as external carbon sources. Sci. Total Environ. 2022, 816, 151578. [Google Scholar] [CrossRef] [PubMed]
  24. Jomnonkhaow, U.; Uwineza, C.; Mahboubi, A.; Wainaina, S.; Reungsang, A.; Taherzadeh, M.J. Membrane bioreactor-assisted volatile fatty acids production and in situ recovery from cow manure. Bioresour. Technol. 2021, 321, 124456. [Google Scholar] [CrossRef] [PubMed]
  25. Sapmaz, T.; Manafi, R.; Mahboubi, A.; Lorick, D.; Koseoglu-Imer, D.Y.; Taherzadeh, M.J. Potential of food waste-derived volatile fatty acids as alternative carbon source for denitrifying moving bed biofilm reactors. Bioresour. Technol. 2022, 364, 128046. [Google Scholar] [CrossRef] [PubMed]
  26. Shrestha, A.; Riffat, R.; Bott, C.; Takacs, I.; Stinson, B.; Peric, M.; Neupane, D.; Murthy, S. Denitrification stoichiometry and kinetics of moving bed biofilm reactor. Proc. Water Environ. Fed. 2009, 2009, 153–165. [Google Scholar] [CrossRef]
  27. Elefsiniotis, P.; Wareham, D.G. Utilization patterns of volatile fatty acids in the denitrification reaction. Enzym. Microb. Technol. 2007, 41, 92–97. [Google Scholar] [CrossRef]
  28. Sapmaz, T.; Mahboubi, A.; Taher, M.N.; Beler-Baykal, B.; Karagunduz, A.; Taherzadeh, M.J.; Koseoglu-Imer, D.Y. Waste-derived volatile fatty acid production and ammonium removal from it by ion exchange process with natural zeolite. Bioengineered 2022, 13, 14751–14769. [Google Scholar] [CrossRef]
  29. Barber, W.P.; Stuckey, D.C. Nitrogen removal in a modified anaerobic baffled reactor (ABR): 1, denitrification. Water Res. 2000, 34, 2413–2422. [Google Scholar] [CrossRef]
  30. Du, S.; Ya, T.; Zhang, M.; Zhu, M.; Li, N.; Liu, S.; Wang, X. Distinct microbial communities and their networks in an anammox coupled with sulfur autotrophic/mixotrophic denitrification system. Environ. Pollut. 2020, 262, 114190. [Google Scholar] [CrossRef]
  31. Kim, H.; Kim, J.; Shin, S.G.; Hwang, S.; Lee, C. Continuous fermentation of food waste leachate for the production of volatile fatty acids and potential as a denitrification carbon source. Bioresour. Technol. 2016, 207, 440–445. [Google Scholar] [CrossRef]
  32. Liu, F.; Tian, Y.; Ding, Y.; Li, Z. The use of fermentation liquid of wastewater primary sedimentation sludge as supplemental carbon source for denitrification based on enhanced anaerobic fermentation. Bioresour. Technol. 2016, 219, 6–13. [Google Scholar] [CrossRef]
  33. Bill, K.A.; Bott, C.B.; Murthy, S.N. Evaluation of alternative electron donors for denitrifying moving bed biofilm reactors (MBBRs). Water Sci. Technol. 2009, 60, 2647–2657. [Google Scholar] [CrossRef]
  34. Rittmann, B.E.; McCarty, P.L. Environmental Biotechnology: Principles and Applications; McGraw-Hill Education: New York, NY, USA, 2001. [Google Scholar]
  35. Albina, P.; Durban, N.; Bertron, A.; Albrecht, A.; Robinet, J.-C.; Erable, B. Influence of hydrogen electron donor, alkaline pH, and high nitrate concentrations on microbial denitrification: A review. Int. J. Mol. Sci. 2019, 20, 5163. [Google Scholar] [CrossRef]
  36. Ji, J.; Peng, Y.; Wang, B.; Wang, S. Achievement of high nitrite accumulation via endogenous partial denitrification (EPD). Bioresour. Technol. 2017, 224, 140–146. [Google Scholar] [CrossRef] [PubMed]
  37. Rusten, B.; Wien, A.; Skjefstad, J. Spent aircraft deicing fluid as external carbon source for denitrification of municipal wastewater: From waste problem to beneficial use. In Proceedings of the 51st Purdue Industrial Waste Conference, West Lafayette, IN, USA, 1 May 1997; pp. 359–370. [Google Scholar]
  38. Aspegren, H.; Nyberg, U.; Andersson, B.; Gotthardsson, S.; la Cour Jansen, J. Post denitrification in a moving bed biofilm reactor process. Water Sci. Technol. 1998, 38, 31–38. [Google Scholar] [CrossRef]
  39. Schulz, H. Oxidation of fatty acids in eukaryotes. In New Comprehensive Biochemistry; Elsevier: Amsterdam, The Netherlands, 2002; Volume 36, pp. 127–150. [Google Scholar]
  40. He, Q.; Song, J.; Zhang, W.; Gao, S.; Wang, H.; Yu, J. Enhanced simultaneous nitrification, denitrification and phosphorus removal through mixed carbon source by aerobic granular sludge. J. Hazard. Mater. 2020, 382, 121043. [Google Scholar] [CrossRef] [PubMed]
Figure 1. Experimental schematic drawing of whole process.
Sustainability 15 06849 g001
Figure 2. (a) Denitrification rate, (b) denitrification capacity, and (ce) NOx-N removal profiles over time for AD-VFAs, sVFAs, and methanol.
Sustainability 15 06849 g002
Figure 3. (a) Denitrification rate, (b) denitrification capacity, and (cf) NOx-N removal profiles over time for co-fed carbon sources.
Sustainability 15 06849 g003
Figure 4. (a) Denitrification rate, (b) denitrification capacity, and (c) NOx-N concentrations for methanol together with sVFA and AD-VFA.
Sustainability 15 06849 g004
Figure 5. (a) Denitrification rate and (b) denitrification capacity using sequential addition of VFA and methanol; (c) NOx-N concentrations.
Sustainability 15 06849 g005
Table 1. Characteristics of evaluated carbon sources.
ParametersCarbon Sources
AD-VFACKMsVFACKMAD-VFAPPLsVFAPPLMethanolEthanol
pH6.32 ± 0.022.99 ± 0.027.73 ± 0.022.97 ± 0.02--
sCOD (g/L)14.5 ± 0.719 ± 0.0012.5 ± 0.008.75 ± 0.0011851650
NH4+-N (mg/L)2540.0 ± 28.28-485.0 ± 7.07---
PO4-P (mg/L)1747.0 ± 15.56-33.0 ± 0.28---
NO3-N (mg/L)20.8 ± 0.57-16.05 ± 0.21---
NO2-N (mg/L)0.20 ± 0.00-0.31 ± 0.00---
Acetic acid (g/L)4.36 ± 0.024.4 ± 0.104.15 ± 0.094.1 ± 0.10--
Propionic acid (g/L)0.74 ± 0.010.7 ± 0.100.50 ± 0.190.5 ± 0.10--
Iso-butyric acid (g/L)0.26 ± 0.040.3 ± 0.100.13 ± 0.060.1 ± 0.10--
Butyric acid (g/L)1.03 ± 0.091 ± 0.100.66 ± 0.050.7 ± 0.10--
Isovaleric acid (g/L)0.02 ± 0.000.02 ± 0.010.00 ± 0.000.0 ± 0.00--
Valeric acid (g/L)0.02 ± 0.000.02 ± 0.010.02 ± 0.000.02 ± 0.01--
Caproic acid (g/L)0.49 ± 0.010.5 ± 0.100.52 ± 0.010.5 ± 0.10--
tVFA (g/L)6.92 ± 0.087 ± 0.105.98 ± 0.076 ± 0.10--
Table 2. pH, temperature, and nutrient change during the denitrification.
Carbon Source UsedCarbon Sources (CS)
(Methanol)(AD-VFAPPL)(sVFAPPL)(AD-VFACKM)(sVFACKM)
pH, 0 min7.05 ± 0.116.94 ± 0.037.03 ± 0.067.10 ± 0.147.16 ± 0.25
pH, 60 min7.66 ± 0.117.71 ± 0.157.37 ± 0.417.40 ± 0.287.43 ± 0.49
T (°C), 0 min15.02 ± 1.0015.70 ± 0.5715.85 ± 0.7815.70 ± 0.9915.45 ± 1.77
T (°C), 60 min17.52 ± 1.0017.70 ± 0.5717.55 ± 0.7818.00 ± 0.9918.15 ± 1.77
NH4-N, 0 min8.3 ± 1.311.8 ± 0.37.6 ± 0.619.0 ± 0.88.1 ± 0.6
NH4-N, 60 min8.8 ± 0.012.3 ± 1.87.7 ± 1.217.4 ± 3.08.5 ± 0.7
PO4-P, 0 min3.4 ± 1.73.1 ± 3.22.1 ± 1.94.3 ± 1.23.0 ± 0.4
PO4-P, 60 min2.1 ± 1.33.3 ± 1.92.2 ± 1.25.7 ± 2.43.3 ± 0.2
COD of CS (g/L)1185.012.58.815.511.0
Volume of CS added (mL)0.20119.0427.2016.4121.64
Table 3. pH, temperature, and nutrient change during co-fed carbon sources.
Carbon Source UsedCarbon Sources (CS)
(Ethanol)(Ethanol + Methanol)(Ethanol + sVFAPPL)(Methanol + sVFAPPL)(Methanol + AD-VFAPPL)
pH, 0 min7.7 ± 0.027.44 ± 0.006.99 ± 0.216.98 ± 0.017.06 ± 0.03
pH, 60 min7.38 ± 0.387.72 ± 0.007.33 ± 0.017.51 ± 0.037.71 ± 0.01
T (°C), 0 min14.6 ± 0.714.8 ± 0.014.8 ± 0.7818.3 ± 0.2618.7 ± 0.07
T (°C), 60 min17.4 ± 0.717.9 ± 0.0018.45 ± 0.819.7 ± 0.0719.5 ± 0.07
NH4-N, 0 min7.1 ± 1.89.5 ± 0.17.7 ± 1.27.8 ± 0.49.5 ± 0.7
NH4-N, 60 min8.5 ± 2.110.0 ± 1.38.1 ± 1.07.0 ± 0.09.5 ± 0.7
PO4-P, 0 min2.5 ± 0.32.4 ± 0.33.6 ± 0.21.7 ± 0.12.0 ± 0.1
PO4-P, 60 min2.6 ± 0.22.3 ± 0.22.8 ± 0.31.2 ± 0.01.8 ± 0.0
COD of CS (g/L)16501650∣11851650∣8.751185∣8.751185∣12.5
Volume of CS added (µL)14472∣100.572∣13,600100.5∣13,600100.5∣9520
Table 4. pH, temperature, and nutrients during sequential addition of methanol and AD-VFAPPL.
ParametersCarbon Sources (CS) Used
1. AD-VFAPPL (0–30 min) + 2. Methanol (30–60 min)1. Methanol (0–30 min) + 2. AD-VFAPPL (30–60 min)
pH, 0 min7.25 ± 0.037.29 ± 0.01
pH, 60 min7.82 ± 0.067.82 ± 0.01
T (°C), 0 min18.3 ± 0.7118.15 ± 0.21
T (°C), 60 min19.70 ± 0.1419.85 ± 0.07
NH4-N (mg/L), 0 min11.0 ± 0.011.5 ± 0.7
NH4-N (mg/L), 60 min11.0 ± 1.411.0 ± 1.4
PO4-P (mg/L), 0 min2.5 ± 0.02.5 ± 0.1
PO4-P (mg/L), 60 min2.3 ± 0.12.2 ± 0.1
COD of CS (g/L)12.5∣11851185∣12.5
Volume of CS added (mL)9.52∣0.10050.1005∣9.52
Disclaimer/Publisher’s Note: The statements, opinions and data contained in all publications are solely those of the individual author(s) and contributor(s) and not of MDPI and/or the editor(s). MDPI and/or the editor(s) disclaim responsibility for any injury to people or property resulting from any ideas, methods, instructions or products referred to in the content.

