Article

Analysis of Eco-Environmental Geological Problems and Their Driving Forces in the Henan Section of the Yellow River Basin, China

1
Insitute of Resources & Environment, Henan Polytechnic University, Jiaozuo 454000, China
2
Insitute of Traffic Engineering, Huanghe Jiaotong University, Jiaozuo 454000, China
*
Author to whom correspondence should be addressed.
Sustainability 2023, 15(8), 6818; https://doi.org/10.3390/su15086818
Submission received: 12 January 2023 / Revised: 6 April 2023 / Accepted: 11 April 2023 / Published: 18 April 2023

Abstract

:
(1) Background: The Henan section of the Yellow River Basin plays an important role in the economic zone of the middle reaches of the Yellow River. However, ecological environmental geological problems such as soil erosion have seriously affected the lives of residents and economic development, resulting in increasingly prominent conflicts between humans and the environment. Therefore, this paper made use of remote sensing images and other reference data, integrated image classification, remote sensing inversion and statistical analysis methods to explore the ecological environmental geological problems and their causes in the Henan section of the Yellow River Basin. (2) Results: the main eco-environmental geological problems in the Sanmenxia–Zhengzhou section are serious soil erosion, degradation of water conservation function and being prone to geological disasters. The main eco-environmental geological problems in the Zhengzhou–Puyang section are poor water and soil conservation function, degradation of water conservation function and poor biodiversity maintenance function. In the last 19 years, the eco-environmental geological problems in the Henan section of the Yellow River Basin have shown a significant improvement trend as a whole. Along the main stream of the Yellow River in Sanmenxia, Luoyang, Jiyuan, Jiaozuo, Zhengzhou and other areas, the eco-environmental geological problems are still prominent; altitude, vegetation and rainfall are the key driving factors of eco-environmental geological problems in the Sanmenxia–Zhengzhou section and rainfall, vegetation and land-use type are the key driving factors in the Zhengzhou–Puyang section. (3) Conclusions: This study comprehensively considered the three aspects of ecology, environment and geology in a total of five research topics. The temporal and spatial distribution characteristics and driving factors of ecological environmental geological problems in the Yellow River Basin were analyzed, which could provide technical support for ecological environmental protection and high-quality development in the Yellow River Basin.

1. Introduction

Human beings, the ecological environment and the geological environment are closely linked. The ecological environment and the geological environment are the material bases for human existence, and human beings, the ecological environment and the geological environment affect each other [1,2,3,4,5]. A good ecological and geological environment is necessary for human survival and development as well as for humans’ well-being. The traditional way of extensive growth has promoted the rapid development of the economy, but it has also caused serious problems in the ecological environment and geology. The Yellow River is an important water source in northwestern and northern China and is also the axis of inland economic development in the 21st century [6,7]. Henan province, located in the center of the Yellow River Basin, is an important province of agriculture, grain production and animal husbandry in China; it has established special status and significance in the Henan section of the Yellow River in the provinces along the Yellow River [8]. However, in recent decades, the ecological and geological environment of the Yellow River Basin has suffered serious damage [1]. The ecological environmental geological problems in the Henan section of the Yellow River Basin, such as sediment deposition, soil erosion, river channel swing and frequent geological disasters, have not been completely solved [9,10]. In this context, it is meaningful to study the tortuous development and evolution process and the leading factors of ecological environmental geology in the Henan section of the Yellow River Basin.
At present, there is no unified definition of eco-environmental geology, which was first proposed by Russia [11]. In our country, it was first proposed by two scholars Zhang Zonghu and Yuan Daoxian [12], then by many scholars [13,14,15,16,17] covering different layers to examine the discussed research content and to effectively promote the development of ecological environmental geology. On this basis, scholars investigated the eco-environmental geology at the watershed scale [18,19], evaluated the quality of regional eco-environmental geology [20,21] and classified the risk level of eco-environmental geology [22], etc. At present, research on the Henan section of the Yellow River Basin pays more attention to a single aspect of a problem or analyzes existing problems such as water environment pollution, water shortage, soil pollution and geological disasters [23,24], as well as geological disasters, soil erosion and environmental pollution caused by mining in major coal mining areas [25]. The biodiversity of the Yiluo River basin was investigated and evaluated [26] and the water conservation function of the Yellow River Basin in Henan province was evaluated by remote sensing technology [27,28]. Although these studies have played a positive role in the ecological and geological environmental protection and regional sustainable development of the watershed and have certain reference significance for subsequent research, there are still some shortcomings. For the Henan section of the Yellow River Basin, there are few studies that analyze the spatiotemporal evolution characteristics and driving forces of ecological environmental geology from both natural and human activities.
Therefore, this study attempted to comprehensively sort out the ecological environmental geological problems of the study area and to diagnose the factors that affect the high-quality development of the area. The contributions of this study included the following three aspects: first, to clarify the ecological environment and geological status of the study area based on the regional survey results; secondly, the five major research topics were divided into different topics and the spatial and temporal evolution characteristics of ecological environmental geological problems in the study area were quantitatively reflected; thirdly, geographical detector and correlation analysis were used to determine the main factors affecting regional development and corresponding strategies and suggestions were put forward to achieve high-quality development of the Yellow River Basin.

2. Materials and Methods

2.1. Study Area

The Henan section of the Yellow River Basin is located in the central and northern part of Henan province (Figure 1); its surface morphology is complex and diverse. The Yellow River enters Henan province from Shanxi Tongguan, starts from Lingbao city in the west and reaches Taiqian county in the east. It flows through 28 counties (cities and districts) in 9 cities: Sanmenxia, Luoyang, Jiyuan, Jiaozuo, Zhengzhou, Kaifeng, Xinxiang, Anyang and Puyang, with a total length of 711 km and a watershed area of about 36,200 square kilometers [29]. The Henan section of the Yellow River Basin has a continental monsoon climate, with an average annual rainfall of 597 mm, mainly from May to September, and an average annual temperature of 15.4 °C. The natural conditions are suitable for the growth of a variety of crops.

2.2. Data Sources

The data used in this paper included meteorological data, DEM data, soil data, land-use type data, remote sensing images and net primary productivity. Meteorological data were collected from 10 national meteorological stations in the study area, including rainfall and temperature. The DEM data were ASTER GDEM 30 m data from the geospatial data cloud. The soil texture data were obtained from the 1:1 million soil data provided by Nanjing Soil Institute in the second national land survey. The soil type data were obtained from the Center for Resources and Environmental Science and Data of the Chinese Academy of Sciences and were reclassified into 6 first-level categories: cultivated land, forest land, grassland, water area, building land and unused land. Land-use type data were an MCD12Q1 product provided by NASA; remote sensing images were obtained from Landsat data of USGS and the geospatial data cloud (Table 1). ENVI 5.3 software (ENVI 5.3.1(64bit)) was used to preprocess the data, such as radiometric calibration and atmospheric correction, for the extraction of regional vegetation coverage. Net primary productivity and evapotranspiration of vegetation for MOD17A3H and MOD16A2 data were provided by NASA; all the above data were resampled to raster data of 250 × 250 m in ArcGIS10.2.

3. Research Methods

3.1. Soil Erosion Analysis

Soil erosion refers to a complex process in which soil and its parent materials are denuded, broken, separated and transported under the comprehensive action of the natural environment and human activities. The revised universal soil loss equation (RUSLE) proposed by Wischmier and USDA [30] was selected to calculate soil erosion in the study area:
A = R   ×   K   ×   S   ×   L   ×   C   ×   P
where A is the soil erosion modulus, namely the annual average soil erosion per unit area (international unit t/(hm2·a) converted into the common unit t/(km2·a) in China) and needs to multiply by the coefficient 100; R is the rainfall erosivity factor (international unit (MJ·mm)/(hm2·h·a)); K is the soil erodibility factor (international unit (t h)/(MJ·mm)); S, L, C and P are dimensionless factors, including slope factor, slope length factor, vegetation cover management factor and soil and water conservation measure factor, respectively.

3.2. Functional Analysis of Soil and Water Conservation

Soil and water conservation refers to the reduction or improvement of soil erosion caused by hydraulic erosion by the ecosystem through its nature and structure and corresponding processes, which is one of the important functions of ecosystem self-regulation. In this paper, the ecological service model of soil and water conservation based on the RUSLE equation was used to calculate the amount of soil and water conservation in the study area (Environmental Office Ecology (2017) No. 48). The formula is as follows:
A c = A r A = R   ×   K   ×   LS   ×   1     C   ×   P
where Ac is the amount of water and soil conservation (unit t/(hm2·a)), which needs to be multiplied by coefficient 100 when converted into the Chinese unit t/(km2·a); Ar is potential soil erosion; A is actual soil erosion.

3.3. Analysis of Water Conservation Function

The water conservation function refers to the ability of the surface ecosystem to interact with water and to preserve it in the system under certain conditions. Water conservation is usually selected to reflect the level of the regional water conservation function. In this paper, the water balance equation was used to calculate water conservation in the study area [31,32], which can be expressed as:
TQ = i = 1 j M i   S i   ET i   ×   U i   ×   10 3
where TQ is the amount of water conservation in m3; Mi is the annual rainfall in mm. Si stands for surface runoff in mm; ETi is evapotranspiration in mm; Ui represents the area of a class I ecosystem in km2; i represents the category i ecosystem type in the region; j represents the number of ecosystem types in the region.

3.4. Analysis of Biodiversity Maintenance Function

The biodiversity maintenance function refers to the maintenance function of an ecosystem for all organisms in the earth biosphere, their genes and the living environment [33,34]. There are many calculation methods for biodiversity maintenance functions. In this paper, the NPP method is used for calculation (Environmental Office Ecology (2017) No. 48); the formula is as follows:
S Bio = NPP   ×   M   ×   T   ×   1     H
where SBio represents the biodiversity maintenance function index, NPP is the annual net primary productivity of vegetation, M is the annual rainfall, T is the annual average temperature, and H is the altitude factor.

3.5. Analysis of the Susceptibility of Geological Disasters

Geological disasters are natural phenomena caused by climate change, adverse geological conditions and human activities that cause serious losses and harm to people’s property and life safety [35]. Relevant studies show that the occurrences of geological disasters have obvious influences on regional ecological environmental geology, thus the evaluation of the susceptibility of geological disasters is very important. Based on the results of previous studies [36] and the actual situation of the study area, this paper evaluated the susceptibility of geological disasters in the study area by selecting the distance from the main stream of the Yellow River, vegetation coverage, rainfall, slope, soil type and distance from the mining area.

3.6. Comprehensive Analysis of the Ecological Environment and Geological Problems

The analysis of the eco-environmental geological problems started with the three aspects of “ecology”, “environment” and “geology” and comprehensively considered five issues such as soil erosion, soil and water conservation, water conservation, biodiversity maintenance and susceptibility to geological disasters. Each problem was de-dimensionalized and normalized and all problems were superimposed by using the ArcGIS superposition analysis function and classified into four levels of non-serious, relatively serious, serious and extremely serious by using the natural discontinuity method:
N + = X     X min X max X min
N - = X max   X X max X min
In the formula, N+ represents that the larger the index value X is the more serious the ecological and environmental geological problems will be; conversely, N represents that the smaller the index value X is the more serious the ecological environmental geological problems will be.

4. Results

4.1. Soil Erosion Analysis

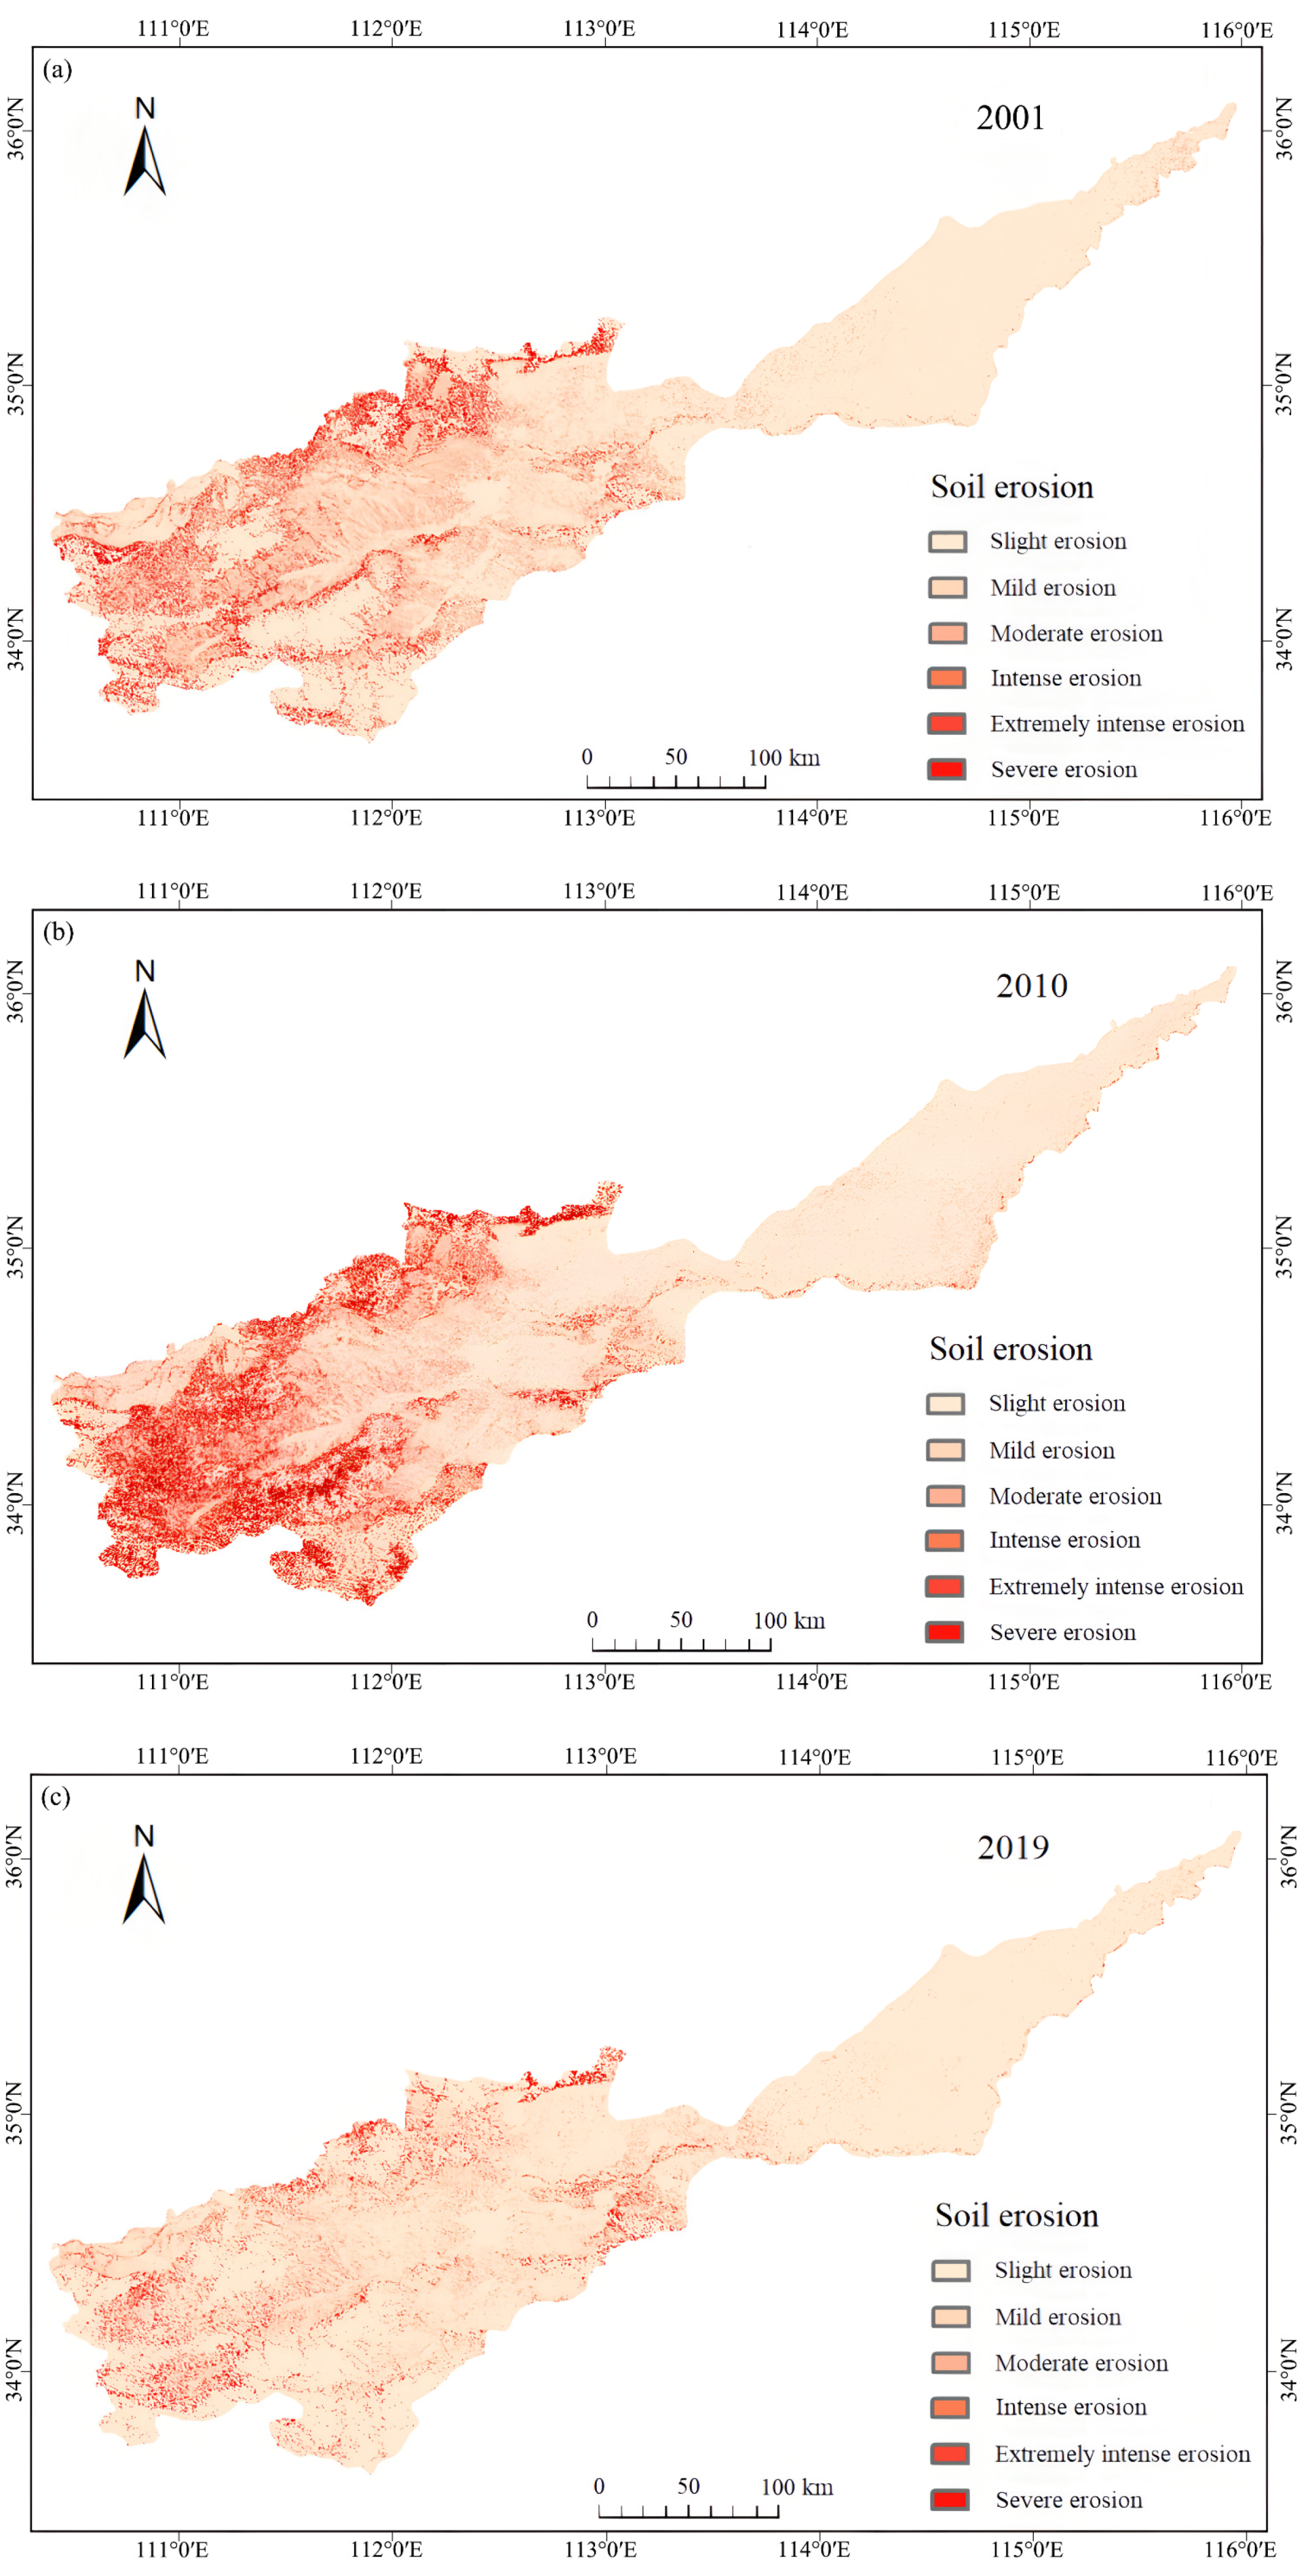
The soil erosion modulus in the study area in 2001, 2010 and 2019 was calculated according to Formula (1). According to the soil erosion classification and classification standard (SL 190-2007) [37] and the technical standard for comprehensive management of soil and water loss in northern rocky mountainous areas (SL 665-2014) (Table 2), soil erosion results in the study area could be divided into six grades, as shown in Figure 2.
It can be seen from Figure 2, that, over the years, the erosion intensity of all levels in the study area showed the highest proportion in the slight erosion areas, followed by the mild and moderate erosion areas and strong, extremely strong and severe level fluctuations. From 2001 to 2010, the areas occupied by micro-erosion, mild erosion, moderate erosion and intense erosion showed a decreasing trend, decreasing by 2181.22 km2, 809.44 km2, 149.30 km2 and 159.92 km2, respectively. The area of extremely intense erosion and severe erosion increased by 259.95 km2 and 3039.93 km2, respectively. On the whole, soil erosion in the study area was aggravated. There were large areas of sandstone and shale weathering materials in the basin [38], which provided a material basis for the occurrence of soil erosion; rainfall was the main force of soil erosion. From 2001 to 2010, the average annual rainfall increased from 430.12 mm to 608.87 mm in the study area. The main reason for soil erosion aggravation was the excessive scouring of weathering material caused by the sudden increases in rainfall. From 2010 to 2019, the area of micro-erosion in the study area showed an obvious increasing trend, with an increase of 7352.40 km2. The areas occupied by mild erosion, moderate erosion, intense erosion, extremely intense erosion and severe erosion all showed a decreasing trend, decreasing by 1916.63 km2, 757.63 km2, 535.14 km2, 943.64 km2 and 3199.36 km2, respectively. On the whole, the soil erosion status in the study area improved. Studies have shown that vegetation growth and development can effectively prevent soil erosion [39]. In recent years, the concept of “Lucid waters and lush mountains are invaluable assets” has been vigorously applied through afforestation and green mine construction in Henan province and has obtained certain achievements, especially in the mining areas distributed around the Sanmenxia and Luoyang regions, where vegetation coverage as a whole increased by 20%; the recovery of vegetation was the main reason for the reduction in soil erosion. In general, soil erosion in the study area showed an improving trend from 2001 to 2019, mainly showing an increase of 5171.18 km2 in the areas of slight erosion and a decrease in the areas of mild erosion to severe erosion.
Spatially, the intense, extremely intense and severe erosion levels were mainly concentrated in Sanmenxia, Luoyang, Jiyuan and other places in the west and northwest, while the slight and mild erosion levels mainly occurred in Xinxiang, Anyang, Puyang and other places. Soil erosion in the Henan section of the Yellow River Basin showed obvious spatial differences among different prefecture-level cities. Sanmenxia, in the west of the Yellow River Basin, showed the most serious soil erosion, accounting for 25% to 60% of the erosion area (slight erosion or above); mainly distributed in this area were yellow soil and brown soil, which were loose and easily eroded. As a result, the areas of intense, extremely intense and severe erosion in the city were significantly higher than in other cities and were mainly distributed in Lingbao city, Lushi county and Mianchi county, with higher elevations and larger slopes. Jiyuan and Luoyang took second place, with an erosion area accounting for 20~55%. Relevant studies have proven that changes in altitude and slope have a direct impact on soil erosion intensity [38,40]. Jiyuan and Luoyang are located in the hills to the transition zone of the plain. The elevation drop is about 1000 m and the difference in topographic relief is obvious, which is the main reason for the high areas of intense, extremely intense and severe erosion in this area; these areas are mainly distributed around Jiyuan city and Luanchuan county, Luoning and Song county. The elevations of Zhengzhou and Jiaozuo in the Yellow River Basin are relatively low and the degree of erosion is relatively light, accounting for 20~36% of the erosion area, mainly mild and moderate erosion; a small amount of intense, extremely intense and severe erosion is mainly distributed in the southern mountain area of Gongyi and the northern mountain area of Qinyang. The vegetation coverage of Xinxiang, Anyang and Puyang, located in the eastern Henan plain, is about 50% and the slope is below 5°. In this area, the erosion is mainly slight and mild and very few areas have intense, extremely intense and severe erosion.

4.2. Functional Analysis of Soil and Water Conservation

According to Formula (2), the temporal and spatial distribution data of soil and water conservation amounts in the study area in 2001, 2010 and 2019 were calculated, as shown in Figure 3.
From 2001 to 2019, the average amount of soil and water conservation in the study area increased first and then decreased. In 2001, the average soil and water conservation amount in the study area was 12,750.53 t·km−2·a−1. In 2010, the average soil and water conservation amount in the study area was 27,036.81 t·km−2·a−1. From 2001 to 2010, the average soil and water conservation amount increased by 14,286.28 t·km−2·a−1. This indicates that the soil and water conservation function of the study area presented a certain improvement trend. Relevant studies show that land-use types and vegetation coverage have a direct relationship with soil and water conservation functions [41]. According to statistics, the forest area in the study area increased by 206.38 km2 from 2001 to 2010 and the average vegetation coverage in the region increased by 0.06%. With the increase in forest area and vegetation coverage, the ability of soil fixation and the water retention of surface vegetation roots were enhanced, which was the main reason for the improvement of the soil and water conservation function in the watershed. In 2019, the average soil and water conservation amount in the study area was 19,923.31 t·km−2·a−1, which decreased by 7113.5 t·km−2·a−1 from 2010 to 2019, showing an opposite trend from the previous 10 years, indicating that the function of soil and water conservation in the study area was weakened during this period. From 2010 to 2019, the area of forestland and grassland decreased by 106.45 km2 and 43.92 km2, respectively. The decrease in forestland and grassland restricted the growth of vegetation and resulted in the decline of the water and soil conservation function in the basin. On the whole, the average amount of soil and water conservation in the study area showed an upward trend from 2001 to 2019 and the function of soil and water conservation improved.
As can be seen from Figure 3, the distribution of soil and water conservation capacity in the study area had obvious zonal characteristics, with the overall trend of high in the west and low in the east. Soil and water conservation capacity was positively correlated with vegetation coverage and negatively correlated with human activities [42]. Over the years, the vegetation coverage in Sanmenxia and Jiyuan areas was relatively high, both above 50%, and the area of regional forest and grassland accounted for 47% and 58% of the total area of forest and grassland in the whole basin, making the region’s average water and soil conservation the highest and water and soil conservation function the best; each square kilometer could prevent water and soil loss over 15,000 tons. The areas with better soil and water conservation functions were mainly distributed in the mountainous areas of Lingbao city, Lushi county and Jiyuan city, where forest coverage was higher and human activities were less. Luoyang and Zhengzhou were next, where the soil and water loss per square kilometer that could be prevented was more than 10,000 tons; the high-value area was mainly distributed in Luanchuan county, Luoning county and Gongyi city. Jiaozuo, Xinxiang, Anyang and Puyang regions had a large amount of cultivated land, which accounted for 74%, 85%, 89% and 87% of the Yellow River Basin area in each city. Excessive human activities led to poor soil and water conservation functions in this region; the preventable soil and water loss per square kilometer was less than 10,000 tons [17].

4.3. Analysis of Water Conservation Function

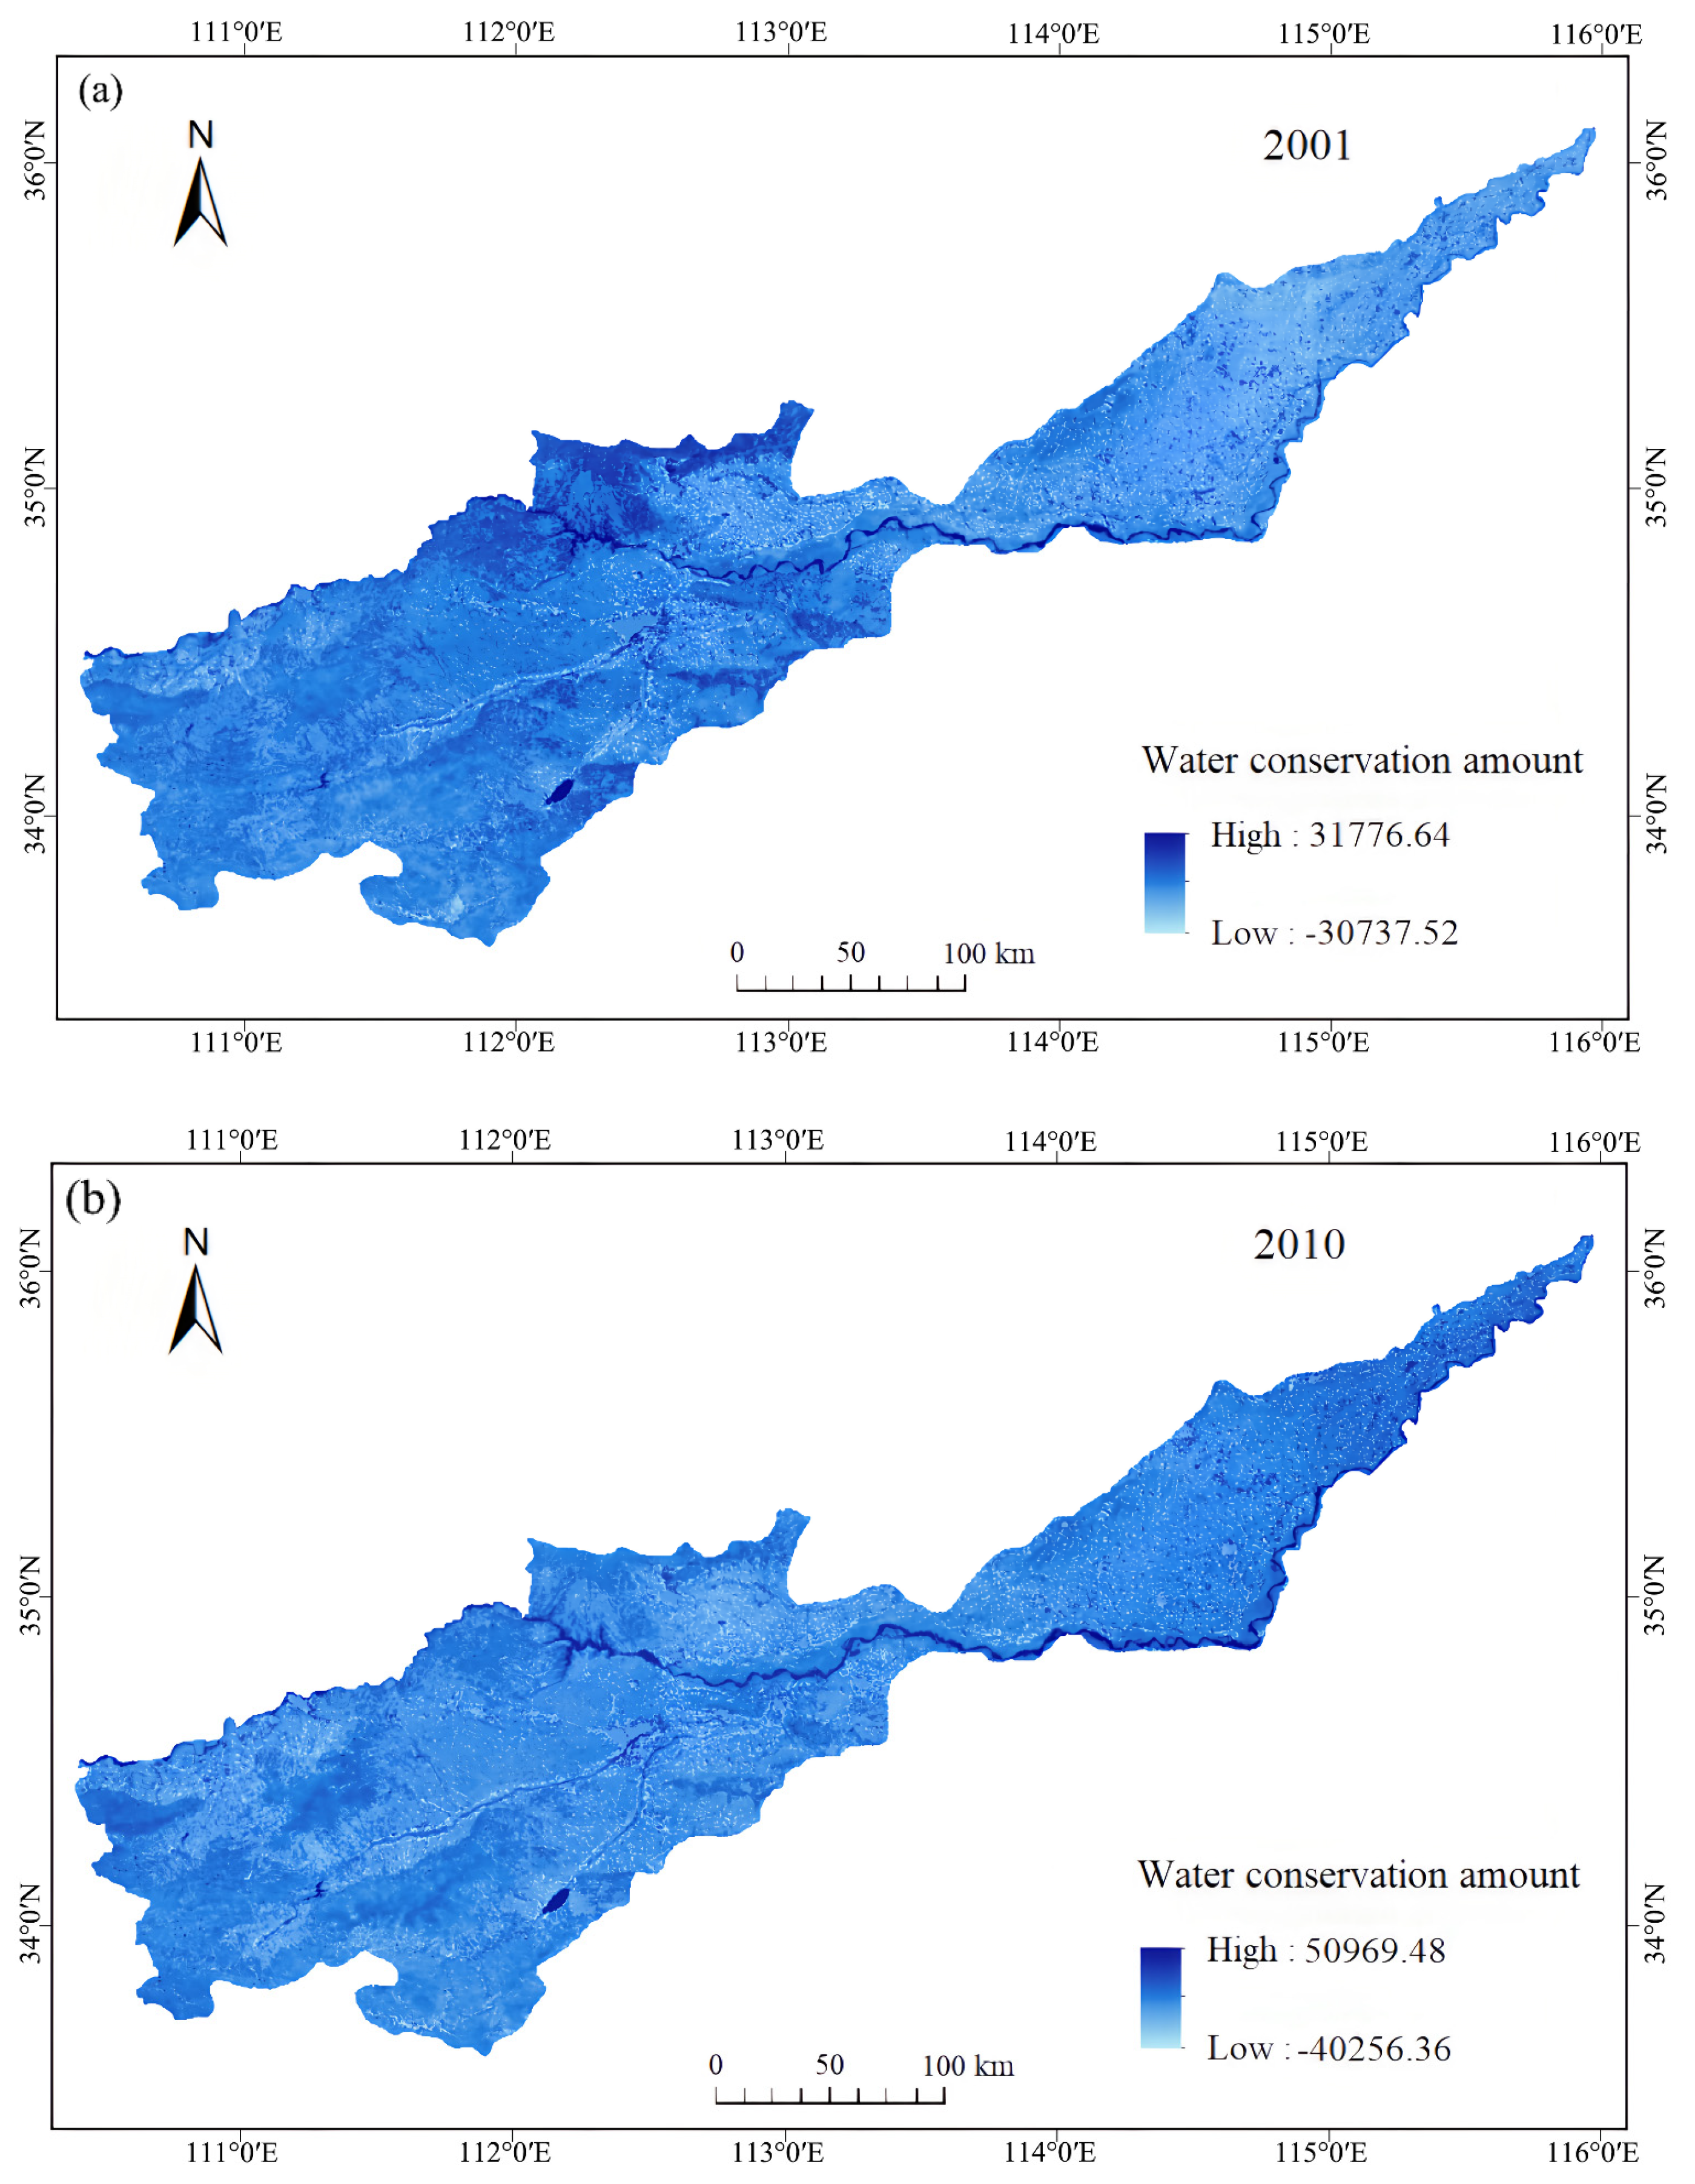
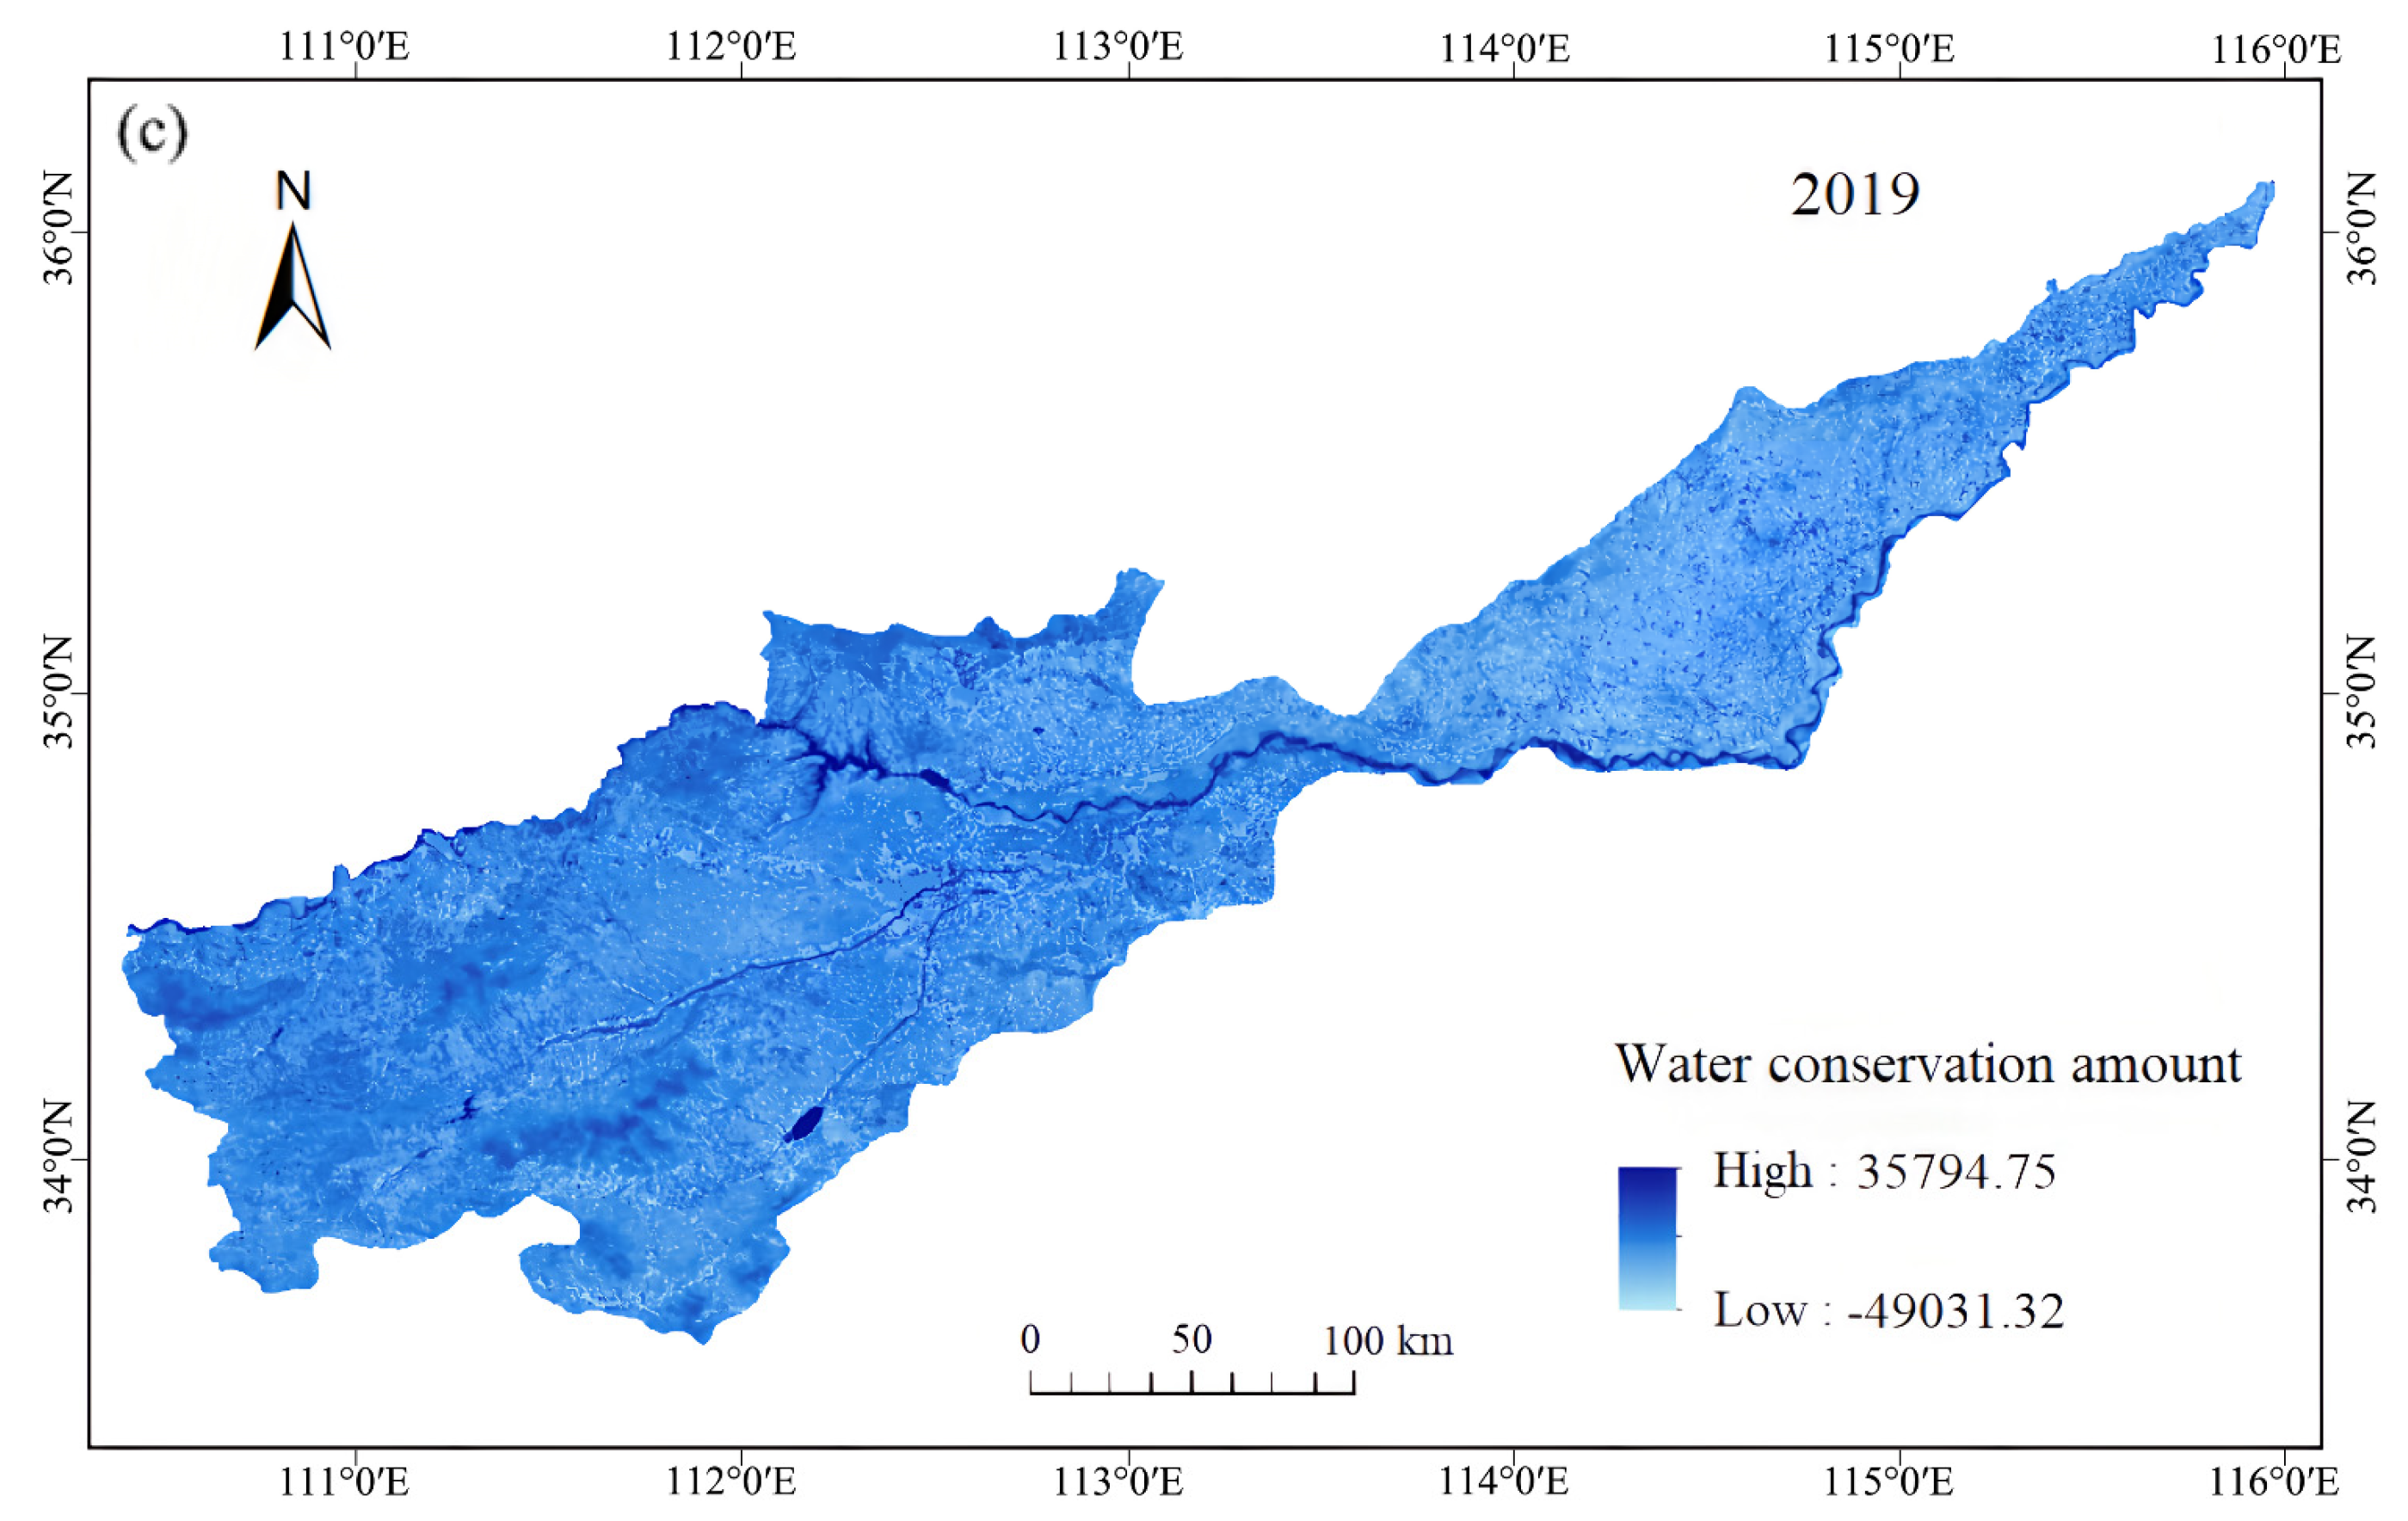
According to Formula (3), water conservation in the study area in 2001, 2010 and 2019 was calculated; its spatial and temporal distribution data are shown in Figure 4.
From 2001 to 2019, the average water conservation on grid cells (250 × 250 m) in the study area first increased and then decreased. In 2001, the average water conservation capacity of grid cells in the study area was 2699.44 m3 and the total water conservation was about 16.03 × 10⁸ m3. In 2010, the average water conservation capacity of grid cells was 5782.05 m3 and the total water conservation was about 34.33 × 10⁸ m3. Relevant studies have proven that water conservation has a direct relationship with rainfall [43]; the more regional rainfall there is, the greater the water conservation. According to statistics, compared with 2001, the average annual rainfall in 2010 increased by 178.75 mm, making the average water conservation of grid cells in the study area increase by 3082.61 m3; the total water conservation increased by 18.30 × 10⁸ m3, indicating that the water conservation function in the study area showed a positive trend. In 2019, the average water conservation of grid cells in the study area was 449.7 m3 and the total water conservation was about 2.67 × 10⁸ m3. From 2010 to 2019, the average annual rainfall decreased by 80.85 mm, resulting in a decrease of 5332.35 m3 in the mean water conservation of grid cells and 31.66 × 10⁸ m3 in total water conservation, indicating that the water conservation function in the study area showed an obvious trend of degradation. On the whole, the mean water conservation of grid cells in the study area showed a downward trend from 2001 to 2019 and the water conservation function became worse.
As can be seen from Figure 4, water conservation in most areas was positive, indicating that certain water could be stored in these areas. However, there was a negative value in some areas, such as Anyang city, and the average water conservation of the grid unit for many years was −1112.02 m3, proving that there was no water conservation in this area, rather a loss of 1112.02 m3. Relevant studies show that water conservation capacity is directly related to land use type. Generally speaking, the water conservation capacity of forest land and grassland is significantly better than that of cultivated land, building land and unused land and has a significant positive correlation with rainfall [44]. In recent years, the rainfall in Jiyuan, Sanmenxia and Zhengzhou was more than 400 mm and most of the land-use types were forest land and grassland, which made the water conservation function of the region the best and the average water conservation of grid units the highest (more than 1500 m3). The high values were mainly distributed on both sides of the Yellow River in Jiyuan city, Xingyang city and Lingbao city. The cultivated land in the Luoyang, Jiaozuo and Xinxiang areas was more than 2000 km2 and the water conservation function in these areas was lower than in the Sanmenxia and Jiyuan areas, although the average amount of water that could be stored in grid units was more than 0 m3. The rainfall in the Anyang and Puyang areas was low and the land use type was mainly cultivated land, resulting in low average water conservation on grid cells, especially in Anyang city, where the water conservation of grid cells was negative, which proved that the water conservation capacity of this region was poor.

4.4. Analysis of Biodiversity Maintenance Function

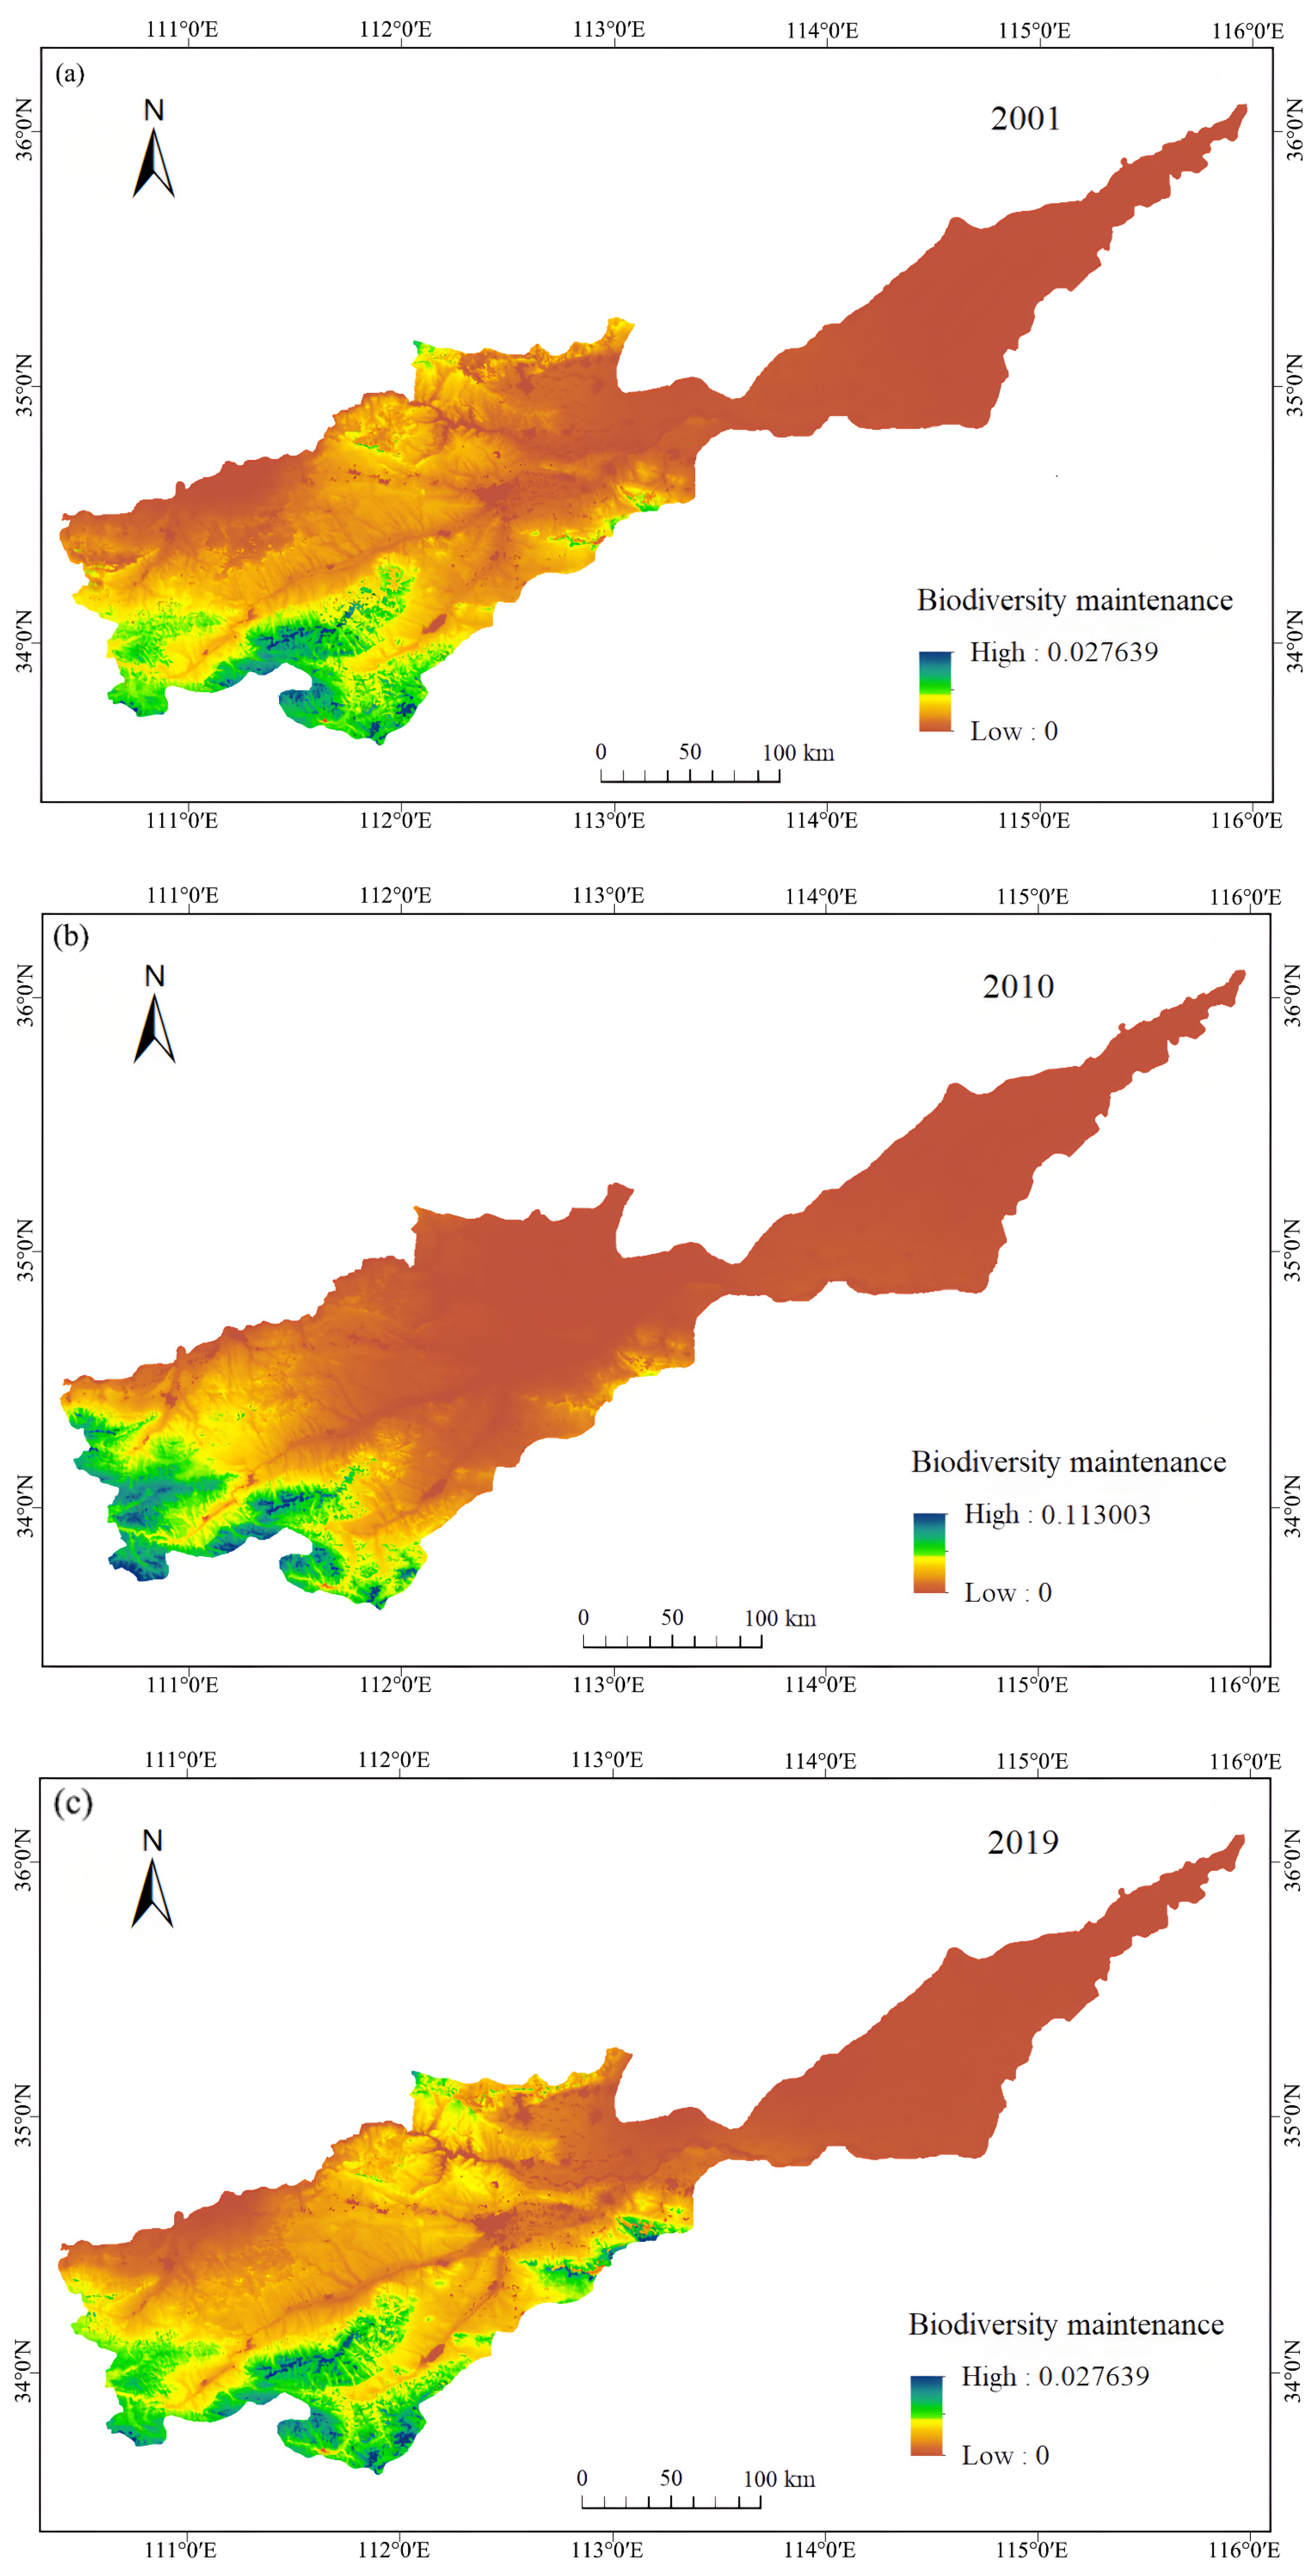
According to Formula (4), the biodiversity maintenance function indices in the study area in 2001, 2010 and 2019 were calculated and their spatial and temporal distribution data are shown in Figure 5.
From 2001 to 2019, the average value of the biodiversity maintenance function index in the study area showed an increasing trend. In 2001, the average value of the biodiversity maintenance function index was 0.003491; in 2010, it was 0.013377. From 2001 to 2010, the average value of the biodiversity maintenance function index increased by 0.009886; the results indicated that the biodiversity maintenance function of the study area showed a positive trend. The average value of the biodiversity maintenance function index in the study area was 0.017610 in 2019; it increased by 0.004233 from 2010 to 2019, indicating that the biodiversity maintenance function showed a slight improving trend during this period. On the whole, the average value of the biodiversity conservation function index in the study area increased gradually from 2001 to 2019 and the biodiversity conservation function showed a trend of continuous improvement. The main reason is that the precipitation and net primary productivity of vegetation in the study area increased significantly from 2001 to 2019. The temperature also increased, which provided a suitable living environment and rich material foundation for the survival and reproduction of various organisms and enhanced the role of the ecosystem in maintaining biodiversity.
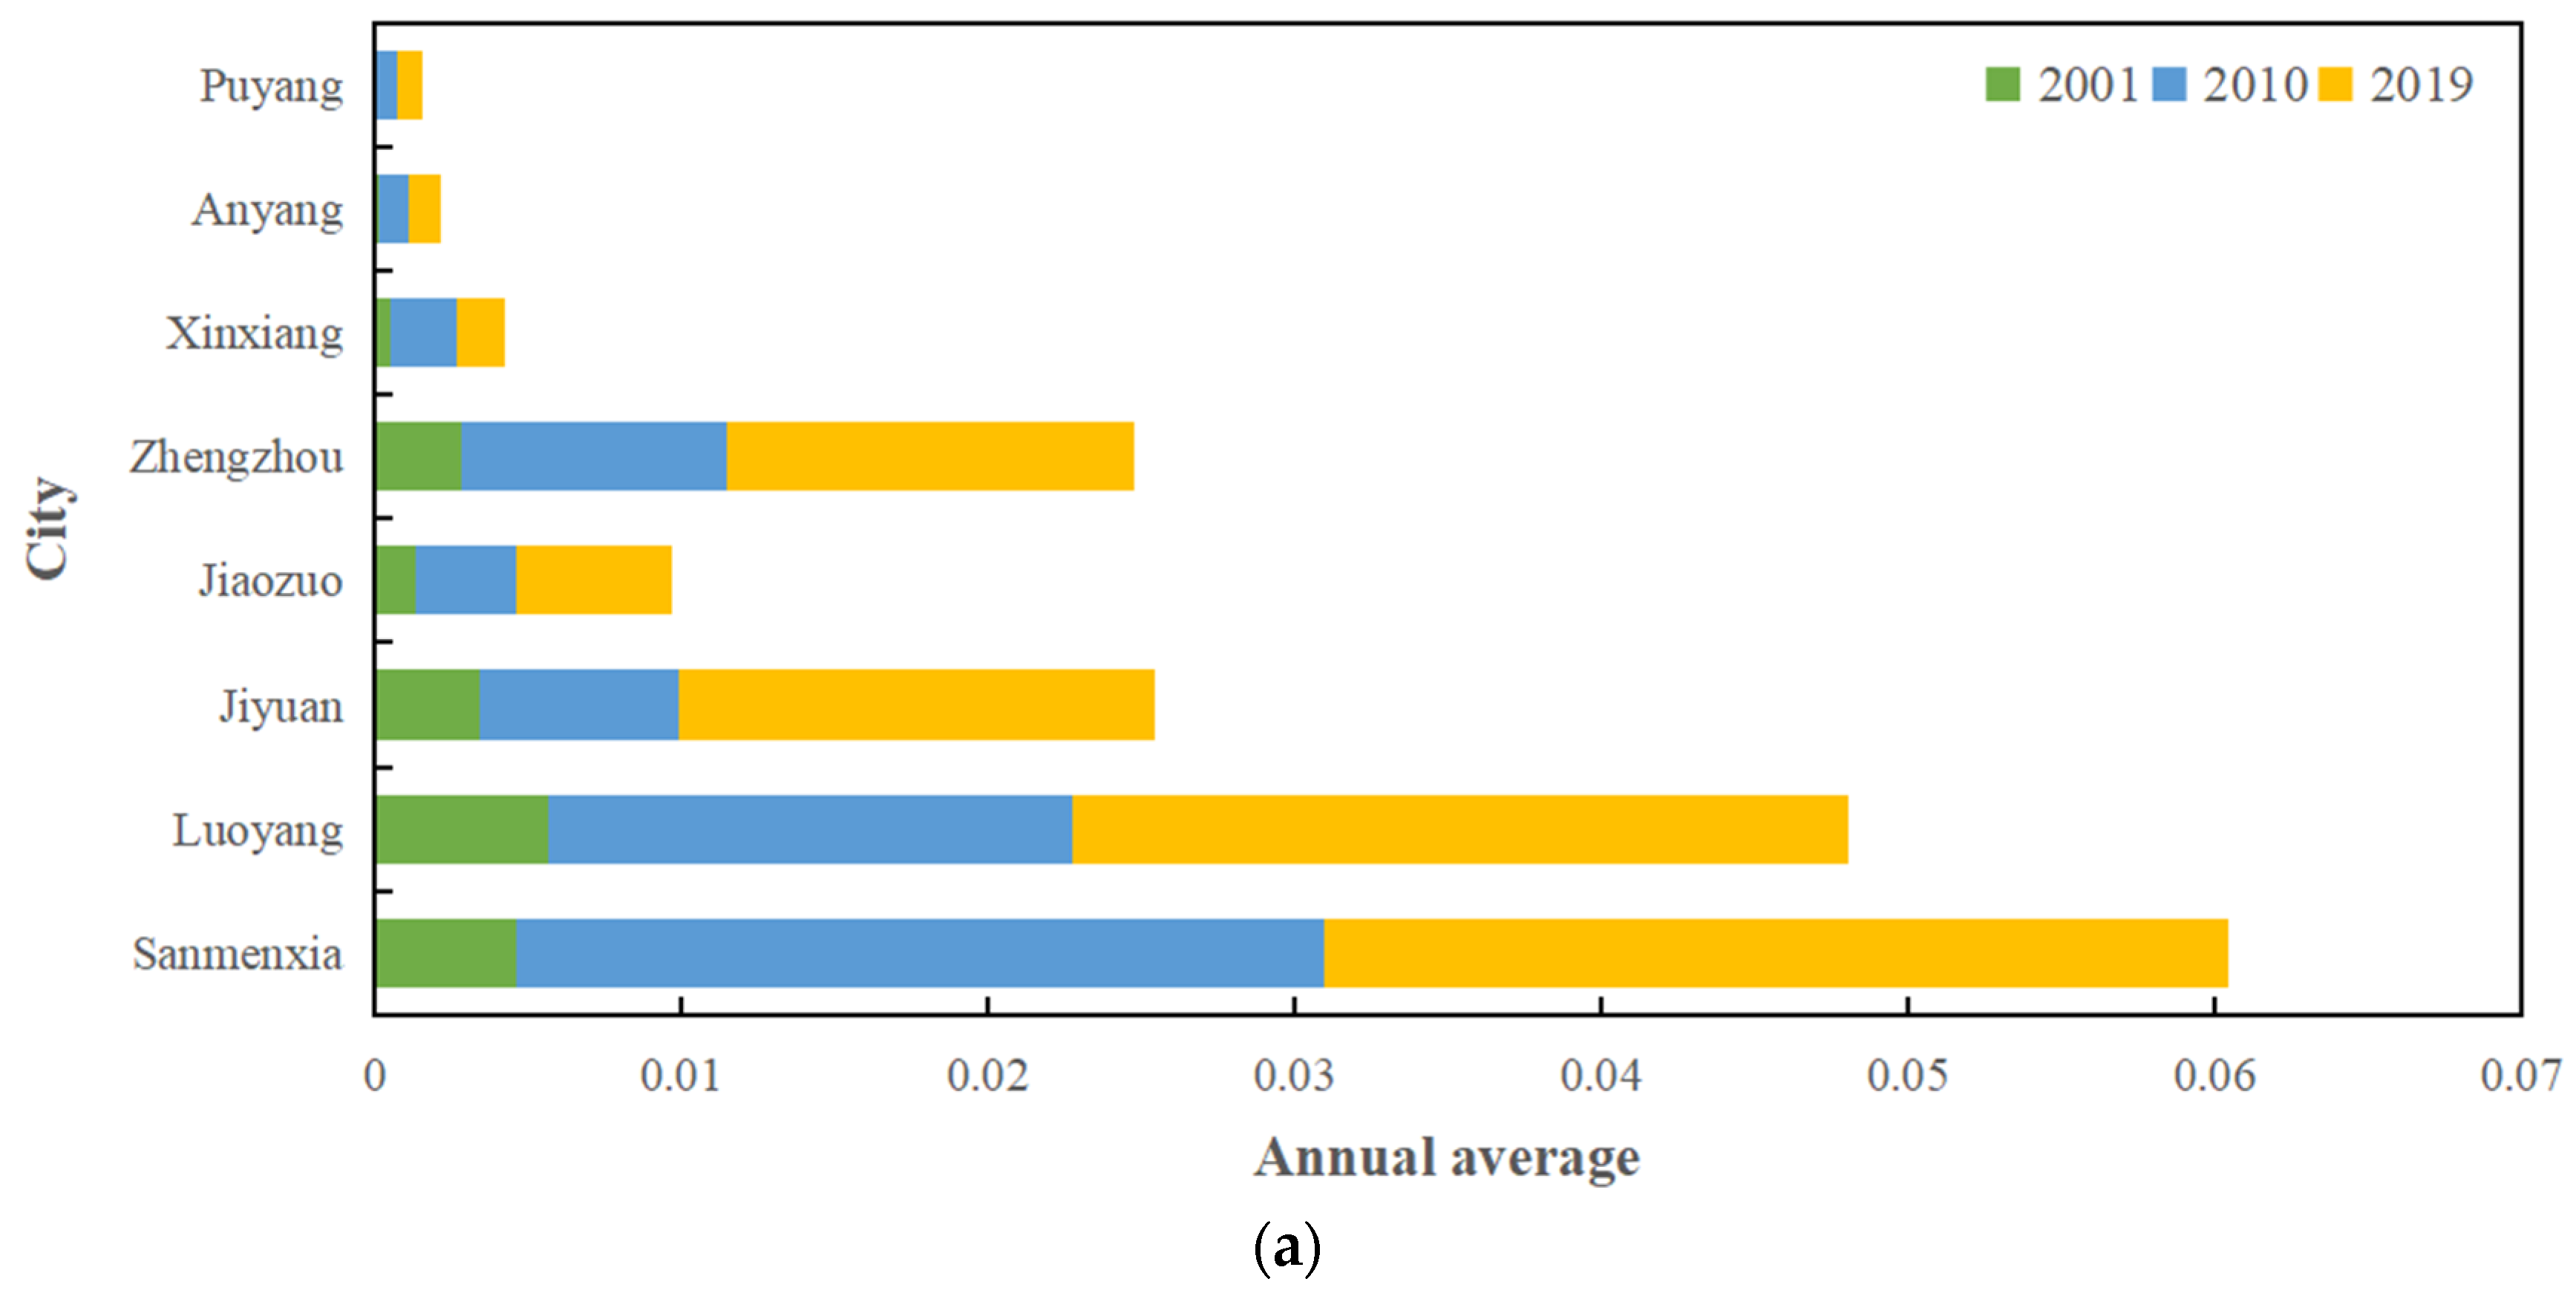
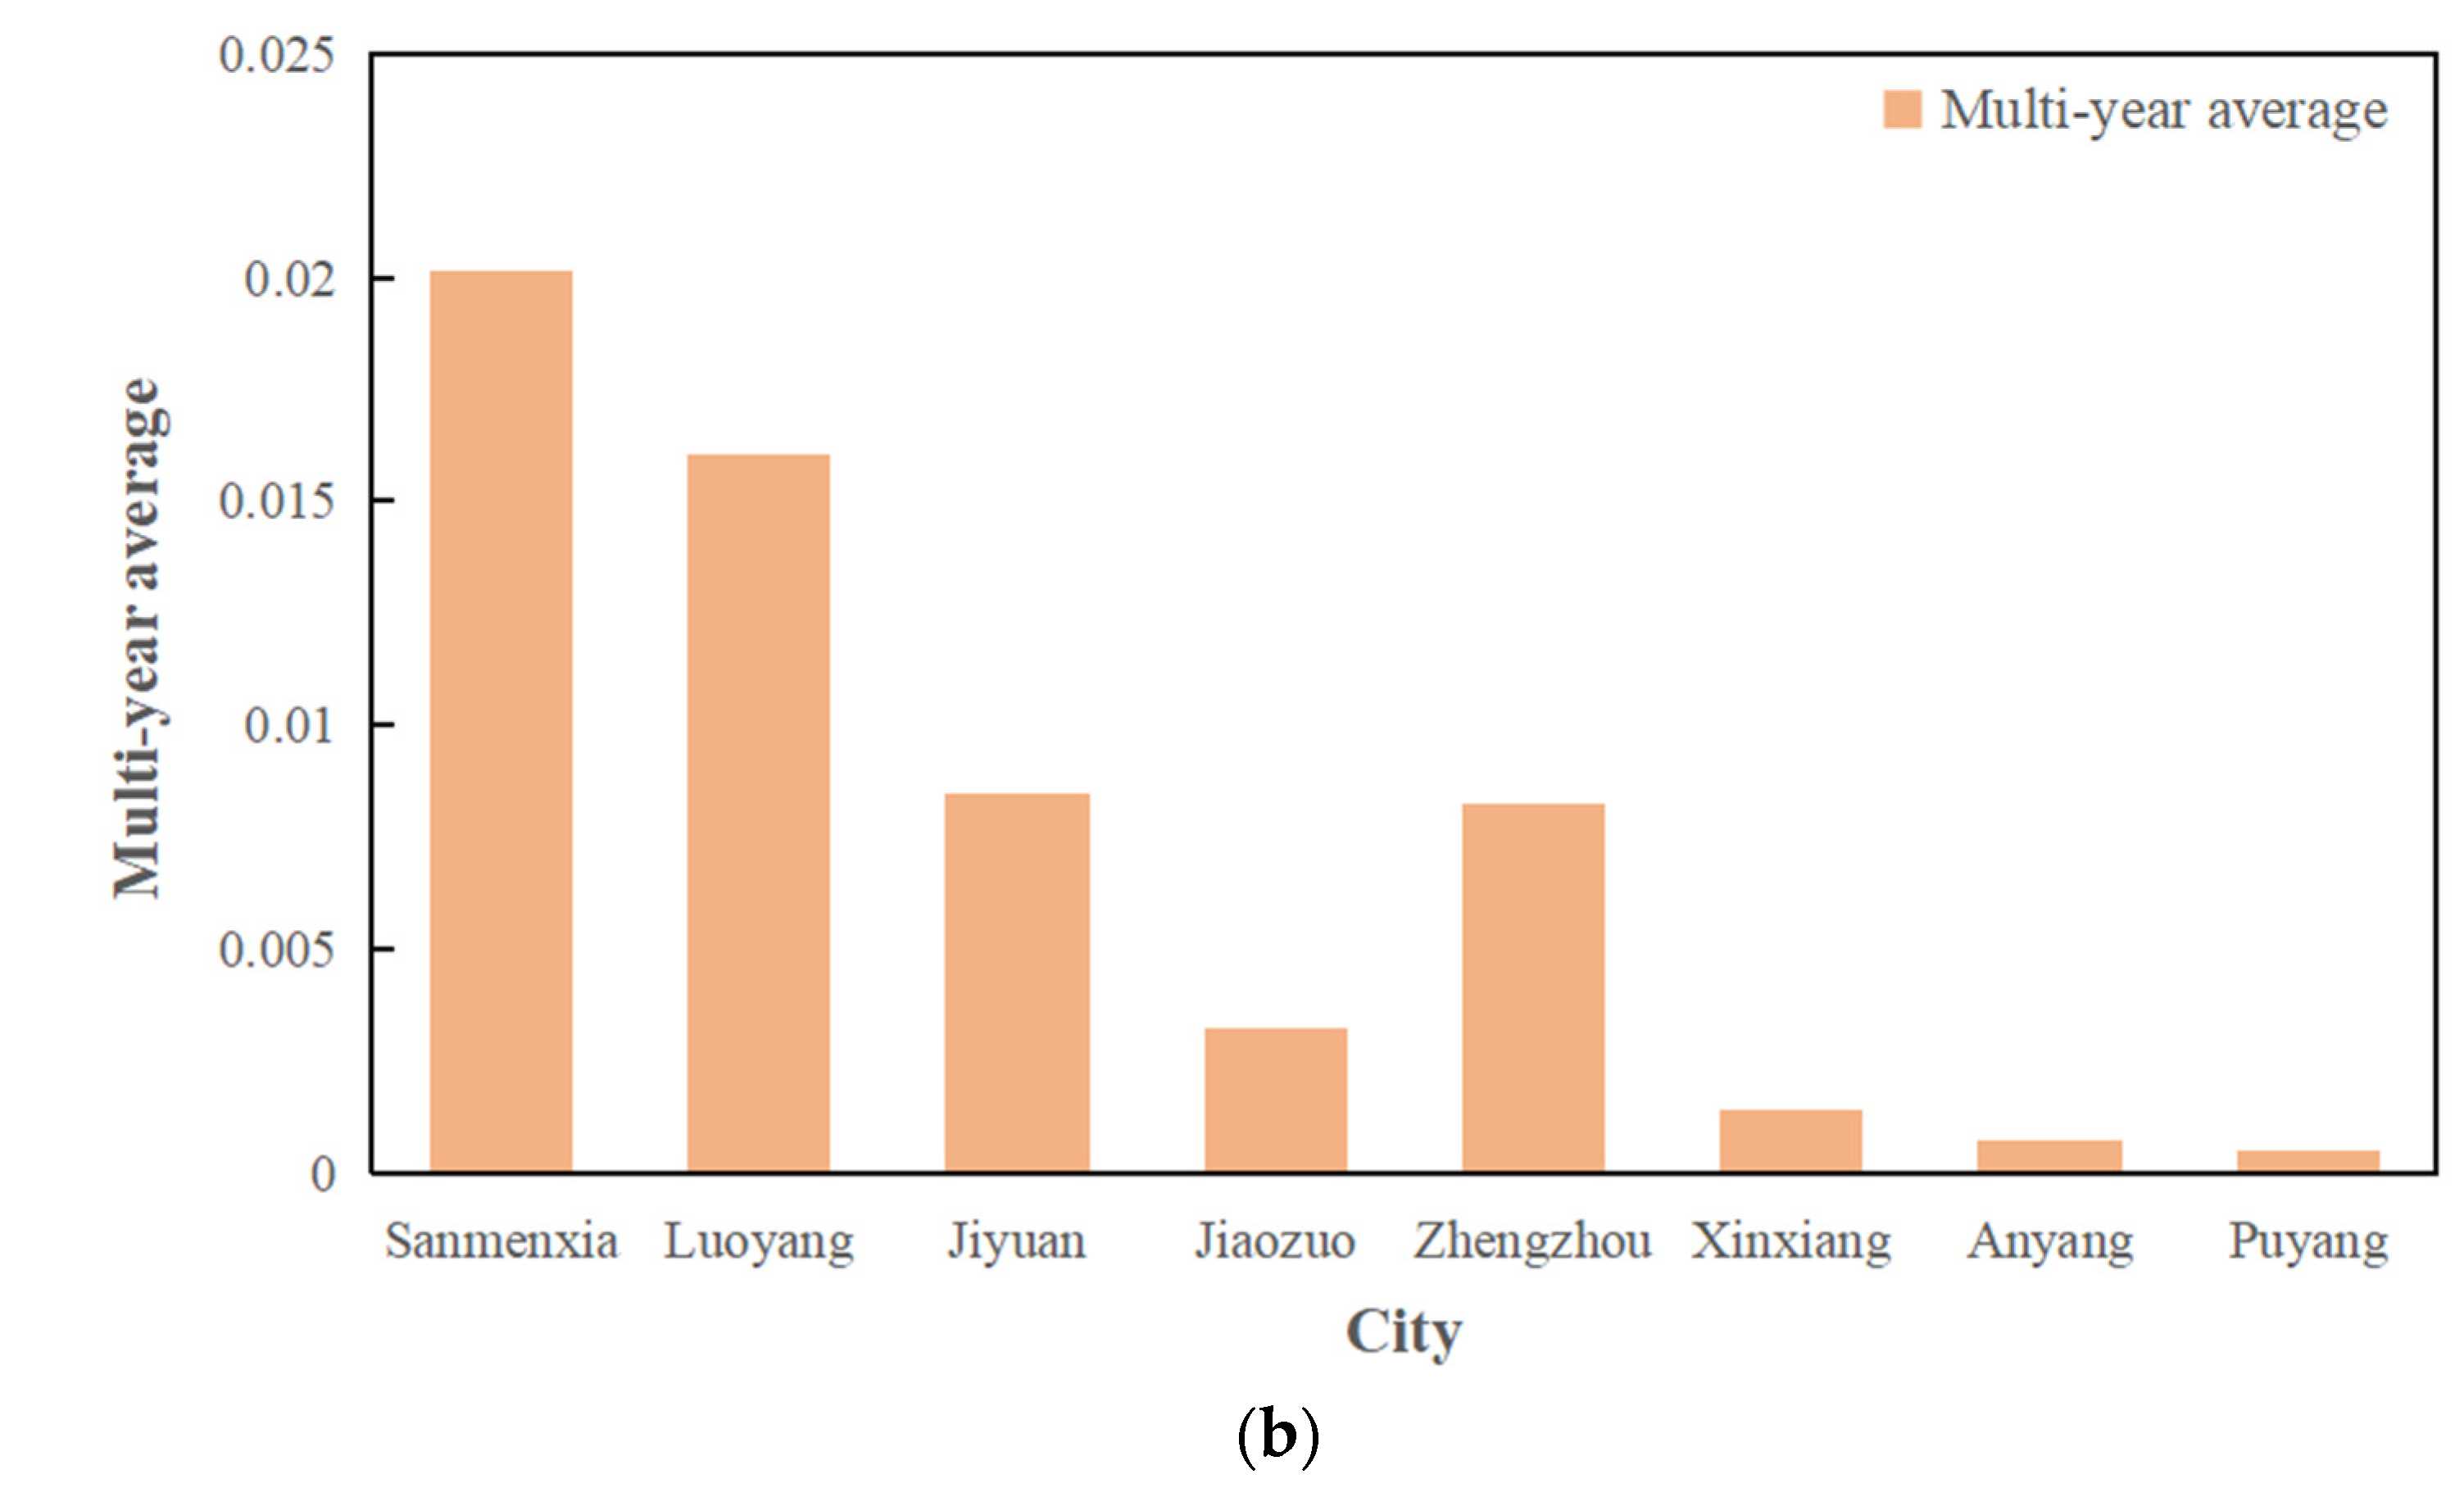
As can be seen from Figure 5, in the western mountainous area with high coverage and less human activities such as forest and grassland, the biodiversity conservation function index was higher, while in the eastern plain area, the land was more cultivated, with more human activities, and the ecological conservation function index was relatively low. According to the analysis of the average value of the biodiversity maintenance function index of each city (Figure 6), Sanmenxia and Luoyang had the highest biodiversity maintenance function index over the years, with an average value of more than 0.01. Due to the regional distribution of Yawu Mountain, Laojun Mountain, Comb Hole, Tianchi Mountain scenic area, Xiaoqinling, Funiu Mountains, Xiong’er Mountain and many other national and provincial natural reserves, as well as Songshan, the gods’ village geological park and Xiaolangdi reservoir, Luhun reservoir and other key water control projects, the region had a suitable climate and abundant plant resources, providing a good living space for the habitats of national protected animals such as black storks, whooper swans and cygnets. The index of Jiyuan and Zhengzhou was more than 0.005 and the climatic conditions were good, with abundant rainfall and sunshine, which provided rich nutrients for the survival of various organisms and helped the ecological environment develop in a better direction. The indices of biodiversity conservation in Jiaozuo and Xinxiang were relatively low. The area of construction land and cultivated land was more than 90%, with intensive human activities, which seriously affected the role of the ecosystem in biodiversity conservation.

4.5. Analysis of the Susceptibility of Geological Disasters

The weight method of information content was adopted to calculate the weight of each factor according to the evaluation factors of geological hazard susceptibility determined in the analysis of the susceptibility of geological disasters, as shown in Table 3.
The classification results of distance from the main stream of the Yellow River, vegetation coverage, rainfall, slope, soil type and distance from the mining area were stacked according to the above weights; the results were divided into non-prone area, low-prone area, medium-prone area, high-prone area and extremely prone area. Finally, the spatial and temporal distribution data of geological hazard susceptibility in the study area in 2001, 2010 and 2019 were obtained (Figure 7).
From 2001 to 2019, the geological disaster-prone areas (medium-prone, high-prone, extremely prone) in the study area showed a trend of increasing first and then decreasing. In 2001, the area medium prone to, highly prone to and extremely prone to geological disasters accounted for 49.30% of the total area and less than half of the region was in the potential threat area of geological disasters. In 2010, the proportion was 60.15% and more than half of the area was in the potential threat area. From 2001 to 2010, the potential threat of geological disasters increased significantly, with the area increasing by 10.85%. In 2019, the areas with medium-, high- and extremely prone incidences of geological disasters accounted for 54.28% of the study area and most of the region was in the potential threat area of geological disasters. From 2010 to 2019, the areas under potential threat of geological disasters decreased by 5.87% and the potential threat of geological disasters decreased significantly. Overall, from 2001 to 2019, the proportion of geological disaster areas in the study area increased by 4.98%; potential geological disaster problems still exist, especially along the Yellow River trunk stream in the Sanmenxia–Luoyang–Jiyuan–Jiaozuo–Zhengzhou section.
It can be seen from Figure 7 that, in Sanmenxia, Jiyuan and Luoyang, the areas on both sides of the Yellow River have a large slope and are heavily scoured by the Yellow River flow and rainfall, which are more likely to cause various geological disasters. Geological disasters have a large potential threat and the ecosystem in the region is unstable. The slope of the plain area is less than 5°, the ecosystem is relatively stable and the susceptibility to geological disasters is mainly not-prone and low-prone. According to the statistics, Sanmenxia and Luoyang have the largest areas of potential geological disasters (medium-prone, high-prone and extremely prone). Both areas are over 5000 km2, which proves that the geological disasters in this area are more likely to occur, especially in the areas along the Yellow River and the Yellow River itself, where mining activities are more likely to cause geological disasters. The areas of potential geological hazards in Zhengzhou, Xinxiang, Jiyuan, Jiaozuo and Puyang are all more than 1000 km2; they are mainly distributed in Gongyi, Xingyang, Jiyuan and Mengzhou, which are relatively close to the main stream of the Yellow River, proving that the threat of geological disasters still exists in the region. The area of potential geological disasters in Anyang is less than 200 km2, which proves that the regional ecosystem is good and the threat of geological disasters is low.

4.6. Ecological Environment and Geology of River Basin

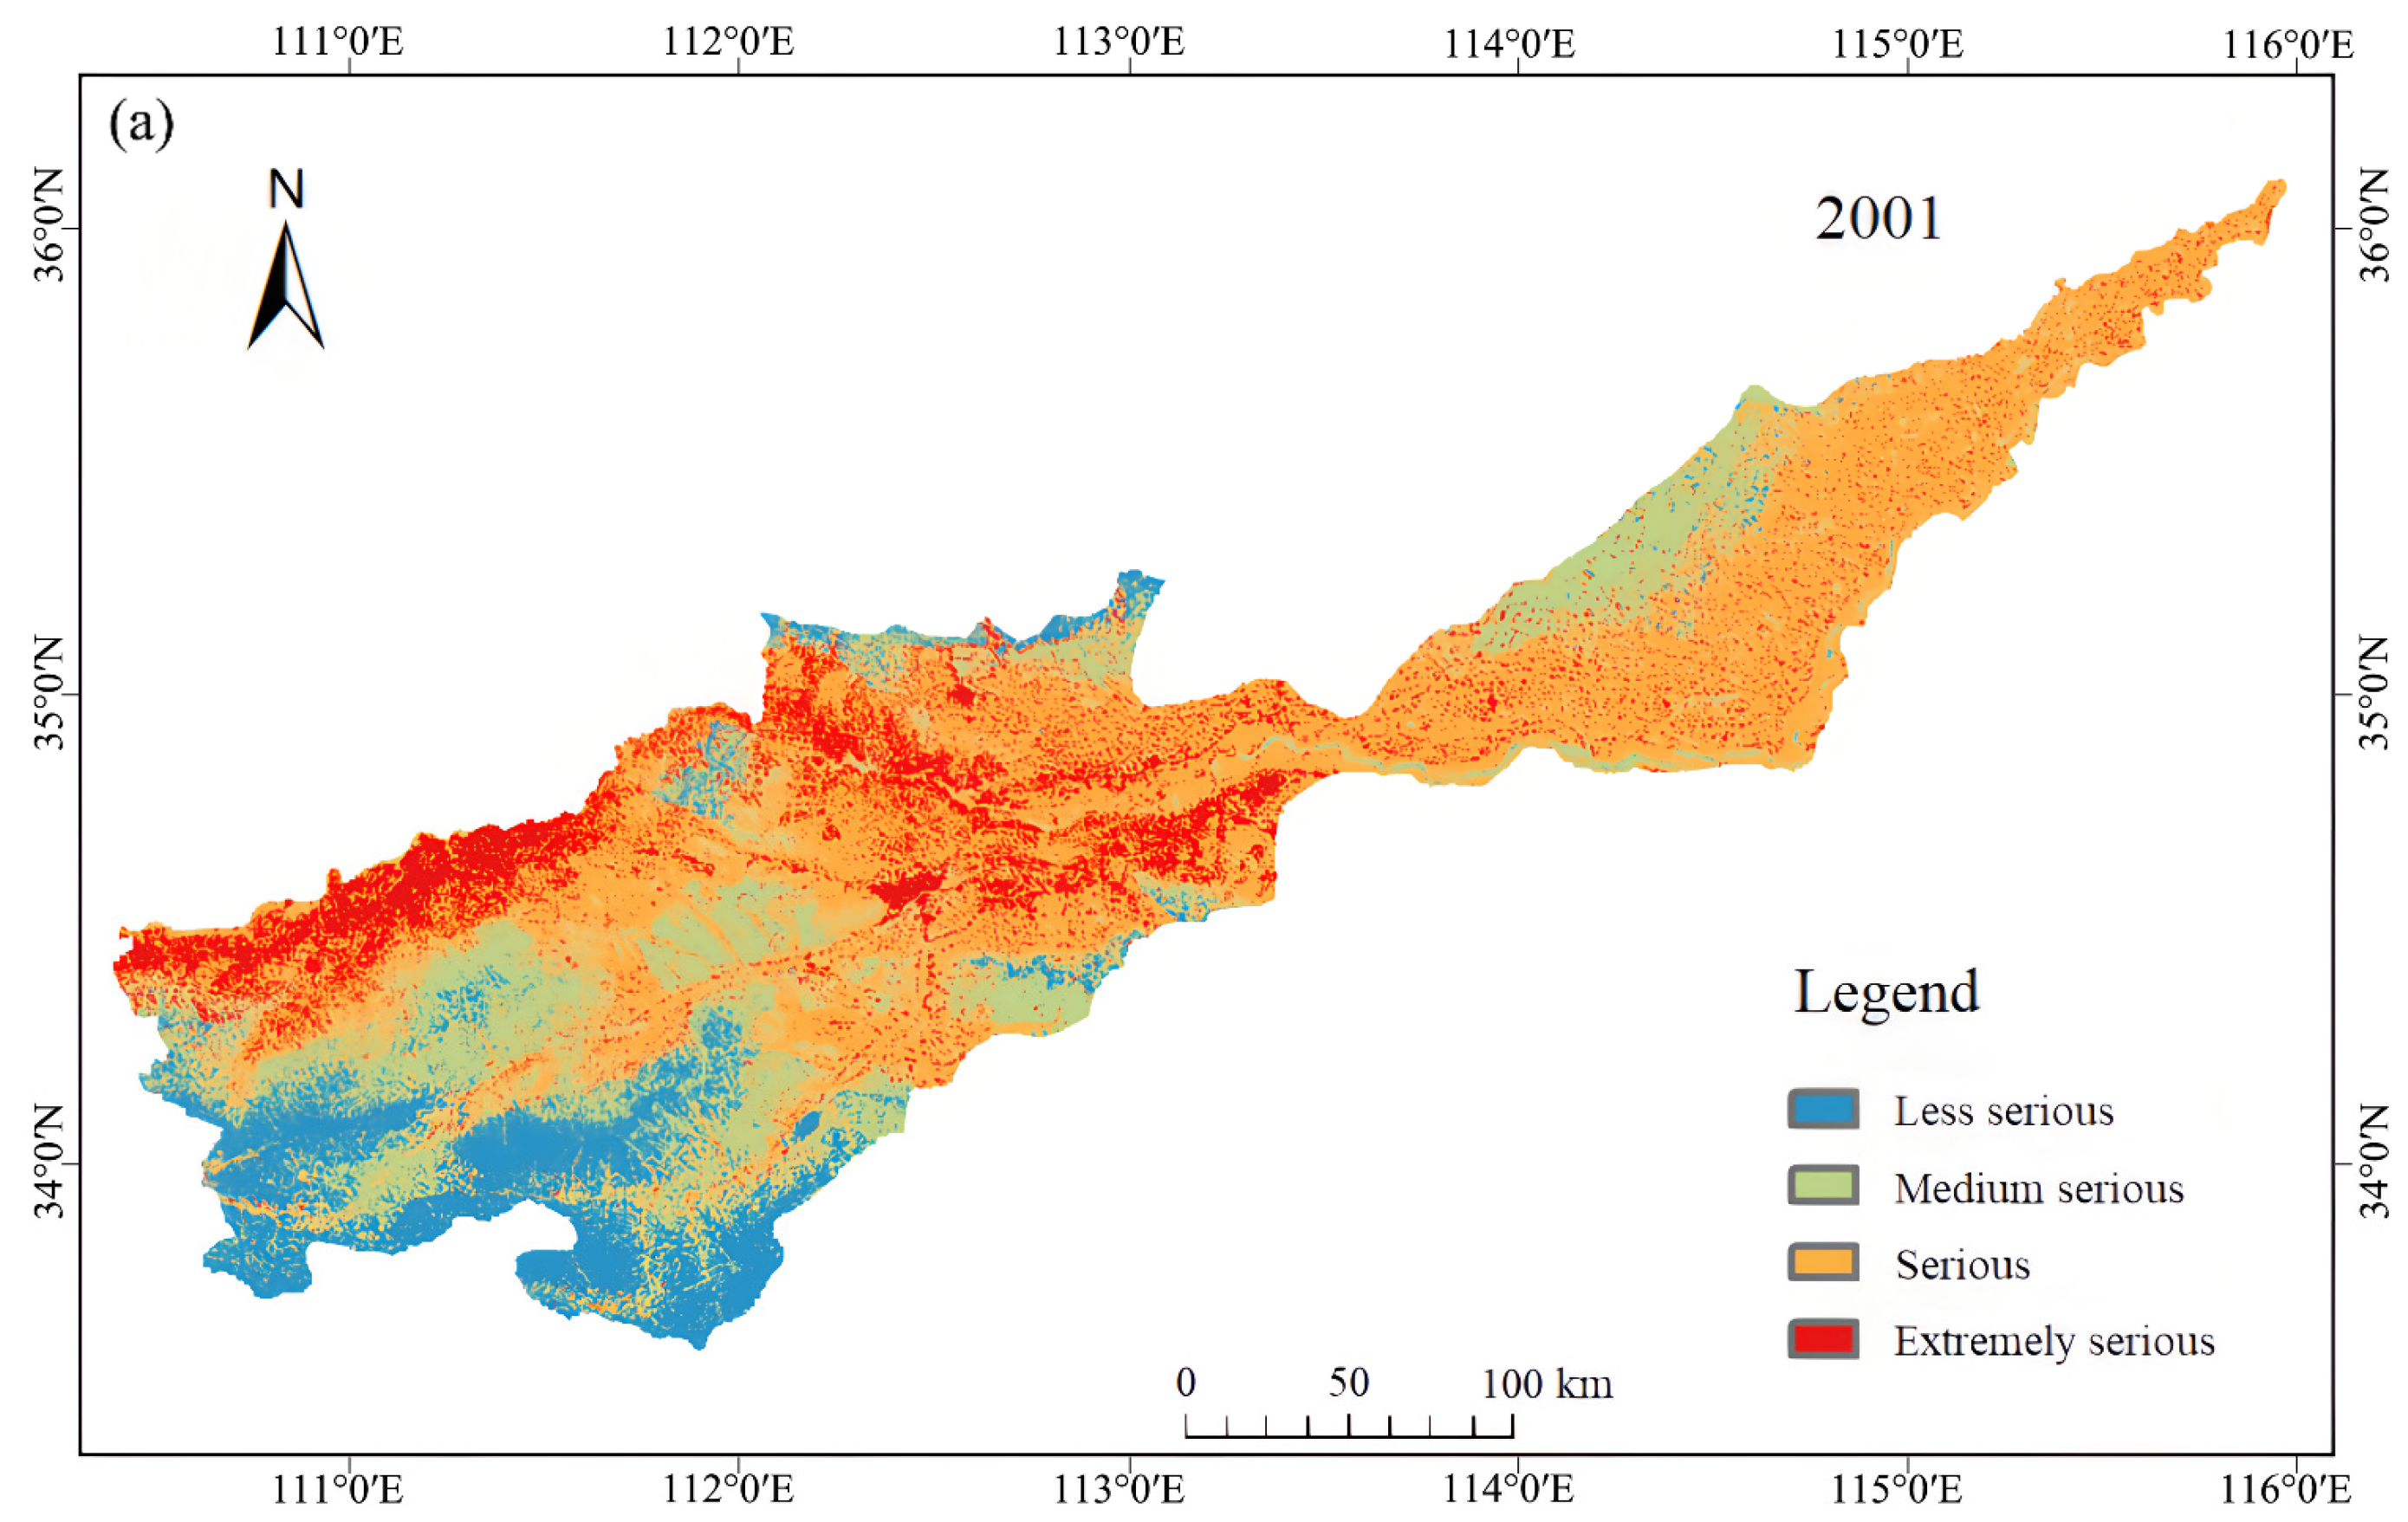
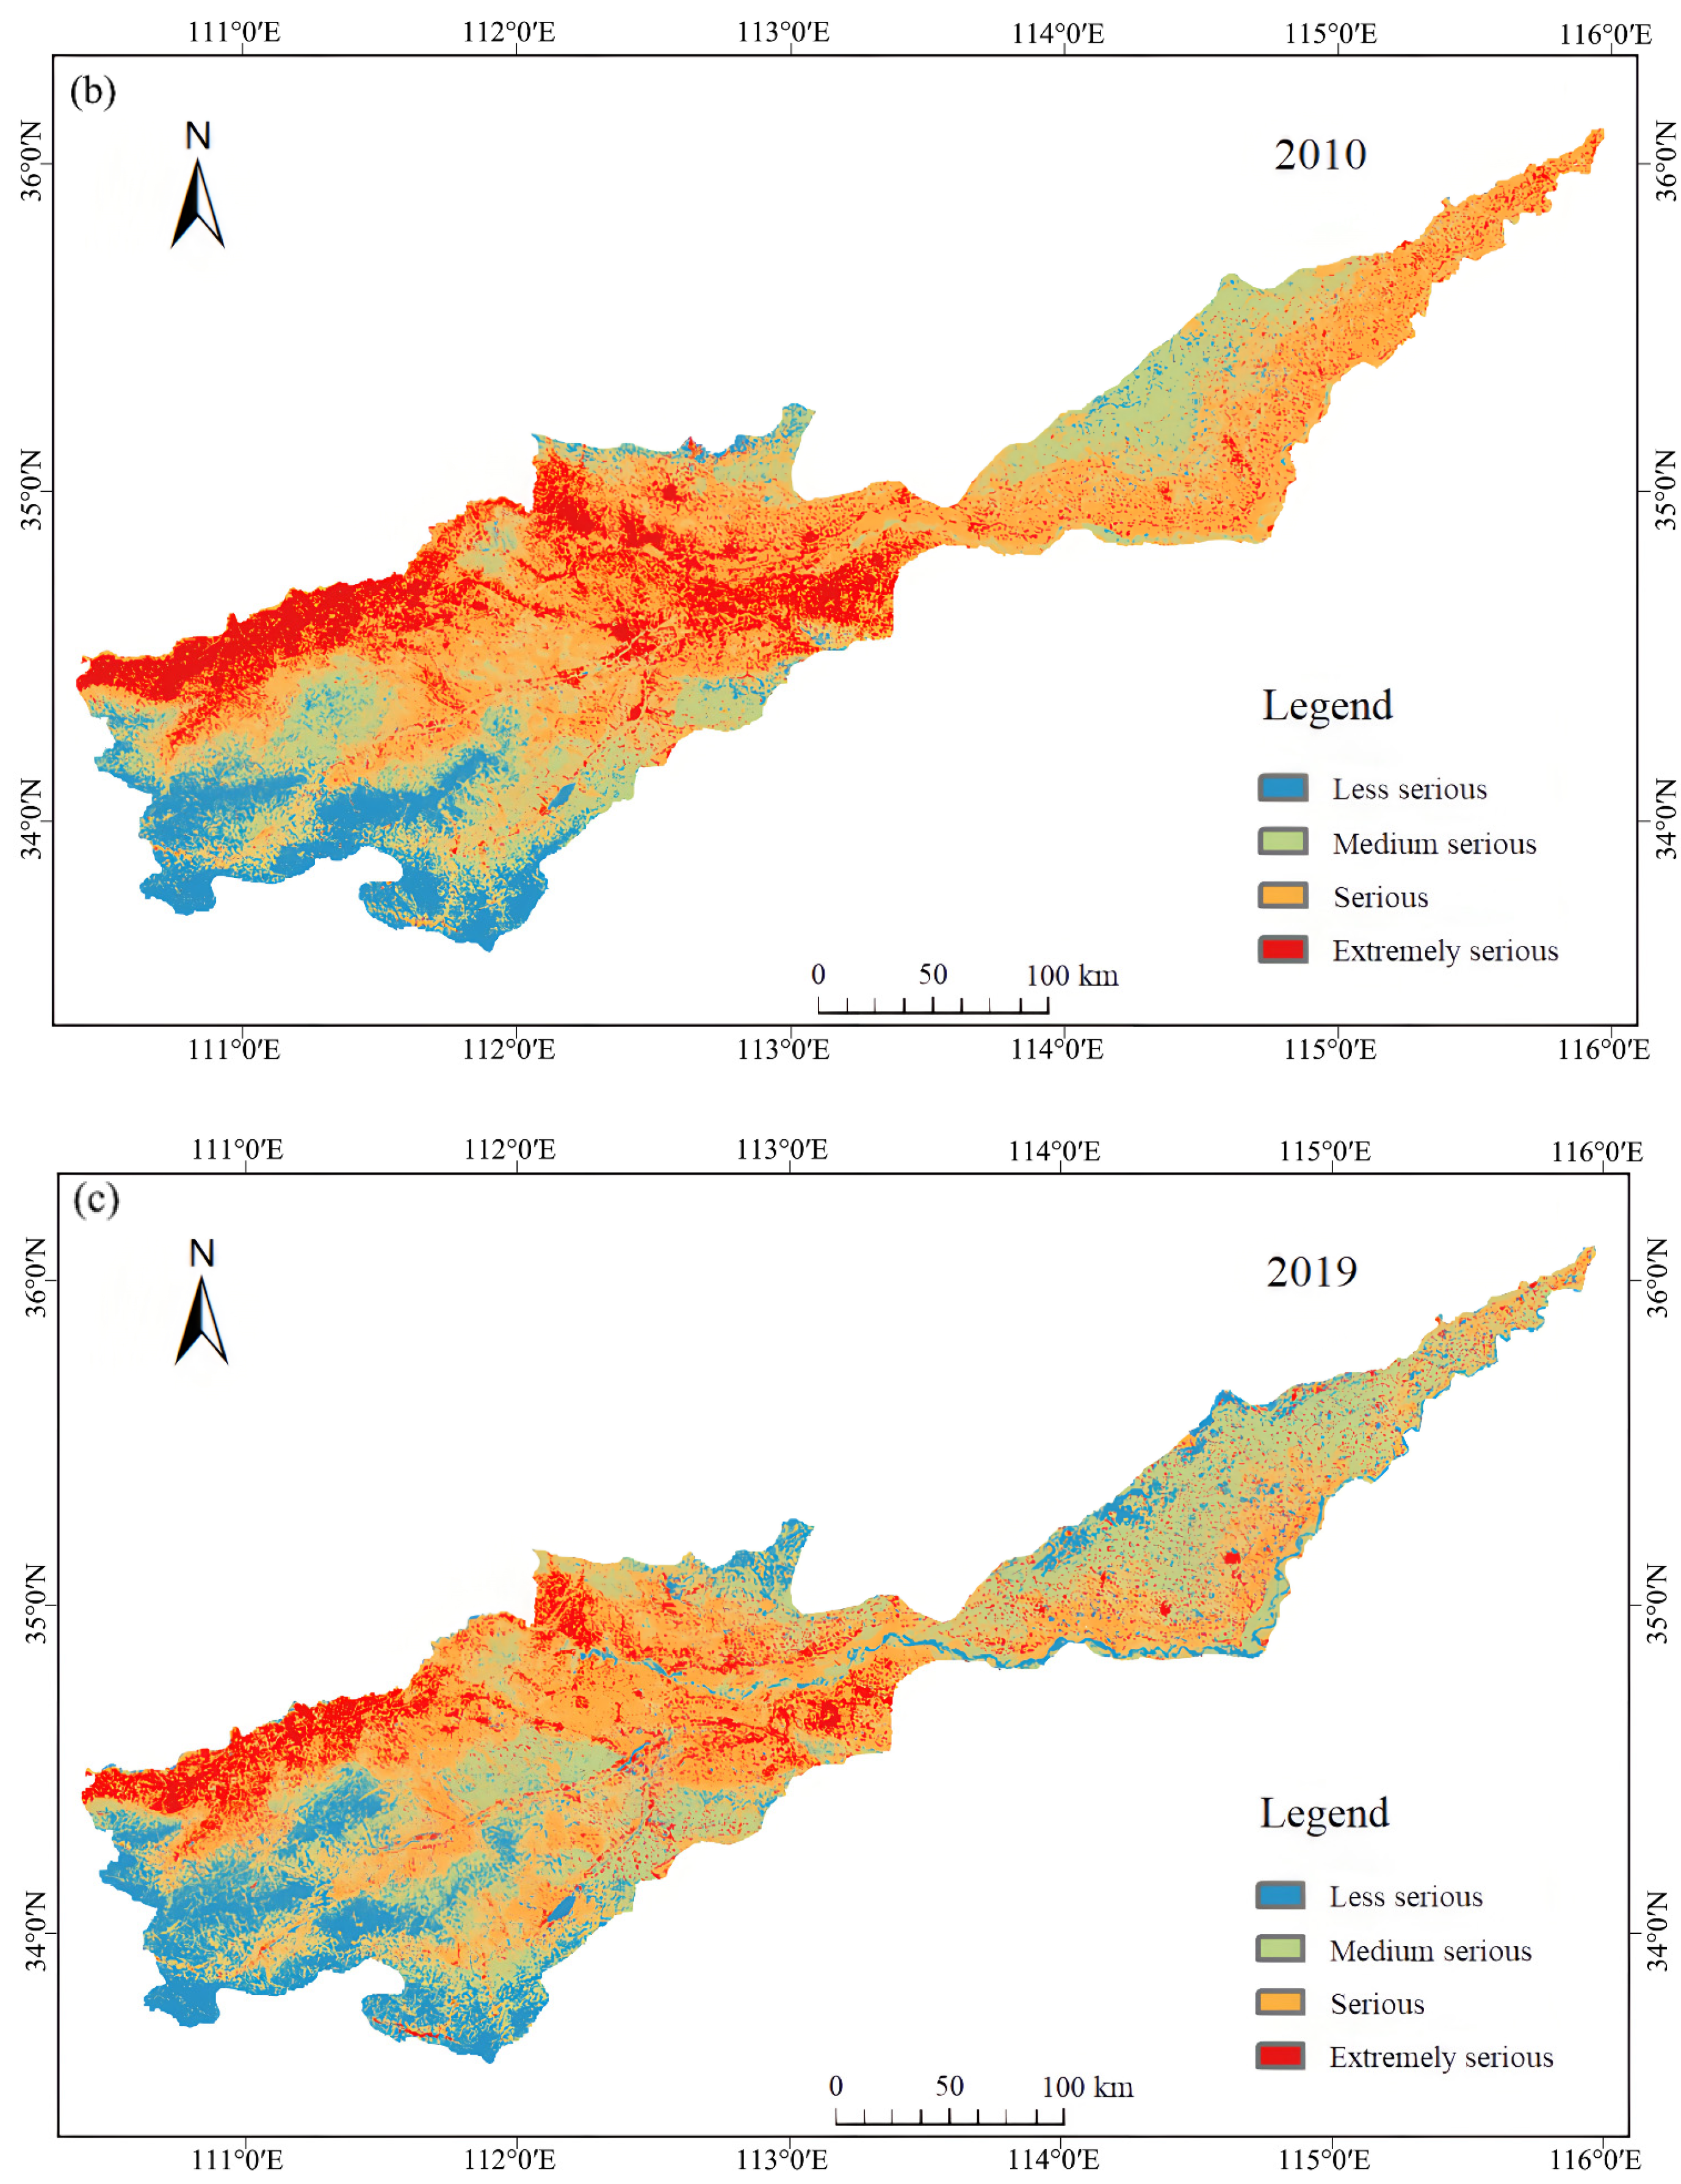
According to Equations (5) and (6), the classification results of ecological environmental geological problems in the watershed can be obtained by integrating the previous analysis results, as shown in Figure 8.
As can be seen from Figure 8, the area of less-serious and medium-serious eco-environmental geological problems in the study area showed an overall increasing trend from 2001 to 2019, with an increase of 1525.19 km2 and 4419.63 km2, respectively, while the area of serious and extremely serious areas showed an overall decreasing trend. The areas decreased by 5155.93 km2 and 788.89 km2, respectively. Combined with the above analysis, the soil erosion status in the study area improved, the amount of soil and water conservation increased and the biodiversity conservation function index increased, proving that the overall eco-environmental geological problems in the study area showed an obvious improvement phenomenon from 2001 to 2019 [45]. The main types of eco-environmental geological problems in the study area were medium-serious and serious, accounting for more than 50% of the total area, with distribution in each city in the study area. The extremely severe areas were mainly distributed in Sanmenxia, Luoyang, Jiyuan, Jiaozuo and Zhengzhou and mainly distributed on both sides of the main stream of the Yellow River. The less-serious areas were mainly distributed in the south of Luoyang and the southwest of Sanmenxia at high altitudes, the ecological environmental quality was good in this area and there was also a small amount of distribution in other areas.
Considering the different types of human activities in the different regions and the impact of topography, different cities in the study area showed different ecological environmental problems. Therefore, based on the distribution characteristics of the individual problems mentioned above, the ecological environmental geological problems in the study area can be divided into two sections: The Sanmenxia–Zhengzhou section and the Zhengzhou–Puyang section. At present, the main ecological and environmental geological problems in the Sanmenxia–Zhengzhou section are serious soil erosion, degradation of the water conservation function and frequent geological disasters, while in the Zhengzhou–Puyang section they are poor soil and water conservation functions, degradation of the water conservation function and a poor biodiversity conservation function.

4.7. Driving Force Analysis

4.7.1. Driving Force Analysis of the Sanmenxia–Zhengzhou Section

According to the above analysis, the main ecological environmental geological problems existed in this section. Nine factors, including altitude, vegetation coverage, net primary productivity of vegetation, rainfall, mining activities, land-use type, evapotranspiration, slope and temperature, were selected for analysis by using a geographical detector [46]. Data were first graded with an equal interval discontinuity method and then imported into a geographical detector for calculation. The results are shown in Table 4.
As can be seen from Table 3, the driving factors of the Sanmenxia–Zhengzhou section from 2001 to 2019 can be arranged as follows: altitude, vegetation coverage, rain, land-use type, net primary productivity of vegetation, evapotranspiration, slope, mining activities and temperature. From 2001 to 2019, the contribution degree of altitude to eco-environmental geological problems was above 0.2, which was the maximum value in that year, indicating that altitude in the Sanmenxia–Zhengzhou section would have a significant impact on eco-environmental geological problems. In the high-altitude area between Sanmenxia and Zhengzhou, the land-use types were mainly forest land and grassland, the rainfall was sufficient and the temperature was suitable to promote the growth and development of vegetation, which could restrain the ecological deterioration well. The influence of altitude on eco-environmental geology is not only to change the regional climate conditions but also, to some extent, human activities. The eco-environmental geology problems of the Sanmenxia–Zhengzhou section were mainly distributed at the lower altitudes. There were frequent mining activities in this region and the land-use type was mainly cultivated land and construction land. Excessive industrial and agricultural activities of human beings damage the ecological environment geology, leading to prominent ecological environment geology problems in the region. In general, altitude is the key driving factor for the Sanmenxia–Zhengzhou section of the Yellow River Basin, followed by vegetation coverage, rainfall, land-use type and other factors that have little impact on the ecological environment and geology.

4.7.2. Analysis of Driving Force in the Zhengzhou–Puyang Section

The geographic detector was mainly used for spatial heterogeneity analysis between the driving factors. However, the spatial heterogeneity between some factors in the Zhengzhou–Puyang section was low, such as the gentle topography, altitude and small slope changes; the land-use types were mainly cultivated land and did not meet the geographic detector using the principles of spatial heterogeneity. Therefore, the correlation analysis method with strong applicability was used to determine the driving factors of regional eco-environmental geological problems in the Zhengzhou–Puyang section [47]. According to the ecological and environmental geological problems in the Zhengzhou–Puyang section, eight factors, including rainfall, temperature, net primary productivity of vegetation, altitude, slope, land-use type, evapotranspiration and vegetation coverage were selected for analysis. The results of the correlation analysis are shown in Table 4.
It can be seen from Table 5 that, from 2001 to 2019, all factors had a certain degree of impact on eco-environmental geological problems, but the net primary productivity of vegetation, altitude, slope and evapotranspiration did not pass the consistency test of 0.01, proving that their impact on eco-environmental geological problems could be ignored. The other influencing factors were as follows: rainfall, vegetation coverage, land-use type and temperature. The absolute values of correlation coefficients between rainfall and eco-environmental geological problems from 2001 to 2019 were all above 0.3, which was the maximum value in that year, and showed a significant negative correlation, proving that the less rainfall, the higher the possibility of eco-environmental geological problems in the Zhengzhou–Puyang section. As can be seen from the above analysis, the areas with less rainfall in the Zhengzhou–Puyang section were mainly in Yanjin county, Hua county and Changyuan city. The less rainfall, the less water can be stored in the region, resulting in a poor water conservation function and biodiversity maintenance function. Therefore, rainfall was the key driving factor of eco-environmental geological problems in the Zhengzhou–Puyang section of the Yellow River Basin. Vegetation coverage, land-use type and temperature were the secondary driving factors of eco-environmental geological problems. Vegetation, net primary productivity, altitude, slope and evapotranspiration had little impact on eco-environmental geological problems.

5. Discussion

Using GIS technology, mathematical statistics and the geographic detector model, this paper performed a quantitative analysis of eco-environmental geology in the Henan section of the Yellow River Basin and studied the driving force of regional eco-environmental geology evolution. Previous studies [23,24,25,26,27,28] mainly focused on single issues, such as mining, water shortage and biodiversity, without comprehensive and comprehensive analysis of ecological environmental geology in the study area. These studies also did not quantitatively analyze the driving factors of ecological environmental geology problems. Therefore, in order to solve these gaps, this study began with the research status and analyzed the tortuous evolution process of five types of problems, namely soil erosion, soil and water conservation, water source conservation, biodiversity maintenance and geological disaster susceptibility. The research scope included all the typical ecological environmental geological problems in the study area. GIS technology was used for comprehensive superposition analysis and the ecological environmental geological problems of the watershed were studied by classification. Considering the physical geography of the study area and the influence of human activities on different segments, the driving force research was conducted and the correlation analysis and geographical detector were selected to quantitatively analyze the driving factors.
The problem of ecological environmental geology was driven by “meteorological, geological and human activities”, which led to the variations in water environment, soil conditions and geological factors, resulting in vegetation degradation, regional desertification and ecological environment deterioration under the action of external dynamic erosion. Based on previous research results and field investigation, the ecological environmental geological problems in the Henan section of the Yellow River Basin could be summarized as serious soil and water loss [48], water environment pollution [49], biodiversity reduction [50], land desertification [51], wetland ecological function degradation) [52], water conservation function decline [41], frequent geological disasters [53,54], riverbed elevation [55], etc. Therefore, under the premise of fully considering the regional geological background, this paper summarized the ecological environmental geology problems into five special topics. The soil-loss equation quantitatively evaluated the level of soil erosion in the watershed and provided a certain basis for soil and environmental protection [56]. In areas with severe soil erosion, a large number of soil resources were destroyed and a large area of land was cut into pieces [57], resulting in the continuous reduction of cultivated land area. A large amount of soil organic matter and nutrients were lost; [58,59], resulting in a rapid decline in soil fertility and quality, thus affecting agricultural output values. The serious destruction of surface vegetation caused the natural ecological environment to deteriorate. The analysis of soil and water conservation and water source conservation reflected the degree of riverbed elevation and water environment pollution [56]. A large amount of sediment carried away by soil and water loss was sent to reservoirs, river channels and natural lakes, resulting in siltation and elevation of riverbeds and river flooding. At the same time, a large amount of sediment deposition also caused water pollution of rivers and secondary salinization of large areas of soil [60,61]. Biodiversity [33,50] provided abundant food, medicine, fuel and other daily necessities, as well as a large number of industrial raw materials for human survival and development. At the same time, it also maintained the ecological balance of nature and provided good environmental conditions for human survival. The predisposition analysis of geological disasters fully considered all kinds of factors affecting the occurrence of geological disasters; mining activities, slope and rainfall factors were more likely to induce geological disasters [62]. The five special topics studied watershed eco-environmental geological problems from different angles and levels that were related to each other yet different. Superposition analysis could obtain the distribution and evolution process of watershed eco-environmental geological problems; the results were more accurate. The results show that, from 2001 to 2019, the ecological environmental geological problems in the study area showed trending improvement, which was consistent with the conclusion of Zhang [63], who studied the ecological environmental evolution characteristics of the Yellow River Basin from 1980 to 2019. However, the ecological environmental geological problems in some areas were still severe.
Topography, vegetation, rainfall and land-use types had great influence on regional eco-environmental geological problems, which were affected by both human activities and natural factors. Before 2010, due to the influence of mining activities and rainfall, ecological and geological environmental problems along the main stream of the Yellow River in Sanmenxia, Luoyang, Jiyuan, Jiaozuo and Zhengzhou became increasingly serious. In 2009, The State Council approved “the implementation of the National Mineral Resources Plan (2008–2015)”, which set the overall goal of “Vigorously promoting the construction of green mines and establishing the green mine pattern by 2020”. In 2010, the Ministry of Land and Resources issued “the Guiding Opinions of the Ministry of Land and Resources on The Implementation of the National Mineral Resources Planning, Development of Green Mining and Construction of Green Mines”. In 2017, six ministries and commissions jointly issued “the Implementation Opinions on Accelerating the Construction of Green Mines”. In 2018, Henan province formulated a series of local standards for green mine construction at the provincial level and issued them for implementation. Under the guidance of the macro policies of the national and provincial governments, local governments and mining enterprises actively promoted the construction of ecological civilization, carried out the restoration and management of the ecological environment of mines and green mine construction and implemented the ecological restoration project of the south Taihang mountains [64]. Since 2010, the geological quality of the regional ecological environment has improved significantly. However, due to the influence of increased rainfall and soil erosion in recent years [65], the ecological and environmental geological problems along the main stream of the Yellow River in Sanmenxia, Luoyang, Jiyuan, Jiaozuo and Zhengzhou are still prominent and the threat of geological disasters still exists in Zhengzhou, Gongyi, Xingyang, Jiyuan, Jiaozuo and Mengzhou [66].

6. Conclusions

Combined with the influence of natural factors and human activities, this study explored the existing ecological environmental geological problems in the study area. Starting with the current situation of the research area, the typical problems from three aspects of ecology, environment and geology were selected to form five research topics; the existing ecological environmental geological problems in the research area were expounded in a more detailed and comprehensive manner. This paper analyzed the driving factors leading to the ecological environmental geological problems. According to the different conditions of the ecological environmental geological problems in the middle and lower reaches, the research was divided into two parts and the driving factors were analyzed by different methods. The main conclusions were as follows:
According to the comprehensive analysis, the main ecological environmental geological problems in the Sanmenxia–Zhengzhou section were as follows: serious soil erosion, degradation of water conservation function and prone to geological disasters. The main ecological environmental geological problems in the Zhengzhou–Puyang section were poor soil and water conservation function, degraded water conservation function and poor biodiversity maintenance function.
From 2001 to 2019, the ecological environmental geological problems in the study area showed a significant improvement trend. The areas of the less-serious and more-serious areas increased by 1525.19 km2 and 4419.63 km2, respectively, while the areas of the serious and extremely serious areas decreased by 5155.93 km2 and 788.89 km2, respectively. The most serious area was mainly concentrated in the Sanmenxia–Zhengzhou section of the Yellow River trunk banks, with sporadic distribution in Xinxiang, Anyang and Puyang areas. The less-serious and medium-serious areas were distributed across the whole study area.
The result of the qualitative analysis was known: vegetation coverage and rainfall were the main factors leading to the ecological environmental geological problems in the study area. The unreasonable land-use types led directly to the ecological environmental geological problems and the altitude factors indirectly affected the ecological environmental geological problems.
To sum up, during the whole study period, the ecological environmental geological problems in the study area were prominent yet improved. From the analysis results of the factor detection model and the correlation analysis, it can be seen that the improvement of ecological environmental geology should be started from the aspects of vegetation cover, land-use type, rainfall, mining activities, etc. More importantly, we should advocate for multi-factor comprehensive measures, pay attention to the ecological environment and geological problems in the study area and publicize the concept of green environmental protection. While paying attention to population growth and economic development, more attention should be paid to the degree of vegetation cover and the rational allocation of land-use types. This not only provides a theoretical basis for the relevant development policies of the cities along the Yellow River in Henan province, but also provides direction for the high-quality development of the Yellow River Basin.

Author Contributions

Methodology, L.W.; Data curation, X.W.; Writing—original draft, B.W.; Writing—review & editing, B.W.; Supervision, G.W.; Project administration, H.X. All authors have read and agreed to the published version of the manuscript.

Funding

This research was funded by [Henan Province Science and Technology Project “Research on Key Technologies of Community Geological Disaster Avoidance Guidance System Construction”] grant number [212102310389] and the APC was funded by [Guangchao,Wen].

Conflicts of Interest

The authors declare no conflict of interest.

References

  1. Wang, W.J.; Jiang, W.G.; Fang, Z. Assessment of Ten Year Change of Ecological Environment in the Yellow River Basin; Science Press: Beijing, China, 2017. [Google Scholar]
  2. Pasculli, A.; Palermi, S.; Sarra, A.; Piacentini, T.; Miccadei, E. A modelling methodology for the analysis of radon potential based on environmental geology and geographically weighted regression. Environ. Model. Softw. 2014, 54, 165–181. [Google Scholar] [CrossRef]
  3. Patricia, D.A.P.; De Lima, O.A.L. Contaminations at the derma of Gaia: A case study in environmental geology. Environ. Earth Sci. 2016, 75, 1429. [Google Scholar]
  4. Anatol’yevna, M.T.; Viktorovich, E.S. Unified Multimodal Transport Center A Tool for the Development of the Environmental Geology of Transport. Procedia Eng. 2017, 189, 138–144. [Google Scholar] [CrossRef]
  5. Feng, Q.Y.; Yan, J.P. Environmental Geology; China University of Mining and Technology Press: Xuzhou, China, 2011. [Google Scholar]
  6. Zhou, K. The mother river of the Chinese nation—The Yellow River. Gansu Water Resour. Hydropower Technol. 2015, 51, 62–63. [Google Scholar]
  7. Yu, F.W.; Fang, L. Issues regarding the ecological protection and high-quality development of Yellow River Basin. China Soft Sci. 2020, 6, 85–95. [Google Scholar] [CrossRef]
  8. Chen, Y.; Miao, Q.Q.; Zhou, Q. Spatiotemporal Differentiation and Driving Force Analysis of the High-Quality Development of Urban Agglomerations along the Yellow River Basin. Int. J. Environ. Res. Public Health 2022, 19, 2484. [Google Scholar] [CrossRef]
  9. Guo, D.D. Some thoughts on ecological protection and high-quality development of cities along the Yellow River. Decis. Mak. Explor. (II) 2020, 10, 7–8. [Google Scholar]
  10. Zhang, Y.L.; Su, H.M.; Zhang, X.Y. Temporal and spatial analysis of vegetation cover change in the Yellow River basin from 1998 to 2012. Desert China 2014, 34, 597–602. [Google Scholar]
  11. Wu, C.B.; Liu, Y.P. Ecological geological survey—The situation and Enlightenment of Russia. Land Resour. Inf. 2003, 15, 36–42. [Google Scholar]
  12. Zhang, Z.H.; Yuan, D.X. A major geoscience problem across the century in China—The development prospect of Environmental Geoscience. Sci. Technol. Manag. Land Resour. 1995, 2, 60–69. [Google Scholar]
  13. Chen, M.X. On Eco geological environment system and comprehensive eco environmental geological survey. Hydrogeol. Eng. Geol. 1999, 21, 3–12. [Google Scholar] [CrossRef]
  14. Huang, R.Q. Basic characteristics and technical support of the eco-environmental geology. Chin. Geol. 2001, 28, 20–24. [Google Scholar] [CrossRef]
  15. Lu, Y.R. Geological Ecological Environment and Sustainable Development; Hohai University Press: Nanjing, China, 2003. [Google Scholar]
  16. Su, Y.D.; Deng, X.Y. A study on eco-geological environment system and comprehensive ecological environment geology. Constr. Des. Eng. 2017, 10, 107–108. [Google Scholar]
  17. Peng, J.B.; Lan, X.X. A brief discussion on ecological geology and ecological geological environment system. J. Earth Sci. Environ. 2022, 44, 877–893. [Google Scholar] [CrossRef]
  18. Yang, X.C.; Shi, Y.; Feng, S.T.; Wang, C.M.; Chai, J.L. Main eco-environmental geological problems and countermeasures in the lower reaches of the Yellow River (Shandong section). Shandong Land Resour. 2010, 26, 15–18. [Google Scholar]
  19. Yang, Z.J.; Zhang, S.Q.; Li, B.M.; Wang, Y.G.; An, Y.; Shi, W.D.; Xin, Y.H. Research on the ecological and environmental geological survey and mapping techniques of the Qinghai Tibet Plateau. Geol. Northwest China 2008, 3, 112–123. [Google Scholar]
  20. Liu, X.M.; Guo, C.Q. Evaluation of regional eco-environmental geological quality based on SDS evaluation model—Taking the southwest of Hainan Island as an example. Hydrogeol. Eng. Geol. 2007, 3, 85–88. [Google Scholar]
  21. Xu, X.N.; Wang, W.J.; Huang, R.Q. GIS based eco-environmental geological quality assessment of the Anning River basin. J. Chengdu Univ. Technol. Nat. Sci. Ed. 2004, 3, 243–248. [Google Scholar]
  22. Liu, G.N.; Wu, Y.; Wang, S.C.; Liao, J.; Yu, S.W.; Fu, Y.P.; Du, Y.; Chen, L.Z. Major water environment problems and ecological environment geological risk assessment zoning of typical river lake wetlands in the middle reaches of the Yangtze River. Geol. South China 2022, 38, 226–239. [Google Scholar]
  23. Zhang, L.S.; Li, L.H.; Gong, X.J. The significant ecological environmental geological problems and countermeasure research on the lower course of the Yellow River in Henan Province. Henan Geol. 2001, 1, 71–78. [Google Scholar]
  24. Wang, L.L.; Zhu, X.C.; Li, M. Study on organic pollution of drinking source of Yellow River valley in Henan Province. Environ. Pollut. Control. 2004, 2, 104–106. [Google Scholar] [CrossRef]
  25. Cao, X.Q.; Ma, Y.; Zhao, H.Y. Ecological environmental geological problems and their prevention countermeasures in coal mining areas of Henan Province. Min. Saf. Environ. Prot. 2006, 33, 130–132. [Google Scholar] [CrossRef]
  26. Huang, P.; Ye, Y.Z.; Gao, H.M.; Wang, X.; Jiang, S.; Yin, W. Biodiversity investigation and assessment of YiHe-Luohe River Basin in Henan Province. J. Henan Norm. Univ. (Nat. Sci. Ed.) 2012, 40, 142–145. [Google Scholar]
  27. Liu, T.K.; Yuan, C.F. Thoughts on the importance evaluation of water conservation function based on GIS—A case study of the Yellow River Basin in Henan Province. Reg. Gov. 2020, 4, 118–120. [Google Scholar]
  28. Xu, J.Q.; Ye, J.; Zhang, L.; Liu, J.F. Water conservation of Danjiangkou reservoir in He’nan remote sensing monitoring of ecological environment in national key. Environ. Dev. 2018, 30, 147–149. [Google Scholar]
  29. Fan, Y.C. Achievements and practices of ecological construction of soil and water conservation in the Yellow River Basin of Henan Province. Soil Water Conserv. China 2016, 10, 24–26. [Google Scholar]
  30. Renard, K.G.; Foster, G.R.; Weesies, G.A.; McCool, D.K.; Yoder, D.C. Predicting Soil Erosion by Water: A Guide to Conservation Planning with the Revised Universal Soil Loss Equation (RUSLE); Agricultural Handbook; USDA: Washington, DC, USA, 1997. [Google Scholar]
  31. Wang, S.; Zhang, B.; Wang, S.; Xie, G.D. Dynamic changes in water conservation in the Beijing–Tianjin Sandstorm Source Control Project Area: A case study of Xilin Gol League in China. J. Clean. Prod. 2021, 293, 126054. [Google Scholar] [CrossRef]
  32. Wang, T.F.; Gong, Z.W. Evaluation and analysis of water conservation function of ecosystem in Shaanxi Province in China based on “Grain for Green” Projects. Environ. Sci. Pollut. Res. Int. 2022, 29, 83878–83896. [Google Scholar] [CrossRef]
  33. Ma, K.P. On the concept of biodiversity. Biodivers. Sci. 1993, 1, 20–22. [Google Scholar] [CrossRef]
  34. Guo, Q.H.; Hu, T.Y.; Jiang, Y.X.; Jin, S.; Wang, R.; Guan, H.; Yang, Q.; Li, Y.; Wu, F.; Zhai, Q.; et al. Advances in remote sensing application for biodiversity research. Biodivers. Sci. 2018, 26, 789–806. [Google Scholar] [CrossRef]
  35. Wang, X.D.; Zhang, C.B.; Wang, C.; Liu, G.W.; Wang, H.X. GIS-based for prediction and prevention of environmental geological disaster susceptibility: From a perspective of sustainable development. Ecotoxicol. Environ. Saf. 2021, 226, 112881. [Google Scholar] [CrossRef] [PubMed]
  36. Wang, N.T.; Peng, K.; Li, Q.H.; Zhao, W.X.; Li, Y.Y.; He, J. Quantitative evaluation of geological disaster liability based on RS and GIS analiysis: A case study of Wufeng County, Hubei Province. Earth Sci. Front. 2012, 19, 221–229. [Google Scholar]
  37. Yang, Y.H.; Wen, G.C.; Xie, H.B.; Wang, L. Characteristics of normalized vegetation index under typical geomorphic units in Qaidam Basin. Bull. Soil Water Conserv. 2020, 40, 133–139. [Google Scholar]
  38. Gilani, H.; Ahmad, A.; Younes, I.; Abbas, S. Impact assessment of land cover and land use changes on soil erosion changes (2005–2015) in Pakistan. Land Degrad. Dev. 2021, 33, 204–217. [Google Scholar] [CrossRef]
  39. Li, N.; Wang, X.J.; Lu, G.; Li, J.Y. Temporal and spatial changes of soil erosion in Xibaiyanggou watershed on the northern slope of Tianshan mountains from 200-2017. J. Arid. Land Resour. Environ. 2021, 35, 73–79. [Google Scholar] [CrossRef]
  40. Zou, X.Y.; Zhou, W.; Sun, W.J.; Xiao, K.B.; Hu, F.B.; Lin, Z. Research progress on influencing factors of soil erosion of engineering accumulation body in China. J. Northeast Agric. Sci. 2021, 46, 57–61. [Google Scholar]
  41. Liu, T.K. Study on Ecological Protection Red Line in Yellow River Basin of Henan Province. Master’s Thesis, North China University of Water Resources and Electric Power, Zhengzhou, China, 2020. [Google Scholar]
  42. Li, H.C.; Guan, Q.Y.; Sun, Y.F.; Wang, Q.Z.; Liang, L.S.; Ma, Y.R.; Du, Q.Q. Spatiotemporal analysis of the quantitative attribution of soil water erosion in the upper reaches of the Yellow River Basin based on the RUSLE-TLSD mode. Catena 2022, 212, 106081. [Google Scholar] [CrossRef]
  43. Yin, Y.H.; Wu, S.H.; Zhao, D.S.; Dai, E.F. Ecosystem water conservation changes in response to climate change in the source region of the Yellow River from 1981 to 2010. Geogr. Res. 2016, 35, 49–57. [Google Scholar] [CrossRef]
  44. Gao, P.; Deng, J.C.; Chai, X.K.; Mu, X.M.; Zhao, G.J.; Shao, H.B.; Sun, W.Y. Dynamic sediment discharge in the Hekou–Longmen region of Yellow River and soil and water conservation implications. Sci. Total Environ. 2017, 578, 56–66. Available online: https://pubmed.ncbi.nlm.nih.gov/27396320 (accessed on 13 October 2022). [CrossRef]
  45. Liu, C.L.; Zhao, X.B.; Zhang, H.T.; Peng, Z.; Li, W. The eco-environmental geological conditions and prevention measures of the Yellow River National Geopark, in Zhengzhou. Acta Geol. Sichuan 2011, 31, 442–445. [Google Scholar]
  46. Wang, J.F.; Xu, C.D. Geodetector: Principle and prospective. Acta Geogr. Sin. 2017, 72, 116–134. [Google Scholar] [CrossRef]
  47. Wang, H.M.; Liu, H.; Sang, J.; Li, X.Y.; Su, M. Spatial-temporal characteristics of vegetation cover and the correlation with climate in Hulunbeir. J. Inn. Mong. Univ. 2020, 51, 539–547. [Google Scholar] [CrossRef]
  48. Zhao, C.S.; Liu, J.; Xu, J.Z.; Fan, Y.C. Achievements and challenges of ecological construction of soil and water conservation in the Yellow River Basin of Henan Province. Soil Water Conserv. China 2021, 2, 20–22. [Google Scholar]
  49. Zhou, X.F.; Cao, G.Z.; Yu, F.; Yang, W.S.; Xu, Z.S. Risk zoning of water pollution in the Yellow River Basin. Environ. Sci. 2021, 43, 2448–2458. [Google Scholar] [CrossRef]
  50. Fu, S.L. Biodiversity conservation along the Yellow River should emphasize the complex spatial heterogeneity. Biodivers. Sci. 2020, 28, 445–1446. [Google Scholar] [CrossRef]
  51. Li, Y.Z.; Feng, Z.Z.; Li, L.; An, D.; Wang, W.J. Assessment of ecological sensitivity of terrestrial ecosystem in the Yellow River Basin based on GIS. Environ. Sci. Technol. 2021, 44, 219–225. [Google Scholar] [CrossRef]
  52. Zhao, X.D.; Zhao, Y.M. Current situation, protection and management of wetlands along the Yellow River in Henan. Wetl. Sci. Manag. 2016, 12, 27–29. [Google Scholar] [CrossRef]
  53. Tian, D.S. Evaluation on geological hazard dangerous condition in Henan Province. J. Catastrophology 2014, 29, 48–51. [Google Scholar] [CrossRef]
  54. Wu, J.J.; Zhao, G.Y.; Li, H.; Hu, D.T.; Zhang, L. Study on the Statistical Law of Geological Hazard Distribution in Henan Province. Mod. Min. 2009, 25, 48–51. [Google Scholar]
  55. Lan, H.X.; Peng, J.B.; Zhu, Y.B.; Li, L.P.; Pan, B.T.; Huang, Q.B.; Li, J.H.; Zhang, Q. Geological and surficial processes and major disaster effects in the Yellow River Basin. Sci. China Earth Sci. 2022, 52, 199–221. [Google Scholar] [CrossRef]
  56. Song, S.H.; Li, H.K.; Zhang, Z.W. Spatial and temporal change analysis of soil erosion in the source area of the Dongjiang River based on RUSLE model. J. Earth Environ. 2022, 13, 344–353. [Google Scholar]
  57. Liu, Y.S.; Feng, W.L.; Li, Y.R. Modern Agricultural Geographic Engineering and High quality Agricultural Development—Taking Loess Hilly and Gully Areas as an Example. J. Geogr. 2020, 75, 2029–2046. [Google Scholar]
  58. Liu, L.; Wei, J.; Ma, Y.; Luo, Q.; Wang, Z. Temporal and spatial changes for ecological environment of Yellow River in Henan province. Environ. Sci. Manag. 2021, 46, 169–173. [Google Scholar]
  59. Ye, H.M.; Hua, W.P.; Wu, X.Y.; Hu, J.P.; Su, L.M.; Yang, H.; Zhao, Z.L.; Wu, C.Z. Effects of land use on soil erosion and nutrient loss in small watershed in red soil hilly area. Environ. Chem. 2022, 41, 4154–4164. [Google Scholar]
  60. Guo, L.Y.; Sun, Y.Y.; Wang, T. Remote sensing monitoring and evaluation of ecological environment quality in soil and water conservation functional areas of the Loess Plateau. J. Xi’an Univ. Technol. 2022, 1–11. [Google Scholar]
  61. Li, Y.C.; Liu, C.X.; Zhao, C.Y.; Huang, J.H. Spatial and temporal pattern characteristics of water and soil loss in Chongqing section of the Three Gorges Reservoir Area. J. Geogr. 2008, 5, 475–486. [Google Scholar]
  62. Shen, Z.X.; Zhang, Q.; Wu, W.H.; Song, C.Q. Spatial pattern and driving factors of geological hazard prone areas on the Qinghai Tibet Plateau and Hengduan Mountains. J. Geogr. 2022, 77, 1211–1224. [Google Scholar]
  63. Zhang, J.L.; Chen, K.; Zhang, C.; Guo, P.C. The change characteristics of eco-environment in the Yellow River Basin based on entropy weights. China Environ. Sci. 2021, 41, 3767–3774. [Google Scholar] [CrossRef]
  64. Ning, Z.R.; Yang, X.M.; Chen, Y.J. Ecological protection and restoration of mountains-rivers-forests-farmlands-lakes-grasslands in Nantaihang area, Henan Province: Integrated landscape management. Acta Ecol. Sin. 2019, 39, 8886–8895. [Google Scholar] [CrossRef]
  65. Huang, S.W.; Li, J.; Zhang, X.J.; Deng, L.; Zhang, J. Analysis of spatial and temporal changes in soil erosion in Henan Province over the last ten years. J. Agric. Resour. Environ. 2021, 38, 232–240. [Google Scholar] [CrossRef]
  66. Lan, H.X.; Zhu, Y.B.; Li, L.P.; Pan, B.T.; Hu, Z.B.; Peng, J.B. Research on multi process interaction of geology, geomorphology and climate in the Yellow River Basin and its gestation mechanisms on major disasters. Bull. Natl. Nat. Sci. Found. China 2021, 35, 510–519. [Google Scholar] [CrossRef]
Figure 1. Geographical location of the study area.
Sustainability 15 06818 g001
Figure 2. Soil erosion intensity grade map. (a) 2001; (b) 2010; (c) 2019.
Sustainability 15 06818 g002
Figure 3. Soil and water conservation amount. (a) 2001; (b) 2010; (c) 2019.
Sustainability 15 06818 g003
Figure 4. Water conservation amount. (a) 2001; (b) 2010; (c) 2019.
Sustainability 15 06818 g004aSustainability 15 06818 g004b
Figure 5. Biodiversity maintenance function index. (a) 2001; (b) 2010; (c) 2019.
Sustainability 15 06818 g005
Figure 6. Average value of biodiversity maintenance function index of each city: (a) annual average, (b) multi-year average.
Sustainability 15 06818 g006aSustainability 15 06818 g006b
Figure 7. Geological hazard susceptibility. (a) 2001; (b) 2010; (c) 2019.
Sustainability 15 06818 g007
Figure 8. Classification results of eco-environmental geological problems. (a) 2001; (b) 2010; (c) 2019.
Sustainability 15 06818 g008aSustainability 15 06818 g008b
Table 1. Landsat data used in the study area.
Study AreaSensorYearRow Number
The south section of
the Yellow River Basin
Landsat TM2001123/35 123/36 124/36
125/36 135/37 126/37
Landsat TM2010
Landsat OLI2019
Table 2. Soil erosion classification table.
Soil Erosion LevelsSoil Erosion Modulus (t·km−2·a−1)Average Loss Thickness (mm·a−1)
Slight erosion<200<0.15
Mild erosion200–25000.15–1.9
Moderate erosion2500–50001.9–3.7
Intense erosion5000–80003.7–5.9
Extremely intense erosion8000–15,0005.9–11.1
Severe erosion>15,000>11.1
Table 3. The weight of factors of geological hazard susceptibility.
FactorWeight of Factor (2001)Weight of Factor
(2010)
Weight of Factor
(2019)
Distance from the Yellow River main stream0.18620.17880.1838
Vegetation coverage0.15760.17300.1748
Rainfall0.12950.14210.1333
Slope0.22970.21980.2290
Soil type0.13860.13360.1342
Distance from the mining area0.15850.15270.1549
Table 4. Results of the factor detector in the Sanmenxia–Zhengzhou section.
Detection IndicatorsExplanatory Power (q)
200120102019
Elevation0.3590.2090.333
Slope0.1740.0620.145
Rainfall0.2120.1520.219
Temperature0.0210.0370.089
Evapotranspiration0.1450.0960.187
Vegetation coverage0.2810.1710.303
Land-use type0.1830.1520.218
NPP0.1690.0960.209
Mining activities0.1480.0380.183
Table 5. Correlation between eco-environmental geological problems and various factors in the Zhengzhou–Puyang section.
Detection Indicators200120102019
CorrelationTwo-TailedCorrelationTwo-TailedCorrelationTwo-Tailed
Elevation0.2790.5610.0100.6460.0300.110
Slope0.0180.3730.0370.0760.0300.170
Rainfall−0.372 **0−0.304 **0−0.420 **0
Temperature0.289 **00.105 **00.150 **0
Evapotranspiration0.0880.4120.0170.4220.0300.170
Vegetation coverage−0.367 **0−0.288 **0−0.280 **0
Land-use type0.316 **00.294 **00.150 **0
NPP−0.0530.352−0.0160.437−0.0300.110
** At 0.01 level (two-tailed), the correlation was significant.
Disclaimer/Publisher’s Note: The statements, opinions and data contained in all publications are solely those of the individual author(s) and contributor(s) and not of MDPI and/or the editor(s). MDPI and/or the editor(s) disclaim responsibility for any injury to people or property resulting from any ideas, methods, instructions or products referred to in the content.