Article

Decomposition and Scenario Analysis of Factors Influencing Carbon Emissions: A Case Study of Jiangsu Province, China

1
Wu Jinglian School of Economics, Changzhou University, Changzhou 213159, China
2
Jiangsu Energy Strategy Research Base, Changzhou University, Changzhou 213159, China
3
Institute of Agricultural Economics and Development, Chinese Academy of Agricultural Sciences, Beijing 100081, China
*
Author to whom correspondence should be addressed.
Sustainability 2023, 15(8), 6718; https://doi.org/10.3390/su15086718
Submission received: 2 February 2023 / Revised: 1 April 2023 / Accepted: 9 April 2023 / Published: 16 April 2023

Abstract

:
It is crucial for China to take the characteristics and development stage of every province in the region into account in order to achieve the “dual carbon” development goal. Using data collected from 2000 to 2019, this study identifies the factors that influence carbon emissions using the logarithmic mean Divisia index (LMDI) method and establishes a revised stochastic impacts by regression on population, affluence, and technology (STIRPAT) model to investigate the effects of four key factors on carbon emissions in Jiangsu province: population size, economic output, energy intensity, and energy structure. The following conclusions were drawn: (1) energy intensity contributes to a slowed rate of carbon emission production in Jiangsu, whereas population size, economic output, and energy structure contribute to a pulling effect; (2) under different scenarios, Jiangsu’s carbon dioxide emissions peak at different times and reach different values; and (3) two low-carbon scenarios are more in line with the current development situation and future policy orientation of Jiangsu Province and are therefore better choices. Our policy recommendations are as follows: (1) the development of economic and social activities should be coordinated and greenhouse gas emissions should be reduced; (2) the province’s energy structure should be transformed and upgraded by taking advantage of the “dual carbon” development model; and (3) regionally-differentiated carbon emission reduction policies should be developed.

1. Introduction

Climate change has been significantly impacted by greenhouse gas emissions and is a major obstacle to sustainable development around the world [1,2,3]. In the last 50 years, global industrialization has accelerated significantly and carbon emissions have increased greatly, resulting in global warming. Global average temperature has risen by more than one degree Celsius since 1960. Therefore, controlling global warming by reducing carbon emissions has become an international consensus [4,5,6].
In response, countries have taken various measures to reduce carbon dioxide emissions and actively combat climate change. As the world’s largest energy consumer, China attaches great importance to carbon emission reduction [7]. At the 75th United Nations General Assembly in September 2020, President Xi Jinping stated that peak carbon should be achieved by 2030 and carbon neutrality should be achieved by 2060. Located along the eastern coast of China, Jiangsu Province has a developed economy and trade but also high carbon dioxide emissions. Carbon emissions from Jiangsu comprised 5.2% of the national total in 2019. Determining how to achieve the planned peak carbon and carbon neutrality tasks while ensuring steady economic and social development is a practical problem for Jiangsu Province [8].
Therefore, the aim of this study is to develop a system for the analysis of influencing factors for carbon emissions in Jiangsu based on historical data and to use this system to make a prediction for future carbon emissions in Jiangsu. Its significance is to permit us to specifically extract the main factors that affect Jiangsu’s carbon emissions based on its own development characteristics, thereby improving the model’s fit and providing a higher confidence level for subsequent prediction results.
Over the past few years, the academic community has paid increasing attention to the issue of carbon emissions. Based on national data, many studies have analyzed and discussed China’s future peak carbon trend from different perspectives and there is optimism that China can achieve its peak carbon goal by 2030 as planned [9,10,11,12,13,14,15,16,17,18]. However, some studies believe that it will be challenging for China to achieve the established peak carbon goal. For instance, Chen et al. (2019) predicted that the Chinese carbon emission peak will not occur earlier than 2036, based on the Kuznets curves for four major industries: industry, construction, transportation, and agriculture [19]. According to Liu et al. (2017), without additional policy interventions, China’s carbon dioxide emissions will increase until 2040 [20]. Based on the Tapio decoupling model, Wu and Xu (2022) stated that China’s current carbon emission reduction efforts are not sufficient to achieve the 2030 peak carbon goal [21].
As the provinces of China are at different stages of development, there are great differences in energy supply, energy consumption, and economic development models. Thus, some studies have combined the specific characteristics of different provinces to explore their energy consumption changes and carbon emission trends. Using data from 30 provinces, Jiang et al. (2017) systematically analyzed the contributions of relevant contributing factors to China’s increasing carbon emissions and concluded that, as China’s carbon dioxide emissions have increased, each province’s contribution has differed significantly over time and its driving mechanisms have changed dynamically [22]. According to an analysis by Chong et al. (2017), the growth of the economy and population are the primary factors driving the growth of Guangdong’s energy consumption, whereas improvements in electrical supply efficiency are the primary inhibitors [23]. Using a multiagent intertemporal optimization model, Pan et al. (2021) predicted the CO2 emission trends of 13 main industries in Liaoning Province [24]. Dong et al. (2021) investigated the factors that influence carbon emissions from 12 major industries in Henan Province [25]. Li and Yang (2020) reclassified energy production in Shandong Province according to energy flow and consumption responsibility and proposed a new method for provincial carbon emission estimation [26]. According to Li et al. (2021), carbon dioxide emissions from the construction industry in Jiangsu will only reach their peak in 2029 if three measures are taken: the encouragement of research and development investment, the promotion of the use of energy-efficient buildings, and carbon trading [27].
In terms of the research methodology, there have been significant differences in the approaches taken to study carbon emissions. For instance, the stochastic impacts by regression on population, affluence, and technology (STIRPAT) model is mainly used for the future prediction of emissions [28,29,30], the logarithmic mean Divisia index (LMDI) method concentrates on the decomposition of the factors driving carbon dioxide output [31,32], the Grey model can be used to estimate future carbon dioxide emission intensity [33,34], and the multi-objective optimization approach can be used to adjust and optimize carbon emission strategies [35,36]. Some studies have used a combination of various methods to analyze specific problems associated with carbon dioxide emissions [37,38,39,40,41,42].
This study contributes to previous studies in two respects. First, the influencing factors of carbon emissions in Jiangsu are decomposing based on the actual situation and characteristics of Jiangsu. In accordance with to the previous studies, the factors that affect carbon emissions in China and in certain provinces are discussed. However, due to significant differences in resource endowments and development levels among provinces across the country, the influencing factors of carbon emissions in different provinces are also different. Therefore, it is necessary to conduct specific analysis of the main influencing factors of carbon emissions in Jiangsu Province. Second, based on the STIRPAT model, the future carbon emissions of Jiangsu are predicted. Numerous studies have been conducted on the prediction of carbon emission peaks at the national level in China and many believe that the country will meet its peak peak carbon target on schedule. However, there is little discussion on whether Jiangsu can achieve this peak carbon target. As China’s economic powerhouse and major industrial province, Jiangsu has attracted attention from all walks of life regarding its potential to achieve its peak carbon goal on schedule while ensuring its own economic development speed is maintained. Predicting the future carbon emissions of Jiangsu under different scenarios based on the STIRPAT model can just make up for the lack of existing research.

2. Methods and Materials

2.1. The Calculation Method of Carbon Emission

In accordance with the IPCC Guidelines for National Greenhouse Gas Emission Inventory, this study uses energy consumption data and emission coefficients to calculate carbon dioxide emissions from Jiangsu Province [43]. The formula is as follows:
C = i = 1 n ( X i × N C V i × C C i × O i ) × 44 / 12
where C represents the carbon dioxide emissions produced by burning energy, i represents the type of energy, X i represents the consumption of i , N C V i represents the low heating value of i , C C i represents the carbon content per unit of calorific value of i , O i represents the carbon oxidation rate of i , and 44/12 represents the mass conversion factor for carbon. In accordance with the China Energy Statistical Yearbook, 26 types of fossil energy were included.

2.2. LMDI Method

The LMDI decomposition method was developed based on the Kaya identity. Proposed by Ang (2015) [44], it has the advantages of eliminating residual terms and visually displaying decomposition results and it is therefore widely used in energy studies [45,46,47]. Based on the Kaya identity, we built a model of factors influencing carbon emissions in Jiangsu Province:
C C = C E × E G × G P × P
where C represents carbon emissions; E represents energy consumption; G represents GDP; P represents the population size; C / E denotes the ratio of carbon emissions to energy consumption, representing the energy structure; E / G denotes the ratio of energy consumption to GDP, representing the energy intensity; and G / P denotes the ratio of GDP to population size, representing economic output.
The LMDI decomposition method is divided into eight models according to the difference between the quantity and intensity indicators, the difference between additive and multiplicative analyses, and the difference between the LMDI-I and LMDI-II (the difference between the LMDI-I and LMDI-II lies in the weight formulae used). In this study, Model 1 in LMDI-I was selected as the specific method for use in subsequent analyses [44].
Formula (2) was decomposed without residual error, where C 0 denotes the carbon emissions during the base period, C t denotes the carbon emissions during period t , and Δ C denotes the comprehensive effect of carbon emission changes in Jiangsu Province. The expression is as follows:
Δ C = C t C 0 = Δ C C E t + Δ C E G t + Δ C G P t + Δ C P t
where Δ C C E t denotes the energy structure effect; Δ C E G t denotes the energy intensity effect; Δ C G P t denotes the economic output effect; and Δ C P t denotes the population size effect.
The expressions of each effect are as follows:
Δ C C E t = C t C 0 l n C t l n C 0 × ln ( C E T C E 0 )
Δ C E G t = C t C 0 l n C t l n C 0 × ln ( E G T E G 0 )
Δ C G P t = C t C 0 l n C t l n C 0 × ln ( G P T G P 0 )
Δ C P t = C t C 0 l n C t l n C 0 × ln ( P T P 0 )

2.3. STIRPAT Model

In light of the global carbon emission problem becoming increasingly severe, York et al. (2003) proposed an extended stochastic STIRPAT model based on IPAT’s environmental impact model [48]. The basic formula of the IPAT model is as follows:
I = a P b A c T d e
where I denotes environmental pressure; a denotes the model coefficient; P , A , and T represent population size, affluence, and technological level, respectively; b , c , and d represent the elastic coefficients of P , A and T , respectively; and e denotes the random error term.
Previous studies have improved and expanded the IPAT environment model in different forms based on their respective analysis needs. The analysis of influencing factors affecting carbon emissions in relevant studies is listed in Table 1. It can be seen that the STIRPAT model in many studies contains basic variables (population size, affluence and technological level) that reflect the IPAT model. While some studies have added some extended variables to accommodate their specific research content, we aim to follow the analytical thinking of the LMDI model and continue to conduct scenario analysis from P, A, and T. Therefore, this study used population size (P) and economic output (GP) (instead of the affluence (A)) and expanded technological level (T) to the energy structure (CE) and energy intensity (EG) for subsequent analyses. The formula was logarithmized to eliminate heterogeneity.
The expanded formula is as follows:
l n I = l n a + β 1 l n P + β 2 l n G P + β 3 l n C E + β 4 l n E G + l n e
where I represents carbon dioxide emissions, P represents population size, G P represents economic output, C E represents energy structure, and E G represents energy intensity, β 1 , β 2 β 4 are the coefficients of the corresponding variables, a is the constant term, and e is the random error term.

2.4. Variables and Data

Using representative indicators and available data, this study comprehensively examined the reduction of carbon emissions in Jiangsu considering the “dual carbon” policy requirements. Based on previous studies, carbon dioxide emissions were selected as the explained variable and population size, economic output, energy structure, and energy intensity were selected as explanatory variables to systematically examine the peak trend and pathway of carbon emissions in Jiangsu Province [55,56]. The factors influencing carbon dioxide emissions in Jiangsu Province are presented in Table 2.
The data used in this study were derived from the Jiangsu Statistical Yearbook and the China Energy Statistical Yearbook from 2000 to 2019.

2.5. Scenario Analysis

In this study, a scenario analysis was used to predict Jiangsu’s future carbon emission trends. In order to focus on the future peak carbon situation in Jiangsu Province, the time period used for the scenario analysis and prediction was 2030–2050. The predicted values for population size, economic output, energy intensity, and energy structure were based on historical development and changing rules, policy planning, and relevant existing research. Thus, this study set each variable’s development rate as high, medium (baseline), or low. The setting results are presented in Table 3.

2.5.1. Population Size

In accordance with data published in the China Statistical Yearbook, Jiangsu experienced an average annual population growth rate of 0.43% from 2000 to 2019. However, that rate has gradually slowed in recent years and the average population growth rate over the past five years has decreased to 0.28%. Meanwhile, according to a study by Chen et al. (2020), the population growth rate in Jiangsu will continue to decline slowly in the future [57]. Jiangsu is set to experience a medium annual population growth rate of 0.3% in 2020, a high annual population growth rate of 0.33%, and a low annual population growth rate of 0.27%.

2.5.2. Economic Output

In recent years, Jiangsu’s economic output has shown a downward trend since it reached its highest level of 21% in 2005 and the average annual increase in the economic output from 2015 to 2019 has been 8.6%. In combination with the plan for Jiangsu’s GDP growth rate during the Fourteenth Five Year Plan for National Economic and Social Development and the Outline of the Vision Goals for the Year 2035, Jiangsu’s economic output is projected to develop at a medium annual growth rate of 8%, a high yearly growth rate of 9%, and a low annual growth rate of 7% in 2020. From 2021 to 2050, the above growth rates are set to decrease by 0.2% every year.

2.5.3. Energy Intensity

Considering that Jiangsu’s energy consumption growth rate lags behind its economic growth, its energy intensity growth rate has been negative for most of the last 20 years. From 2015 to 2019, Jiangsu’s energy intensity grew by −6.6% annually, showing relative stability. Meanwhile, according to the Implementation Opinions on Promoting High Quality Development and Achieving Peak Carbon and Carbon Neutrality issued by the Jiangsu provincial government, the energy consumption in Jiangsu will continue to be reduced and low-carbon development will be promoted over the next few years. Therefore, the annual medium growth rate of energy intensity in Jiangsu in 2020 was set at −6%, the annual high growth rate was set at −5%, and the annual low growth rate was set at −7%. From 2021 to 2050, the above growth rates are set to decrease by 0.2% annually.

2.5.4. Energy Structure

Jiangsu’s energy consumption has been relatively stable since 2000 in terms of CO2 emissions. However, Jiangsu’s energy structure has been growing at a significant rate over the last five years, with a growth rate of 1.06% annually. According to the Implementation Opinions on Promoting High Quality Development and Achieving Peak Carbon and Carbon Neutrality issued by the Jiangsu provincial government, Jiangsu is committed to the reduction of carbon emissions in the future in addition to the promotion of the implementation of carbon neutrality. Therefore, Jiangsu’s energy structure is expected to increase at a medium rate of 1% in 2020, a high rate of 1.1%, and a low rate of 0.9%. From 2021 to 2050, the above growth rates are set to decline by 0.02% every year.

2.5.5. Scenario Settings

Eight carbon emission scenarios were constructed based on the development stage, policy tendency, and actual situation of each carbon emission-influencing factor [51,58,59]. The detailed settings of the eight scenarios are shown in Table 4.
Scenario 1 (S1LSD): low-speed development scenario. All variables in this scenario have low growth rates.
Scenario 2 (S2MSD): medium-speed development scenario. All variables in this scenario have medium growth rates.
Scenario 3 (S3HSD): high-speed development scenario. All variables in this scenario have high growth rates.
Scenario 4 (S4LCD): low carbon development scenario. According to this scenario, energy conservation, energy conservation, and carbon reduction will have moderate effects on carbon emissions when the population size and economic output grow at moderate rates. Therefore, in this scenario, energy intensity and energy structure have low growth rates.
Scenario 5 (S5LPG): low population growth scenario. The fertility rate in Jiangsu has steadily declined over the past few years, which has led to a continuous decline in population growth. The scenario simulates a situation where other factors are growing moderately while the population size is growing slowly.
Scenario 6 (S6HEG): high economic growth scenario. In China, Jiangsu has ranked among the top two provinces in terms of economic growth for many years. This scenario simulates the situation in which economic growth is still occurring at high speed, while other factors are developing moderately.
Scenario 7 (S7LCH): low carbon and high economic growth scenario. Jiangsu’s development will focus on being “strong, rich, beautiful, and high” while maintaining moderate growth of its population size. For this scenario, we set the energy intensity and energy structure growth rates to the low growth mode, which will further reduce carbon dioxide emissions, and the economic output to a high growth mode, which will allow a high level of economic development to be maintained.
Scenario 8 (S8LPH): Low population and high economic growth scenario. This scenario simulates the situation where the energy intensity and energy structure growth rates are both at a moderate level, the population is growing at a low level, and the economic output is growing at a high level.

3. Results and Discussion

3.1. Breakdown of Factors Influencing Carbon Emissions

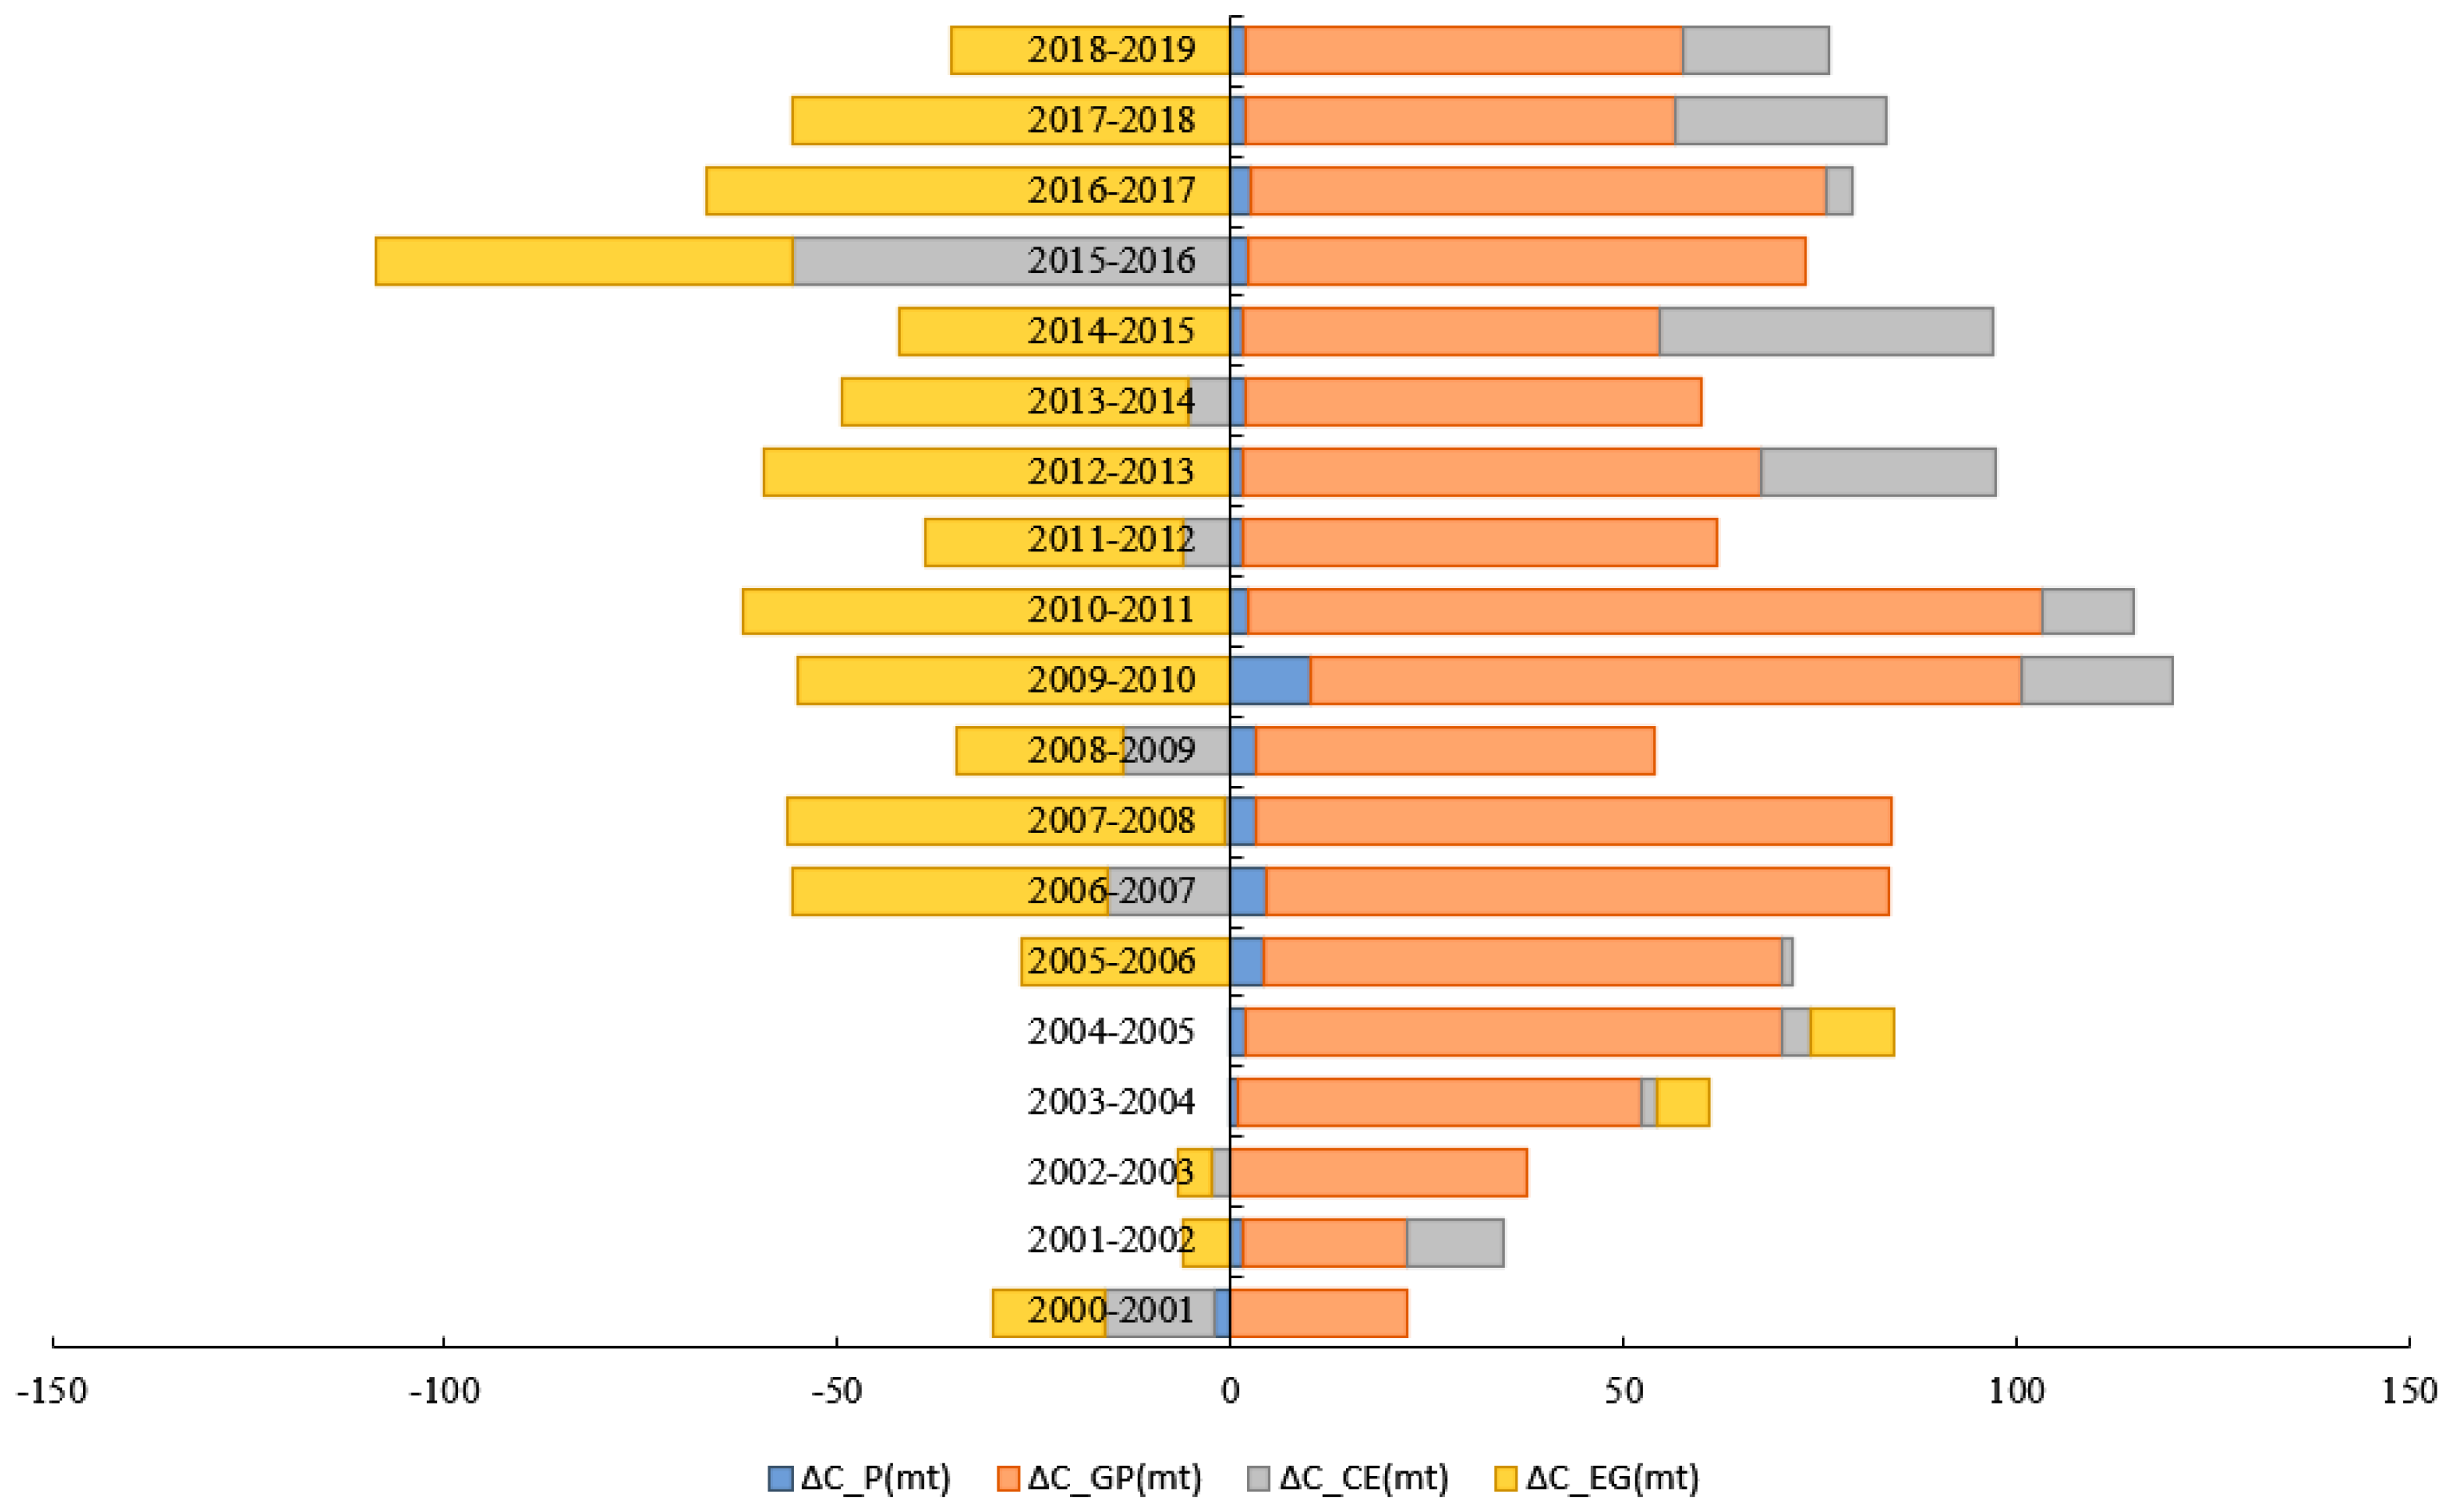
In this section, we investigate the influences of carbon dioxide emissions in Jiangsu using four key factors (population size, economic output, energy structure, and energy intensity) with the LMDI method and calculate the annual change value and cumulative change value of each effect. The results are presented in Figure 1 and Table 5.
The annual added value for Jiangsu’s carbon emissions was found to be positive in all years, except for in 2000–2001 and 2015–2016, when it was negative. In particular, from 2000 to 2019, only the energy intensity effect was able to lower the carbon emission level while the population size effect, economic output effect, and energy structure effect had a deleterious effect on carbon emission levels. The energy intensity effect produced cumulative carbon emissions of −658.38 Mt over 20 years, which indicates that there has been a focus on energy consumption in Jiangsu during the development process. Several energy conservation and emission reduction programs have been implemented, resulting in a decline in Jiangsu’s energy intensity. The economic output effect has led to the accumulation of 1159.97 Mt of carbon emissions. The effect increased year by year from 22.29 Mt of carbon emissions in 2000–2001 to the highest point of 100.89 Mt in 2010–2011 before falling back to 55.58 Mt in 2018–2019. This indicates that efforts to establish a low-carbon economy have been continuously strengthened in Jiangsu over the past decade. In particular, after the “12th Five Year Plan” for reducing carbon dioxide emissions in Jiangsu was issued in 2013, carbon dioxide emission reduction efforts were further enhanced and the carbon dioxide emissions caused by the economic output effect in Jiangsu dropped significantly in the following 10 years. Only 45.16 Mt of carbon emissions have accumulated after 20 years of the population size effect, which shows that the increase in the population in Jiangsu has not substantially affected carbon dioxide emissions. The energy structure effect has generated 58.45 Mt of carbon emissions in 20 years, including negative carbon emissions in 8 years and positive carbon emissions in the rest. This shows that over the course of 20 years of development, Jiangsu’s energy structure has continuously adapted to meet the different challenges associated with each stage of sustainable development.

3.2. STIRPAT Model Estimation

3.2.1. Unit Root Test

In our study, we utilized the extended STIRPAT model to estimate carbon dioxide emissions in Jiangsu. First, the Augmented Dickey–Fuller (ADF) test was used to check the stationarity of each variable. For this test, the original sequence of each variable is logarithmic, where l n I is the interpreted variable and l n P , l n G P , l n C E and l n E G are the explanatory variables. If the logarithmic sequence is not stationary, the sequence must to be subjected to first-order differential treatment and then tested for stationarity. When the first-order differential sequence does not appear to be stable, a second-order differential treatment must be performed, followed by a stationarity test. Table 6 indicates that the ADF values of second-order differential sequences of each variable passed the significance threshold of 1% and reached stationary states.

3.2.2. Multicollinearity Test

To identify any multilinearity issues among the variables, the ordinary least squares (OLS) method was used to regress the four variables that affect Jiangsu’s carbon emissions: population size, economic output, energy structure, and energy intensity. By calculating the variance inflation factor (VIF) for each variable, we were able to assess whether the variables were multicollinear. The test results are shown in Table 7. The VIF values of population size, economic output, and energy intensity were found to be greater than 10, indicating multicollinearity between the variables. Therefore, the OLS method could not be used to estimate the regression model effectively.

3.2.3. Analyses of Model Fitting

As a solution for multicollinearity among variables, we conducted a ridge regression based on the STIRPAT model and constructed a carbon emissions prediction model for Jiangsu Province.
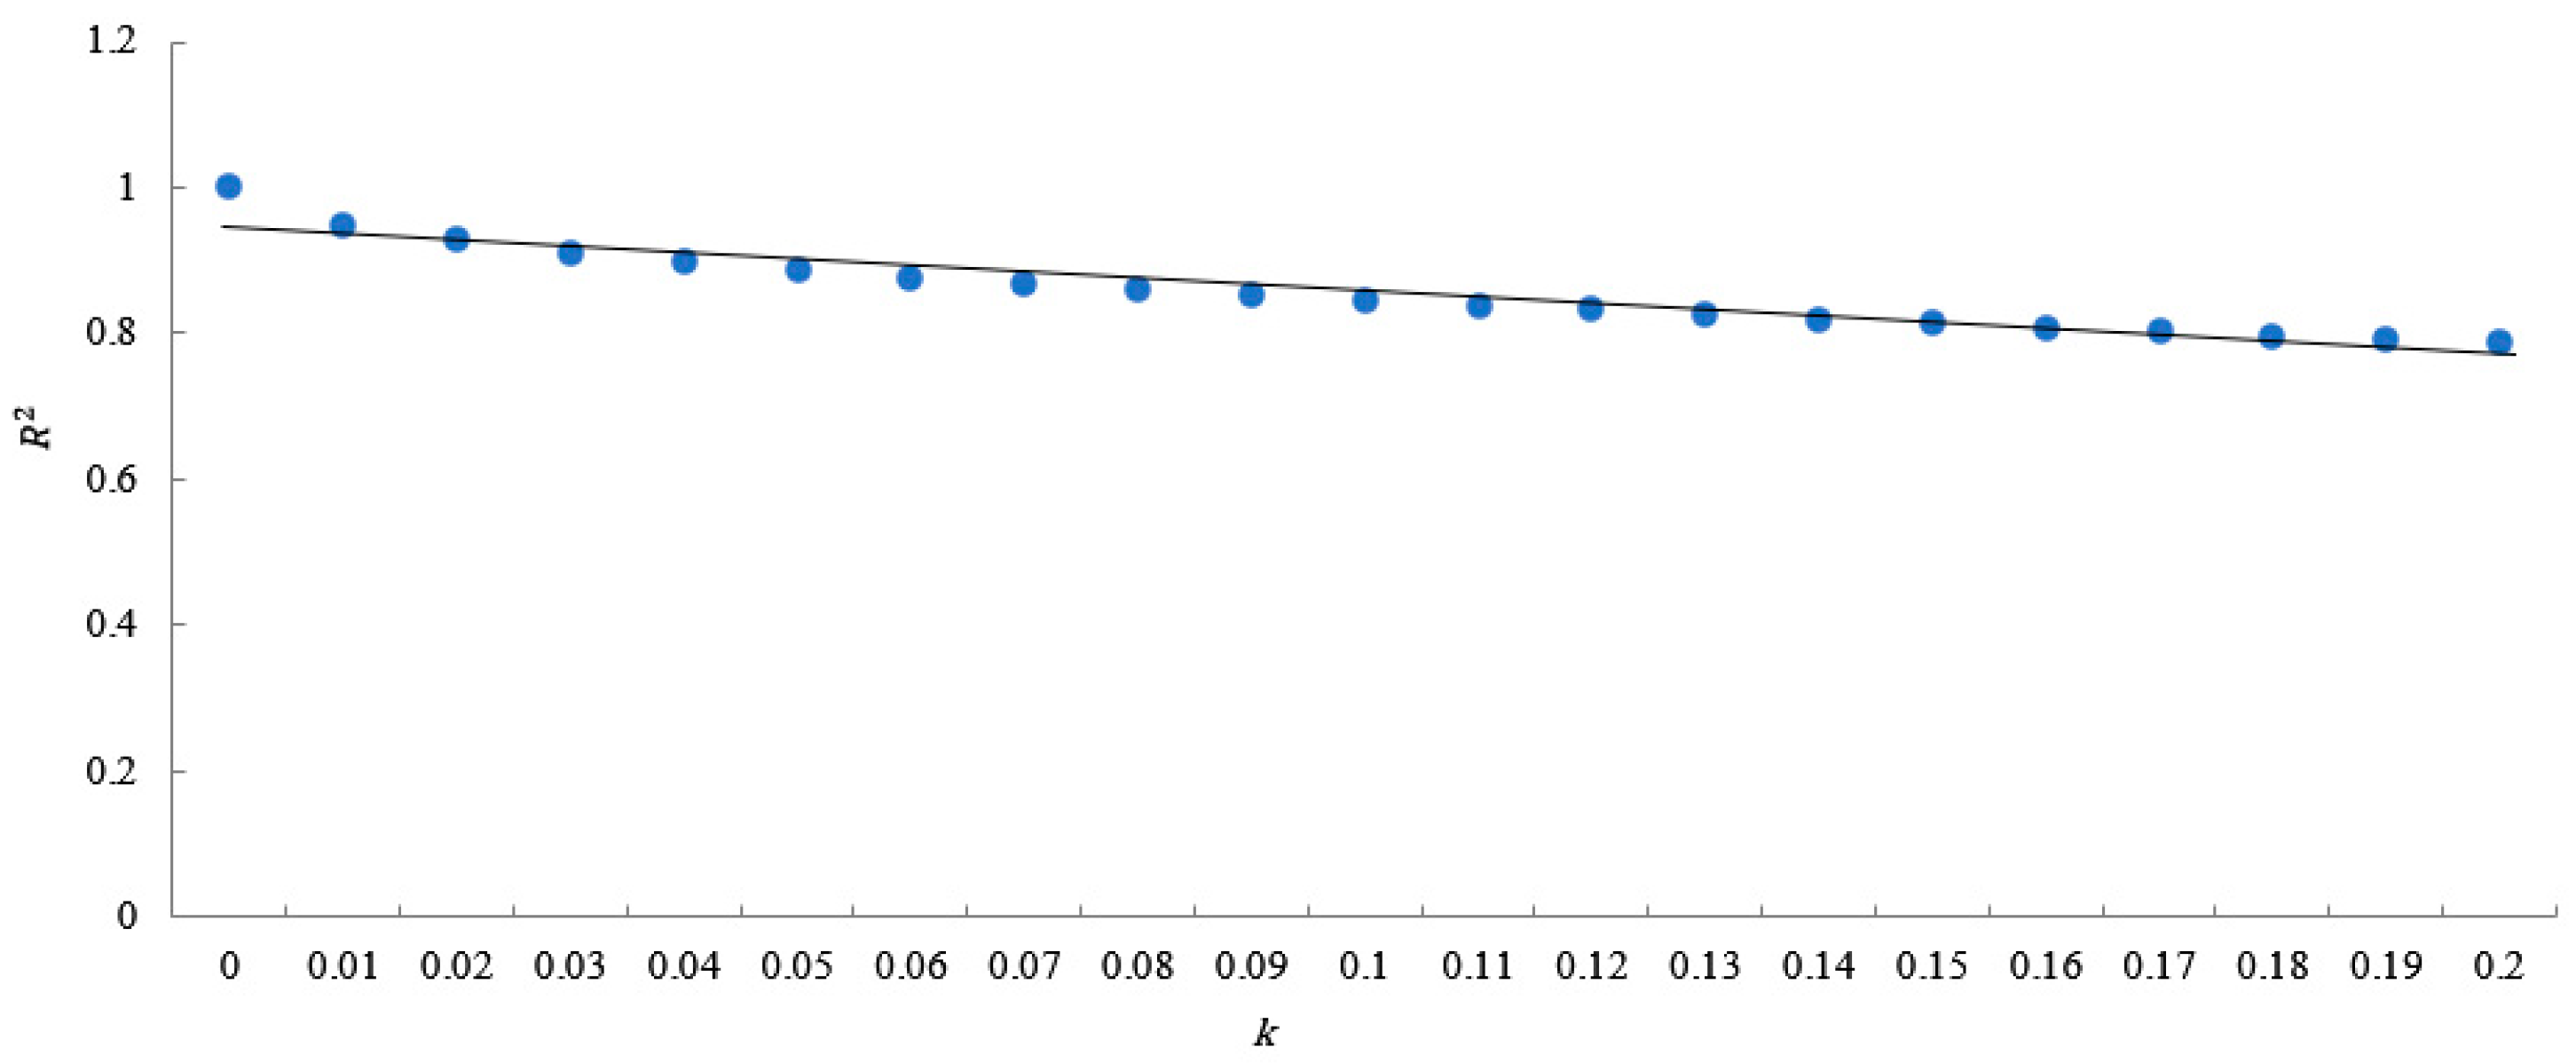
In the ridge regression, the unit length of the ridge parameter is set as 0.01 and the value range of the coefficient k is (0, 1). As long as the relationship between R 2 value and the k value tends to be stable, the regression coefficients of each variable will be stable and the regression results will be meaningful. Accordingly, a ridge regression analysis was conducted to obtain a ridge trace map of the R 2 value and k value as shown in Figure 2. The R 2 value of the regression equation tended to be stable when the k value was 0.01. Therefore, the ridge regression estimation results of the Jiangsu carbon emission prediction model for k = 0.01 are presented in Table 8.
According to Table 8, each variable’s coefficient value passed the 5% significance level test. The ridge regression equation has an R 2 value of 0.955 and an F value of 771.48, which indicates that the model is well fitted. The results of the model for predicting carbon dioxide emissions in Jiangsu were analyzed and population size, economic output, energy intensity, and energy structure were found to exhibit positive correlations with carbon dioxide emissions, although the level of impact varied significantly. As a result of a 1% change in population size, economic output, energy intensity, and energy structure, Jiangsu’s carbon emissions are predicted to change by 3.76%, 0.77%, 0.72%, and 0.76%, respectively.

3.2.4. Robustness Test of the Ridge Regression Equation

To test the robustness of the ridge regression equation, historical data from 2000 to 2019 were brought into the equation for the simulation and the estimated values of carbon emissions were obtained and compared with the actual values. As shown in Table 9, the error rates between the estimated values and the actual values obtained based on the ridge regression equation are all within ± 10%, indicating that the model produces good predictions and can be used for the prediction of subsequent carbon emission.

3.2.5. Carbon Emission Prediction Analysis

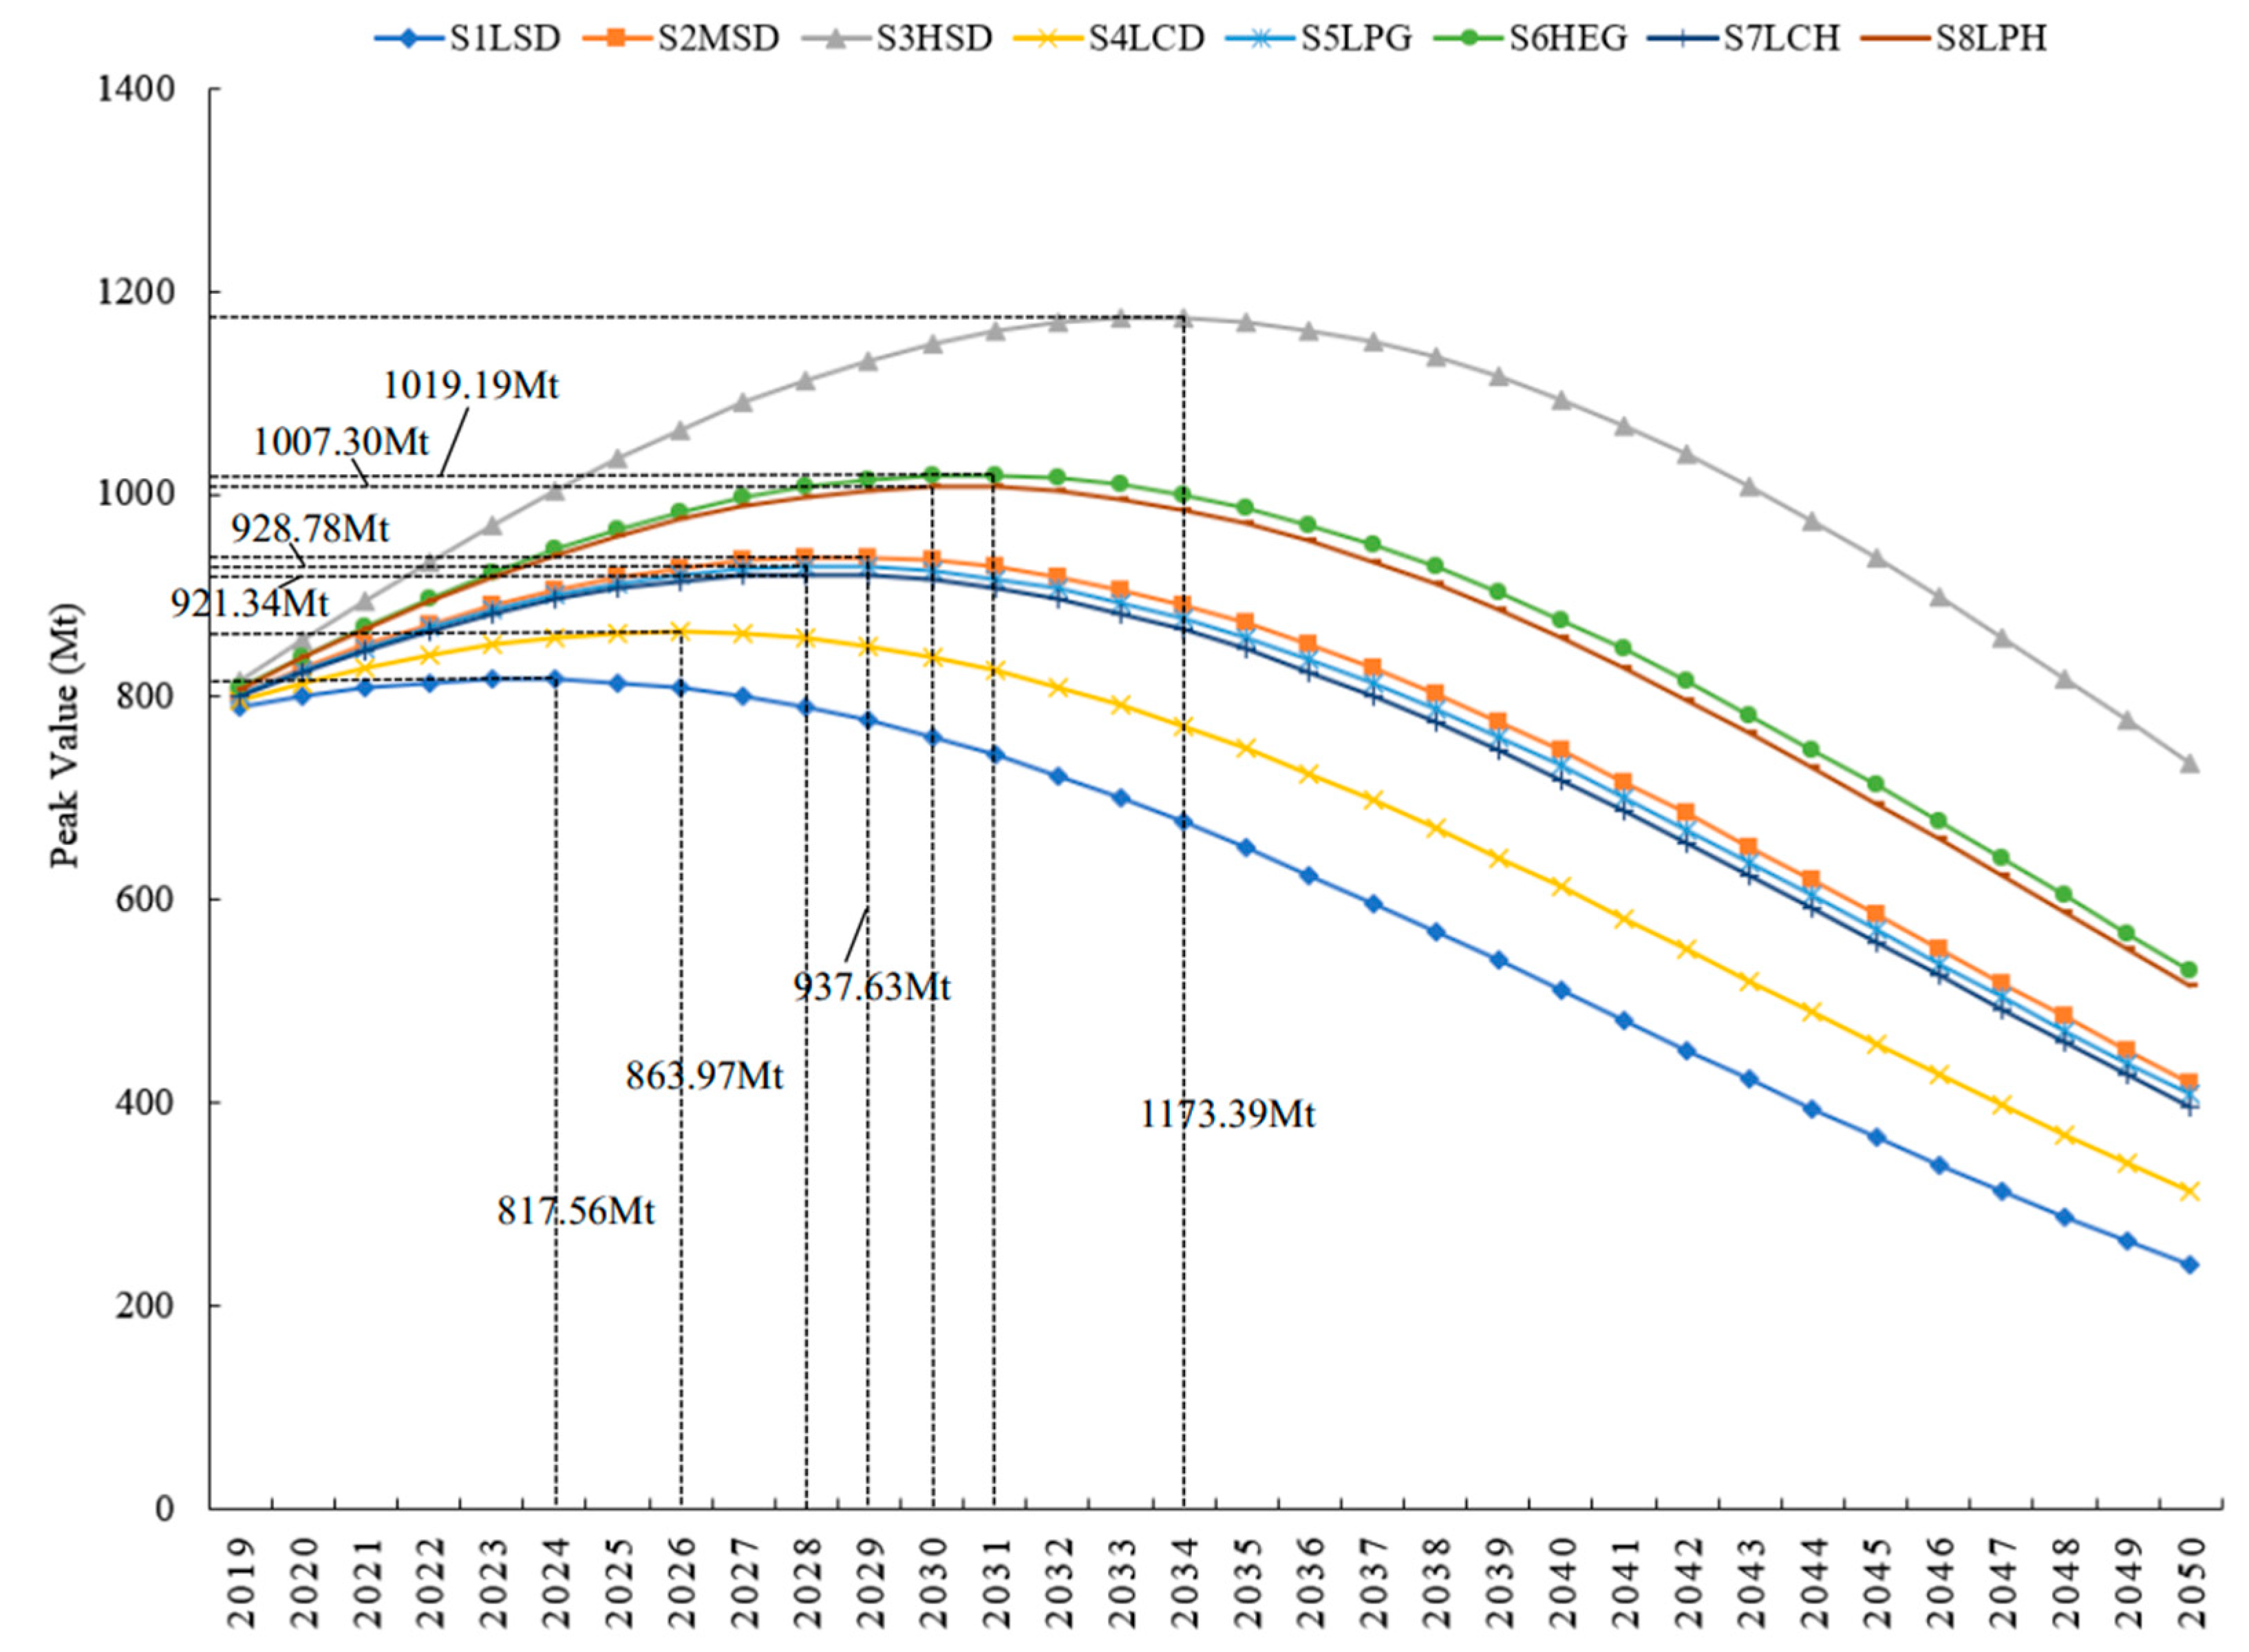
This study predicts the carbon emission trends for Jiangsu from 2020 to 2050 based on the Jiangsu carbon emission prediction model. Figure 3 shows the prediction results for carbon emission trends and peak carbon times in Jiangsu under different scenarios.
Our study on carbon emission trends in Jiangsu identified significant differences among the eight scenarios in terms of carbon emissions changes. For S1LSD, S2MSD, S4LCD, S5LPG, S7LCH, and S8LPH, Jiangsu’s carbon emissions are expected to peak by 2030 or before, while in S3HSD and S6HEG, Jiangsu’s peak carbon goal cannot be achieved as planned.
(1) Although the four main factors (population size, economic output, energy intensity and energy structure) are limited to relatively low development rates in S1LSD, the province is predicted to achieve peak carbon in 2024, in advance of the planned peak. This is the earliest prediction of peak carbon among the eight scenarios. However, the disadvantage of this scenario is that the provincial economic development speed is limited.
(2) In S2MSD, all influencing factors develop at a medium speed. It is estimated that Jiangsu’s carbon dioxide peak will be 937.63 Mt, and this will occur in 2029.
(3) Low-carbon sustainable development is the theme for Jiangsu’s future development. In S4LCD, population size and economic output grow at medium speeds while energy intensity and energy structure grow slowly. Under this scenario, Jiangsu will reach peak emissions of 863.97 Mt in 2026.
(4) In S5LPG, under the condition that other factors develop at a medium speed with only the population growing at a low speed, Jiangsu’s carbon emissions will peak at 928.78 Mt in 2028.
(5) S7LCH is a low carbon and high economic growth scenario. To achieve low carbon development and ensure high speed economic growth, Jiangsu’s carbon emissions will peak at 921.34 Mt in 2028.
(6) S8LPH is a low population growth and high economic growth scenario. As the population increases slowly and the economy grows rapidly, Jiangsu’s carbon emissions will peak in 2030, but will exceed 1000 Mt at that point.
(7) According to S3HSD, Jiangsu’s carbon emissions will peak in 2034, which is four years later than the peak carbon time set at the national level.
(8) In S6HEG, Jiangsu’s carbon emissions will peak at 1019.19 Mt in 2031, which is also later than the peak carbon time set for the national and provincial levels.
In general, under S4LCD and S7LCH, it will be possible to reach the province’s peak carbon goal by 2030. Both of these scenarios can maintain peak value under 925 Mt and are more appropriate for Jiangsu’s current development situation and the policy orientation of its future development and therefore are more desirable choices. Meanwhile, the analysis results indicate that Jiangsu will reach a minimum peak carbon of 817.56 Mt under S1LSD while it will reach a maximum peak carbon of 1173.39 Mt under S3HSD. Therefore, the difference between Jiangsu’s peak carbon values under different scenarios will not exceed 355.83 Mt.

4. Conclusions and Policy Implications

4.1. Conclusions

In this study, we employed the LMDI method to investigate Jiangsu’s carbon emissions from 2000 to 2019. In addition, an expanded STIRPAT model was developed to evaluate the influences of four key factors (population size, economic output, energy intensity, and energy structure) on Jiangsu’s carbon dioxide emissions from 2000 to 2019. On this basis, eight scenarios were constructed to evaluate future emissions in Jiangsu. The main findings of this study are that energy intensity has a mitigating effect on carbon emissions and that it would be possible for Jiangsu to reach peak carbon by 2024 with S1LSD. The following conclusions can be drawn:
(1) Jiangsu’s carbon emissions have been growing since 2000–2001; however, its growth rate has been declining on a yearly basis. Among the influencing factors, energy intensity has shown a mitigating effect by accumulating carbon dioxide emissions of −658.38 Mt over 20 years. Population size, economic output, and energy structure all have deleterious effects on carbon emissions, leading to the production of 45.16 Mt, 1159.97 Mt, and 58.45 Mt of carbon emissions, respectively, over the past 20 years.
(2) According to the scenario analysis results, under S1LSD, S2MSD, S4LCD, S5LPG, S7LCH, and S8LPH, it will be possible for Jiangsu to achieve peak carbon by 2030. Among these, S1LSD is associated with the earliest peak carbon time of 2024. The peak value of the above six scenarios is 817.56 Mt–1007.30 Mt.
(3) With S4LCD and S7LCH, it is predicted that peak carbon will be achieved in 2026 and 2028, respectively. With both of these scenarios, peak carbon value can be controlled within 925 Mt and both are consistent with Jiangsu’s current development and the policy orientation of future low carbon development. Therefore, both are more desirable choices.

4.2. Policy Implications

(1) The development of economic and social activities should be coordinated and greenhouse gas emissions should be reduced. Economic and social development are strongly correlated with carbon emissions. Attempting to place a peak carbon goal in an important position while ignoring regional economic development and social development or continuing to promote the original extensive economic development model while ignoring the “double carbon” constraint is not recommended. It is necessary to further explore the deep connections between Jiangsu’s population, economy, energy consumption, and other factors with carbon emissions and to determine a balance point between economic and social operations as well as the reduction of emissions in order to smoothly achieve the “double carbon” goal and to allow the comprehensive and sustainable development of the region’s economy and society.
(2) The transformation and upgrading of energy structure should be accelerated by taking advantage of the “dual carbon” development opportunity. Jiangsu has been driving regional economic and social development for a long time through high investment and high growth, but this has caused pollution and ecological damage in the region for many years. Therefore, Jiangsu needs to take advantage of the “double carbon” development opportunity by utilizing a combination of advantages encompassing industry, capital, technology, research, and development; implementing inventory management and classified disposal measures; and accelerating the low-carbon transformation of energy-consuming and high-polluting enterprises. In addition, Jiangsu could increase the development and utilization efficiency of new energy by building green industrial clusters. Furthermore, Jiangsu should continue to increase its investment in the research and development of low-carbon technologies; promote the research and development of carbon sinks, carbon capture, and other negative emission technologies; and accelerate the transformation and upgrading of the regional energy structure.
(3) Regionally-differentiated carbon emission reduction policies should be developed. First, there are significant differences in the physical geography, cultural conditions, economic development level, and industrial types of the cities in Jiangsu. When formulating carbon emission reduction policies, specific problems must be analyzed and differentiated low-carbon development strategies should be formulated according to the different characteristics and development stages of each city. Second, there are significant differences between cities and rural areas in terms of economic development, carbon dioxide emissions, and energy consumption. The government should develop targeted differentiation policies that reduce carbon dioxide emissions based on the actual situations of cities and villages.
This study still has limitations. First, the scenario analysis method can only reflect the future development trend of carbon emissions under different policies but cannot accurately estimate future carbon emissions. Further studies should attempt to compensate for these shortcomings by using quantitative analyses. Second, this study is only based on the current situation of Jiangsu Province. If similar methods are used to study peak carbon in other provinces, interprovincial differences should be considered. Third, this paper only selects the basic factors affecting carbon emissions. In order to make the prediction results more comprehensive and accurate, the basic influencing factors of carbon emissions can be further subdivided in subsequent research, and the selection range of influencing factors can be appropriately expanded.
Author Contributions

Conceptualization, A.C.; methodology, A.C.; software, A.C.; validation, A.C., X.H. and G.J.; formal analysis, A.C.; investigation, A.C.; resources, A.C.; data curation, A.C.; writing—original draft preparation, A.C.; writing—review and editing, A.C., X.H. and G.J.; visualization, A.C.; supervision, X.H. and G.J.; project administration, A.C., X.H. and G.J.; funding acquisition, A.C. and G.J. All authors have read and agreed to the published version of the manuscript.

Funding

This research was funded by the Major Program of Philosophy and Social Science Research in Universities of Jiangsu Province (Grant No. 2022SJZD062) and the General Program of Philosophy and Social Science Research in Universities of Jiangsu Province (No. 2021SJA1219).

Conflicts of Interest

The authors declare no conflict of interest.

References

  1. Zachos, J.; Pagani, M.; Sloan, L.; Thomas, E.; Billups, K. Trends, rhythms, and aberrations in global climate 65 ma to present. Science 2001, 292, 686–693. [Google Scholar] [CrossRef] [PubMed]
  2. Parmesan, C.; Yohe, G. A globally coherent fingerprint of climate change impacts across natural systems. Nature 2003, 421, 37–42. [Google Scholar] [CrossRef] [PubMed]
  3. Allen, C.D.; Macalady, A.K.; Chenchouni, H.; Bachelet, D.; McDowell, N.; Vennetier, M.; Kitzberger, T.; Rigling, A.; Breshears, D.D.; Hogg, E.H.; et al. A global overview of drought and heat-induced tree mortality reveals emerging climate change risks for forests. Forest Ecol. Manag. 2010, 259, 660–684. [Google Scholar] [CrossRef]
  4. Zheng, X.; Streimikiene, D.; Balezentis, T.; Mardani, A.; Cavallaro, F.; Liao, H. A review of greenhouse gas emission profiles, dynamics, and climate change mitigation efforts across the key climate change players. J. Clean. Prod. 2019, 234, 1113–1133. [Google Scholar] [CrossRef]
  5. Pascale, A.; Chakravarty, S.; Lant, P.; Smart, S.; Greig, C. The rise of (sub)nations? sub-national human development, climate targets, and carbon dioxide emissions in 163 countries. Energy Res. Soc. Sci. 2020, 68, 101546. [Google Scholar] [CrossRef]
  6. Mei, H.; Li, Y.; Suo, C.; Ma, Y.; Lv, J. Analyzing the impact of climate change on energy-economy-carbon nexus system in China. Appl. Energy 2020, 262, 114568. [Google Scholar] [CrossRef]
  7. Li, Y. Path-breaking industrial development reduces carbon emissions: Evidence from Chinese Provinces, 1999–2011. Energy Pol. 2022, 167, 113046. [Google Scholar] [CrossRef]
  8. Lin, B.; Teng, Y. Structural path and decomposition analysis of sectoral carbon emission changes in China. Energy 2022, 261, 125331. [Google Scholar] [CrossRef]
  9. Chen, J. An Empirical Study on China’s Energy Supply-and-Demand Model Considering Carbon Emission Peak Constraints in 2030. Eng. -PRC 2017, 3, 512–517. [Google Scholar] [CrossRef]
  10. Yu, S.; Zheng, S.; Li, X. The achievement of the carbon emissions peak in China: The role of energy consumption structure optimization. Energy Econ. 2018, 74, 693–707. [Google Scholar] [CrossRef]
  11. Liu, D.; Xiao, B. Can China achieve its carbon emission peaking? A scenario analysis based on STIRPAT and system dynamics model. Ecol. Indic. 2018, 93, 647–657. [Google Scholar] [CrossRef]
  12. Sun, Z.; Liu, Y.; Yu, Y. China’s carbon emission peak pre-2030: Exploring multi-scenario optimal low-carbon behaviors for China’s regions. J. Clean. Prod. 2019, 231, 963–979. [Google Scholar] [CrossRef]
  13. Ding, S.; Zhang, M.; Song, Y. Exploring China’s carbon emissions peak for different carbon tax scenarios. Energy Pol. 2019, 129, 1245–1252. [Google Scholar] [CrossRef]
  14. Fang, K.; Tang, Y.; Zhang, Q.; Song, J.; Wen, Q.; Sun, H.; Ji, H.; Xu, A. Will China peak its energy-related carbon emissions by 2030? Lessons from 30 Chinese provinces. Appl. Energy 2019, 255, 113852. [Google Scholar] [CrossRef]
  15. Hu, Y.; Yu, Y.; Mardani, A. Selection of carbon emissions control industries in China: An approach based on complex networks control perspective. Technol. Forecast. Soc. 2021, 172, 121030. [Google Scholar] [CrossRef]
  16. Zhang, Y.; Qi, L.; Lin, X.; Pan, H.; Sharp, B. Synergistic effect of carbon ETS and carbon tax under China’s peak emission target: A dynamic CGE analysis. Sci. Total Environ. 2022, 825, 154076. [Google Scholar] [CrossRef]
  17. Cheng, Y.; Gu, B.; Tan, X.; Yan, H.; Sheng, Y. Allocation of provincial carbon emission allowances under China’s 2030 carbon peak target: A dynamic multi-criteria decision analysis method. Sci. Total Environ. 2022, 837, 155798. [Google Scholar] [CrossRef]
  18. Li, W.; Zhang, S.; Lu, C. Exploration of China’s net CO2 emissions evolutionary pathways by 2060 in the context of carbon neutrality. Sci. Total Environ. 2022, 831, 154909. [Google Scholar] [CrossRef]
  19. Chen, X.; Shuai, C.; Wu, Y.; Zhang, Y. Analysis on the carbon emission peaks of China’s industrial, building, transport, and agricultural sectors. Sci. Total Environ. 2019, 709, 135768. [Google Scholar] [CrossRef]
  20. Liu, Q.; Gu, A.; Teng, F.; Song, R.; Chen, Y. Peaking China’s CO2 Emissions: Trends to 2030 and Mitigation Potential. Energies 2017, 10, 209. [Google Scholar] [CrossRef]
  21. Wu, Y.; Xu, B. When will China’s carbon emissions peak? Evidence from judgment criteria and emissions reduction paths. Energy Rep. 2022, 8, 8722–8735. [Google Scholar] [CrossRef]
  22. Jiang, J.; Ye, B.; Xie, D.; Tang, J. Provincial-level carbon emission drivers and emission reduction strategies in China: Combining multi-layer LMDI decomposition with hierarchical clustering. J. Clean. Prod. 2017, 169, 178–190. [Google Scholar] [CrossRef]
  23. Chong, C.; Liu, P.; Ma, L.; Li, Z.; Ni, W.; Li, X.; Song, S. LMDI decomposition of energy consumption in Guangdong Province, China, based on an energy allocation diagram. Energy 2017, 13, 525–544. [Google Scholar] [CrossRef]
  24. Pan, X.; Xu, H.; Song, M.; Lu, Y.; Zong, T. Forecasting of industrial structure evolution and CO2 emissions in Liaoning Province. J. Clean. Prod. 2021, 285, 124870. [Google Scholar] [CrossRef]
  25. Dong, J.; Li, C.; Wang, Q. Decomposition of carbon emission and its decoupling analysis and prediction with economic development: A case study of industrial sectors in Henan Province. J. Clean. Prod. 2021, 321, 129019. [Google Scholar] [CrossRef]
  26. Li, L.; Yang, J. A new method of energy-related carbon dioxide emissions estimation at the provincial-level: A case study of Shandong Province, China. Sci. Total Environ. 2020, 700, 134384. [Google Scholar] [CrossRef]
  27. Li, D.; Huang, G.; Zhu, S.; Chen, L.; Wang, J. How to peak carbon emissions of provincial construction industry? Scenario analysis of Jiangsu Province. Renew. Sust. Energ. Rev. 2021, 144, 110953. [Google Scholar] [CrossRef]
  28. Shahbaz, M.; Loganathan, N.; Muzaffar, A.T.; Ahmed, K.; Jabran, M.A. How urbanization affects CO2 emissions in Malaysia? The application of STIRPAT model. Renew. Sust. Energ. Rev. 2016, 57, 83–93. [Google Scholar] [CrossRef]
  29. Lin, S.; Wang, S.; Marinova, D.; Zhao, D.; Hong, J. Impacts of urbanization and real economic development on CO2 emissions in non-high income countries: Empirical research based on the extended STIRPAT model. J. Clean. Prod. 2017, 166, 952–966. [Google Scholar] [CrossRef]
  30. Niu, D.; Wang, K.; Wu, J.; Sun, L.; Liang, Y.; Xu, X. Can China achieve its 2030 carbon emissions commitment? Scenario analysis based on an improved general regression neural network. J. Clean. Prod. 2020, 243, 118558. [Google Scholar] [CrossRef]
  31. Yang, J.; Cai, W.; Ma, M.; Li, L.; Liu, C.; Ma, X.; Li, L.; Chen, X. Driving forces of China’s CO2 emissions from energy consumption based on Kaya-LMDI methods. Sci. Total Environ. 2020, 711, 134569. [Google Scholar] [CrossRef] [PubMed]
  32. Alajmi, R.G. Factors that impact greenhouse gas emissions in Saudi Arabia: Decomposition analysis using LMDI. Energy Pol. 2021, 156, 112454. [Google Scholar] [CrossRef]
  33. Li, F.; Xu, Z.; Ma, H. Can China achieve its CO2 emissions peak by 2030? Ecol. Indic. 2018, 84, 337–344. [Google Scholar] [CrossRef]
  34. Ye, L.; Yang, D.; Dang, Y.; Wang, J. An enhanced multivariable dynamic time-delay discrete grey forecasting model for predicting China’s carbon emissions. Energy 2022, 249, 123681. [Google Scholar] [CrossRef]
  35. Li, L.; Deng, X.; Zhao, J.; Zhao, F.; Sutherland, J.W. Multi-objective optimization of tool path considering efficiency, energy-saving and carbon-emission for free-form surface milling. J. Clean. Prod. 2018, 172, 3311–3322. [Google Scholar] [CrossRef]
  36. Jiang, M.; An, H.; Gao, X. Adjusting the global industrial structure for minimizing global carbon emissions: A network-based multi-objective optimization approach. Sci. Total Environ. 2022, 829, 154653. [Google Scholar] [CrossRef]
  37. Wang, P.; Wu, W.; Zhu, B.; Wei, Y. Examining the impact factors of energy-related CO2 emissions using the STIRPAT model in Guangdong Province, China. Appl. Energy 2013, 106, 65–71. [Google Scholar] [CrossRef]
  38. Yang, S.; Cao, D.; Lo, K. Analyzing and optimizing the impact of economic restructuring on Shanghai’s carbon emissions using STIRPAT and NSGA-II. Sustain. Cities Soc. 2018, 40, 44–53. [Google Scholar] [CrossRef]
  39. Chai, J.; Liang, T.; Lai, K.; Zhang, Z.; Wang, S. The future natural gas consumption in China: Based on the LMDI-STIRPAT-PLSR framework and scenario analysis. Energy Pol. 2018, 119, 215–225. [Google Scholar] [CrossRef]
  40. Su, K.; Lee, C. When will China achieve its carbon emission peak? A scenario analysis based on optimal control and the STIRPAT model. Ecol. Indic. 2020, 112, 106138. [Google Scholar] [CrossRef]
  41. Wen, L.; Li, Z. Provincial-level industrial CO2 emission drivers and emission reduction strategies in China: Combining two-layer LMDI method with spectral clustering. Sci. Total Environ. 2020, 700, 134374. [Google Scholar] [CrossRef]
  42. Chen, H.; Qi, S.; Tan, X. Decomposition and prediction of China’s carbon emission intensity towards carbon neutrality: From perspectives of national, regional and sectoral level. Sci. Total Environ. 2022, 825, 153839. [Google Scholar] [CrossRef]
  43. Shan, Y.; Guan, D.; Zheng, H.; Ou, J.; Li, Y.; Meng, J.; Mi, Z.; Liu, Z.; Zhang, Q. China CO2 emission accounts 1997–2015. Sci. Data 2018, 5, 170201. [Google Scholar] [CrossRef]
  44. Ang, B.W. LMDI decomposition approach: A guide for implementation. Energy Pol. 2015, 86, 233–238. [Google Scholar] [CrossRef]
  45. Kaltenegger, O. What drives total real unit energy costs globally? A novel LMDI decomposition approach. Appl. Energy 2020, 261, 114340. [Google Scholar] [CrossRef]
  46. Mohammad, M.H.; Wu, C. Estimating energy-related CO2 emission growth in Bangladesh: The LMDI decomposition method approach. Energy Strateg. Rev. 2020, 32, 100565. [Google Scholar]
  47. Quan, C.; Cheng, X.; Yu, S.; Ye, X. Analysis on the influencing factors of carbon emission in China’s logistics industry based on LMDI method. Sci. Total Environ. 2020, 734, 138473. [Google Scholar] [CrossRef]
  48. York, R.; Rosa, E.; Dietz, T. STIRPAT, IPAT and ImPACT: Analytic tools for unpacking the driving forces of environmental impacts. Ecol. Econ. 2003, 46, 351–365. [Google Scholar] [CrossRef]
  49. Wang, Y.; Zhang, C.; Lu, A.; Li, L.; He, Y.; Tojo, J.; Zhu, X. A disaggregated analysis of the environmental kuznets curve for industrial CO2 emissions in China. Appl. Energy 2017, 190, 172–180. [Google Scholar] [CrossRef]
  50. Behera, S.; Dash, D. The effect of urbanization, energy consumption, and foreign direct investment on the carbon dioxide emission in the sea (south and southeast asian) region. Renew. Sustain. Energy Rev. 2017, 70, 96–106. [Google Scholar] [CrossRef]
  51. Zhang, C.; Su, B.; Zhou, K.; Yang, S. Decomposition analysis of China’s CO2 emissions (2000–2016) and scenario analysis of its carbon intensity targets in 2020 and 2030. Sci. Total Environ. 2019, 668, 432–442. [Google Scholar] [CrossRef] [PubMed]
  52. Li, B.; Han, S.; Wang, Y.; Wang, Y.; Li, J.; Wang, Y. Feasibility assessment of the carbon emissions peak in China’s construction industry: Factor decomposition and peak forecast. Sci. Total Environ. 2020, 706, 135716. [Google Scholar] [CrossRef] [PubMed]
  53. Wu, R.; Wang, J.; Wang, S.; Feng, K. The drivers of declining co2 emissions trends in developed nations using an extended stirpat model: A historical and prospective analysis. Renew. Sustain. Energy Rev. 2021, 149, 111328. [Google Scholar] [CrossRef]
  54. Hao, J.; Gao, F.; Fang, X.; Nong, X.; Zhang, Y.; Hong, F. Multi-factor decomposition and multi-scenario prediction decoupling analysis of china’s carbon emission under dual carbon goal. Sci. Total Environ. 2022, 841, 156788. [Google Scholar] [CrossRef]
  55. Elzen, M.; Fekete, H.; Höhne, N.; Admiraal, A.; Forsell, N.; Hof, A.F.; Olivier, J.G.J.; Roelfsema, M.; Soest, H. Greenhouse gas emissions from current and enhanced policies of China until 2030: Can emissions peak before 2030? Energy Pol. 2016, 89, 224–236. [Google Scholar] [CrossRef]
  56. Qi, Y.; Stern, N.; He, J.K.; Lu, J.Q.; Liu, T.L.; King, D.; Wu, T. The policy-driven peak and reduction of China’s carbon emissions. Adv. Clim. Chang. Res. 2020, 11, 65–71. [Google Scholar] [CrossRef]
  57. Chen, Y.; Guo, F.; Wang, J.; Cai, W.; Wang, C.; Wang, K. Provincial and gridded population projection for China under shared socioeconomic pathways from 2010 to 2100. Sci. Data 2020, 7, 83. [Google Scholar] [CrossRef]
  58. Xu, H.; Pan, X.; Guo, S.; Lu, Y. Forecasting Chinese CO2 emission using a non-linear multi-agent intertemporal optimization model and scenario analysis. Energy 2021, 228, 120514. [Google Scholar] [CrossRef]
  59. Zhao, L.; Zhao, T.; Yuan, R. Scenario simulations for the peak of provincial household CO2 emissions in China based on the STIRPAT model. Sci. Total Environ. 2022, 809, 151098. [Google Scholar] [CrossRef]
Figure 1. Decomposition of the effects of various factors on Jiangsu’s carbon emissions from 2000 to 2019.
Sustainability 15 06718 g001
Figure 2. The ridge trace map of the R2 value and k value.
Sustainability 15 06718 g002
Figure 3. The carbon emission prediction results under different scenarios.
Sustainability 15 06718 g003
Table 1. A summary of studies on analyzing the influencing factors of carbon emissions.
AuthorInfluencing Factors of Carbon Emissions
Wang et al. (2017) [49]Urban population, GDP per capita, the share of the industry and service sectors in GDP, energy intensity
Behera and Dash (2017) [50]Urbanization, energy consumption, foreign direct investment
Liu and Xiao (2018) [11]Population, GDP per capita, energy structure, energy intensity, total fixed-asset investment, industrial structure
Zhang et al. (2019) [51]Population, economic growth, energy structure, energy intensity, industrial structure
Li et al. (2020) [52]Construction industry labor population, GDP, energy consumption intensity, carbon intensity of energy consumption
Wu et al. (2021) [53]Population, GDP per capita, fossil energy intensity, renewable energy consumption share, fossil fuel CO2 intensity, industrial structure
Hao et al. (2022) [54]Carbon emission factor, income per capita, level of urbanization, living scale effect, industry structure, energy price, thermal power output effect, energy structure, energy intensity, thermal power generation ratio, residential energy consumption
Table 2. Descriptive statistics showing the factors influencing carbon emissions in Jiangsu.
VariableSymbolMean ValueStandard DeviationExplanationUnit
Carbon emissionsI527.42208.50Carbon dioxide emissionsmetric tons (Mt)
Population sizeP77.402.57Annual population at the provincial levelmillion people
Economic outputGP5.593.67GDP per capitaten-thousand RMB/people
Energy structureCE0.020.00Ratio of carbon emissions to the total energy consumption%
Energy intensityEG0.660.23The amount of energy consumed per unit of the GDPtce/ten-thousand RMB
Table 3. The development rate of each influencing factor from 2020 to 2050 (%).
Influencing FactorsDevelopment Rate20202021–20302031–20402041–2050
Population sizeLow0.280.250.200.15
Medium0.300.270.220.17
High0.330.300.250.20
Economic outputLow7.005.903.901.90
Medium8.006.904.902.90
High9.007.905.903.90
Energy intensityLow−7.00−8.10−10.10−12.10
Medium−6.00−7.10−9.10−11.10
High−5.00−6.10−8.10−10.10
Energy structureLow0.900.790.590.39
Medium1.000.890.690.49
High1.100.990.790.59
Table 4. Scenario settings.
ScenarioSymbolEnergy StructureEnergy IntensityEconomic OutputPopulation Size
Scenario 1S1LSDLowLowLowLow
Scenario 2S2MSDMediumMediumMediumMedium
Scenario 3S3HSDHighHighHighHigh
Scenario 4S4LCDLowLowMediumMedium
Scenario 5S5LPGMediumMediumMediumLow
Scenario 6S6HEGMediumMediumMediumHigh
Scenario 7S7LCHLowLowHighMedium
Scenario 8S8LPHMediumMediumHighLow
Table 5. Decomposition of the annual change value and cumulative change value of factors influencing carbon emissions in Jiangsu from 2000 to 2019.
PeriodsPopulation Size EffectEconomic Output EffectEnergy Structure EffectEnergy Intensity EffectCarbon Emissions Added Value
2000–2001−2.1922.29−13.81−14.08−7.80
2001–20021.4220.9712.31−6.2028.50
2002–20030.0037.54−2.37−4.4730.70
2003–20041.0251.401.826.5660.80
2004–20051.9868.073.8210.6384.50
2005–20064.1765.891.48−26.7444.80
2006–20074.4979.18−15.60−40.2727.80
2007–20083.2880.97−0.80−55.5427.90
2008–20093.1550.65−13.55−21.2519.00
2009–201010.1190.7018.99−55.0964.70
2010–20112.31100.8911.73−61.9353.00
2011–20121.7160.17−5.91−33.0722.90
2012–20131.6266.0029.84−59.3638.10
2013–20141.8557.96−5.38−44.2310.20
2014–20151.4752.9742.59−42.0355.00
2015–20162.1471.05−55.65−53.04−35.51
2016–20172.7373.203.23−66.8212.34
2017–20182.0554.5126.94−55.7827.72
2018–20191.8555.5818.77−35.6540.55
2000–201945.161159.9758.45−658.38605.20
Table 6. The results of the unit root test. (D denotes the first-order difference and DD denotes the second-order difference).
VariableADF Value1% Critical Value5% Critical Value10% Critical Valuep ValueStationarity
lnI−0.52−4.38−3.60−3.240.98nonstationary
lnP0.70−4.38−3.60−3.241.00nonstationary
lnGP−1.87−4.38−3.60−3.240.67nonstationary
lnCE−3.62−4.38−3.60−3.240.03stationary
lnEG−1.67−4.38−3.60−3.240.77nonstationary
DlnI−4.56−4.38−3.60−3.240.00stationary
DlnP−3.01−4.38−3.60−3.240.13nonstationary
DlnGP−4.92−4.38−3.60−3.240.00stationary
DlnCE−7.10−4.38−3.60−3.240.00stationary
DlnEG−2.72−4.38−3.60−3.240.23nonstationary
DDlnI−5.41−4.38−3.60−3.240.00stationary
DDlnP−5.03−4.38−3.60−3.240.00stationary
DDlnGP−7.79−4.38−3.60−3.240.00stationary
DDlnCE−9.68−4.38−3.60−3.240.00stationary
DDlnEG−4.52−4.38−3.60−3.240.00stationary
Table 7. The results of the multicollinearity test.
VariableCoefficientStandard Errorp ValueVIF
lnP1.000.000.0032.15
lnGP1.000.000.0034.74
lnCE1.000.000.001.84
lnEG1.000.000.0015.89
c−4.600.020.00/
Table 8. The ridge regression estimation results of the Jiangsu carbon emission prediction model.
VariableCoefficientStandard Errort Valuep Value
lnP3.760.143.800.00
lnGP0.770.1418.710.00
lnCE0.720.052.360.02
lnEG0.760.1210.230.00
c−28.83///
R20.96
F Value771.48
Table 9. The estimated values, actual values, and error rate of carbon emissions. (Error rate = (Estimated value − Actual value) ÷ Actual value × 100%).
YearActual ValueEstimated ValueError Rate (%)
2000199.40215.418.03
2001191.60202.975.93
2002220.10229.954.47
2003250.80254.571.50
2004311.60304.17−2.38
2005396.10372.00−6.08
2006440.90416.58−5.52
2007468.70451.16−3.74
2008496.60482.15−2.91
2009515.60506.68−1.73
2010580.30586.171.01
2011633.30634.390.17
2012656.20657.980.27
2013694.30691.27−0.44
2014704.50705.480.14
2015759.50750.24−1.22
2016724.00732.921.23
2017736.30751.542.07
2018764.00778.781.93
2019804.60815.611.37
Disclaimer/Publisher’s Note: The statements, opinions and data contained in all publications are solely those of the individual author(s) and contributor(s) and not of MDPI and/or the editor(s). MDPI and/or the editor(s) disclaim responsibility for any injury to people or property resulting from any ideas, methods, instructions or products referred to in the content.