Article

Optimization of A Procedure to Improve the Extraction Rate of Biologically Active Compounds in Red Grape Must Using High-Power Ultrasound

1
Faculty of Food and Tourism, Transilvania University of Brasov, Castelului 148, 500014 Brasov, Romania
2
Faculty of Food Engineering, University of Life Sciences “King Mihai I” from Timisoara, Calea Aradului 119, 300645 Timisoara, Romania
*
Authors to whom correspondence should be addressed.
Sustainability 2023, 15(8), 6697; https://doi.org/10.3390/su15086697
Submission received: 11 February 2023 / Revised: 7 April 2023 / Accepted: 13 April 2023 / Published: 15 April 2023

Abstract

:
The primary focus in the production of quality red wine is the extraction of grape components, which can be achieved in a variety of ways. This work investigates the extraction yield of biologically active compounds from crushed Merlot grapes, as a result of ultrasound treatment applied before maceration, and optimizes the process parameters of a laboratory scale using response surface methodology (RSM) within a central composite design (CCD) model. The two factors whose response was studied were amplitude (A) % and treatment time (t), while the dependent variables were the total phenolic compounds (TPC), monomeric anthocyanins (MA), and antioxidant activity expressed as ferric reducing antioxidant power (FRAP) and 2,2-diphenyl-1-picrylhydrazyl (DPPH) free radical scavenging activity. The results showed that the application of high-power ultrasound treatment to crushed grapes for a few minutes increased both the extraction rate of bioactive compounds and the antioxidant activity by a maximum of 12 times for the TPC, 14 times for the MA, 3.6 times for the FRAP value, and 18.77% for the DPPH. The optimized solution had an amplitude of 90% and a treatment time of 4 min and 24 s. The validation experiments yielded errors between—8.70% and 3.14%, confirming the proposed model. Thus, the RSM model is recommended as a tool to optimize a procedure for enhancing both the extraction rate of the bioactive compounds from grapes and the antioxidant properties of grape must. Our results demonstrate the ultimate benefits of using ultrasonic treatment on crushed grapes at the beginning of the winemaking process, as a highly effective technique for improving the extraction of high-value bioactive chemicals, with significant application potential.

1. Introduction

Wine is a cultural emblem, whose function has evolved over time from being a vital source of sustenance to becoming a social and cultural accompaniment to food. The production of wine grapes of 33.8 million tons and the volume of wine produced globally in 2022, which was between 257.5 and 262.3 million hectoliters of wine, with a midpoint estimate of 259.9 million hectoliters, is anticipated to be comparable to the level seen in 2021. The worldwide output level can be regarded as somewhat below average for the fourth year in a row [1].
To satisfy the varied sensory preferences of consumers, it is essential to be able to manufacture several red wine types, and wine producers are continually changing their winemaking techniques to this end. When making high-quality red wine, the extraction of grape components, which can be conducted in a variety of ways, is the major focus [2].
Due to their numerous positive health benefits, including antioxidant properties, neuroprotective action, anti-inflammation, antiaging antimicrobial activity, and lowering arterial blood pressure, phenolic compounds have attracted a lot of interest by the scientific community and the general public in recent years [3,4,5,6,7].
Moreover, customers place a high value on the sensory quality of red wine’s color, preferring it to be a deep red. The primary pigments responsible for the young wines’ vivid red color are called anthocyanins, the main polyphenolics in red grapes [8]. The initial monomeric anthocyanin profile is an element that affects the ultimate color of the wine and, additionally, might have anti-cancer and anti-glycemic properties [9].
Because of the inherent drawbacks to conventional extraction techniques, the effective extraction of these chemicals from natural sources continues to be a significant issue. The rising need for novel technical solutions that can deliver the highest extraction yields, guarantee the stability of the target compounds, and also satisfy environmental requirements, has been sparked by the growing interest in natural antioxidants [10].
Due to its eco-friendly nature, non-toxic behavior, and low energy usage, ultrasound (US) may be regarded as a sustainable, green, and innovative technology [11,12]. There are several uses for it in food technology, including analysis, preservation, and homogenization, extraction, filtering, and drying. In order to achieve these objectives, ultrasound principally employs acoustic waves, which cause mechanical and chemical reactions. These reactions are fundamentally different from those produced by conventional methods. The main goals of this technology are to speed up processing, save energy, and improve the quality, safety, and shelf life of food products [12,13]. To sum up, this technique is a green alternative for this industry, as it does not use toxic solvents. Additionally, it supports economic sustainability through its use in efficient extraction procedures [14].
Ultrasound is divided into three categories: high frequency–low power US (between 1 and 10 MHz), intermediate frequency–medium power US (between 100 kHz and 1 MHz), and low frequency–high power US (between 20 and 100 kHz). Strong physical effects are primarily produced at a US frequency of about 20 kHz by fragmentary transitory cavitation, promoting bioactive chemical release from plant matrices during cell disruption [15,16,17]. The effect of low frequency may be related, not only to cavitation bubble size, but also to its effect on mass transfer resistance [13]. High-power US treatment on food matrices can cause physical, chemical, and biological changes, and a variety of uses have been documented [18,19]. Numerous studies have demonstrated that high-power ultrasound is becoming more prevalent in the enological sector due to its ability to enhance a wine’s organoleptic qualities, shorten processing times, and provide better microbial control in wines [20,21,22]. Furthermore, the International Organization of Vine and Wine has included ultrasonic treatment among the methods that can be used during winemaking [23].
Currently, adopting all the techniques designed to make color extraction and fragrance dissolution easier, throughout the winemaking process, is desired. Through the application of ultrasonic technology, the potential for the continuous extraction of qualitatively significant substances from the exocarp is explored. This is conducted by taking advantage of the phenomena caused by the transmission of ultrasound in a solid–liquid environment, such as grape must [13].
However, taking into account the fact that most research was carried out at the laboratory scale, and that the grape skins’ total phenolic content varies according to the cultivar, soil type, climate, region of origin, and cultivation techniques, we consider that it is vital to optimize the factors involved in this form of extraction in order to build a workable ultrasound-assisted large-scale procedure. The extraction efficiency using high-power US is significantly influenced by a variety of factors, such as the temperature of the samples, the power of the ultrasonic device, the process frequency, the treatment’s intensity, as well as the shape and size of the ultrasonic reactor [24].
Thanks to its reliable design, the statistical method known as response surface methodology (RSM) is currently widely utilized for optimization. The RSM is a collection of mathematical and statistical methods that are used to investigate the relationship between process input variables and outputs (responses). The methodology can be used for process optimization in a variety of circumstances and is relatively affordable, practical, and effective [25].
The objective of this work was to investigate the extraction yield of biologically active compounds from crushed grapes, as a result of an ultrasonic treatment applied during the first stages of the winemaking process, before maceration. In addition, the aim was to identify the optimized process parameters in terms of amplitude (A) % and treatment time (t) at the laboratory scale, as well as to develop a procedure that improves both the extraction rate of bioactive compounds from grapes and the antioxidant properties of grape must. To this end, we first evaluated the high-value phytochemicals, such as the total phenolic compounds (TPC), which are generally associated with the organoleptic properties of finished wines and (with) their stability. We also quantified the monomeric anthocyanins (MA), which are responsible for the red color of red wines. In addition, the antioxidant activity was assessed, from all the possible biological functions performed by V. vinifera compounds, both the ferric reducing antioxidant power (FRAP) and the 2,2-diphenyl-1-picrylhydrazyl (DPPH) free radical scavenging activity assays are probably the most important regarding human health.

2. Materials and Methods

2.1. Grapes

The Merlot variety employed for the experimental research is the second most planted grape variety in the world, well-known for producing high-quality wines [26]. The red grapes, vintage 2019, were hand-harvested (approximately 100 kg) from a vineyard in Prahova, Romania (Pietroasa-Istrita Viticulture and Winemaking Research and Development Station). The grapes were harvested at technological maturation when they reached 29.8° Brix, then quickly transported to the laboratory for processing. Only healthy, selected bunches of grapes were used for the experimental research.

2.2. Ultrasonic Equipment

The sonication of all the experimental tests was performed using a probe-type ultrasonic device (Sonics VCX-750, Sonics and Materials Inc., Newtown, CT, USA). The amplitude can be set as a percentage, between 10% and 100%. The device produces an ultrasonic power of 750 W and frequency of 20 kHz. The most typical frequencies utilized in the extraction procedures were between 20 and 100 kHz.

2.3. Optimization Design

The experimental design was developed with Design Expert® software version 13 (Stat-Ease, Inc., Minneapolis, MN, USA, 2022), to optimize the number of experiments and operating conditions.
Based on the results of the single factor experiment, an optimization design was created. For these experiments, the RSM was used within a central composite design (CCD) model. The two factors whose response was studied were amplitude (A) % and treatment time (t). The high and low levels of each variable were determined by preliminary research that took place before carrying out of these experiments. The limits of the instrument were also taken into account when choosing the ranges for all the variables. The intensity and frequency of the waves were two of the most important operating parameters that affect the performance of ultrasound technology in extracting bioactive chemicals. The results of some studies indicated that the sonochemical effects in the treated fluids increase as the amplitude increases. Moreover, the amplitude varies over a wide range, from 20% to 90% [27], to determine the ideal extraction configuration, while other studies used treatment durations ranging from 2 to 10 min [28,29].
Furthermore, according to our preliminary research, there were no significant differences in the extraction of biologically active compounds between the control sample and the ultrasound-treated samples, when ultrasound was applied at low amplitude levels (from 30% to 50%) for a maximum treatment time of 5 min. The extraction temperature during ultrasound extraction was shown to be closely related to the extraction time, as it was found that longer extraction times resulted in higher extraction temperatures. Therefore, the extraction time selected should be within the appropriate range. However, it was found that a maximum extraction time of 5 min was necessary because high temperatures promote the oxidation and destruction of phenolic compounds.
Taking into account the aforementioned factors, the levels of the independent variables, such as percent amplitude (A) and sonication time (t), were selected at 50%, 70%, and 90% for the ultrasound time of 3, 4, and 5 min (Table 1), respectively. The dependent variables were the TPC, MA, and antioxidant activity, expressed as the FRAP and DPPH free radical scavenging activity.
To choose the best statistical model, such as linear, quadratic, and cubic models, the experimental data were examined based on the second-degree polynomial equation (Equation (1)):
Y k = α 0 + i = 1 n α i X I + i = 1 n I X i + i < j n α i j X i X j
where Yk is the dependent variable, α0, αi, αii, and αij are the regression coefficients of the model, which are constants, and Xi and Xj are the independent variables of the model. Response surface plots were generated using the expected values from the fitted model. To illustrate the influence of the independent variables on each response, two- and three-dimensional contour plots were generated for each response.

2.4. Sample Preparation

For the laboratory tests, randomly collected grape samples (100 g) were destemmed, hand-crushed, and then treated using a probe-type ultrasonic device. The control sample (C) that was not subjected to ultrasound treatment was evaluated separately. The samples were treated in a 100 mL Pyrex glass beaker fitted with a counter-current water-cooling jacket. The water used for cooling was kept at a constant temperature of 19 °C. The positioning of the acoustic amplifier in the container was standardized at a distance of 20 mm from the bottom. At the end of the ultrasonic treatment, the samples were vacuum filtered (Nalgene Rapid-Flow Filter Units, 0.45 µm PES membrane). The filtrate was collected in a vial and stored in a refrigerator at 4 °C for further use. All extraction experiments were conducted in this manner.

2.5. Total Polyphenolic Content and Anthocyanins Determination

The total polyphenolic content (TPC) was determined by using the Folin–Ciocalteu spectrophotometric method, with gallic acid as a reference and expressed as micrograms of gallic acid equivalents per milliliter (µg GAE/mL) [30]. A 0.5 mL sample was treated with 1.25 mL of Folin–Ciocalteu reagent (Merck, Darmstadt, Germany), previously diluted 1:10 (v/v) with distilled water. After incubation for 5 min at room temperature, 1 mL Na2CO3 60 g/L was added. A UV–VIS spectrophotometer (Specord 205, Analytik Jena Inc., Jena, Germany) was used to detect sample absorbance at 750 nm after 30 min of incubation at 50 °C. The calibration curve was established using gallic acid as standard, at concentrations ranging from 5 to 250 µg GAE/mL.
The monomeric anthocyanins (MA) were determined by the pH differential method [31]. Briefly, two dilutions of the same sample were prepared by adding 1 mL of wine to 14 mL of potassium chloride buffer (0.025 M, pH 1.0) and 14 mL of sodium acetate buffer (0.4 M, pH 4.5). After incubation for 15 min at room temperature, the absorbance was measured at 520 and 700 nm against deionized water. The results were expressed in milligrams of cyanidin-3-glucoside equivalents per liter (mg CGE/L). The total anthocyanin content of the samples was calculated using a molar absorption coefficient of 26,900 L/mol × cm and a molecular weight of 449.2 g/mol.

2.6. Antioxidant Activity

The antioxidant activity of the investigated samples was evaluated by FRAP and DPPH assays.

2.6.1. FRAP Assay

The protocol for the FRAP test was based on the method of Benzie and Strain [32]. For this purpose, 300 mM acetate buffer (pH = 3.6), 10 mM of 2,4,6-tris(2-pyridyl)-s-triazine (TPTZ) solution in 40 mM HCl, and 20 mM FeCl3 × 6H2O solution were used as stock solutions. The working solution was prepared by mixing 100 mL acetate buffer, 10 mL TPTZ solution, and 10 mL FeCl3 × 6H2O solution, which was then heated to 37 °C before use. Prior to analysis, the wine samples were diluted 1:50 (v/v) with distilled water, then a 0.5 mL aliquot of diluted samples was allowed to react with 2.5 mL of working solution for 30 min at 37 °C. The absorbance of the mixture was read at 593 nm against a blank sample obtained under the same working conditions. The results were expressed in µmol of Fe2+ equivalents per milliliter of grape must (µmol Fe2+/mL).

2.6.2. DPPH Assay

The 2,2-diphenyl-1-picrylhydrazyl (DPPH) free radical scavenging activity of the samples was measured following the procedure described by Kalita et al. [33], with some minor adjustments. For this purpose, 20 µL of each investigated sample was mixed in a microplate with 20 µL of distilled water, after which the resulting mixture was combined with 200 µL of a 120 mg/L DPPH radical solution prepared in 96% (v/v) ethanol. The microplate was left in the dark for 30 min, and the absorbance value (A sample) at 515 nm was measured against a blank of 96% (v/v) ethanol, using a plate reader (Tecan SunRiseTM, software MagellanTM, Tecan Group Ltd., Männedorf, Switzerland). The control was prepared under the same working conditions, containing 20 µL of 96% (v/v) ethanol instead of the investigated sample. The absorbance of the control (A control) was read against 96% (v/v) ethanol.
The DPPH scavenging activity (%) was calculated according to Equation (2), as follows:
DPPH scavenging activity (%) = [(A control − A sample)/A control] × 100

2.7. Total Soluble Content and Acidity

The total soluble solids (TSS, ° Brix) and the titratable acidity (TA, g/L of tartaric acid) were analyzed according to the standard procedure of Council Regulation EEC 2676/90 [34].

2.8. Statistical Analysis

All the measurements were performed in triplicate and the results are presented as mean ± standard deviation (SD). The Design Expert® software version 13 (Stat-Ease, Inc., Minneapolis, USA, 2022) was used for the statistical analysis. Significant differences between the samples were assessed using a one-way ANOVA, with post-hoc analysis using the HSD Tukey test.
The Pearson correlation coefficient between the total phenolic content, monomeric anthocyanins, and antioxidant activity was calculated using JASP software, version 0.17.1 (JASP Team, Amsterdam, The Netherlands, 2023).

3. Results and Discussion

The effects of an ultrasonic pre-treatment to improve the extraction rate of polyphenols and, subsequently, to increase the antioxidant activity of several samples, with three replicates each, all from red grapes, the Merlot variety, vintage 2019, were followed in the laboratory. The experimental design provided for the randomized treatment of 13 samples with 3 repetitions each, with 5 central points, as shown in Table 2.
In terms of the content of bioactive compounds, such as the TPC and MA, as well as the antioxidant activity measured by the FRAP and DDPH assays, the effects of the high-power ultrasonic treatment on extraction kinetics were explored. All the above parameters were studied in untreated red grapes must as a control sample (C) and on the samples subjected to ultrasound treatment at 50, 70, and 90% amplitude for 3, 4, and 5 min, respectively, as follows: SM50/3 (A: 50%, t: 3 min), SM50/4 (A: 50%; t: 4 min), SM50/5 (A: 50%; t: 5 min), SM70/3 (A: 70%; t: 3 min), SM70/4 (A: 70%; t: 4 min), SM70/5 (A: 70%; t: 5 min), SM90/3 (A: 90%; t: 3 min), SM90/4 (A: 90%; t: 4 min), and SM90/5 (A: 90%, t: 5 min).
Analytical determinations were performed immediately after crushing for the control sample and immediately after treatment for the ultrasound-treated samples.
Two factors, the amplitude level and the duration of the ultrasound treatment, were found to have an effect on the parameters studied, with single or interaction effects. The ANOVA analysis of variance performed on the analytical parameters, in relation to the different conditions of amplitude and treatment time, revealed significant differences in the total polyphenolic content, the monomeric anthocyanins, and the antioxidant activity. Using the RSM and ANOVA, the best extraction parameters were statistically examined.
The process of sonication results in the development of cavitation bubbles, which have the potential to violently collapse, releasing energy and increasing the temperature and pressure. These bubbles may burst close to a solid surface or interact chemically with molecules, harming cell structures and altering the selectivity or permeability of cell membranes [20].
To monitor the corresponding temperature rise, the temperature of the sonicated samples was measured at 1 min intervals, using a thermovision camera. The mean value of the untreated sample (C), and the mean values recorded by a forward-looking infrared (FLIR) camera for each sample when the sonication treatment ended are illustrated in Figure 1.
An increase in the temperature of the samples following the ultrasound treatment was evident, compared to the reference sample, C (20 °C), correlated with the intensity and time of the treatment. The minimum and maximum average temperatures reached in the samples were 26.20 °C for SM50/3 and 60.17 °C for SM90/5, respectively. The results confirmed the fact that the increasing temperature of the must samples depends on the operating parameters used during the ultrasound treatments, as it was established that the device’s real input power was transformed into heat that was released into the medium [26].
It can be observed that the increasing temperature in the sonicated samples was influenced to a higher measure by increasing the amplitude compared with the treatment time. Thereby, the temperature reached in SM70/5 (54.23 °C), treated with a lower amplitude but the maximum time (5 min), was close to that of SM90/3 (51.53 °C) treated with a higher amplitude but the minimum time (3 min).
Increased temperature often results in higher extraction yields. Temperature optimization can be performed to obtain the best yield of the target compounds without degradation, as this parameter can vary depending on the type of product [35].
It was also concluded that the intensity of the ultrasound was directly related to the amplitude of the transducer. Increasing the amplitude increased the ultrasound intensity and resulted in an increase in the sonochemical effects [36].
Using different levels of device power, intensity, frequency, amplitude, and treatment time, previous research on red grapes and wines of various types has yielded very encouraging findings on the ability of ultrasound to extract and improve the physicochemical quality of wines, as well as its ability to accelerate wine aging or control microorganisms [37,38,39,40,41].
In addition, other authors reported that the application of US produced interesting findings on the recovery of bioactive compounds from marc and lees, and the extraction of various aromatic compounds from wines [42,43,44].
Table 3 depicts the results for the physicochemical and analytical determinations of the untreated red grape must.

3.1. Total Polyphenolic Content

The TPC extraction yields were observed to rise with any increase in temperature. This impact might primarily be ascribed to the cavitation phenomenon, which is preferred at lower temperatures, and which makes it easier to release extractable chemicals and enhances mass movement via diffusion or by rupturing plant cell walls [23,32,45].
The TPC for sonicated samples varied from 124.5 micrograms of gallic acid equivalents per milliliter (GAE/mL) to 1396.06 µg GAE/mL, as shown in Table 2. The lowest amount of TPC was found in the SM50/3 sample (run order three) using 50% amplitude for 3 min, while the higher TPC content was found for the SM90/3 sample (run order one) using 90% amplitude for 3 min. It can be seen that there was an increase, generally proportional with the treatment conditions, of 9% to 12 times for the total polyphenol content of the sonicated samples compared with untreated sample (C). These findings indicate that amplitude is a significant factor in the extraction of total phenols.
Previous studies have shown a higher extraction yield of TPC when high-power ultrasound was applied to grapes or during winemaking [27,46]. Other authors have reported that no degradation of the polyphenols was observed after the sonication of red wine [29].
Moreover, the ultrasound treatment with an amplitude of 90% for 3 min determined the highest extraction of TPC in the sample SM90/3, while lower values were recorded when applied at the same amplitude of 90% for 4 min and 5 min, by 15.63% in the sample SM90/4 and 16.04% in the sample SM90/5, respectively. The possible explanation for this decrease might be the high temperatures reached in the immediate vicinity of the ultrasonic probe, as well as the average temperatures of 55.71 °C and 60.17 °C reached in samples SM90/4 and SM90/5, respectively, that could lead to the degradation of phenolic compounds. Other research has shown that polyphenol can be protected against thermal breakdown processes at temperatures as high as 50 degrees Celsius [47].
Despite their benefits, many phenolic compounds quickly hydrolyze and oxidize at higher temperatures, particularly when extracted for extended periods of time [48,49]. At extraction temperatures over 60 °C, Akowuah, Mariam, and Chin demonstrated that the total polyphenol content of the extracts reduced as a result of oxidative degradation [50]. The vulnerability of phenolic compounds to high temperatures was demonstrated, as early as three decades ago, by Havlikova and Mikova [51]. They demonstrated that high temperatures and prolonged extraction times enhanced the rate at which phenolic components oxidized and lowered the yield of the extracts. For instance, during maceration, the extraction of polyphenols is typically carried out between 20 and 50 °C, never over this range [52].
Furthermore, it is important to remember that the sensitivity of a sample to temperature-induced polyphenol degradation is influenced by the types of polyphenolic compounds present in the plant extract or matrix, as well as their physicochemical and biochemical properties [47].
However, additional variables such as plant species, geographical origin, or cultivars may also have an impact on the quantity of phenolic chemicals recovered using an ultrasound-assisted approach [10].
The optimal extraction parameters for the TPC were statistically investigated using the RSM and ANOVA (Table 4).
As Table 4 shows, the amplitude term is significant for the enhanced extraction of polyphenols. The model F-value of 13.40 means that the model is significant. Due to the noise, there is only a 0.18% chance that such a large F-value could occur. Moreover, p-values less than 0.0500 indicate that the model terms are significant. In this case, amplitude is a significant model term. Values greater than 0.1000 indicate that the model terms are not significant. A high R2 value (0.9054) indicates a good level of model fit. The lack of fit F-value of 36,229.38 indicates that the lack of fit is significant. There is only a 0.01% chance that such a large lack of fit F-value could occur due to noise.
The final equation in terms of the actual factors for the TPC is shown in Equation (3). The equation can be used to make predictions about the response for given levels of each factor.
YTPC = −5385.266 + 108.970 × A + 686.076 × B − 3.097 × A × B − 0.491 × A2 − 49.418 × B2
where A is the amplitude and B represents the time.
The influence of the process parameters A and B on the extraction rate of the TPC in samples treated with US is shown in Figure 2.
Figure 2 clearly illustrates that the amplitude of ultrasonic waves has a greater impact on the outcomes than the time of the treatment. A higher treatment time with smaller amplitudes (50%) has a detrimental effect, and less TPC is extracted. Higher amplitude values (90%), on the other hand, greatly improve the TPC extraction yield.
The potential of ultrasonic waves to have a detrimental effect on biomass, aiding the extraction of cell contents, has been ascribed to ultrasound assisted extraction, having an improving influence on extracting phenolics from plants. Using ultrasound and different operating conditions, previous studies have shown increased yields of phenolic extracts as plant bioactive compounds, when applied to blueberry pomace, mango peels, or coffee beans [53,54,55].
In addition, it was observed that heat breakdown of the polyphenols may take place at high temperatures. A reduction in the extraction yield owing to temperature might be attributed to phenolic components degrading at high temperatures [56].
In the described situation, the optimal circumstances would be a higher amplitude, and a reduced duration of the treatment.

3.2. Monomeric Anthocyanins

Anthocyanins are a major family of phenolic compounds found in red wine. The treatment tests showed a strong interaction of the cavitation phenomena with the cells of the exocarp, with an increase in the concentration of anthocyanins. Our results were consistent with others that include ultrasound-assisted extraction on the list of new technologies that have been developed with the goal of reducing extraction times and enhancing yields [57].
The MA content for the sonicated samples varied from 20.67 mg cyanidin 3-glucoside equivalents (CGE)/L to 223.46 mg CGE/L, as shown in Table 2. Similar to the TPC, the lowest amount of MA was found for the SM50/3 sample (run order three) using 50% amplitude for 3 min, while the higher MA content was found for the SM90/3 sample (run order one) using 90% amplitude for 3 min. It can be observed that there was an increase, generally proportional with the treatment conditions, of 28.7% to about 14 times for the MA of the sonicated samples compared with untreated sample (C).
Regarding the extraction of MA, US treatment with A 90% for 3 min led to the highest extraction (sample SM90/3), while slightly lower values of 3.8% (sample SM90/4) and significant lower values of 21.11% (sample SM90/5) were recorded when we used an amplitude of 90% for 4 min and 90% for 5 min, respectively. It is observed that the extraction of monomeric anthocyanins increases by a maximum value and then start to decrease, probably also due to the influence of the final temperature reached in the treated samples.
The anthocyanin content of grape juice was negatively impacted by higher amplitude levels and longer treatment times, as other authors have shown [28]. Moreover, it was observed that anthocyanins are susceptible to degradation due to a variety of variables such as pH, temperature, oxygen, water activity, and co-pigments [58].
Other researchers revealed that the temperature has a substantial impact on anthocyanin extraction, with maximal extraction occurring at roughly 30 to 35 °C. However, temperature increases enhance extraction by increasing the solubility of anthocyanins and the diffusion coefficient. However, temperatures over a particular point resulted in a reduction in anthocyanin output, e.g., at temperatures above 45 °C, anthocyanins decrease dramatically [59].
As it can be noticed, for the highest extraction of both the TPC and MA ultrasound amplitude and treatment time are the same: 90% amplitude for 3 min.
The difference in behavior between the total phenolics and anthocyanins might be explained by anthocyanins’ greater vulnerability to high temperatures [56].
According to Table 5, model terms for the monomeric anthocyanins A, A2, and B2 are significant since their p-values are less than 0.0500, as shown. If the value is higher than 0.1000, the model terms are not considered relevant. An F-value this large might be caused by noise just 0.01% of the time, but the model’s F-value of 44.35 suggests that the model is important. The lack of fit is implied to be significant by the lack of fit F-value of 396.80.
The adjusted R2 of 0.9475 and the predicted R2 of 0.8878 are in fair agreement (i.e., the difference is less than 0.2), indicating that the model makes accurate predictions. Equation (4) displays the final equation in terms of the actual factors for monomeric anthocyanins. For specific levels of each element, predictions regarding the response can be made using the equation.
YMA = −1134.49 + 17.683 × A + 262.123 × B − 0.659 × A × B − 0.075 × A2 − 27.254 × B2
where A is the amplitude and B represents the time.
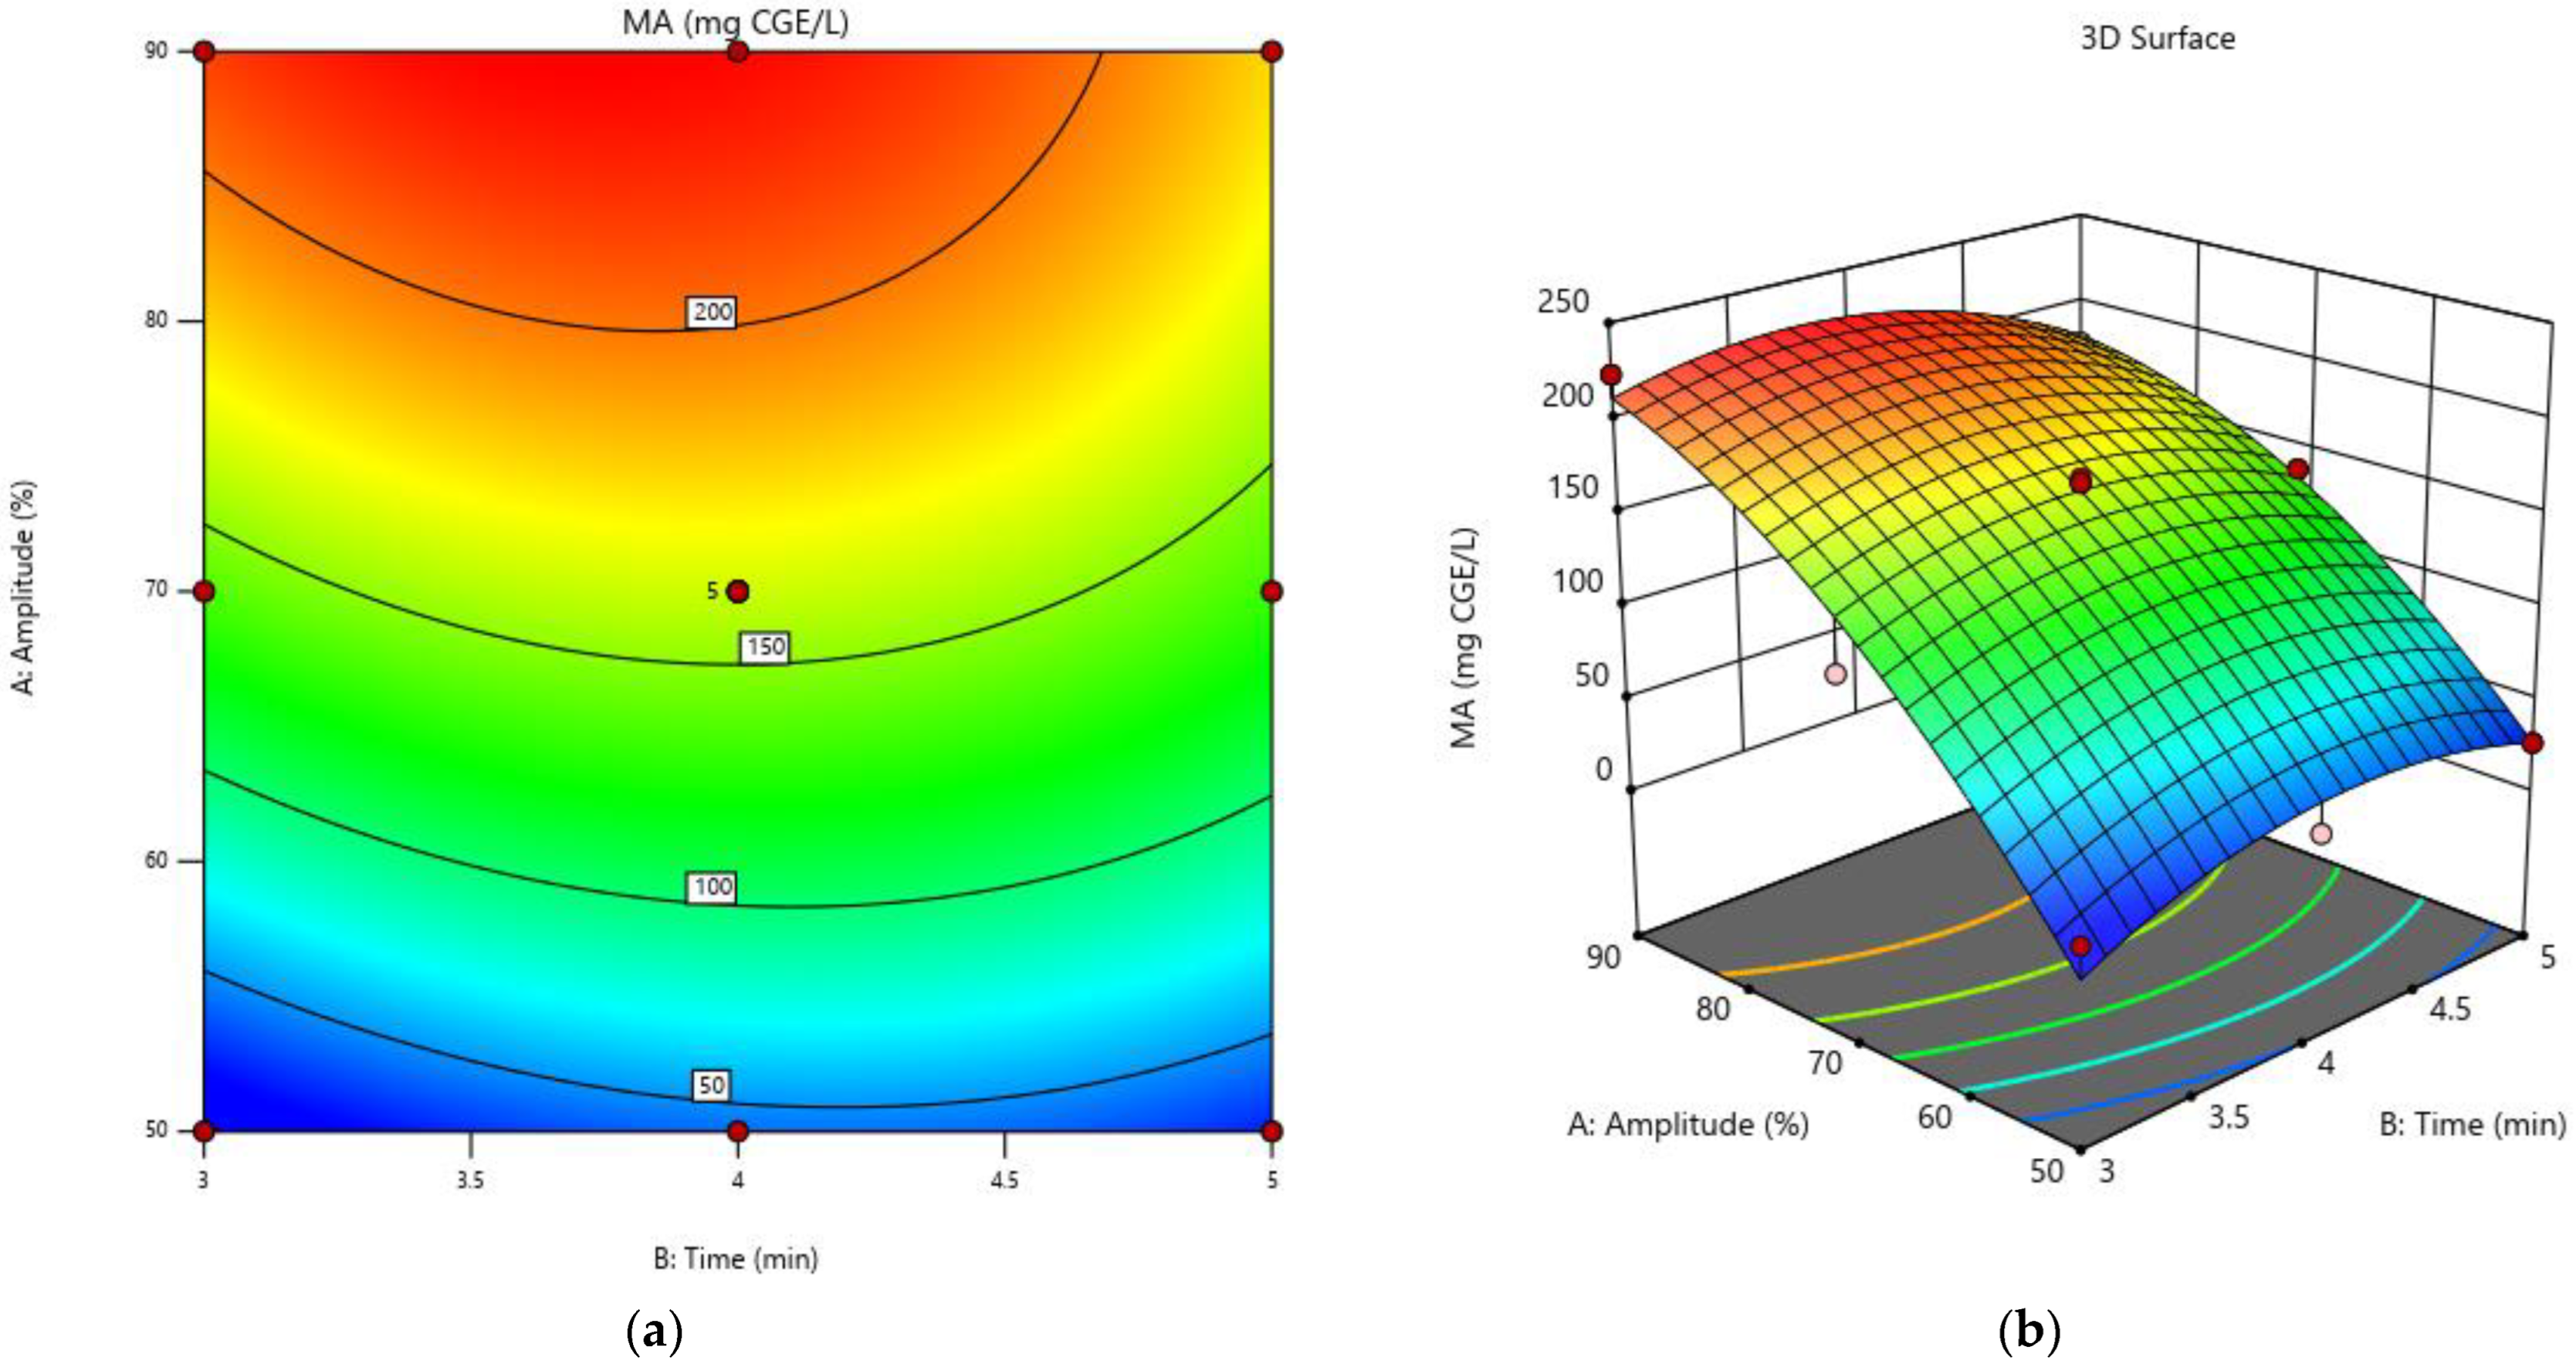
The effect of the process parameters A and B on the extraction rate of the MA in samples that underwent US treatment is shown in Figure 3.
According to Figure 3, which compares the effects of the treatment duration and ultrasonic wave amplitude on the extraction of the monomeric anthocyanins from red grape exocarp, the extraction yield of the MA increases with both up to a certain point before starting to decline. However, as the treatment time increases over 3 min using the ultrasound wave amplitude at the maximum level (90%), the extraction rate of the MA decreases. Excessive cavitation occurs at high amplitudes, raising the temperature around the probe, creating more hydroxyl radicals, and resulting in excessive degradation [60]. Moreover, as a smaller amplitude may not deliver enough energy to break the cell wall, the lowest extraction yields of the MA were observed in the samples where the minimum amplitude level was used (A = 50%).
Using ultrasound and different working conditions, previous studies have also shown increased yields for anthocyanin extractions from blueberry marc, mulberry wine residues, or purple sweet potatoes [61,62,63].
Similar to the TPC, the optimal circumstances for the MA enhanced extraction would be a higher amplitude, and a reduced duration of the treatment.

3.3. Antioxidant Activity

The antioxidant properties of the phenolic compounds from grapes have been extensively researched, including the scavenging of free radicals, the suppression of lipid oxidation, the decrease of hydroperoxide production, and so on. These properties are especially significant in terms of bioactivity. Moreover, antioxidants can stop the oxidation process by preferentially interacting with an oxidizing agent, rather than the desired target molecules or cells [64].
In addition to the FRAP assay, the DPPH scavenging activity was evaluated to further support our research findings. Both the DPPH and FRAP assays could be used to determine the antioxidant activity, as both showed high reproducibility [65].
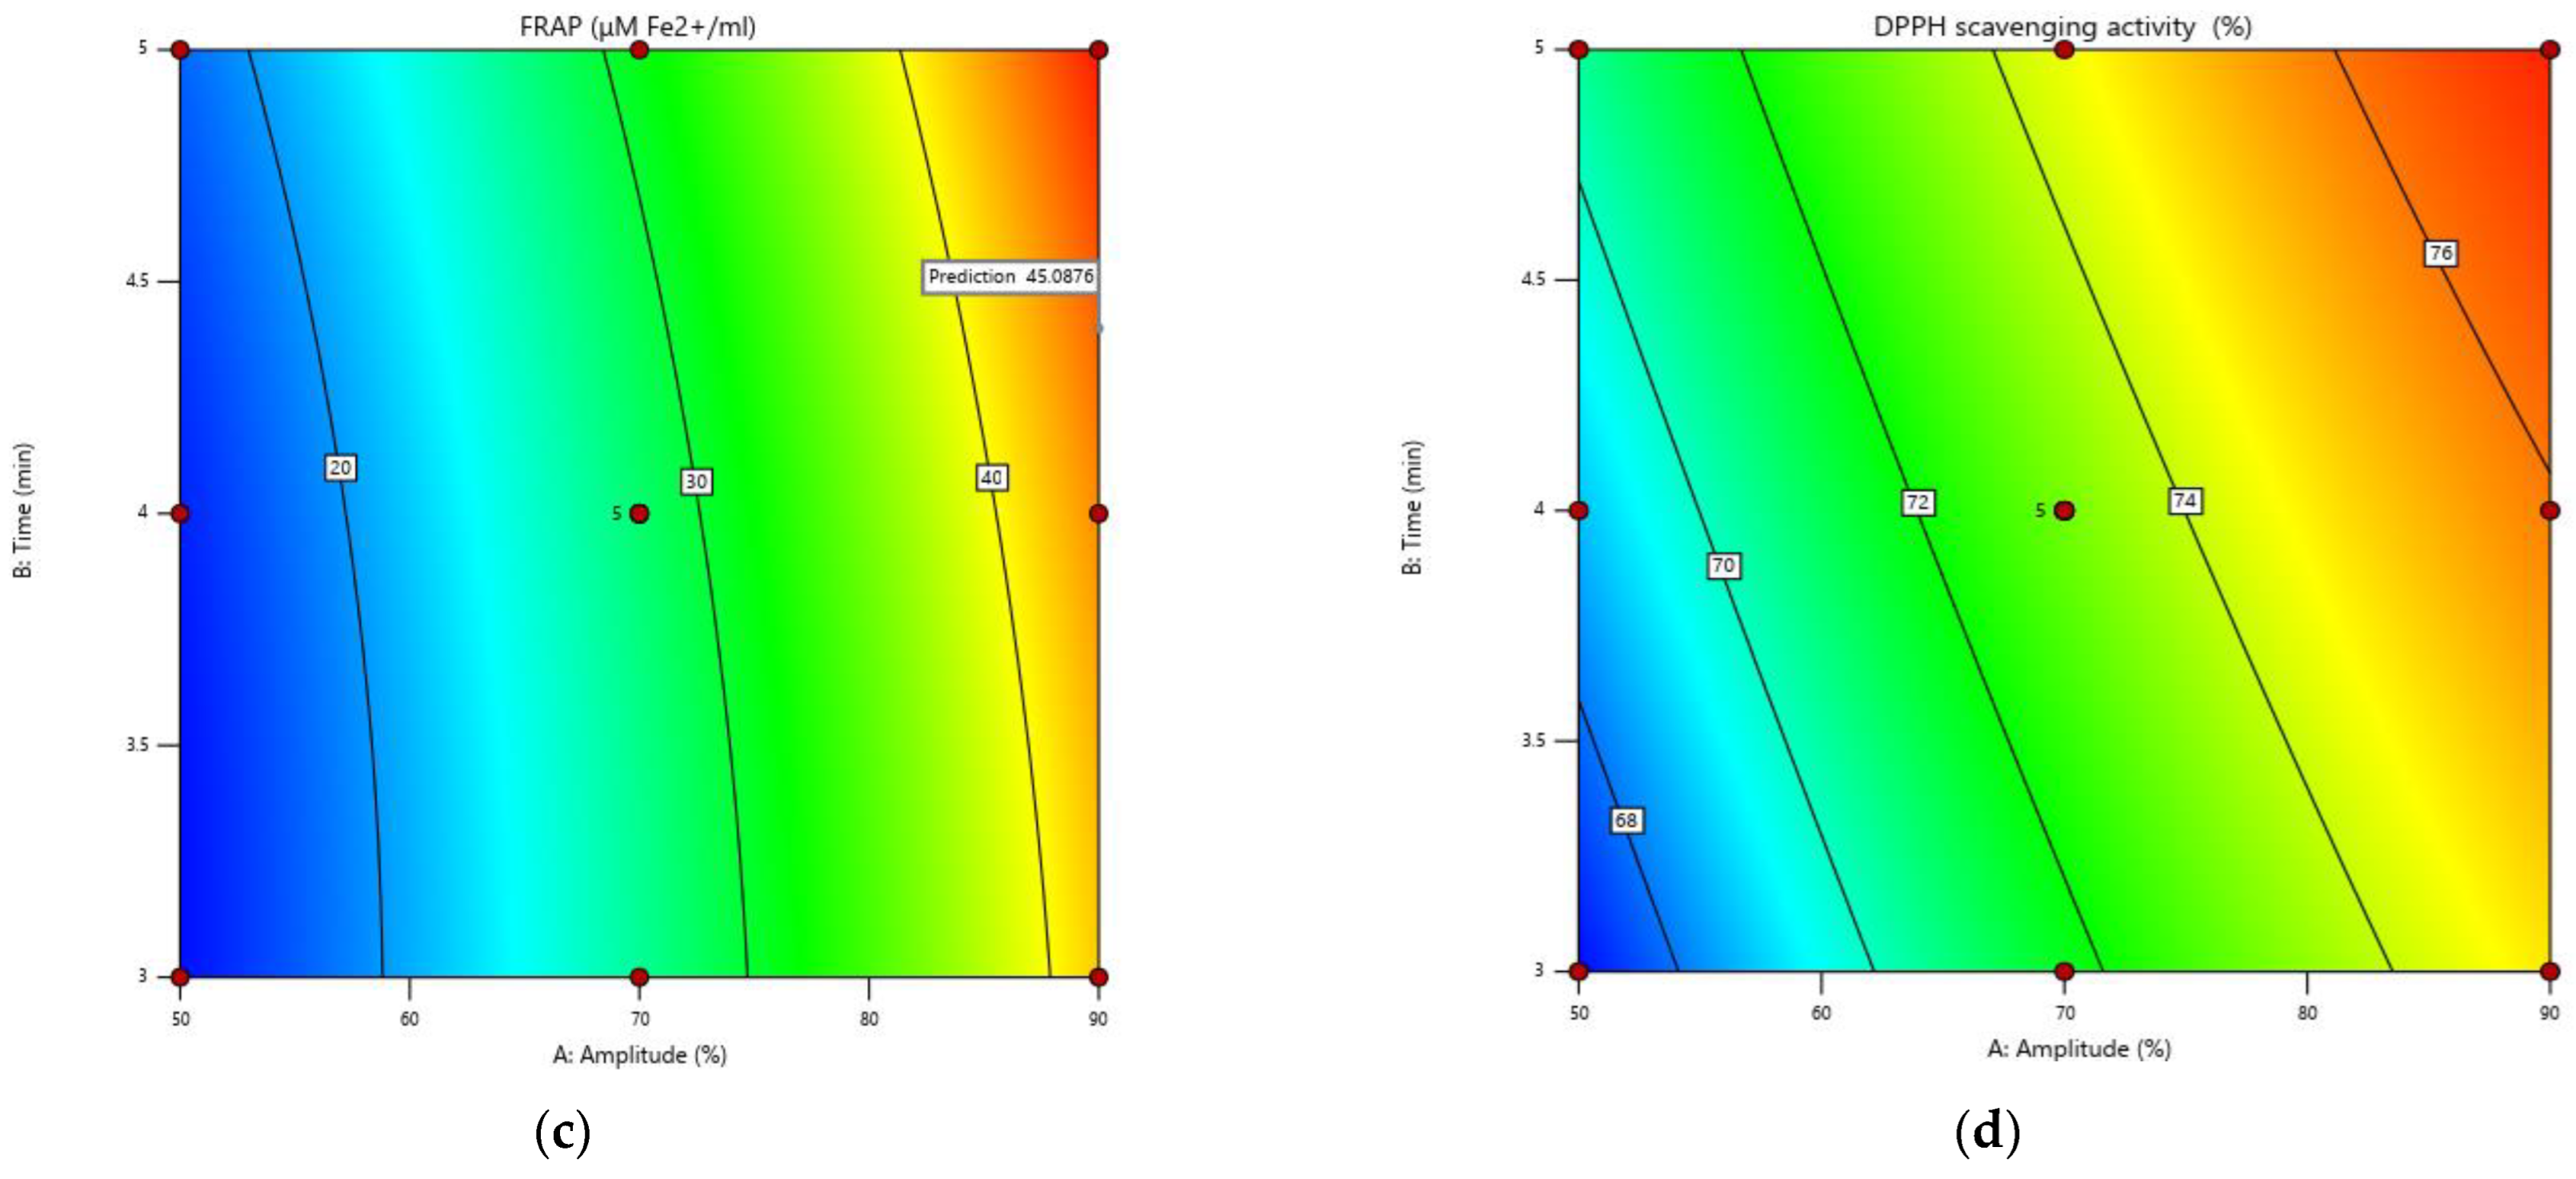
The maximum antioxidant activity, 48.32 µmol Fe2+/mL and 77.2%, as measured by the FRAP and DDPH assays, respectively, was observed in the sonicated samples of run order 8, acquired at 90% amplitude for 5 min (sample SM90/5) (Table 2). The lowest activity, 15.02 µmol Fe2+/mL or 66.8% (run order 3) was observed at 50% amplitude for 3 min (sample SM50/3).
It was noted that the greatest extraction of antioxidants required the same ultrasonic amplitude (90%) as for the TPC and MA, but the maximum time was 5 min, not 3 min as for the TPC and MA. Moreover, the fact that antioxidants also include non-phenolic chemicals, which may require a higher temperature for extraction, may help to explain a slightly higher extraction temperature of 60.17 °C for the maximum value of antioxidant compounds. Previous studies that claimed antioxidants required a higher temperature for extraction are consistent with this conclusion [25]. Moreover, the results might suggest that the antioxidant activity of the samples was significantly influenced by the TPC levels.
It can be seen that the antioxidant activity of the sonicated samples increases in proportion to the treatment conditions, from 11.84% to about 3.6 times as measured by the FRAP and from 2.77 to 18.77% as measured by the DPPH free radical scavenging assay, compared to the untreated sample (C).
According to the mechanism of action exhibited by antioxidant compounds, the methods used to measure antioxidant activity evaluate the ability of antioxidant species to scavenge free radicals or the ability of antioxidants to reduce an oxidant compound [65]. FRAP values quantify the ability of the antioxidant compounds contained in red grape must samples to donate electrons and, thus, reduce the oxidized species. A relevant indicator of a compound possessing potential antioxidant activity may be its reducing power [66].
It can be observed that the presence of a significant amount of phenolic compounds in red grape must, as a result of US treatment, led to high FRAP values.
The DPPH radical scavenging activity reflects the hydrogen-donating capacity of the samples, thanks to the presence of bioactive substances. When the DPPH radical scavenging activity of the samples was examined, the same conclusion was reached as in the FRAP evaluation, namely that the antioxidant potential was higher after treatment with ultrasound.
A closer examination of the results obtained from the FRAP and DPPH tests revealed that the increase in the electron-donating capacity or reducing power of the samples in response to US treatment was greater than that recorded for their free radical scavenging capacity.
The study performed by Rajurkar and Hande [67] revealed that the phenolic compounds exhibited a much higher correlation with the reducing power than with the DPPH free radical scavenging activity. Thus, it is estimated that the phenolic compounds extracted from red grapes provide antioxidant protection directly through the mechanism of reducing the oxidized intermediates in the chain reaction.
Our results suggest that the FRAP and DPPH assays could be used to distinguish the dominant mechanism, by which polyphenolic compounds from grape must act as antioxidants.
Other results showed that the antioxidant activity of phenolic compounds may have a concentration saturation limit, beyond which the activity cannot be increased by concentration. However, some results showed that there are factors other than concentration that influence the antioxidant properties of phenolic compounds, as the relationship between the phenolic compounds and the antioxidant activity was inconsistent [8,68]. Furthermore, other research showed a significant relationship between the polyphenolic compounds assessed in the various samples and the outcomes of the antioxidant activity tests [69].
As their p-values are less than 0.0500, Table 6 shows that the model parameters A, B, and A2 are significant for the antioxidant activity measured by both the FRAP and DPPH assays. Values greater than 0.1000 indicate that the model terms are not decisive. The model significance is indicated by the model F-value of 330.16 and 58.81, respectively. The F-values for lack of fit, 2.40 and 102.78, respectively, indicate that the lack of fit is not significant.
The predicted R2 (0.9727 FRAP and 0.7829 DPPH) and the adjusted R2 (0.9928 FRAP and 0.9601 DPPH) are in good agreement (i.e., the difference is less than 0.2), indicating that the model makes accurate predictions.
Equations (5) and (6) display the final equations in terms of the actual factors for the antioxidant activity as measured by the FRAP and DPPH assays. For specific levels of each element, the equation can be used to predict the response.
YFRAP = 16.030 − 0.074 × A − 6.965 × B + 0.036 × A × B + 0.004 × A2 + 0.826 × B2
YDPPH = 37.996 + 0.549 × A + 3.434 × B − 0.020 × A × B − 0.002 × A2 − 0.079 × B2
where A is the amplitude and B represents the time.
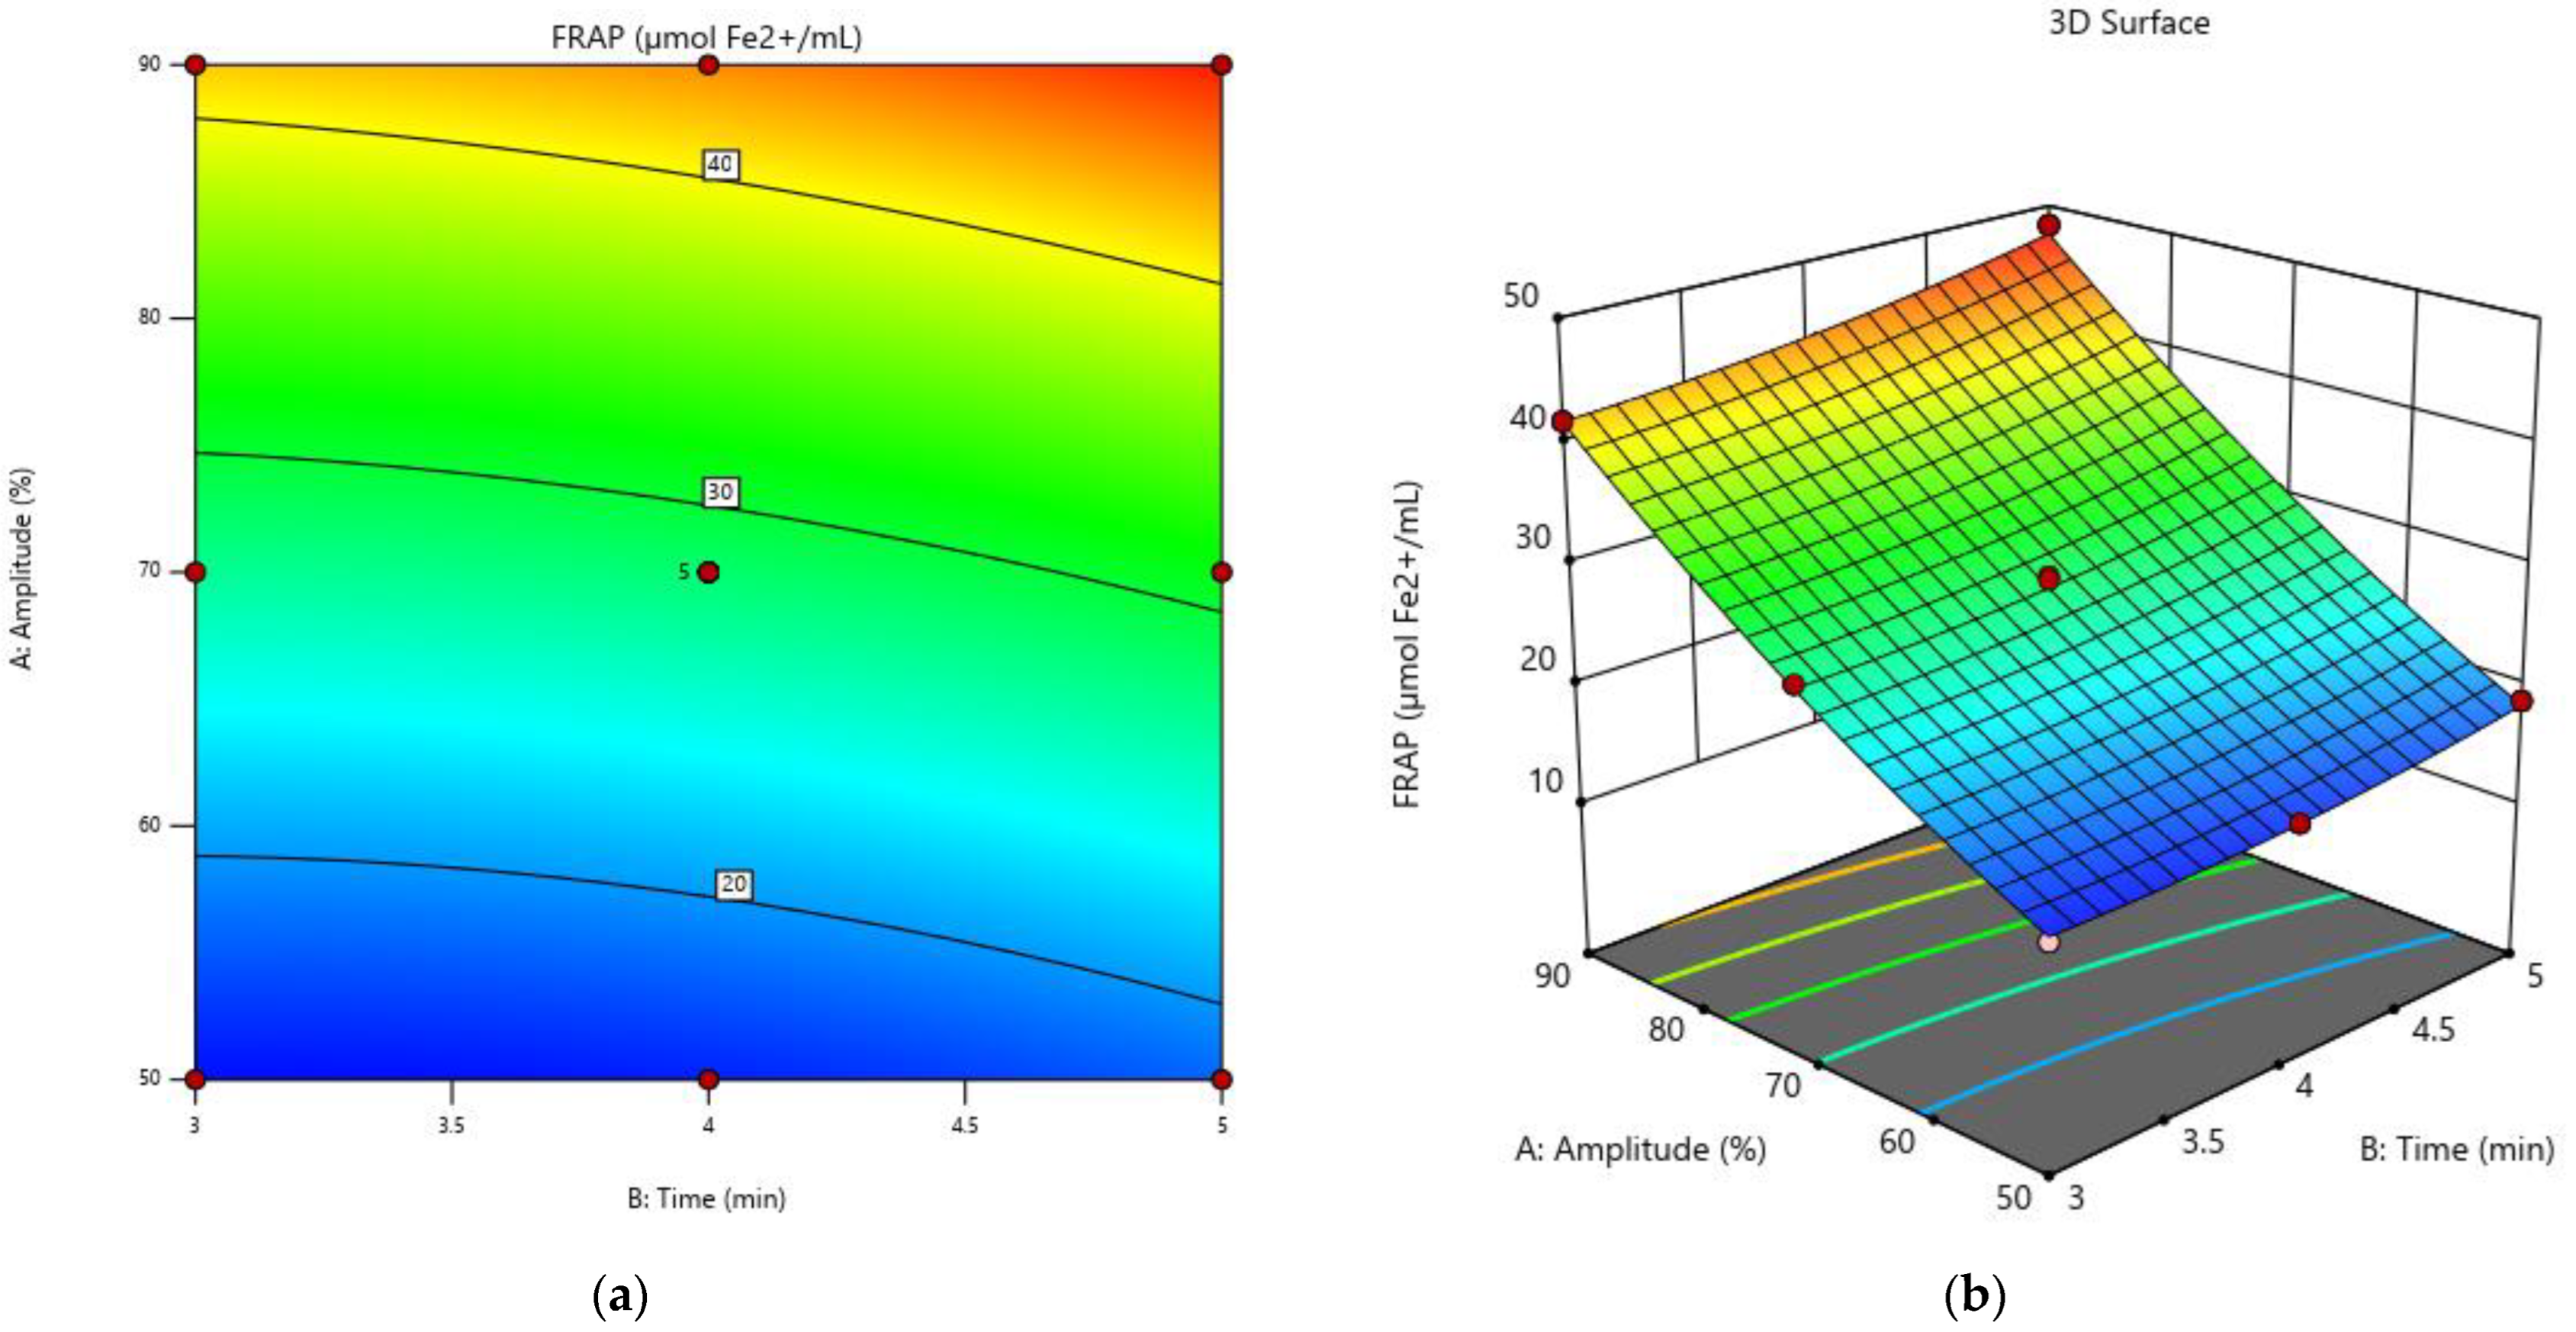
Figure 4 shows the kinetics of the antioxidant activity in samples treated with US, as well as the 3D response surfaces and contour plots.
From Figure 4, which compares the effects of the treatment time and ultrasonic wave amplitude on the antioxidant activity of the samples, it can be seen that both the FPAP and DPPH values increase with both factors, up to a maximum value of 48.32 µmol Fe2+/mL and 77.2% in sample SM90/5.
Other researchers came to the conclusion that the antioxidant activity of wines is more closely related to the type of individual phenolic compounds found in the wines than to the TPC. It has also been proposed that the antioxidant activity is mostly attributed to the flavan-3-ol fraction, rather than anthocyanins [70].
However, the grapes and wines showed a strong link between their phenolic composition and the antioxidant activity. The main substances involved in this bioactivity varied depending on the type of sample examined. The primary category, with a significant contribution to this feature, was identified as anthocyanins. Additionally, variations in the phenolic component quantities may account for the variations in the antioxidant efficacy between grape cultivars [71].
In the situation described, the optimal circumstances for antioxidant activity would be a higher amplitude and a longer duration of treatment compared to the TPC and MA.

3.4. Correlations between Total Phenolic Content, Monomeric Anthocyanins and Antioxidant Activity

The results of our study show that the higher the amplitude and the longer the duration of the ultrasound treatment, the higher the antioxidant activity, expressed both as the FRAP or DPPH free radical scavenging activity, as the maximum values for the antioxidant activity were found when an ultrasonic amplitude of 90% was applied for 5 min (sample SM90/5): 48.32 µmol Fe2+/mL and 77.2%, respectively.
It can also be observed that the antioxidant activity of the sonicated samples, expressed by both the FRAP and DPPH tests, increased in proportion to the total polyphenol and monomeric anthocyanin content.
For the maximum values observed for the total polyphenol content (1396.06 µg GAE/mL) and the monomeric anthocyanins (223.4 mg CGE/L), when an ultrasonic amplitude of 90% was applied for 3 min (sample SM90/3), the antioxidant activity was 3.11 times higher when measured with the FRAP test and 14.62% higher when measured as DPPH radical scavenging activity (%) compared to the control sample (C). These improved values confirmed the greatest influence of phenolics and anthocyanins on the antioxidant activity.
These results are in agreement with those reported by some authors who have shown a positive correlation between the TPC and the antioxidant activity evaluated by DPPH [72], or who have linked the high antiradical power of the samples to their anthocyanin concentration [73], but are in contrast to others [74,75].
The current analysis shows a very good correlation (p < 0.01) between the TPC and antioxidant activity as the FRAP (Pearson’s r = 0.917) and as the DPPH radical scavenging activity (%) (Pearson’s r = 0.878). The same, very good, Pearson correlations were found between the MA and the antioxidant activity as the FRAP (Pearson’s r = 0.928) and as the DPPH radical scavenging activity (%) (Pearson’s r = 0.888).
Finally, our results showed that the antioxidant activity of the sonicated samples was influenced by the TPC and MA, although the samples with the highest TPC and MA did not always show the highest values for antioxidant activity expressed either as the FRAP or as the free radical scavenging activity, DPPH %.

3.5. Optimization of the Experimental Model for Increasing the Extraction Rate of Biologically Active Compounds and the Antioxidant Activity in Grape Must

Aiming to maximize the extraction of biologically active compounds in grape must, as well as to enhance its antioxidant activity, we investigated the optimization function of the model made with the Design Expert® software version 13, (Stat-Ease, Inc., Minneapolis, USA, 2022). For numerical optimization, any combination of one or more objectives was optimized. The goals we applied to either factors or responses were as follows: amplitude and treatment time in range; TPC, MA, FRAP, and DPPH maximized.
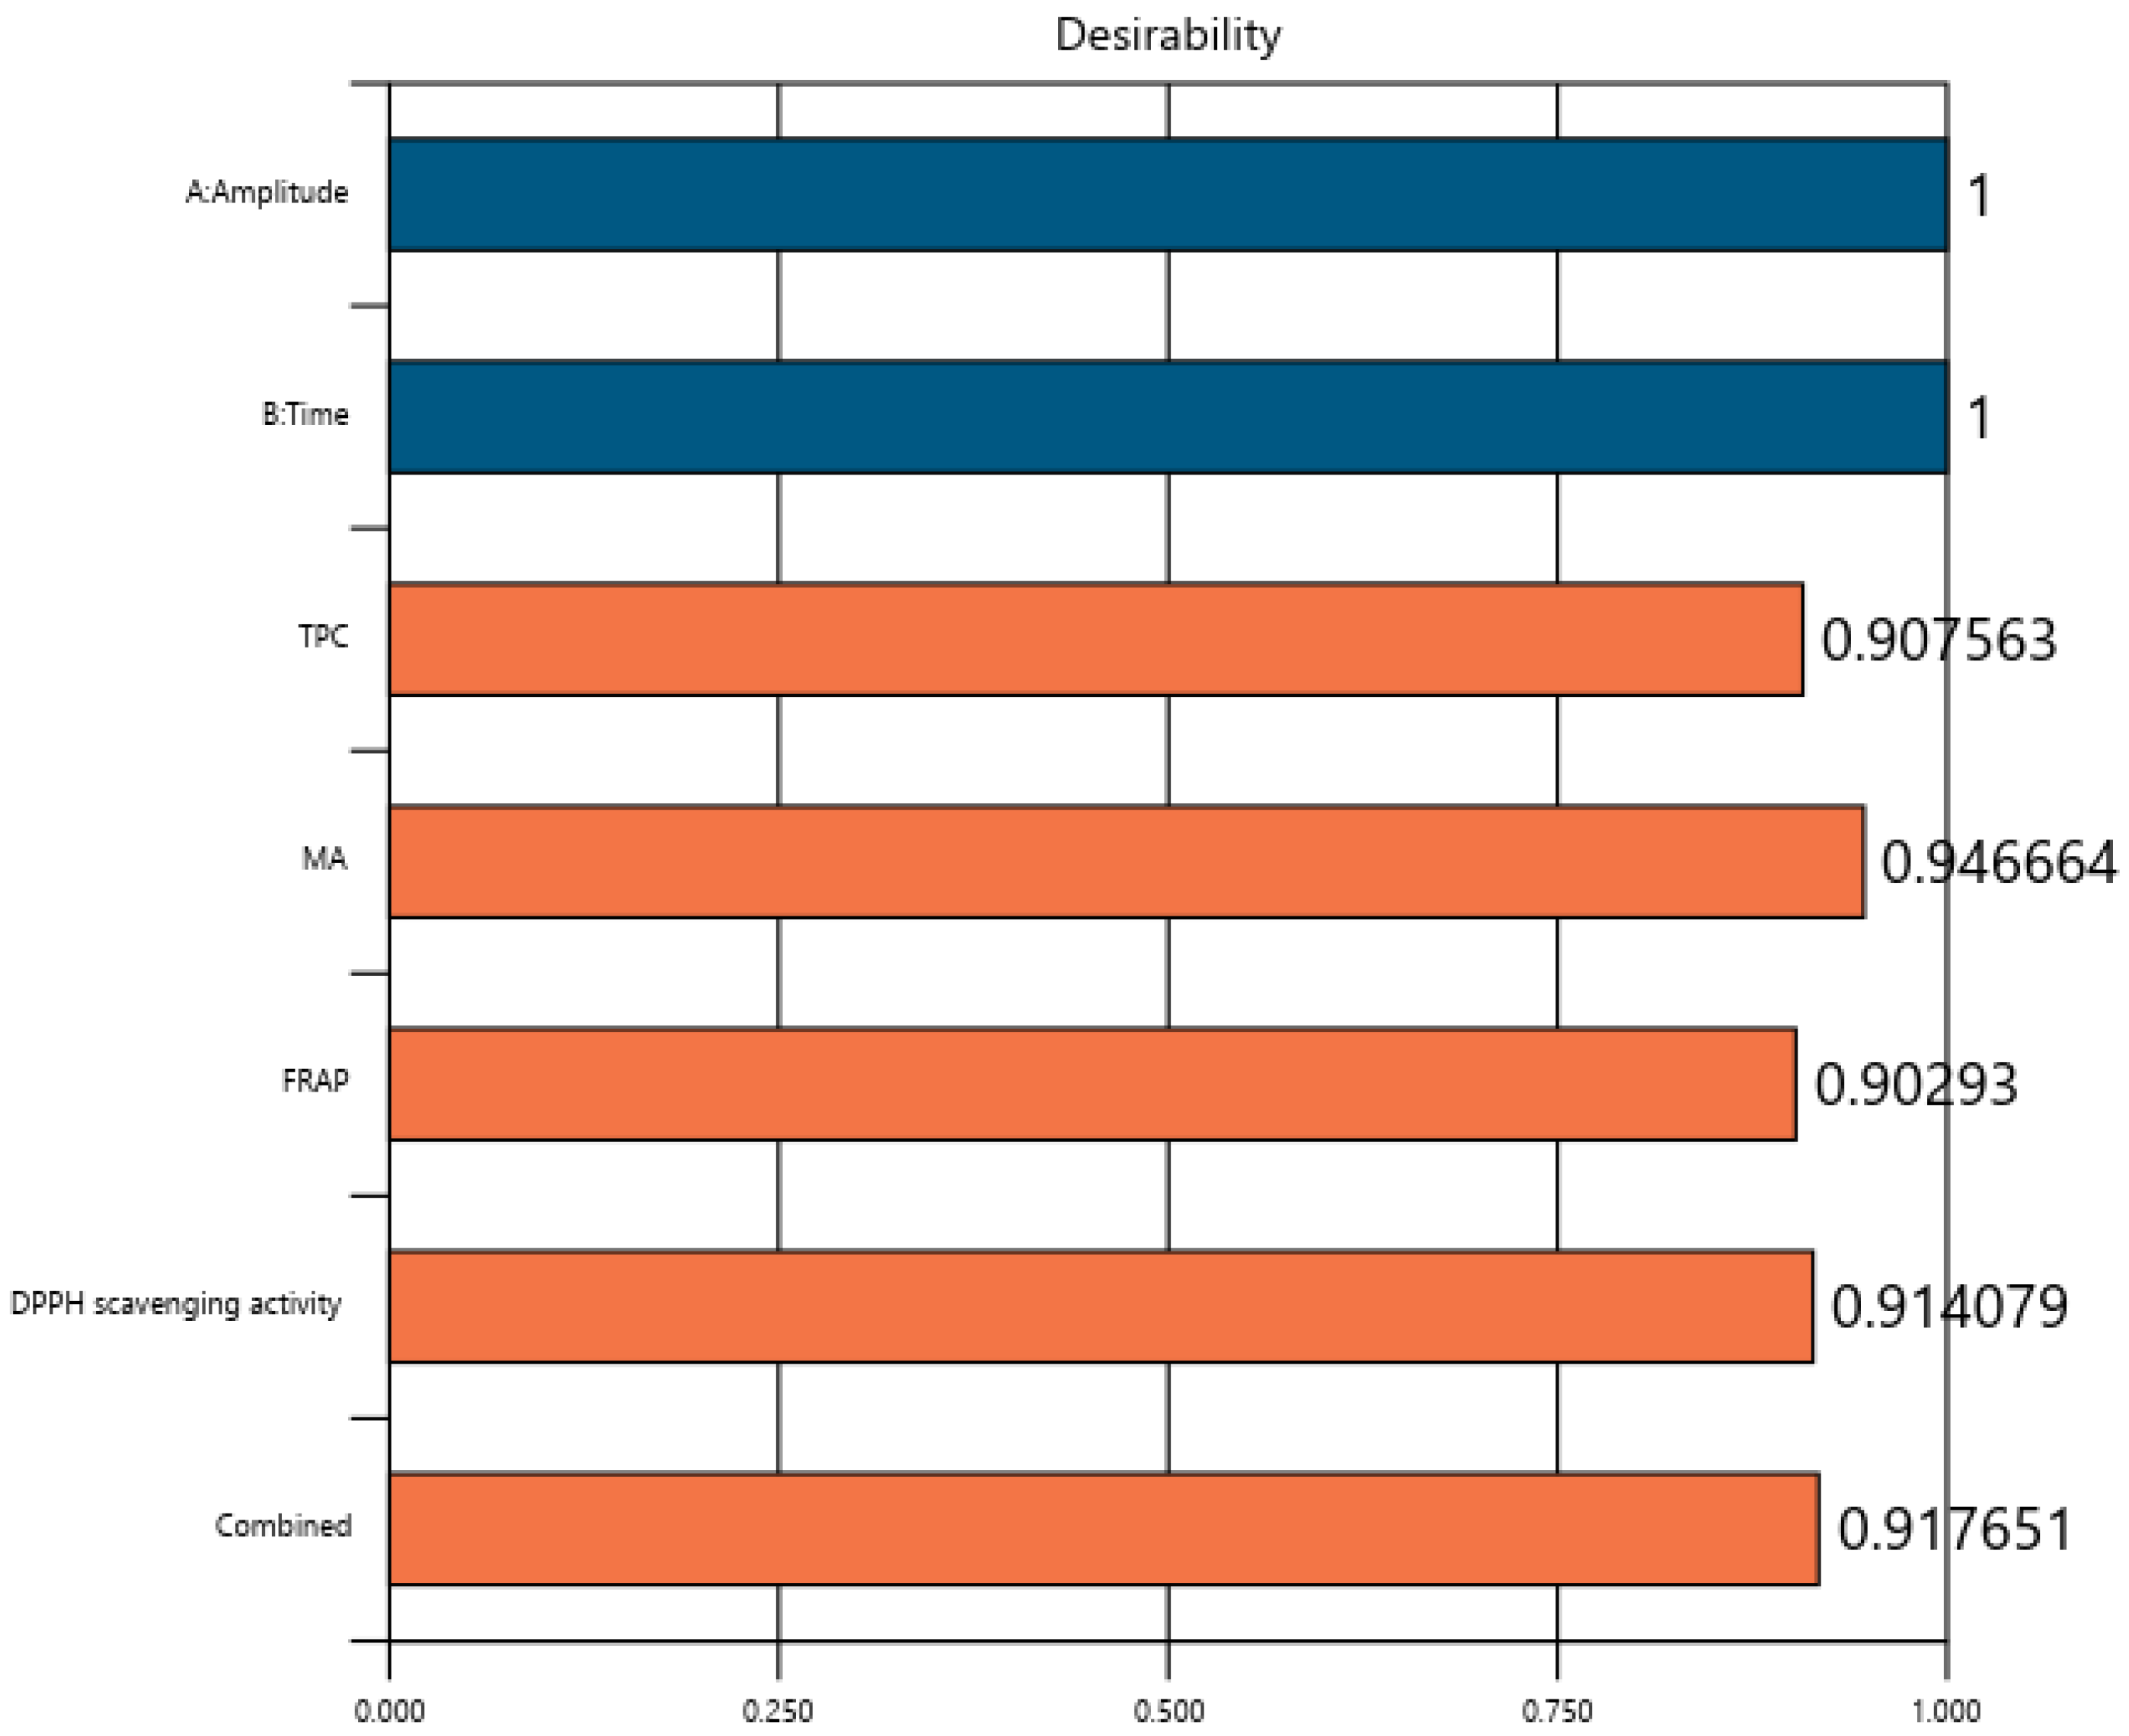
The optimization function of the software gave us 20 found solutions, indicating the solution with the highest value of desirability, which was 0.918 (Figure 5), namely an amplitude of 90% and a treatment time of 4 min and 24 s, as the solution selected to maximize the extraction of the TPC, MA, and antioxidant activity as the FRAP and DPPH scavenging activity.
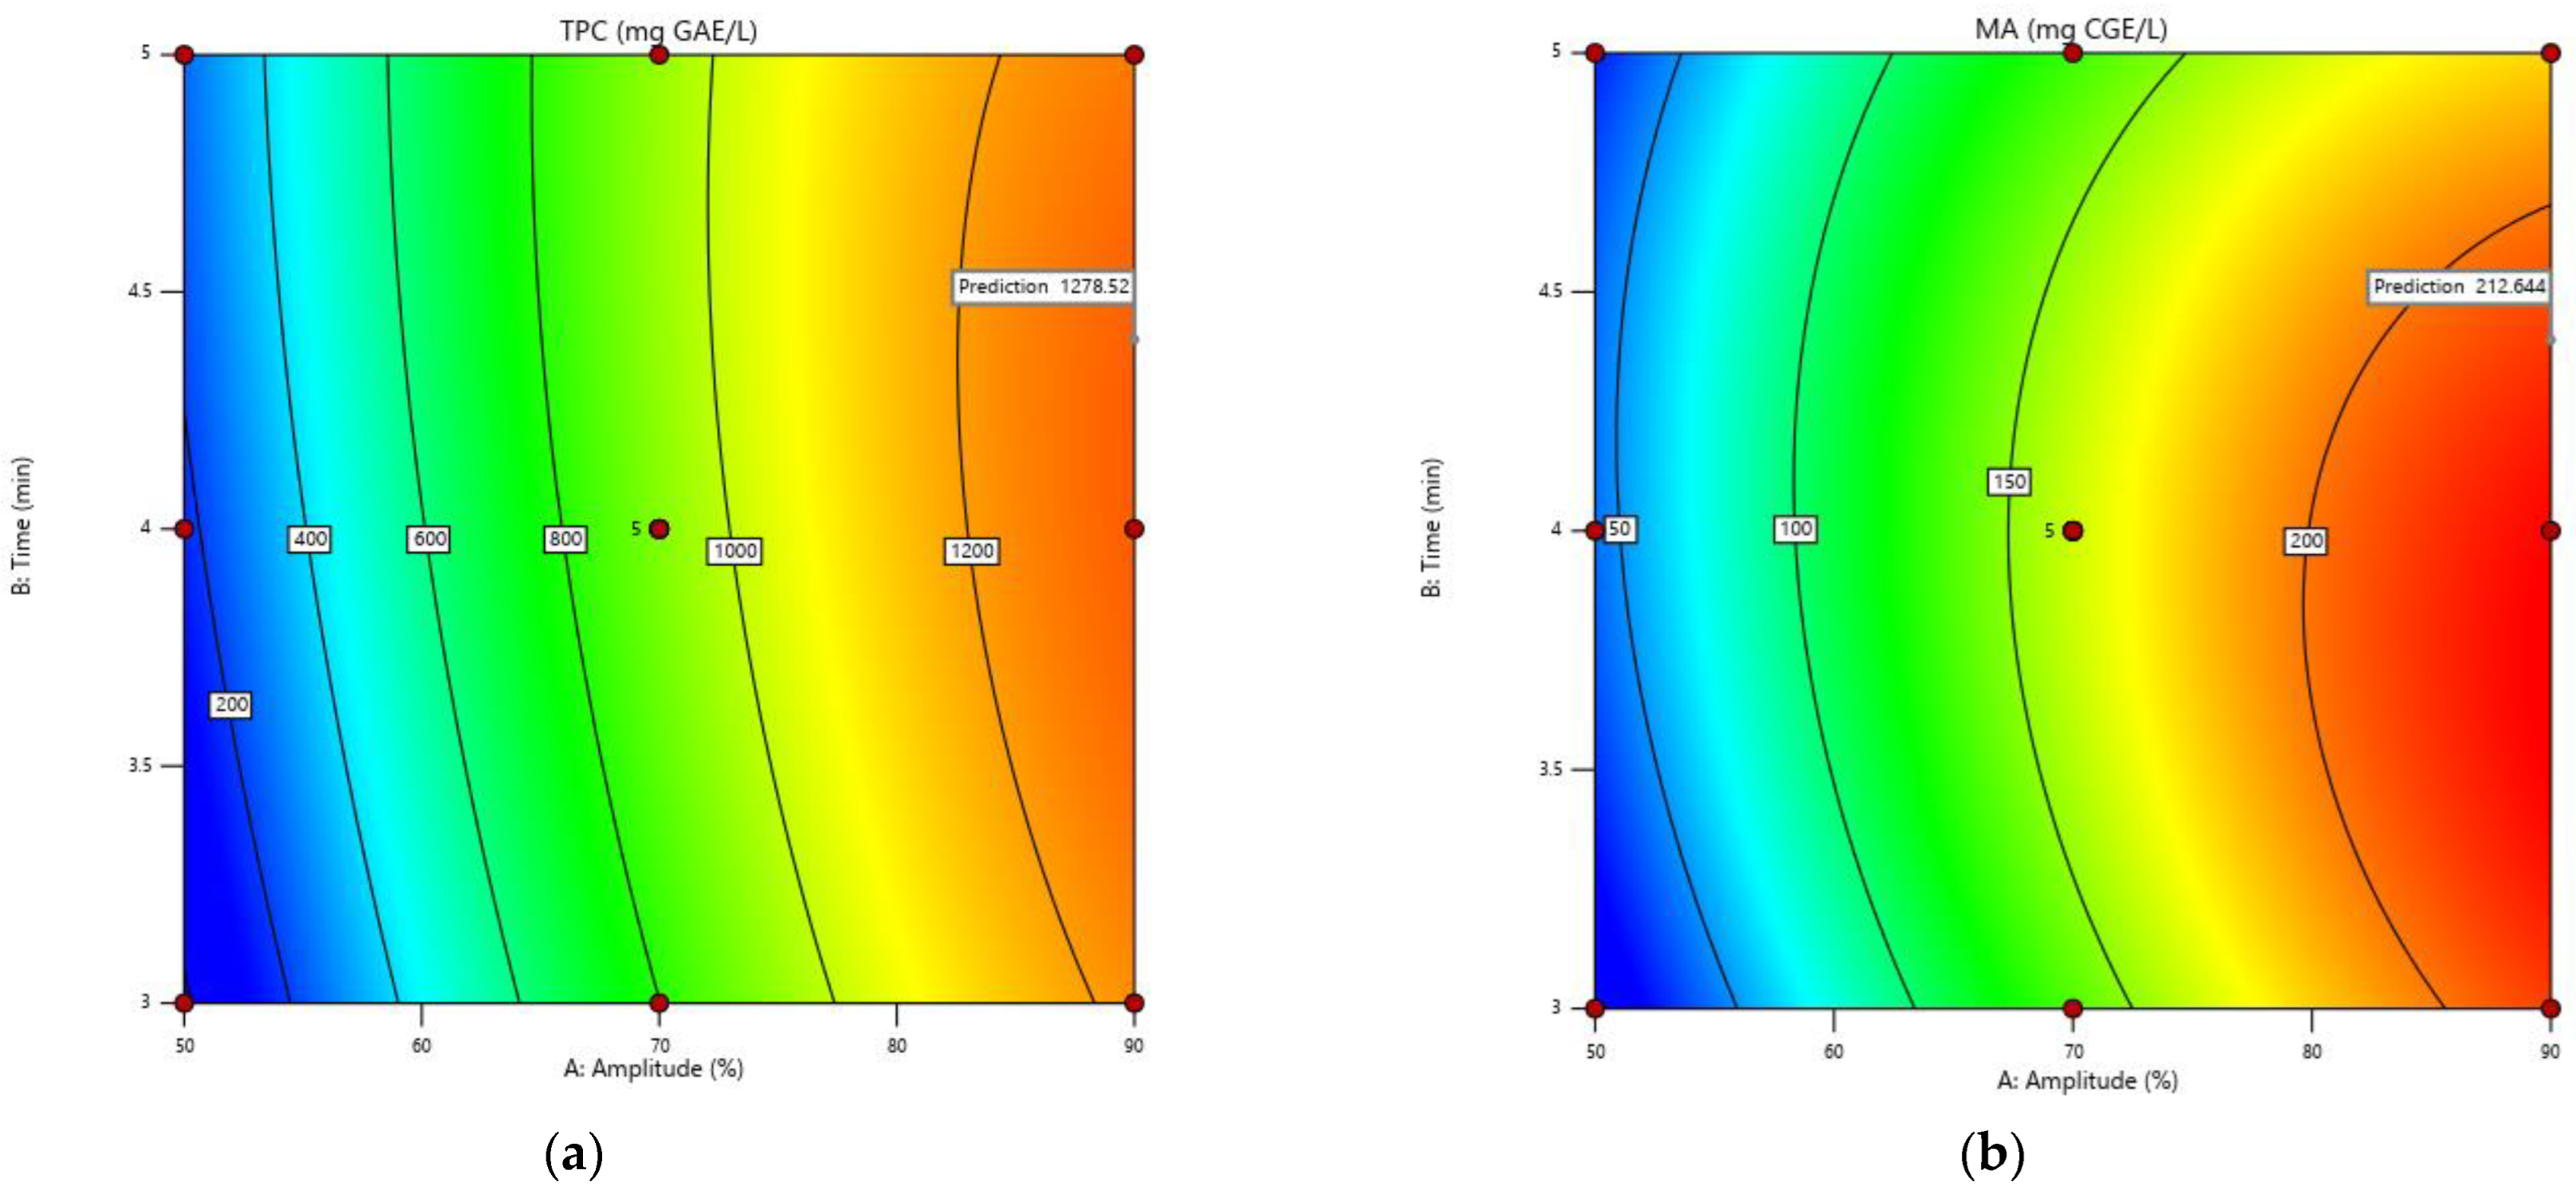
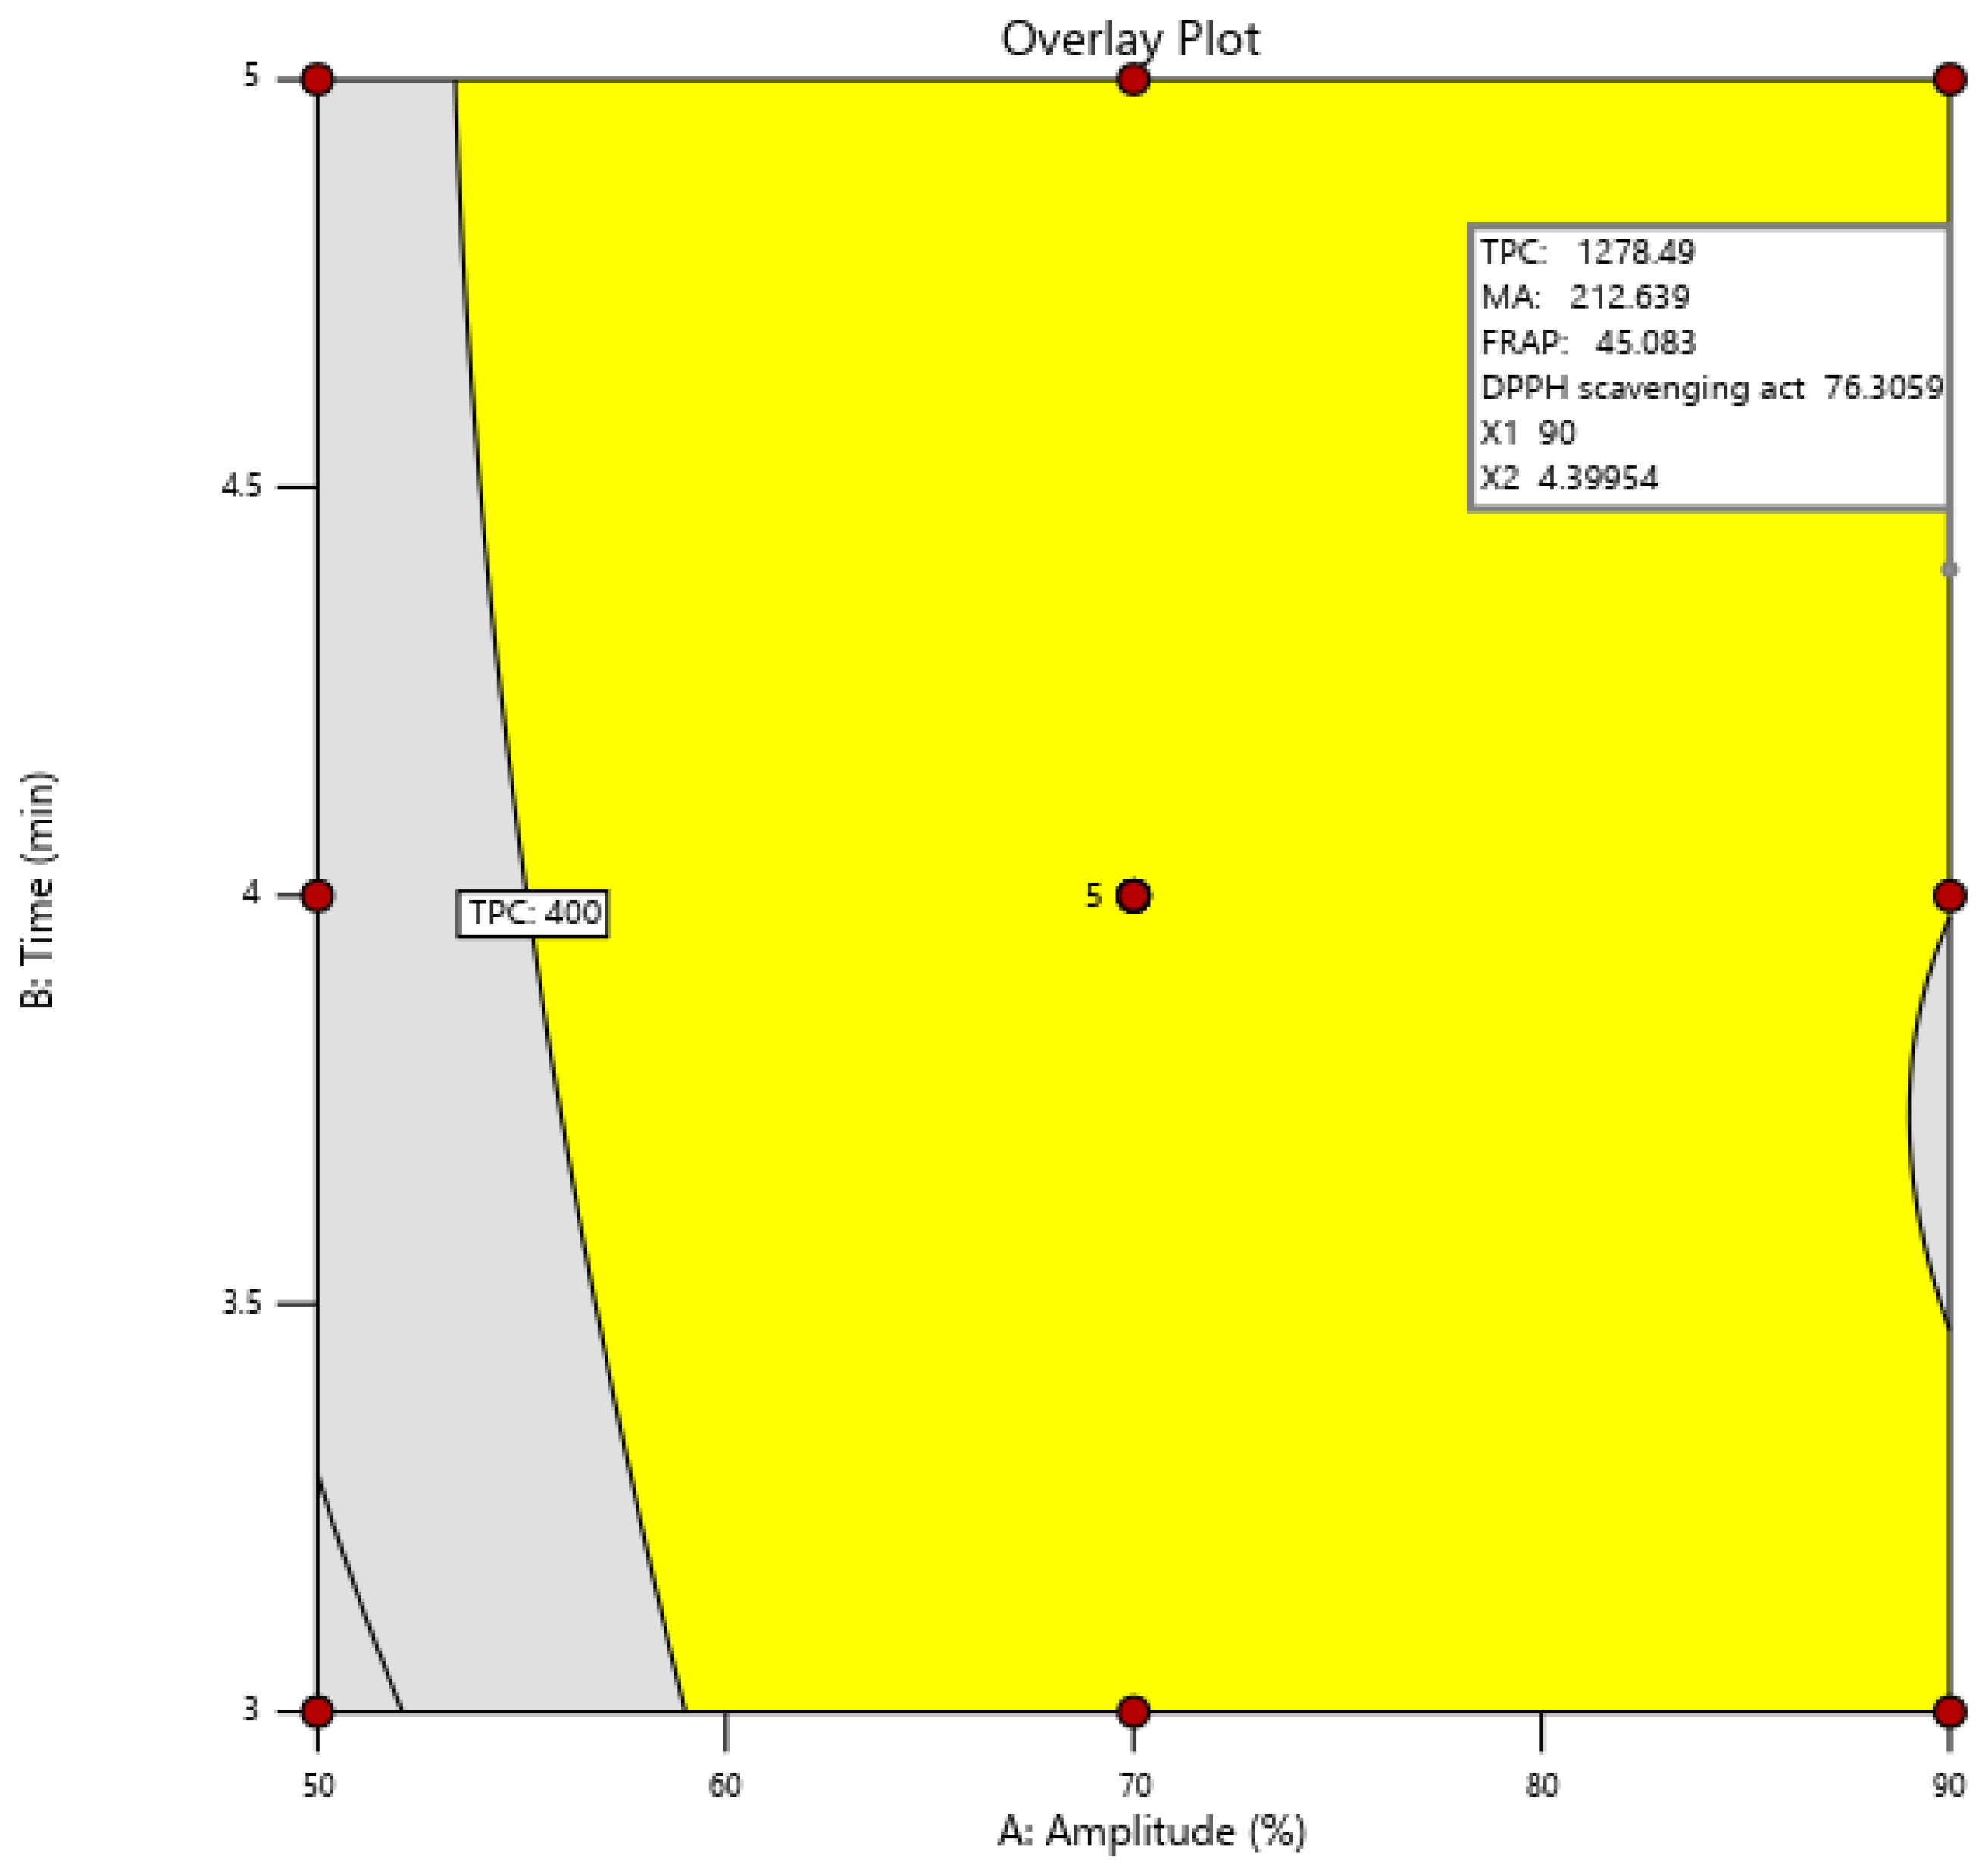
To identify the factor settings that meet specified objectives, numerical optimization searches the design space using the models built during the analysis (Figure 6). Under certain conditions, the model can accurately predict the extraction rate of compounds.
Figure 7 shows the optimization graph for the optimal displayed solution, highlighting the point at which the response criteria is met.

3.6. Confirmation of the Model

The optimization analysis was used to guide the validation trials, which were conducted using the same methodology at the ideal selected amplitude—90% and treatment of time 4 min and 24 s. The predicted data were found to be TPC—1278.52 (µg GAE/mL), MA—212.64 (mg/L), FRAP—45.09 (µmol Fe2+/mL) and DPPH—76.31%, as observed in Figure 6 and Figure 7.
The observed response data and the predicted data from the modelled response were compared under the extraction conditions. The errors for the TPC, MA, FRAP, and DPPH were −8.70%, −0.99, 3.14 and 0.25%, respectively, as shown in Table 7, indicating the confirmation of the model.
The small differences between the predicted and observed values showed that the extraction optimization model obtained with the RSM in this study had a high degree of fit, and has the potential to be used even for large-scale extraction of phenolics and other antioxidant compounds from grapes using high-power ultrasound.

4. Conclusions

The acceleration of extraction kinetics using a physical technique can be important when the levels of physiologically active compounds in grapes are high. The use of ultrasound reduces the extraction times, while intensifying and almost maximizing the extraction yield and antioxidant activity. Overall, the use of ultrasound in winemaking opens up the possibility to optimize and better manage the vinification of red grapes. Due to the relatively short time required for ultrasound exposure, the application of ultrasound can be considered as a continuous pre-treatment for crushed red grapes prior to filling the winemaking tank. High-power ultrasound treatment of crushed grapes for a few minutes increases both the extraction rate of the bioactive compounds and the antioxidant activity by 12 times for the TPC, 14 times for the MA, 3.6 times for the FRAP and by 18.77% for the free radical scavenging activity, DPPH. However, a treatment time of 5 min and an amplitude of 90% led to a decrease in the TPC and MA, while the FRAP and DPPH values increased with the same operating parameters. The optimal solution to develop a procedure that maximizes the TPC and MA extraction rate and the antioxidant activity during the first stage of winemaking seems to be an A of 90% and a t of 4 min and 24 s. The use of high-power ultrasound in the winemaking process for the treatment of crushed grapes has proved to be a very promising and effective technique for the extraction of high-value bioactive compounds, with great potential for commercial use. For this reason, considering the optimal solution found in this study, our further research on the impact of ultrasound treatment will include an in-depth investigation related to the content of the individual polyphenolic compounds of samples during the winemaking process, namely grape must, maceration, fermentation and bottling, with the aim of reducing the maceration period and better managing the whole process.

Author Contributions

Conceptualization, A.M., V.P. and M.-A.P.; methodology, A.M. and V.P.; software, A.M.; validation, E.A, M.-A.P. and M.I.L.; formal analysis, M.-A.P., C.M.C., C.P., E.A. and C.B.; investigation, A.M., M.I.L., M.-A.P., C.M.C. and C.P.; resources, M.I.L.; data curation A.M., M.I.L. and C.M.C.; writing—original draft preparation, A.M., V.P., M.-A.P., M.I.L. and C.P.; writing—review and editing, A.M., E.A. and M.-A.P.; visualization, V.P.; supervision, A.M., E.A., M.-A.P. and V.P. All authors have read and agreed to the published version of the manuscript.

Funding

This research received no external funding.

Institutional Review Board Statement

Not applicable.

Informed Consent Statement

Not applicable.

Data Availability Statement

All related data and methods are presented in this paper. Additional inquiries should be addressed to the corresponding authors.

Acknowledgments

The authors acknowledge the technical support provided by the Transilvania University of Brasov, Faculty of Food and Tourism, and the Interdisciplinary Research Platform belonging to the University of Life Sciences “King Mihai I” from Timisoara.

Conflicts of Interest

The authors declare no conflict of interest.

References

  1. OIV. World Wine Production Outlook—OIV First Estimates. no. November. International Organisation of Vine and Wine, 2022; p. 1. Available online: https://www.oiv.int/public/medias/8553/en-oiv-2021-world-wine-production-first-estimates-to-update.pdf (accessed on 14 January 2023).
  2. Ntuli, R.G.; Saltman, Y.; Ponangi, R.; Jeffery, D.W.; Bindon, K.; Wilkinson, K.L. Impact of skin contact time, oak and tannin addition on the chemical composition, color stability and sensory profile of Merlot wines made from flash détente treatment. Food Chem. 2023, 405, 134849. [Google Scholar] [CrossRef]
  3. Zhang, Q.; Wang, T. Effect of ultrasound irradiation on the evolution of color properties and major phenolic compounds in wine during storage. Food Chem. 2017, 234, 372–380. [Google Scholar] [CrossRef] [PubMed]
  4. Huang, G.; Chen, S.; Dai, C.; Sun, L.; Sun, W.; Tang, Y.; Xiong, F.; He, R.; Ma, H. Effects of ultrasound on microbial growth and enzyme activity. Ultrason. Sonochem. 2017, 37, 144–149. [Google Scholar] [CrossRef]
  5. Zhang, X.; Zuo, Z.; Yu, P.; Li, T.; Guang, M.; Chen, Z.; Wang, L. Rice peptide nanoparticle as a bifunctional food-grade Pickering stabilizer prepared by ultrasonication: Structural characteristics, antioxidant activity, and emulsifying properties. Food Chem. 2021, 343, 128545. [Google Scholar] [CrossRef]
  6. Aekthammarat, D.; Tangsucharit, P.; Pannangpetch, P.; Sriwantana, T.; Sibmooh, N. Moringa oleifera leaf extract enhances endothelial nitric oxide production leading to relaxation of resistance artery and lowering of arterial blood pressure. Biomed. Pharmacother. 2020, 130, 110605. [Google Scholar] [CrossRef]
  7. Brenes, A.; Viveros, A.; Chamorro, S.; Arija, I. Use of polyphenol-rich grape by-products in monogastric nutrition. A review. Anim. Feed Sci. Technol. 2016, 211, 1–17. [Google Scholar] [CrossRef]
  8. Xia, E.Q.; Deng, G.F.; Guo, Y.J.; Bin Li, H. Biological activities of polyphenols from grapes. Int. J. Mol. Sci. 2010, 11, 622–646. [Google Scholar] [CrossRef] [PubMed]
  9. Kumar, L.; Tian, B.; Harrison, R. Interactions of Vitis vinifera L. cv. Pinot Noir grape anthocyanins with seed proanthocyanidins and their effect on wine color and phenolic composition. LWT 2022, 162, 113428. [Google Scholar] [CrossRef]
  10. Yusoff, I.M.; Mat Taher, Z.; Rahmat, Z.; Chua, L.S. A review of ultrasound-assisted extraction for plant bioactive compounds: Phenolics, flavonoids, thymols, saponins and proteins. Food Res. Int. 2022, 157, 111268. [Google Scholar] [CrossRef]
  11. Chemat, F.; Rombaut, N.; Meullemiestre, A.; Turk, M.; Perino, S.; Fabiano-Tixier, A.S.; Abert-Vian, M. Review of Green Food Processing techniques. Preservation, transformation, and extraction. Innov. Food Sci. Emerg. Technol. 2017, 41, 357–377. [Google Scholar] [CrossRef]
  12. Nie, V.; Chen, D.; Ye, J.; Lu, Y.; Dai, Z. Optimization and kinetic modeling of ultrasonic-assisted extraction of fucoxanthin from edible brown algae Sargassum fusiforme using green solvents. Ultrason. Sonochem. 2021, 77, 105671. [Google Scholar] [CrossRef] [PubMed]
  13. Chemat, F.; Rombaut, N.; Sicaire, A.G.; Meullemiestre, A.; Fabiano-Tixier, A.S.; Abert-Vian, M. Ultrasound assisted extraction of food and natural products. Mechanisms, techniques, combinations, protocols and applications. A review. Ultrason. Sonochem. 2017, 34, 540–560. [Google Scholar] [CrossRef] [PubMed]
  14. Pallarésa, N.; Lorenzo, J.; Munekata, P.; Barba, F. Ultrasound Processing: A Sustainable Alternative. In Sustainable Production Technology in Food, 1st ed.; Elsevier: Amsterdam, The Netherlands, 2021; pp. 155–164. [Google Scholar]
  15. Körzendörfer, A. Vibrations and ultrasound in food processing—Sources of vibrations, adverse effects, and beneficial applications—An overview. J. Food Eng. 2022, 324, 110875. [Google Scholar] [CrossRef]
  16. Cui, Q.; Wang, L.; Wang, G.; Zhang, A.; Wang, X.; Jiang, L. Ultrasonication effects on physicochemical and emulsifying properties of Cyperus esculentus seed (tiger nut) proteins. LWT 2021, 142, 110979. [Google Scholar] [CrossRef]
  17. Hadidi, M.; Ibarz, A.; Pagan, J. Optimisation and kinetic study of the ultrasonic-assisted extraction of total saponins from alfalfa (Medicago sativa) and its bioaccessibility using the response surface methodology. Food Chem. 2020, 309, 125786. [Google Scholar] [CrossRef] [PubMed]
  18. Paniwnyk, L. Applications of ultrasound in processing of liquid foods: A review. Ultrasonic Sonochem. 2017, 38, 794–806. [Google Scholar] [CrossRef] [PubMed]
  19. Chemat, M.; Khan, M.K. Applications of Ultrasound in Food Technology: Processing, Preservation and Extraction. Ultrasonics Sonochem. 2010, 18, 813–835. [Google Scholar] [CrossRef]
  20. Simancas, R.O.; Díaz-Maroto, M.C.; Alañón Pardo, M.E.; Pérez Porras, P.; Bautista-Ortín, A.B.; Gómez-Plaza, E.; Pérez-Coello, M.S. Effect of power ultrasound treatment on free and glycosidically-bound volatile compounds and the sensorial profile of red wines. Molecules 2021, 26, 1193. [Google Scholar] [CrossRef]
  21. Bautista-Ortin, A.B.; Jiménez-Martínez, M.D.; Jurado, R.; Iniesta, J.A.; Terrades, S.; Andrés, A.; Gómez-Plaza, E. Application of high-power ultrasounds during red wine vinification. Int. J. Food Sci. Technol. 2017, 52, 1314–1323. [Google Scholar] [CrossRef]
  22. Morata, A. Red Wine Technology, 1st ed.; Academic Press: Cambridge, MA, USA, 2019; pp. 210–248. [Google Scholar]
  23. International Organisation of Vine and Wine. International Code of Oenological Practices, 2022, no. 2022 Issue. Paris, France. Available online: https://www.oiv.int/public/medias/8672/code-2022-en.pdf (accessed on 10 December 2022).
  24. Poojary, M.M.; Barba, F.J.; Aliakbarian, B.; Francesco Donsì, F.; Pataro, G.; Daniel, A.; Dias, D.A.; Juliano, P. Innovative alternative technologies to extract carotenoids from microalgae and seaweeds. Mar. Drugs 2016, 14, 1–34. [Google Scholar] [CrossRef] [Green Version]
  25. Jamshaid, S.; Ahmed, D. Optimization of ultrasound-assisted extraction of valuable compounds from fruit of Melia azedarach with glycerol-choline chloride deep eutectic solvent. Sustain. Chem. Pharm. 2022, 29, 100827. [Google Scholar] [CrossRef]
  26. Anić, M.; Osrečak, M.; Andabaka, Z.; Tomaz, I.; Večenaj, V.; Jelić, D.; Kozina, B.; Kontić, J.K.; Karoglan, M. The effect of leaf removal on canopy microclimate, vine performance and grape phenolic composition of Merlot (Vitis vinifera L.) grapes in the continental part of Croatia. Sci. Hortic. 2021, 285, 110161. [Google Scholar] [CrossRef]
  27. Ferraretto, P.; Rolle, P.; Celotti, E. Applicazione degli ultrasuoni come tecnica innovativa per ottimizzare l’estrazione dei composti fenolici e favorire la lisi del lievito. Riv. Internet Vitic. Enol. 2011, 9, 1–10. [Google Scholar]
  28. Tiwari, B.K.; Patras, A.; Brunton, N.; Cullen, P.J.; Donnell, C.P.O. Effect of ultrasound processing on anthocyanins and color of red grape juice. Ultrason. Sonochem. 2010, 17, 598–604. [Google Scholar] [CrossRef] [PubMed]
  29. Natolino, A.; Celotti, E. Ultrasound treatment of red wine: Effect on polyphenols, mathematical modeling, and scale-up considerations. LWT 2022, 154, 112843. [Google Scholar] [CrossRef]
  30. Singleton, V.L.; Orthofer, R.; Lamuela-Raventos, R.M. Analysis of total phenols and other oxidation substrates and antioxidants by means of Folin-Ciocalteu reagent. Meth Enzym. 1999, 299, 152–178. [Google Scholar]
  31. Lee, J.; Durst, R.W.; Wrolstad, R.E. Determination of total monomeric anthocyanin pigment content of fruit juices, beverages, natural colorants, and wines by the pH differential method: Collaborative study. J. AOAC Int. 2005, 88, 1269–1278. [Google Scholar] [CrossRef] [PubMed] [Green Version]
  32. Benzie, I.F.; Strain, J.J. Ferric reducing ability of plasma (FRAP) as a measure of antioxidant power: The FRAP assay. Anal Biochem. 1996, 239, 70–76. [Google Scholar] [CrossRef] [Green Version]
  33. Kalita, D.; Jayanty, S.S. Comparison of Polyphenol Content and Antioxidant Capacity of Colored Potato Tubers, Pomegranate and Blueberries. J. Food Process Technol. 2014, 5, 358–364. [Google Scholar]
  34. Commission Regulation (EEC) No 2676/90 of 17 September 1990 Determining Community Methods for the Analysis of Wines (OJ L 272 03.10.1990). Available online: http://data.europa.eu/eli/reg/1990/2676/oj (accessed on 20 October 2022).
  35. Palma, M.; Barroso, C.G. Ultrasound-assisted extraction and determination of tartaric and malic acids from grapes and winemaking by-products. Anal. Chim. Acta 2002, 458, 119–130. [Google Scholar] [CrossRef]
  36. Mason, T.J.; Lorimer, J.P. Applied Sonochemistry: The Uses of Power Ultrasound in Chemistry and Processing; Wiley-VCH: Weinheim, Germany, 2002; pp. 15–43. [Google Scholar]
  37. Ferraretto, P.; Cacciola, V.; Ferran Batllo, I.; Celotti, E. Ultrasounds application in winemaking: Grape maceration and yeast lysis. Ital. J. Food Sci. 2013, 25, 160–168. [Google Scholar]
  38. Zhang, Q.; Shen, Y.; Fan, X.H.; Martin, J.F.G. Preliminary study of the effect of ultrasound on physicochemical properties of red wine. CyTA J. Food 2015, 14, 55–64. [Google Scholar] [CrossRef] [Green Version]
  39. Martin, J.F.G.; Sun, D.W. Ultrasound and electric fields as novel techniques for assisting the wine ageing process: The state-of-the-art research. Trends Food Sci. Technol. 2013, 33, 40–53. [Google Scholar] [CrossRef]
  40. Ćurko, N.; Tomašević, M.; Jambrak, A.R. The effect of high-power ultrasound on phenolic composition, chromatic characteristics, and aroma compounds of red wines. Croat. J. Food Sci. Technol. 2017, 9, 136–144. [Google Scholar] [CrossRef] [Green Version]
  41. Luo, H.; Schmid, F.; Grbin, P.R.; Jiranek, V. Viability of common wine spoilage organisms after exposure to high power ultrasonics. Ultrason. Sonochem. 2012, 19, 415–420. [Google Scholar] [CrossRef]
  42. Bosiljkov, T.; Dujmić, F.; Bubalo, M.C.; Hribar, J.; Vidrih, R.; Brnčić, M.; Zlatic, E.; Redovniković, I.R.; Jokić, S. Natural deep eutectic solvents and ultrasound-assisted extraction: Green approaches for extraction of wine lees anthocyanins. Food Bioprod. Process. 2017, 102, 195–203. [Google Scholar] [CrossRef]
  43. Drosou, C.; Kyriakopoulou, K.; Bimpilas, A.; Tsimogiannis, D.; Krokida, M. A comparative study on different extraction techniques to recover red grape pomace polyphenols from vinification byproducts. Ind. Crops Prod. 2015, 75, 141–149. [Google Scholar] [CrossRef]
  44. Roman, T.; Tonidandel, L.; Nicolini, G.; Bellantuono, E.; Barp, L.; Larcher, R.; Celotti, E. Evidence of the possible interaction between ultrasound and thiol precursors. Foods 2020, 9, 104. [Google Scholar] [CrossRef] [Green Version]
  45. Reche, C.; Rosselló, C.; Dalmau, E.; Eim, V.; Simal, S. Quantification of microstructural changes in artichoke by-products by image analysis after high-power ultrasound-assisted extraction of bioactive compounds. LWT 2022, 171, 114127. [Google Scholar] [CrossRef]
  46. Pérez-Porras, P.; Bautista-Ortín, A.B.; Jurado, R.; Gómez-Plaza, E. Using high-power ultrasounds in red winemaking: Effect of operating conditions on wine physico-chemical and chromatic characteristics. LWT 2021, 138, 110645. [Google Scholar] [CrossRef]
  47. Dzah, C.S.; Duan, Y.; Zhang, H.; Wen, C.; Zhang, J. The effects of ultrasound assisted extraction on yield, antioxidant, anticancer and antimicrobial activity of polyphenol extracts: A review. Food Biosci. 2020, 35, 100547. [Google Scholar] [CrossRef]
  48. Bi, J.; Yang, Q.; Sun, J.; Chen, J.; Zhang, J. Study on ultrasonic extraction technology and oxidation resistance of total flavonoids from peanut hull. Food Sci. Technol. Res. 2011, 17, 187–198. [Google Scholar] [CrossRef] [Green Version]
  49. Dai, J.; Mumper, R.J. Plant phenolics: Extraction, analysis and their antioxidant and anticancer properties. Molecules 2010, 15, 7313–7352. [Google Scholar] [CrossRef] [PubMed]
  50. Akowuah, G.A.; Mariam, A.; Chin, J.H. The effect of extraction temperature on total phenols and antioxidant activity of Gynura procumbens leaf. Pharmacogn. Mag. 2009, 5, 81–85. [Google Scholar]
  51. Havlikova, L.; Mikova, K. Heat Stability of Anthocyanins. Z. Leb. Forsch. 1985, 181, 427–432. [Google Scholar] [CrossRef]
  52. Jackman, R.L.; Yada, R.Y.; Tung, M.A.; Speers, R.A. Anthocyanins as food colorants—A review. J. Food Biochem. 1987, 11, 201–247. [Google Scholar] [CrossRef]
  53. Tao, Y.; Han, Y.; Liu, W.; Peng, L.; Wang, Y.; Kadam, S.; Show, P.L.; Ye, X. Parametric and phenomenological studies about ultrasound-enhanced biosorption of phenolics from fruit pomace extract by waste yeast. Ultrason. Sonochem. 2019, 52, 193–204. [Google Scholar] [CrossRef]
  54. Martínez-Ramos, T.; Benedito-Fort, J.; Watson, N.J.; Ruiz-López, I.I.; Che-Galicia, G.; Corona-Jiménez, E. Effect of solvent composition and its interaction with ultrasonic energy on the ultrasound-assisted extraction of phenolic compounds from Mango peels (Mangifera indica L.). Food Bioprod. Process. 2020, 122, 41–54. [Google Scholar] [CrossRef]
  55. Zainol, M.K.; Mohd Subri, I.; Zamri, A.I.; Mohd Zin, Z.; Fisal, A.; Mamat, H. Antioxidative properties and proximate analysis of spent coffee ground (SCG) extracted using ultrasonic-methanol assisted technique as a potential functional food ingredient. Food Res. 2020, 4, 636–644. [Google Scholar] [CrossRef]
  56. Antony, A.; Farid, M. Effect of Temperatures on Polyphenols during Extraction. Appl. Sci. 2022, 12, 2107. [Google Scholar] [CrossRef]
  57. Constantin, O.E.; Istrati, D.I. Extraction, Quantification and Characterization Techniques for Anthocyanin Compounds in Various Food Matrices—A Review. Horticulturae 2022, 8, 1084. [Google Scholar] [CrossRef]
  58. Chung, C.; Rojanasasithara, T.; Mutilangi, W.; McClements, D.J. Stabilization of natural colors and nutraceuticals: Inhibition of anthocyanin degradation in model beverages using polyphenols. Food Chem. 2016, 212, 596–603. [Google Scholar] [CrossRef]
  59. Cacace, J.E.; Mazza, G. Optimisation of extraction of anthocyanins from black currants with aqueous ethanol. J. Food Sci. 2006, 68, 240–248. [Google Scholar] [CrossRef]
  60. Ying, Z.; Han, X.; Li, J. Ultrasound-assisted extraction of polysaccharides from mulberry leaves. Food Chem. 2011, 127, 1273–1279. [Google Scholar] [CrossRef]
  61. Fu, X.; Wang, D.; Belwal, T.; Xie, J.; Xu, Y.; Li, L.; Zou, L.; Zhang, L.; Luo, Z. Natural deep eutectic solvent enhanced pulse-ultrasonication assisted extraction as a multi-stability protective and efficient green strategy to extract anthocyanin from blueberry pomace. LWT 2021, 144, 111220. [Google Scholar] [CrossRef]
  62. Zhang, L.; Fan, G.; Khan, M.A.; Yan, Z.; Beta, T. Ultrasonic-assisted enzymatic extraction and identification of anthocyanin components from mulberry wine residues. Food Chem. 2020, 323, 126714. [Google Scholar] [CrossRef]
  63. Huang, H.; Xu, Q.; Belwal, T.; Li, L.; Aalim, H.; Wu, Q.; Duan, Z.; Zhang, X.; Luo, Z. Ultrasonic impact on viscosity and extraction efficiency of polyethylene glycol: A greener approach for anthocyanins recovery from purple sweet potato. Food Chem. 2019, 283, 59–67. [Google Scholar] [CrossRef] [PubMed]
  64. Vaquero, M.J.R.; Alberto, M.R.; Nadra, M.C.M. Antibacterial effect of phenolic compounds from different wines. Food Control 2007, 18, 93–101. [Google Scholar] [CrossRef]
  65. Thaipong, K.; Boonprakob, U.; Crosby, K.; Cisneros-Zevallos, L.; Byrne, D.H. Comparison of ABTS, DPPH, FRAP, and ORAC assays for estimating antioxidant activity from guava fruit extracts. J. Food Compos. Anal. 2006, 19, 669–675. [Google Scholar] [CrossRef]
  66. Vasyliev, G.S.; Vorobyova, V.I.; Linyucheva, O.V. Evaluation of reducing ability and antioxidant activity of fruit pomace extracts by spectrophotometric and electrochemical methods. J. Anal. Methods Chem. 2020, 2020, 1–16. [Google Scholar] [CrossRef]
  67. Rajurkar, N.S.; Hande, S.M. Estimation of phytochemical content and antioxidant activity of some selected traditional Indian medicinal plants. Indian J. Pharm. Sci. 2011, 73, 146–151. [Google Scholar] [CrossRef] [Green Version]
  68. Dani, C.; Oliboni, L.S.; Vanderlinde, R.; Pra, D.; Dias, J.F.; Yoneama, M.L.; Bonatto, D.; Salvador, M.; Henriques, J.A.P. Antioxidant activity and phenolic and mineral content of rose grape juice. J. Med. Food 2009, 12, 188–192. [Google Scholar] [CrossRef] [PubMed] [Green Version]
  69. Negro, C.; Aprile, A.; Luvis, A.I.; De Bellis, L.; Miceli, A. Antioxidant activity and polyphenols characterization of four monovarietal grape pomaces from salento (Apulia, italy). Antioxidants 2021, 10, 1406. [Google Scholar] [CrossRef] [PubMed]
  70. Banc, R.; Socaciu, C.; Miere, D.; Filip, L.; Cozma, A.; Stanciu, O.; Loghin, F. Benefits of Wine Polyphenols on Human Health: A Review. Bull. UASVM Food Sci. Technol. 2014, 71, 79–87. [Google Scholar] [CrossRef] [Green Version]
  71. Lingua, M.S.; Fabani, M.P.; Wunderlin, D.A.; Baroni, M.V. From grape to wine: Changes in phenolic composition and its influence on antioxidant activity. Food Chem. 2016, 208, 228–238. [Google Scholar] [CrossRef] [PubMed]
  72. Fernández-Pachón, M.S.; Villaño, D.; García-Parrilla, M.C.; Troncoso, A.M. Antioxidant activity of wines and relation with their polyphenolic composition. Anal. Chim. Acta 2004, 513, 113–118. [Google Scholar] [CrossRef]
  73. Gismondi, A.; Marco, G.; di Canuti, L.; Canini, A. Antiradical activity of phenolic metabolites extracted from grapes of white and red Vitis vinifera L. cultivars. Vitis 2017, 56, 19–26. [Google Scholar]
  74. Rivero-Pérez, M.D.; Muñiz, P.; González-Sanjosé, M.L. Antioxidant Profile of Red Wines Evaluated by Total Antioxidant Capacity, Scavenger Activity, and Biomarkers of Oxidative Stress Methodologies. J. Agric. Food Chem. 2007, 55, 5476–5483. [Google Scholar] [CrossRef]
  75. Banc, R.; Loghin, F.; Miere, D.; Ranga, F.; Socaciu, C. Phenolic composition and antioxidant activity of red, rosé and white wines originating from Romanian grape cultivars. Not. Bot. Horti Agrobot. Cluj-Napoca 2020, 48, 716–734. [Google Scholar] [CrossRef]
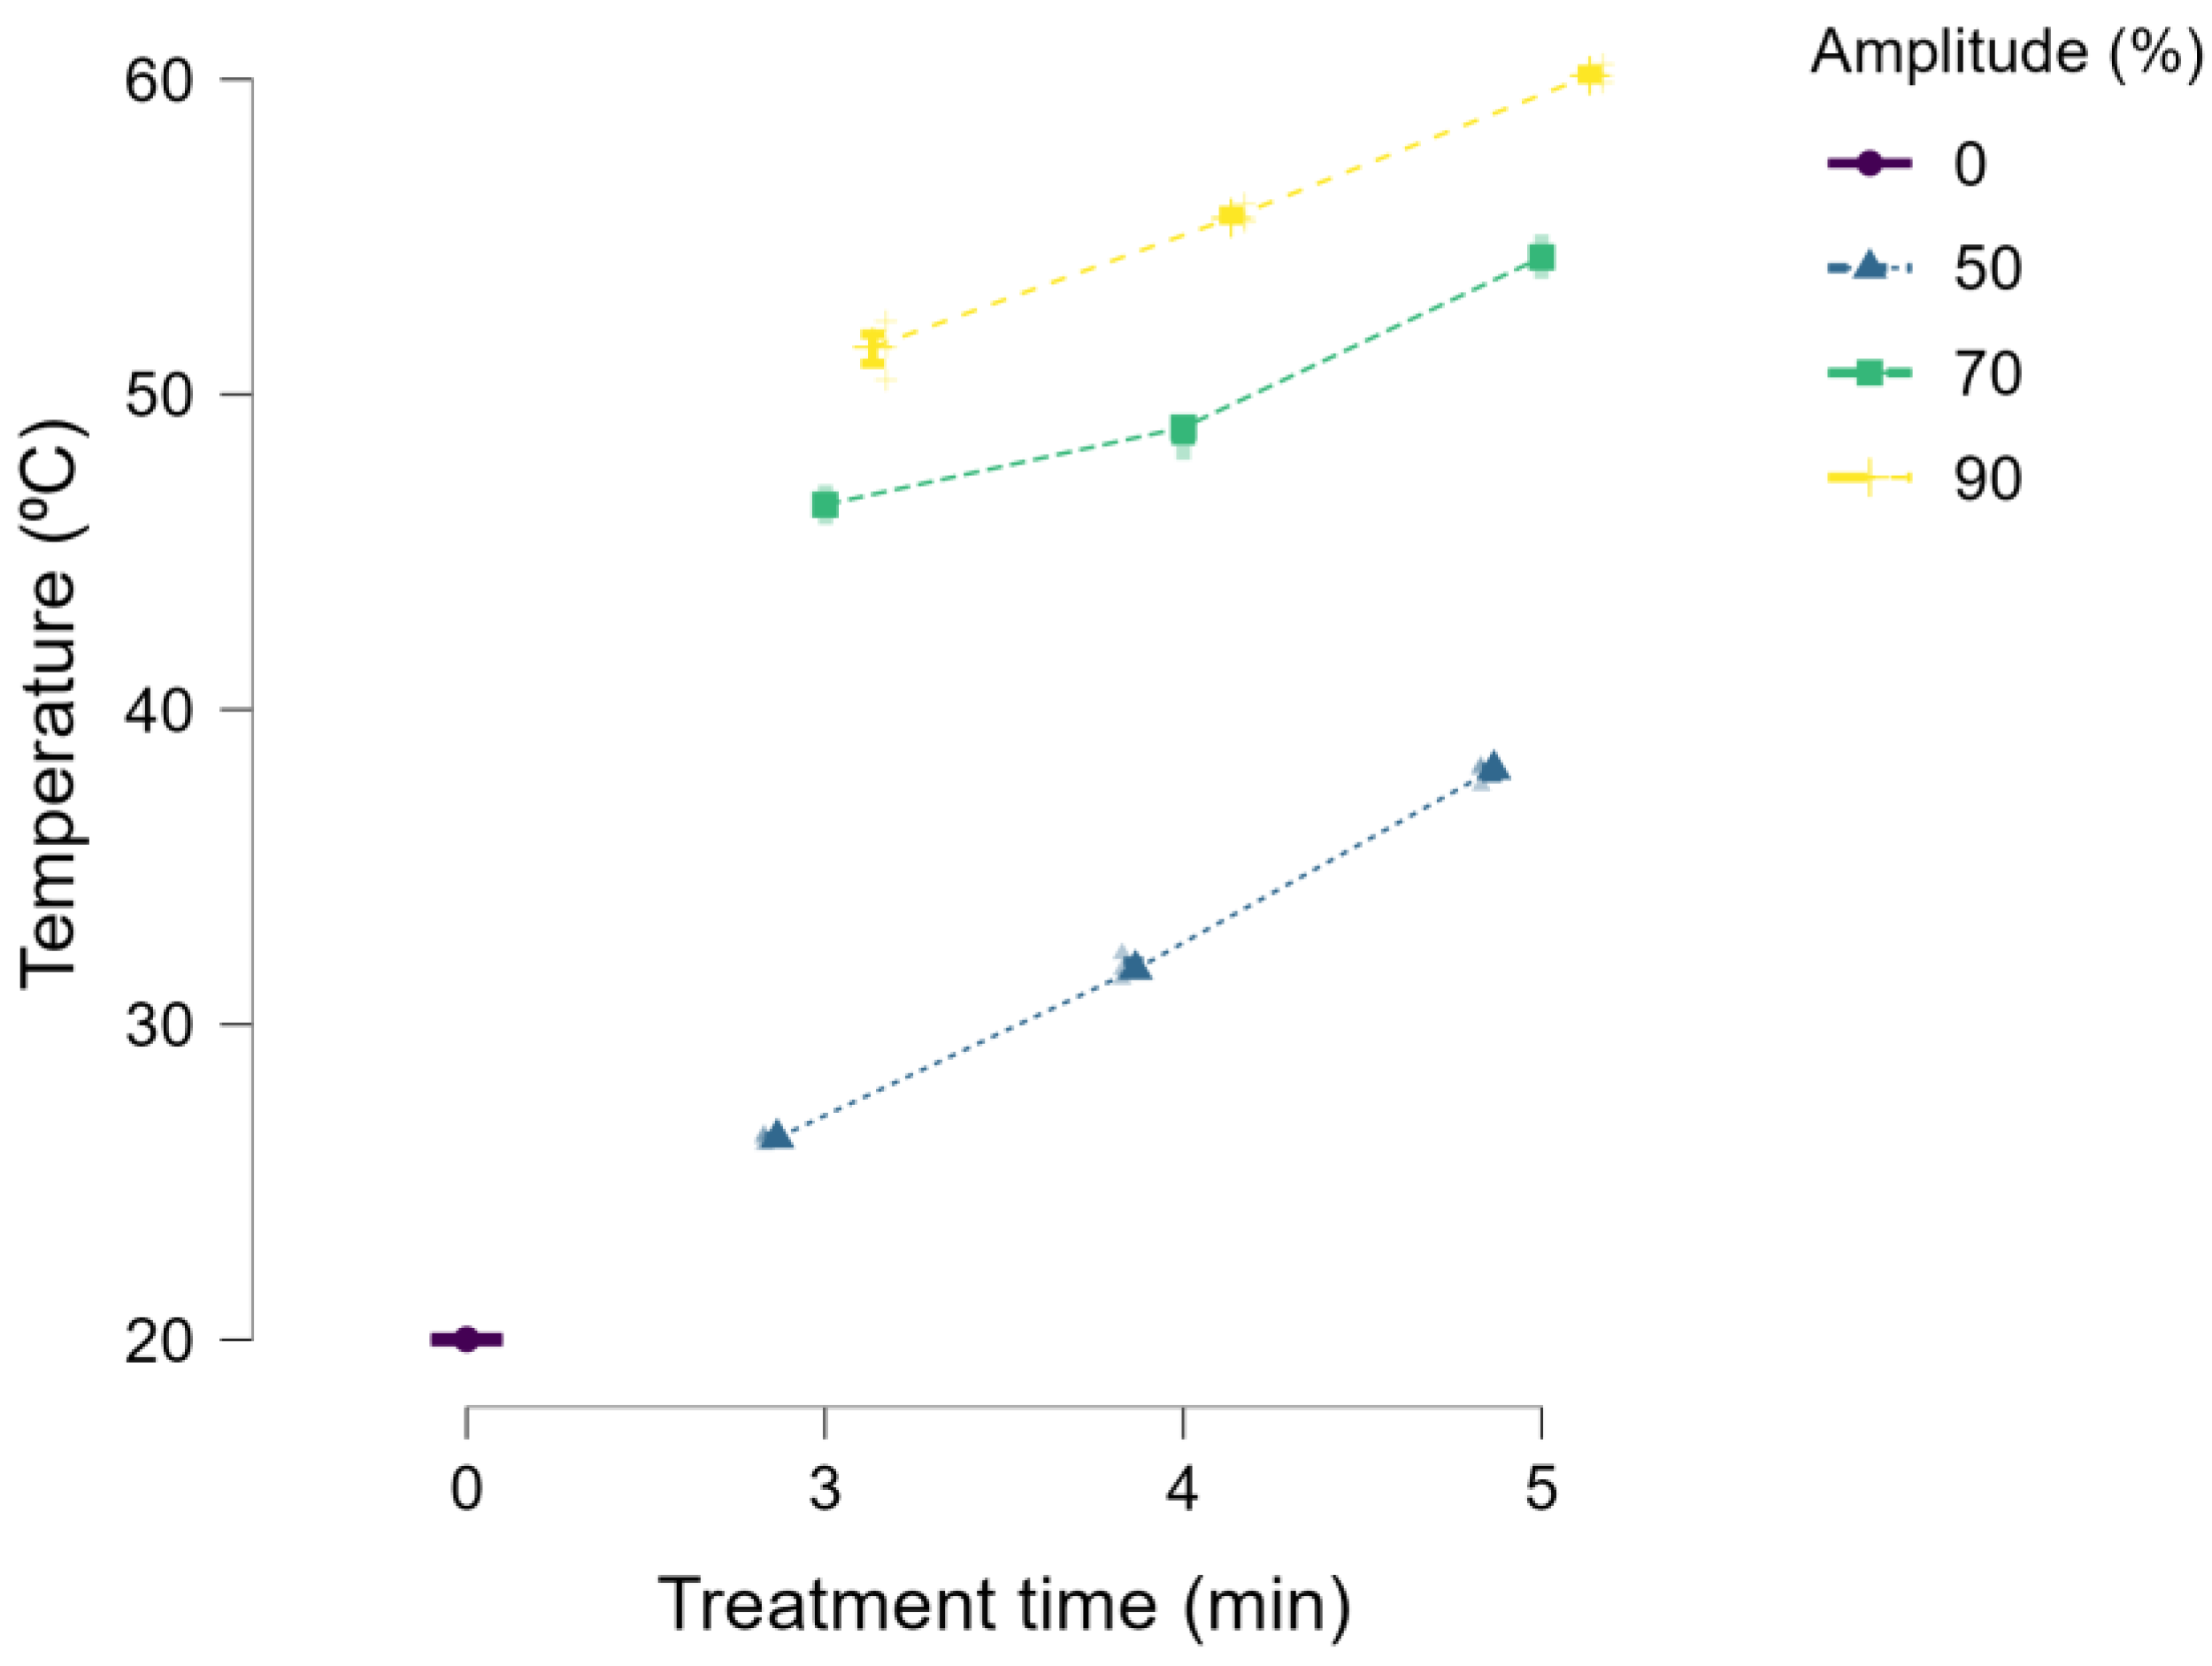
Figure 1. Changes in the temperature of the samples treated with US compared to the control sample (C).
Sustainability 15 06697 g001
Figure 2. Influence of the process parameters on the TPC: (a) amplitude (A) and time (B) as contour graph; (b) amplitude (A) and time (B) as 3D surface.
Sustainability 15 06697 g002
Figure 3. Influence of the process parameters on the MA: (a) amplitude (A) and time (B) as contour graph; (b) amplitude (A) and time (B) as 3D surface.
Sustainability 15 06697 g003
Figure 4. Influence of the process parameters on the antioxidant activity: (a) amplitude (A) and time (B) as contour graph for the FRAP values; (b) amplitude (A) and time (B) as the 3D surface for the FRAP values; (c) amplitude (A) and time (B) as the contour graph for the DPPH values; (d) amplitude (A) and time (B) as the 3D surface for the DPPH values.
Sustainability 15 06697 g004aSustainability 15 06697 g004b
Figure 5. Graphical view of the optimal solution: the optimal factor settings are shown as red bars and the optimal response predictions are shown in blue.
Sustainability 15 06697 g005
Figure 6. The numerical optimization plots for the optimal solution: (a) predicted value for the TPC; (b) predicted value for the MA; (c) predicted value for the FRAP; (d) predicted value for the DPPH.
Sustainability 15 06697 g006aSustainability 15 06697 g006b
Figure 7. The overlay graph for the optimal solution: the bright yellow color defines the acceptable factor settings and grey color defines the unacceptable factor settings.
Sustainability 15 06697 g007
Table 1. Ultrasonic extraction test treatment options.
Independent VariablesDependent Variables
Probe Diameter
(mm)
Frequency
(kHz)
Amplitude
(A) %
Treatment Time (t) min
1320503TPC
704MA
905FRAP
DPPH
Table 2. Design of the central composite experimental model and results.
Std OrderRun OrderFactorsResponses
A
(%)
B
(min)
TPC
(µg GAE/mL)
MA
(mg CGE/L)
FRAP
(µmol Fe2+/mL)
DPPH Scavenging Activity (%)
219031396.06 ± 5.23223.46 ± 2.3241.78 ± 2.25 74.5 ± 0.2
92704947.92 ± 3.79167.05 ± 1.4627.52 ± 1.2173.3 ± 0.6
13503124.5 ± 1.0120.67 ± 0.7215.02 ± 0.8366.8 ± 0.5
649041177.85 ± 4.87214.97 ± 2.36 42.96 ± 1.9875.9 ± 0.6
115704948.05 ± 4.56169.7 ± 1.5528.85 ± 1.0973.2 ± 0.3
56504136.4 ± 1.0825.49 ± 0.6516.09 ± 0.7868.2 ± 0.2
77703482.31 ± 3.82108.37 ± 1.0227.17 ± 0.9472.1 ± 0.5
489051172.1 ± 3.75176.29 ± 2.4548.32 ± 2.2377.2 ± 1.0
129704949.23 ± 3.98166.6 ± 1.4728.02 ± 0.7473.2 ± 0.9
1010704951.19 ± 4.56168.15 ± 1.6229.15 ± 1.1673.3 ± 0.8
311505148.3 ± 2.0426.22 ± 1.2318.68 ± 0.4371.1 ± 0.6
1312704950.24 ± 4.21167.24 ± 1.7427.97 ± 0.5473.4 ± 0.5
8137051126.11 ± 2.01137.74 ± 1.0329.97 ± 0.8173.5 ± 0.7
Amplitude (A); time (B); total polyphenol content (TPC); monomeric anthocyanins content (MA); antioxidant activity: FRAP and DPPH. The results are expressed as the mean value of the three replicates ± the standard deviation (SD).
Table 3. Characteristics of the red grape must.
SampleTSS
(° Brix)
TA
(g Tartaric Acid/L)
TPC
(µg GAE/mL)
MA
(mg CGE/L)
FRAP
(µmol Fe2+/mL)
DPPH Scavenging Activity (%)
C29.9 ± 0.13.4 ± 0.03114.42 ± 2.6716.06 ± 0.913.43 ± 1.0265.0 ± 0.4
Untreated red grape must (C); total soluble solids (TSS); total acidity (TA); total polyphenolic content (TCP); monomeric anthocyanins content (MA); antioxidant activity: FRAP and DPPH. The results are expressed as the mean value of the three replicates ± the standard deviation (SD).
Table 4. ANOVA and coefficient table for the quadratic model. Response 1: total phenolic compounds.
SourceF-Valuep-ValueR2Adjusted R2Coefficients
Model13.400.00180.90540.8378
Intercept 921.98
A60.330.0001 556.13
B1.070.3361 73.94
AB0.49890.5028 61.94
A23.470.1049 −196.5
B20.21930.6538 −49.42
Lack of fit36229.38<0.0001
Amplitude (A); time (B).
Table 5. ANOVA and coefficient table for the quadratic model. Response 2: monomeric anthocyanins.
SourceF-Valuep-ValueR2Adjusted R2Coefficients
Model44.35<0.00010.96940.9475
Intercept 162.77
A190.42<0.0001 90.39
B0.09720.7644 2.04
AB2.700.1444 –13.18
A29.710.0169 –30.08
B27.970.0257 –27.25
Lack of fit396.80<0.0001
Amplitude (A); time (B).
Table 6. ANOVA and coefficient table for the quadratic model. Response 3: antioxidant activity.
SourceF-Valuep-ValueR2Adjusted R2Coefficients
FRAPDPPHFRAPDPPHFRAPDPPHFRAPDPPHFRAPDPPH
Model330.1658.81<0.0001<0.00010.99580.97670.99280.9601
Intercept 28.1473.17
A1587.16246.65<0.0001<0.0001 13.883.58
B33.6837.650.00040.0005 2.171.40
AB2.852.050.13540.1954 0.7200–0.4000
A212.046.080.01040.0431 1.78–0.8293
B22.590.05560.15150.8203 0.8266–0.0793
Lack of fit2.40102.780.20850.0003
Amplitude (A); time (B).
Table 7. Confirmation table of the model.
Response DataTPC
(µg GAE/mL)
MA
(mg CGE/L)
FRAP
(µmol Fe2+/mL)
DPPH Scavenging Activity (%)
Observed1176.16210.5646.5576.5
Predicted1278.52212.6445.0976.31
Error (%)–8.70–0.993.140.25
Total polyphenol content (TPC); monomeric anthocyanins content (MA); antioxidant activity (FRAP).
Disclaimer/Publisher’s Note: The statements, opinions and data contained in all publications are solely those of the individual author(s) and contributor(s) and not of MDPI and/or the editor(s). MDPI and/or the editor(s) disclaim responsibility for any injury to people or property resulting from any ideas, methods, instructions or products referred to in the content.