Article

Eco-Friendly Design and Sustainability Assessments of Fibre-Reinforced High-Strength Concrete Structures Automated by Data-Driven Machine Learning Models

Department of Civil Engineering, School of Engineering, University of Birmingham, Edgbaston B15 2TT, UK
*
Author to whom correspondence should be addressed.
Sustainability 2023, 15(8), 6640; https://doi.org/10.3390/su15086640
Submission received: 14 March 2023 / Revised: 29 March 2023 / Accepted: 31 March 2023 / Published: 14 April 2023
(This article belongs to the Section Sustainable Materials)

Abstract

:
In recent years, adding fibres into brittle concrete to improve ductility has gained momentum in the construction industry. Despite the significant momentum, limitations do exist in design and industrial applications, contributing to the complexity of shear behaviours in fibre-reinforced concrete and the existing empirical models that can hardly provide a reasonable prediction, especially for high-strength concrete applications. A critical review reveals that current research mostly focuses on single eigenvalue analysis and pay less attention to the different synergetic effect of fibres on high-strength concrete and normal-strength concrete. This study aims to fill the research gap by the unprecedented use of reliable models for the prediction and evaluation of structural and sustainable properties of high-strength fibre-reinforced concrete beams. To this end, this study establishes three novel deep learning (ANN, BNN, and Xgboost) models for designing and optimising the shear capacity of ‘high-strength’ fibre-reinforced concrete beams towards the circular economy. In addition to introducing a new type of novel machine learning (BNN) model, which is capable of structural design and takes into account complex design features, our study also enhances sustainability by reducing greenhouse gas (GHG) emissions. The novel prediction models unprecedentedly elicit flexural capacity, structural stiffness, carbon emission, and price, together with the shear strength for high-strength fibre-reinforced structures. Firstly, this study focuses on multiple parameters for forecasting high-strength fibre-reinforced concrete beams. In addition, the models provide more comprehensive insights into the design and manufacture of high-strength steel fibre-reinforced concrete structures in a more environmentally friendly manner. With the help of the proposed models, it will be more cost-benefit and time-efficient for the researchers to obtain the optimum design with the consideration of both structural and sustainable performance. The established models exhibit excellent prediction accuracy, and the Bayesian neural network (BNN) is found to have the best performance: R2 is 0.937, MSE is 0.06 and MAE is 0.175 in shear strength prediction; R2 = 0.968, MSE is 0.040, and MAE is 0.110 in flexural capacity prediction; R2 is 0.907, MSE is 0.070, and MAE is 0.204 in shear stiffness prediction; R2 is 0.974, MSE is 0.022, and MAE is 0.063 in carbon emission prediction; and R2 is 0.977, MSE is 0.020, and MAE is 0.082 in price prediction.

1. Introduction

At present, high-strength concrete has been widely used in bridges, dams, high-rise buildings, and tunnels due to its superior performance in improving mechanical properties and economic benefits compared with normal-strength concrete [1]. Nevertheless, many engineers still do not thoroughly understand the behavioural differences among concrete classes, and the weakness of high-strength concrete cannot be ignored. High-strength concrete is more brittle than normal-strength concrete, and its limited ductility affects shear and flexural capacities [2]. In practice, there has been attempts to add artificial or natural fibres into all kinds of concrete, to not only improve the tensile strength of concrete but also strengthen part of the function of steel rebars in concrete [3]. Fibres include glass fibre, polymer fibre, basalt fibre, and steel fibre [4,5,6,7], of which industrial steel fibre, as the most popular one, has been generally used in suit applications.
Adding steel fibres to high-strength concrete can significantly improve the material properties in terms of tensile strength, flexural strength, toughness, ductility, and resistance to cracking and dynamic loading [8,9,10]. Previous laboratory tests showed that the addition of steel fibres resulted in the greatest increase in shear strength and ductility of reinforced concrete beams. Amin, et al. [11] pointed out that the use of a sufficient percentage (1–2%) of steel fibres can transform the brittle shear mechanism into a ductile flexural mechanism, which could further allow substantial energy dissipation. However, aiming to increase the performance of concrete, especially in improving strength, ductility, and durability, the use of cementitious materials in high-strength concrete is obliged to be increased compared to that of normal-strength concrete. According to the report by Luo, et al. [12], the combination of reinforced steel rebars and concrete contributes 65–75% of total carbon emissions in buildings, and that percentage will be increased in higher buildings. In this context, the more efficient use of materials with the aspect of structural design and sustainable design optimized for total cost and carbon footprint is essential.
In contemporary structural designs, to identify the shear behaviours and practical application of steel fibre in fibre-reinforced concrete beams, some empirical equations have been proposed based on experimental results and theoretical analysis. However, most studies tend to focus on the normal-strength fibre-reinforced concrete beam, while ignoring the synergetic effect between fibres and concrete, which changes with increasing compressive strength. Hence, Khuntia, et al. [13], Al-Ta’an, et al. [14], and Ashour, et al. [15] each proposed the calculation formula for high-strength fibre-reinforced concrete beams. Since the current empirical or semi-empirical formulations are developed based on narrow datasets, it is reasonable to develop a data-driven model for predicting shear strength of high-strength fibre-reinforced concrete beams.
Recently, machine learning (ML) techniques have witnessed massive research attention in civil fields such as structural design, concrete mixing, and material sciences [16]. Moreover, strong predictive and generalisation capabilities enable artificial intelligence (AI) models to find the latent relationship between key inputs and outputs. Zhang, et al. [17] used the Artificial Neural Network (ANN) model to predict the fly ash-based concrete, while Mangalathu, et al. [18] applied the Boosting Machine (Xgboost), which was developed based on the decision tree-based models, to predict failure mode of reinforced concrete shear walls. Moreover, Sandeep, et al. [19] reviewed the application of different machine learning models in predicting the shear strength of steel fibre-reinforced concrete beams. To be specific, the accuracy of ML-based algorithms mainly depends on the quantity and quality of the database used, and ANN, Xgboost, and RF models are observed to be depicting better performance for shear strength prediction [19]. This study tends to adopt different types of ML models to predict the performance of high-strength fibre-reinforced concrete beams in structural design and sustainable development, namely, ANN, Xgboost, and BNN.
After a brief review, we found that the most relevant studies focus on the normal strength concrete and single eigenvalue prediction (shear strength). In this context, this study focuses on using ML techniques to solve three key problems, which have not been identified: (a) high-strength concrete beams, (b) multi-parameters of structural performance, and (c) sustainable evaluation. Accordingly, this paper aims to demonstrate the feasibility of predicting the sustainable and structural performance of high-strength fibre-reinforced concrete beams by using the most popular ML models. To the author’s knowledge, there are no ML models focusing on the sustainable and structural analysis and design for high-strength concrete structures. All previous studies have placed an emphasis only on low-to-moderate-strength concrete. To fill this knowledge gap, this paper tends to provide a detailed analysis involving three algorithmic models. In addition, the main objective of this paper is to build a comprehensive analysis system for sustainable structural design and analysis, via ML models, to predict the performance of high-strength fibre-reinforced beams with the aspect of shear strength, flexural capacities, stiffness carbon emission, and cost budgets.

2. Literature Review

As described in the part of the introduction, an increasing number of engineers turned to the application of ML techniques in infrastructure analysis, mainly due to the low predicting effect of the traditional approaches, such as analytical models and finite element models, in predicting the structural performance. For example, Hoang [20] evaluated the system-level seismic response of concrete frame via locally weighted least-squares support vector machines for regression (LWLS-SVMR) models, and Feng, et al. [21] applied adaptive boosting (AdaBoost) algorithm in the classification of the bearing capacity of RC columns. Except for the structural analysis, the investment budget and environmental impact estimation are also attracted more attention in recent years. Yan, et al. [22] focused on the investment estimation of prefabricated concrete buildings based on the Xgboost technology, and Reddy, et al. [23] predicted the energy consumption with the Deep Neural Networks (DNN) model. After a brief review, we found that there are two key parameters considered mostly in the research field of using ML models in infrastructure application analysis: structural and sustainable performance.
Steel fibre-reinforced concrete beams are known for their enhanced post-cracking behaviour and energy absorption compared to plain concrete. The application of steel fibre in the construction industry has been increasing over the past three decades, and the field applications of steel fibre are airport runways, tunnel linings, bridge structures, and protective structures, to name a few. Because of the random distribution of steel fibre in concrete, the structural analysis with the traditional approaches is not reliable and has low prediction accuracy. In this context, many researchers have focused on using ML to predict the shear capacity of steel fibre-reinforced concrete beams with different ML models. Table 1 reviews the current studies about using ML models to predict the structural performance of steel fibre-reinforced concrete beams. Accordingly, Qian, et al. [24] developed several ML models to predict the flexural strength of ultra-high performance concrete and revealed that the gradient boosting (GB) algorithm is superior in precision with a low error rate. Similarly, Kang, et al. [25] consider two key parameters for steel fibre-reinforced concrete: compressive strength and flexural strength, and revealed that the Xgboost models have good prediction in the concrete performance. In addition, Table 1 also provides an overview of the relevant papers that focus on the shear strength prediction. The Gradient boosting regression tree model developed by A Shatnawi [26] showed better prediction ability than other proposed models. Similarly, Jesika Rahman [27] developed eleven ML models for the shear strength prediction and suggested using Xgboost, which outperformed the rest of the developed models.

2.1. Knowledge Gap

According to the Table 1, the current researchers focus on using different type of ML models to predict the shear capacity of steel fibre-reinforced concrete beams. However, the predicting ability of some current studies is not high enough, the R2 of testing dataset is only 0.739 in the research of Rahman, Ahmed, Khan, Islam and Mangalathu [27]. This is mainly due to the random datasets and without consideration of the difference between the high-strength concrete and normal-strength concrete datasets. Moreover, based on the existing research, it can be seen all research focuses on predicting the shear capacity of beams only. The simple evaluation of the shear strength of the steel fibre beam is an incomplete evaluation method, and it cannot explain the performance of beams in a comprehensive way. For a better understanding of beams, both the structural performance (flexural, shear capacity, and stiffness) and the material impact (investment budget and environmental impact) should be considered. Thus, several types of features related to structure and sustainability should be included. Therefore, to fill the gaps in this research field, this paper uses ML models to predict steel fibre-reinforced concrete beams with multiple features. This study mainly focuses on the several structural features of high-strength concrete and conducts an environmental and budgets assessment of fibre-reinforced beams to facilitate designers and researchers to balance between structural and sustainable design. Section 2.1.1, Section 2.1.2 and Section 2.1.3 described the difference with the previous related studies specifically.

2.1.1. High-Strength Concrete

Due to the wide application of ML models in predicting concrete performance, similarly, there are several shear predicting models have been proposed. However, the proposed formula focused on normal-strength concrete mostly. The difference between high-strength and normal-strength concrete beams can be revealed in three aspects. (A) The concrete performance: According to the introduction by El-Sayed, et al. [34], the high-strength concrete members exhibit different mechanical behaviours from the normal-strength concrete. Compared with normal-strength concrete, the increased compressive strength of HSC makes it more brittle and less resistive to crack opening and propagation [35], which means that the design equations for the structure with normal-strength concrete to be applied on high-strength concrete will lead to unconservative design. (B) The structural performance: Ashour, Hasanain and Wafa [15] demonstrated that the shear strength rigidity increased with increased compressive strength of the concrete. For the aspect of microstructure analysis in reinforced concrete beams, the application of high-strength concrete ensures similar strength between aggregate and concrete matrix. In that case, the contribution of aggregate interlock will be reduced due to the tendency of cracks to pass through instead of around the aggregates. Regarding the fibre performance, Boulekbache, et al. [36] compared the performance of steel fibre with high-strength concrete and normal-strength concrete and revealed that the addition of fibre will increase the improving efficiency of the bond characteristics.
According to Figure 1, the highest percentage of high-strength concrete beams in the published datasets have only 24.7%, and the maximum number of high-strength concrete beams is 71, which can hardly describe the shear performance of high-strength concrete beams. The dataset used in this study was sourced from published literature, and there is a total of 171 100% high-strength concrete beams gathered following an extensive review of pervious published work. The details of collected datasets are illustrated in Appendix A.

2.1.2. Structure Analysis

According to Eourcode 2, shear capacity is only one part of structural design. For a better understanding of the failure behaviours of concrete beams, flexural capacity and stiffness should be highlighted in the formula design and result analysis. It is well known that flexural performance plays an essential role in the structure design, and the contribution of additional fibre in the beam will be significant, as described by the result comparison between shear strength and flexural capacity. In the structural design, the stiffness of concrete beams plays an important role in the seismic performance of the whole structure mainly due to its significant effect on the determination of fundamental period, displacements, ductility factor, and distributed internal forces of structures [37]. In this study, there is a total of 171 high-strength beams, and three key structural design characteristics of beams: shear strength, flexural capacity, and stiffness, will be predicted by three ML methods.

2.1.3. Sustainable Development Analysis

Nowadays, growing attention has been given to an increasing number of issues related to sustainable structure design and full life-cycle assessments for building construction and material usage efficiency. In addition, as one of the most widely used structure types, reinforced-concrete structures should be given attention to as part of sustainable development analysis in this evolving paradigm, since they contribute 65–75% of total carbon emissions during the construction reported in [12]. For a better understanding of optimum design between structural performance and material cost of high strength of fibre-reinforced beam as well as an adverse effect on the environment, an individual database focusing on shear strength, flexural capacity, shear stiffness carbon emission, and cost must be created, to develop a better model for balancing the structural performance and sustainable development.

3. Research Methods

3.1. Equations Proposed in Published Literature

Since the use of steel fibre reinforcement helps to improve the tensile strength and toughness after cracking, and the tensile strength provided by steel fibre can potentially reduce or eliminate the stirrup reinforcement in the structure, there is an increasing trend to add the steel fibre in practical application [38]. However, most design criteria and formulas are developed based on the test results of normal-strength concrete. Song and Hwang [39] revealed that as the compressive strength increases, the synergy effect on fibres, cement, and aggregates would change, so that the equations used for normal-strength concrete could no longer be used to predict the mechanical properties of high-strength concrete. In this context, three formulas were proposed for individual high-strength fibre-reinforced concrete beams, and an empirical formula proposed based on the gene expression models will be described.

3.1.1. Formula Proposed by Khuntia et al.

Khuntia, Stojadinovic and Goel [13] proposed a simple analytical shear prediction model based on the ACI committee 381 [40]. The shear capacity of the steel fibre-reinforced beam can be divided into two parts: (1) The shear strength provided by concrete: v c (2) The shear strength provided by fibre: v f , v c , and v f can be expressed simply by the following equations:
v c = 0.167 f c k
v f = A β τ V f l f d f    
In the second equation, A is a nondimensional constant of 0.41; β is the fibre coefficient, which is taken as 1 for hooked or crimped steel fibre as suggested by Narayanan and Darwish [41]; τ is the bond stress, equal to 0.68 f c . In this case, the shear contribution of the fibres v f can be expressed as:
v f = A β τ V f l f d f = 0.41 × 0.68 × f c k × V f l f d f = 0.28 f c k V f l f d f
v f r c can be shown as:
v f r c = ( 0.167 α + 0.28 V f l f d f ) f c k
α is introduced as the arch action factor, equal to 2.5 d/a. The formula proposed by Khuntia, Stojadinovic and Goel [13]. The authors used a simplified equation that focuses on both normal- and high-strength steel fibre-reinforced beams. In addition, the prediction results have been verified.

3.1.2. Formula Proposed by Al-Ta’an et al.

Al-Ta’an and Al-Feel [14] collected the experimental results from 89 steel fibre-reinforced concrete beams, focusing on six parameters: (1) The compressive strength of concrete, (2) Shear span ratio (a/d),: (3) Volume of fibres( v f ), (4) Aspect ratio of fibre( l f d f ), (5) Fibre types, and (6) Reinforcement ratio ( ρ ) . [14] put forward the formula on the basis of regression analysis of 89 experimental results. Moreover, they emphasised the effect of interfacial bonding stress and suggested that an average value of 4.15 MPa could be used in the formula.
v f r c = ( 1.6 f c k + 960 ρ 1 d a e + 8.5 β V f l f d f ) / 9
e is a dimensionless factor, which can be calculated by the following equations:
e = 1.0 when a/d > 2.5
e = 2.5   d / a when a/d < 2.5
The expressions based on variable test beams and regression analysis are more accurate than other formulations.

3.1.3. Formula Proposed by Ashour et al.

Ashour, Hasanain and Wafa [15] developed a shear capacity formula based on regression analysis, with a focus on the shear capacity contribution of concrete compressive strength and shear span ratio:
v f r c = 2.11 f c k + 7 V f l f d f d a + 17.2 ρ d a   For   a / d   >   2.5
v f r c = 0.7 f c k + 7 V f l f d f d a + 17.2 ρ d a 2.5 a d + 0.41 τ V f l f d f   For   a / d   <   2.5
This formula shows good prediction ability on their test beams for both normal- and high-strength concrete beams while underestimating the contribution of fibre to the prediction results of low reinforcement ratio (<0.37%) beams and the experiment.

3.1.4. Formula Proposed by Kara

Kara [31] developed an empirical formula based on gene expression models, in which a total of 101 beams were selected for data-driven analysis. The formula is as follows:
v f r c = ρ l d c 0 c 1 ( d a ) 3 + F 1 d 0.25 c 2 + c 3 0.5 f c k ( d ) 0.5
In this formula, c 0 = 3.324, c 1 = 0.909, c 2 = 2.289, and c 3 = 9.436. The formula proposed by Kara [31] is more accurate than other formulations based on more than 101 datasets and ML models. However, the formula focuses on both normal- and high-strength concrete with limited datasets.
According to the proposed model in Table 2, the most relevant parameters for shear capacity are (a) Compressive strength of concrete, (b) Shear span ratio, (c) Volume of fibres (d) Aspect ratio of fibre, (e) Fibre types, and (f) Reinforcement ratio. Although some researchers attempted to use formulas to show the effect of steel fibre in improving the shear strength with experiments, due to the various types of fibre and limited tested beams, the classical models about the shear capacity of fibre-reinforced concrete are less reliable and relatively conservative. In this study, the shear capacity of high-strength steel fibre-reinforced beam is investigated through research available. Moreover, three new ML models are proposed and verified to quantitively describe the shear capacity of steel fibre-reinforced concrete, with consideration to the eight key parameters and adding the effect of dimension factor (size of cross-section) served as the input parameters.

3.2. Machine Learning Models

With the increasing demand for accurate and effective prediction methods of concrete mechanical properties, ML models have been extensively adopted in relevant research. For instance, ML techniques help to find the relationship between key input parameters and results without complicated mechanics derivation, usually with higher precision and lower variation. The most powerful ML methods, namely, ANN, Xgboots, and BNN, are to be analysed and compared in this paper.

3.2.1. ANN Model

As a well-known mathematical model, Artificial Neural Network (ANN) is inspired by the biological neural network system of the human brain, which has been widely used in the prediction of concrete mechanical properties [42]. The structure of the ANN model, similar to that of a human neural network, consists of input layers, hidden layers, and output layers [43]. The adaptive weight coefficient (w) plays an important role in the calculation process, which ensures the transfer of information from the input layer to the output layer. Equation (9) aims to describe the correlation between the inputs and weight coefficient [44]:
n e t j = i = 1 n w i j × x i + b j
In this formula, n e t j is the unit that computes the total weighted input; x i is the unit of the previous layer; w i j is the weight of the connection between the previous layer and the current layer; and b j is the bias of the current layer. In this study, the hidden layers are setted as (100, 20, 20).

3.2.2. Xgboost Model

The Boosting Tree algorithm is developed on the basis of the decision trees, which perform well in terms of statistical learning. Extreme gradient boosting (Xgboost), proposed by Chen and Guestrin [45], is chosen for its high accuracy and low risk of overfitting, with the application of a boosting algorithm. Moreover, the Xgboost model shows better performance when being applied in small datasets [45], which can be expressed as follows [46]:
f t ( x i ) = ω q x i
y ^ i T = y ^ i 0 + t = 1 T f t ( x i )
In brief, the main calculation process of Xgboost is an accumulation of iterative results after T times, as shown in Equations (11) and (12), where i is the number of samples; T is the number of decision trees, and i the final predicted value of the ith sample in the decision tree with number T. The function represents the calculation formula of the ith sample in the T decision tree. Equation (8) is the weight vector corresponding to the leaf node, which is a function of the feature vector mapped to the leaf node of the decision tree. For a better prediction ability, the number of 500 trees, 0.1 learning rate, and 0.01 gamma are selected in the Xgboost model.

3.2.3. BNN Model

Similar to ANN models, the Bayesian Neural Network (BNN) simulates the data process in the human brain. However, the objective of BNN models is to infer a posterior distribution p(w|D) over the weight(w) of the model after observing the data’s most probable parameter values in the Bayesian framework. In addition, the neural learning process is assigned a probabilistic interpretation, which is given by the following formulas for data preparation:
S w = β E D + α E w
E w w = i = 1 m w i 2 2
where m is the total number of parameters in the network. α and β are termed hyper-parameters (regularization parameters). The second step is to achieve the prior beliefs of Bayes theorem to influence posterior beliefs ( p w | D ,   α , β , A , which states that:
p ( w | D ,   α , β , A = p ( D |   w , β , A p ( w |   α , A p ( D |   α , β , A = p ( D |   w , β , A p ( w |   α , A p ( D |   α , β , A p ( w |   α , A
where the p ( w |   α , A is the prior and the p ( D |   α , β , A =   p ( D |   α , β , A p ( w |   α , A is the evidence, the probability distribution p ( D |   w , β , A called likelihood, which represents the uncertainty on the datasets and simulates the side-effect of noise process. The building code of BNN models is based on the Torchbnn, and the hidden layers are settled as (50,100,100). The prior 0.01 and weight 0.1 are selected in this study.

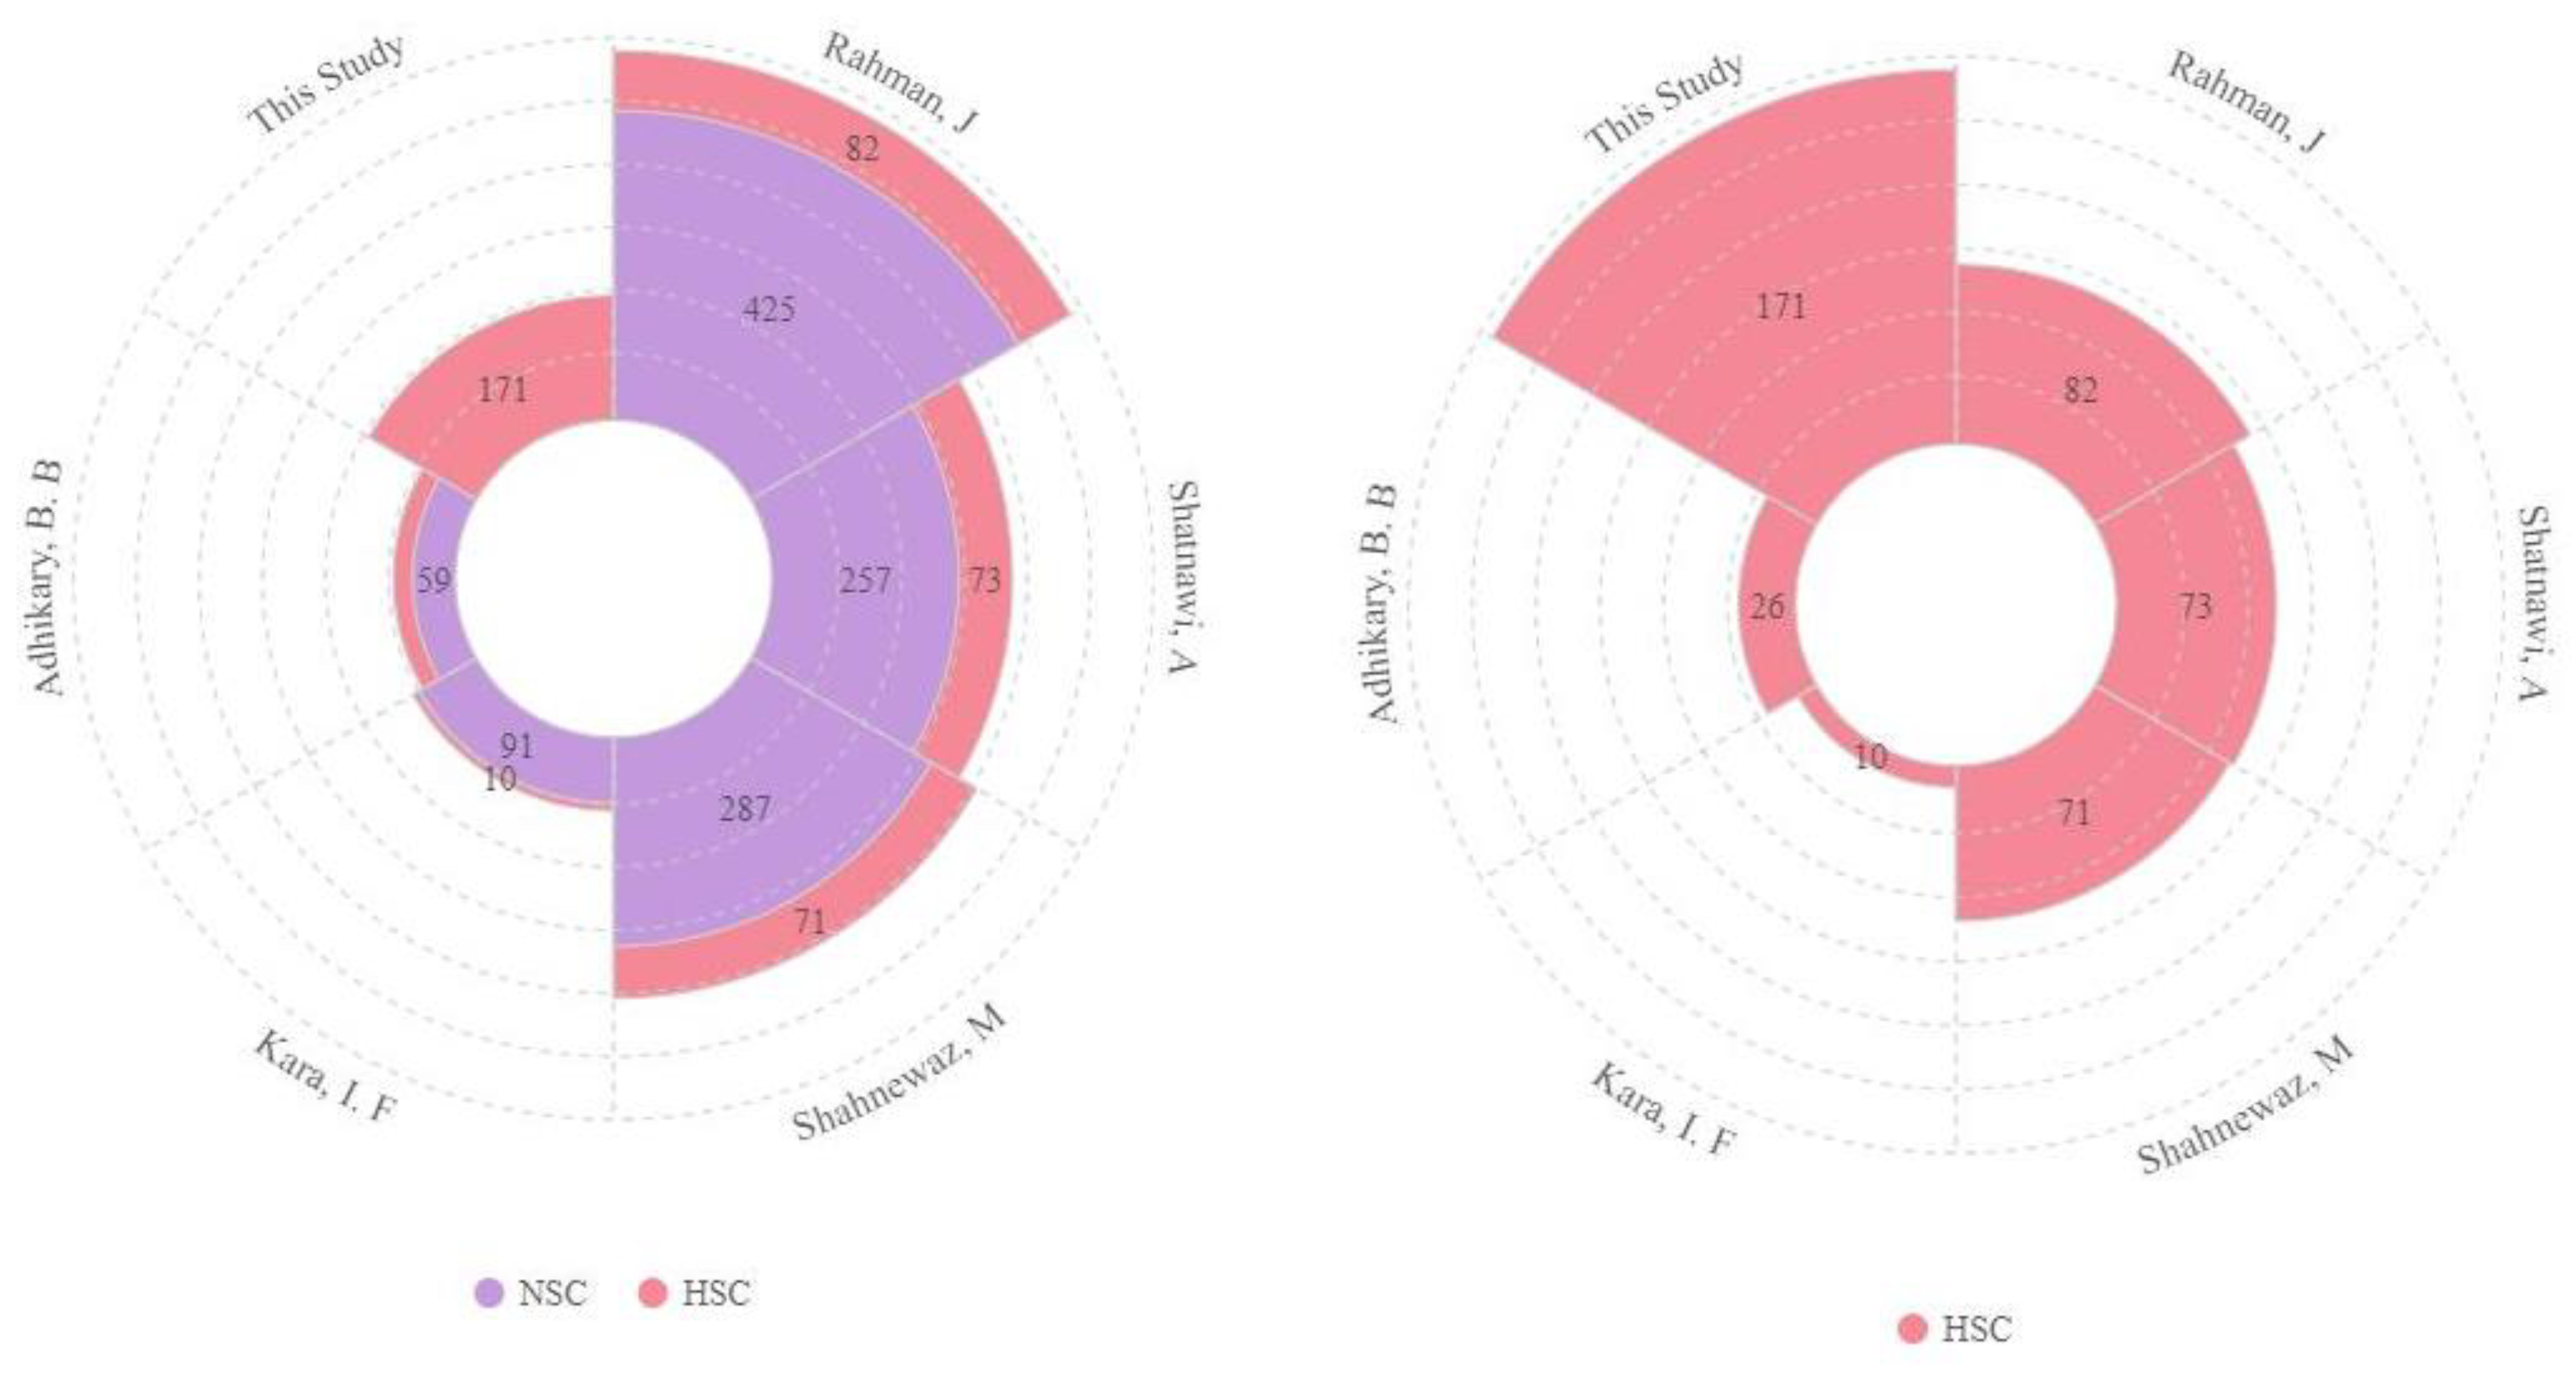
3.3. Data Preparation

The data used in this paper are gathered from published literature, in which a total of 171 beams are selected for data analysis. A total of 171 beams are selected for the prediction of the shear strength and flexural capacity, while 118 beams are selected to predict stiffness. According to ACI 363, concrete with a compressive strength of 55 MPa or higher can be defined as high-strength concrete. In this paper, to ensure the continuity and breadth of the datasets, a few beams with compressive strength lower than 55 MPa are also included in the database. Table 3 summarises the basic parameters and information of the datasets as well as the details, as shown in Table A1.

3.4. Sustainable Development Analysis

Currently, much attention has been paid to an increasing number of issues related to sustainable structure design and full life-cycle assessments for building construction and material usage efficiency. Moreover, as one of the most widely used structure types, reinforced-concrete structures should be paid attention to as part of sustainable development analysis in this evolving paradigm, since they contribute 65–75% of total carbon emissions during the construction described in [12]. For a better understanding of optimum design between structure performance and material cost of high-strength of fibre-reinforced beam as well as an adverse effect on the environment, an individual database focusing on shear strength, flexural capacity, shear stiffness carbon emission, and cost must be created, to develop a better model for balancing the structural performance and sustainable development.
To develop ML models, this study uses the Scikit-Learn and Torchbnn codes based on Python modules. The datasets are divided into two parts, 70% for the training dataset and 30% for the test dataset. Furthermore, the statistical standardisation method is adopted to normalise the inputs and outputs, with the purpose of improving the learning efficiency of the ML model. Data standardisation is the distribution of attributes between a mean of zero and a standard deviation of one (unit variance), expressed as the following formula:
y ^ = y μ σ
where µ is the mean value and σ is the standard deviation of the datasets. To identify the predictive accuracy of each ML model, three common metrics used are R-Squared (R2), Mean Absolute Error (MAE), and Mean Squared Error (MSE). R2 represents the ratio of the variance in the dependent variable from the independent variables, which aims to evaluate the correlation between inputs and outputs. Moreover, the higher predicting ability of the model can be evaluated when the R2 is close to 1; MAE is the mean of the absolute value of the error, which is commonly used to measure the accuracy of predicted values; MSE is the mean of the squared value of the error, which is used as a default metric to evaluate the performance of most regression algorithms. MSE was used to identify the percentage of outliers in datasets. The higher MSE received, the more outliers were included in the datasets, mainly due to the squaring part of the function magnifying the error [47]. Different from the function of MSE that was used to highlight outliers in datasets, MAE aims to provide a generic and comprehensive performance measure for the models because its smooths out all the errors of possible outliers [48]. Normally, lower MSE and MAE values indicate better predicting ability of the models. The formulas of these statistical criteria are illustrated below:
R 2 = 1 i = 1 N ( y i y ^ ) 2 i = 1 N ( y i y ¯ ) 2
M A E = 1 N   i = 1 N y i y ^
M S E = 1 N   i = 1 N ( y i y ^ ) 2
where y ¯ is the averaged value, y ^ is the predicted value and y i   is the actual value. In addition to the output of shear strength, to provide a comprehensive analysis of shear strength design based on Eurocode 2, the flexural capacity and stiffness of high-strength fibre-reinforced concrete beams have been added as outputs using the same datasets, which are to be compared with each other. For a better understanding of the working principle of the proposed approach, Figure 2 was built.

4. Research Analysis

4.1. Predicting the Shear Strength

There are three well-established ML models were employed to predict the shear strength of high-strength concrete beams investigated in this chapter. Table 4 compares the statistical results of different ML models used to predict the shear strength, while Figure 3 graphically shows the comparison between predicted values and experimental values for the three models with total datasets. The light purple points and lines represent the experimental values with total datasets, while the green lines show the predicted values.. Furthermore, to better understand the deviation between the predicted value and the actual value, the error value is plotted on the secondary axis.
Depending on the reported statistical results in Table 3, the ANN model shows the better performance in predicting shear strength than other models, where R2 (0.981, 0.888, and 0.949), MSE (0.017, 0.095, and 0.044), and MAE (0.102, 0.226, and 0.151) for the training, test, and total datasets, respectively. However, most models used to predict shear strength can achieve reasonable R2 (>0.86) with the total dataset. For the training phase, the Xgboost model has the highest prediction accuracy, with the highest R2 value (0.992) and lowest MSE (0.008 MPa). However, the Xgboost models show lower prediction ability than ANN and BNN models with the use of total datasets according to statistical criteria. That is due to the Xgboosts models having better predicting ability in applying simple normalization to the tabular data. However, if there is a lot of noisy information in the datasets, neural networks will outperform. As for shear strength prediction on all datasets, the three models achieve high R2 values of 0.869, 0.949 and 0.937 for Xgboost, ANN, and BNN, respectively. As shown in Figure 3, the prediction error of the ANN model ranges from 0.002 MPa to 2.307 MPa. Nonetheless, 80.7% of prediction errors are lower than 0.5 MPa, 16.4% of prediction errors fall between 0.5 and 1 MPa, and only 3% of errors are above 1 MPa. It is noteworthy that all three models achieve excellent prediction results (although ANN performs better), suggesting that each model can identify the underlying patterns in the training data.

4.2. Predicting the Flexural Capacity

According to the structural design of Eurocode 2, the flexural capacity plays an important part in the design to avoid shear failure. To provide a comprehensive design presentation, the flexural capacity is introduced as another output, which is calculated by Response 2000 developed by Bentz E. C at the University of Toronto [49]. Three models, identical to those for predicting shear strength, are used to predict flexural capacity. Table 5 compares the different prediction results of three models, and Figure 4 shows the prediction errors of the ML prediction models with total datasets.
Generally, all models perform well in predicting flexural capacity. To be specific, the BNN model shows better prediction performance than other models, in which R2 is 0.968, MSE is 0.029, and MAE is 0.074; while the worst one is the Xgboost model, where R2 is 0.858, MSE is 0.111, and MAE is 0.112. However, all models show that the R2 of training effects is higher than 0.9. For the Xgboost model, the prediction results are very close to the actual results in the training dataset, with an MAE of 0.003. When comparing the BNN and Xgboost models, it is obvious that the former one offers the higher level of prediction accuracy, with R2 above 0.9 for the total dataset. Moreover, the Xgboost model shows good performance in the training process but weak in the testing process, which is due to the noisy information in the datasets. As shown in Figure 4, the BNN and ANN models generally minimize the error. The most prediction errors are below 50 N·m: 91.2% for the BNN model, 87.7% for the Xgboost model, and 91.8% for the ANN model.

4.3. Predicting the Shear Stiffness

To better understand the shear analysis, the load displacement is applied in most experiments. In addition, the gradient of the load–deflection relationship is an indicator of beam stiffness [50], suggesting that the slope of the curve represents the relative stiffness of the structure. To provide a comprehensive design presentation, the shear stiffness established from the load–displacement curve is introduced as an output. A total of 117 beams including the outputs of shear stiffness are used as the datasets. Table 6 shows the results of the three ML models, and Figure 5 graphically depicts the ML models with total datasets.
Table 6 shows the prediction results of the shear stiffness of high-strength concrete beams with different models. For the three algorithms, the prediction and experimental results of the training set are relatively close. Specifically, the accuracy of the BNN model characterised by R2 of the total database is still the highest, followed by the ANN and Xgboost models. Analysis of the training set reveals that the Xgboost models perform well in finding the potential relationship between inputs and outputs, while the generalisation ability of the Xgboost model drops sharply in testing datasets. Figure 5 compares the evaluation and experimental results of the three models, showing similar changing trends. However, when comparing the prediction performance of total datasets, R2 of the BNN model is 0.907, similar to that of the training and testing sets; while R2 of the Xgboost total dataset is only 0.714, suggesting that the Xgboost model is better to describe the potential relationship of a given database, but its generalisation ability is poor. The mean error distributions are 5.2 kN/mm (ANN), 8.05 kN/mm (Xgboost), and 4.65 kN/mm (BNN), respectively. Moreover, only a few of the calculated errors are larger than 10 kN/mm, which are 9.8% (ANN), 26.8% (Xgboost), and 7.69% (BNN).

4.4. ML Models versus Proposed Formulas

This section compares the prediction abilities of ML models adopted in this paper and equations used in previous studies. There are three equations proposed by experimental results and one equation calculated by ML models for comparison purposes. A scatter plot, as one of the informative graphical presentations, is used for examining the aptitude of prediction models in this study. Figure 6 illustrates the comparison between the prediction values and the experimental results of the prediction formula. In addition, a statistical comparison between ML models and proposed formulas is summarised in Table 7.
To identify the performances of models and empirical equations, several ideal conditions are considered, such as mean, average absolute error, standard deviation, and the χ factor (inversed slope of linear least square regression of the predicted capacity versus experimental capacity). Among them, a value of χ greater than 1.00 indicates that the formula underestimates the shear capacity; whereas a value of χ smaller than 1.00 suggests that the model overestimates the shear capacity. Moreover, the minimum value of AAE illustrates that the developed model has reached a satisfactory level of accuracy. As seen from Figure 6, the χ factor of formulas developed based on Ashour models is closer to 1.00, showing better prediction ability than Kara’s empirical equations, which used the gene expression ML models. That is because there are many normal-strength concrete beams used in the datasets of Kara, and Kara formulas focus on both high- and normal-strength beams, which makes it challenging to determine the impact of compressive strength in improving the shear capacity. The AAE value obtained from the Ashour formula is the lowest among all the formulations in previous research. Of the previously proposed formulations, the equations developed by Ashour give the most accurate predictions represented by the χ factor of 0.9579; whereas the equations proposed by Khuntia exhibit the poorest performance, with the χ value of 1.5153 and a high AAE value of 43.4%. A possible reason is that the proposed formulas are developed according to their own experimental results, which are limited and fail to describe the effect of dimension. To highlight the predictive abilities of ML models, three ML models (ANN, Xgboost, and BNN) are compared with the proposed formulas. The details are shown in Figure 6, and the results are summarised in Table 7.
The upper left figure shows the prediction results of Kara I F formula, the upper right picture shows Al-Ta’an formula, the lower left figure shows Ashour formula, and the lower right figure shows Khuntia formula. In Figure 6, the model developed on the basis of the Xgboost model shows a χ value of 1.0044, closer to 1, while the corresponding values of SD, COV, and AAE are 0.10, 10%, and 5%, respectively. Despite Xgboost models showing less χ value than other models, the previous study has shown that R2 value still lower than neural network models due to its poor generalisation ability. Moreover, when comparing the ANN and BNN models, the BNN models showed better generalisation ability and outperform with noisy information, which have χ value (0.9579) higher than ANN models (0.9299) and have minimum AAE value (0.103). All ML models in this paper show better performance than empirical equations when being compared with the equations in previous research. Presently, there are still some gaps between the Ashour formula and the models adopted in this paper, mainly due to the limited datasets. After comparing Figure 6 and Figure 7, for a comprehensive analysis, the BNN model shows better performance than other models in this study, which not only has good performance in beam performance prediction but also outperforms with noisy information. Therefore, a conclusion can be drawn that the proposed model based on the BNN algorithm outperforms all other ML methods proposed in this paper, as well as the models reviewed in the existing studies.

5. Sensitivity Analysis with Shapley Additive Explanations (SHAP)

For a better understanding of the potential relationship between each input and output, the Shapley Additive Explanations (SHAP) technique, one of the in-depth ML model explanations, is used in this study. The SHAP explanation is developed based on game theory, which explains each instance prediction ability by calculating all input features. To evaluate the importance of different inputs, the ϕ j f is used to assign a weight against the summation of the contribution of the input features of the output features across all potential [51]. Equation (19) aims to describe the expression for ϕ j f .
ϕ j f = S x 1 , , x p / x j S ! p S 1 ! p ! f S x j f S
where the S is the features subset, x j is the input j, and p is the number of input variables models.
In this method, the predicting ability of each input can be evaluated by quantifying the estimation errors. To describe original model f x , the explanation models g x with inputs x j is used in Equation (20)
f x = g x = ϕ 0 + i = 1 M ϕ i x i  
where M is the number of inputs features and ϕ i is the no information constant.
In this study, the SHAP method was applied to the model built by BNN models because of BNN models’ optimized performance against other models. Figure 8 describes the SHAP values with shear strength, flexural capacity, and shear stiffness with BNN predicting models.
Based on the absolute value of SHAP for the shear strength predicting BNN model, the importance of the input variables can be ordered as: Shear Span > Longitudinal Ratio > Dimension Factors > Fibre Factors > Compressive Strength for the shear strength prediction. Similarly, the shear span shows the highest potential relationship with shear stiffness. However, the longitudinal ratio is higher than other input parameters that play key roles in the prediction of stiffness, indicating that amount of steel rebars in the reinforced-concrete structure is the crucial factor affecting the stiffness. The top two SHAP values to predict flexural are width and depth, which highlight the role of dimension in the prediction of flexural strength. In contrast, the SHAP parameters related to fibre effects, such as fibre type, fibre content, and aspect ratio, are ranked after 5th. It can be seen clearly that stiffness is most sensitive to longitudinal ratio, fibre factor, and compressive strength, suggesting that stiffness is determined by the synergetic effect between concrete, fibres and steel rebar.

6. Sustainability Assessments

Nowadays, the balance of sustainable development and structural performance in the life cycle of the building structure is one of the most important elements affecting sustainable structural design. The previous section developed three reliable ML prediction models for structural design, and this section continues to evaluate the prediction ability of ANN, BNN, and Xgboost models in carbon emissions and cost budget prediction. Moreover, it is beneficial for the future designer to obtain the optimum design and save time for a better understanding of balancing the structural performance and sustainable development design based on the two types of ML prediction models proposed in this study.

6.1. Greenhouse Gas Emission and Cost Budgets

Cement is the most widely used construction material worldwide, and there are more than 4 billion tons of cement produced with a rapid increase, which intends to meet an increasing need in construction. However, the greenhouse gas (GHG) emissions from the increasing need for cement in construction will result in notable environmental impacts worldwide, which should not be ignored. In this context, we will discuss how to improve the efficient use of cement in concrete, which plays an important role in the stage of structural design and the mitigation of GHG emission, and Table 8 described the GHG emission and price with different raw materials.
In this study, there is a total of 161 beams used for the carbon emission prediction. According to previous studies, the carbon emission during their transportation from the suppliers to the company is limited [57]. In that case, the focus of the study is total GHG emissions expressed as the sum of the emissions during the production of the raw materials of the beams with different shear spans. There are two steps to evaluate the GHG emission of collected beams, and the first is to identify the GHG emission of fibre-reinforced concrete mix per cubic meter. The carbon emission of concrete (Ec) is calculated as the sum of the carbon footprints of substances and activities associated with the production of concrete raw materials according to Equation (21).
E c =   Σ W e ×   m   [ kg   CO 2   emission / m 3 ]
where W e   is the GHG emission factor, and m is the unit of substance per m3. After that, the total carbon emission of reinforced-concrete beams (Et) can be calculated based on Equation (22) according to the collected data on the dimensions of beams.
E t = E c   1 ρ   + E s ρ   b d L   [ kg   CO 2   emission / m 3 ]
where ρ is the longitudinal ratio, b is the width of the cross-section, d is the depth of the cross-section, and L is the shear span. The reference sources of GHG emission of the raw materials were mainly collected from published literature, which is shown in Table 8. The price of each raw material is collected from Statista with open access. Similar to the calculation of the carbon footprints, the cost budges can be calculated based on Equations (21) and (22).

6.2. Results Analysis

Figure 9 and Table 9 show the estimated and experimental results of GHG emission using BNN, ANN, and Xgboost models. The BNN model shows more satisfactory results than other models, with R2 being 0.974 for total datasets. Out of all the error values, 77.1% are under 5 CO2 eq, 4.3% are above 10 CO2 eq, and 18.6% are between 5 and 10 CO2 eq. The R2 and error values of the Xgboost model for GHG emission prediction have lower precision compared to the other ensemble models, in which 65.2% are under 5 CO2 eq., 17.4% are above 10 MPa, and 17.4% are between 5 and 10 MPa for the GHG carbon emission predicting models. The performance of the ANN model also shows good prediction ability based on the performance indices.
Table 10 indicates the predictive ability in the corresponding index of R2, MSE, and MAE among the ANN, BNN, and Xgboost models. Figure 10 depicts the errors and data comparison between prediction and experimental results in forecasting the cost budgets of high-strength steel fibre-reinforced concrete beams. Xgboost gives maximum MAE and MSE errors as compared to BNN and ANN models. In comparison with the Xgboost model, the ANN and BNN models show higher prediction accuracy during the testing phase, with R2 being 0.980 and 0.981, respectively. This is because both ANN and BNN models are neural network models, which are good at the identification of noisy information and have better generalisation ability than Xgboost model. Overall, the BNN model performed better than other models. The accuracy obtained by the BNN model is R2 of 0.977, MSE of 0.020, and MAE of 0.082.

6.3. Sensitivity Analysis

Figure 11 shows the SHAP values point plot of BNN prediction models that orders inputs based on their importance to output. Normally, the higher values of these inputs result in higher SHAP values, which correspond to a higher potential relationship with output. For both cost budget and GHG emission prediction, the dimension factors, depth and width, and shear span are the most important features in the model. Cement, superplasticiser, and longitudinal ratio are the next three most important features for both GHG emission and cost budget models, respectively. Specifically, cement has a greater impact on the model of GHG emission than cost budget prediction. In fact, the number of steel rebars and cement are the main parts of beams, and the pre-unit GHG emission and price are also the first and third ranks according to Table 7. However, the superplasticiser has lower SHAP values than other features, which means the addition of superplasticiser reduces GHG emission and cost budgets. This is because the concrete performance can achieve a significant improvement with a limited addition of the admixture, but the total price and the GHG emission are the smallest part of high-strength steel fibre-reinforced concrete beams. In the previous study, the fibre factor contributes to the improvement of the shear capacity of beams significantly. However, according to Figure 11, the fibre content ranked at the end of all features. These results imply that the addition of fibre in concrete can hardly be expected for the increase in cost budgets and GHG emissions. This also suggested that increasing the addition of fibre in reinforced-concrete beams is a good way to balance both structural performance and sustainable development.

7. Discussion of Findings

This study demonstrated that using ML models can provide highly reliable results for the prediction of structural and sustainable performance on the basis of collected experimental result datasets. In the authors’ opinion, the proposed models in this study contribute to both structural design and sustainable analysis, which is a new and original achievement for the systematic design of structures.
It can be derived through the discussion in this study that the use of ML models for the evaluation of structure performance is beneficial for researchers to acquire accurate results and improve the design efficiency. Three well-established ML models were employed in this study for validation of the structural and sustainable performance of high-strength fibre-reinforced concrete beam prediction, including BNN, ANN, and Xgboost. Depending on the reported statistical results in this study, the Xgboost models performed well during the training phase and obtained high values of R2 and the lowest values of MAE and RMSE. However, XgBoost models are prone to overfitting [58]. The BNN and ANN models show better performance than Xgboost models during the testing phase, and BNN models have higher comprehensive predicting performance than other models in the prediction phase of five key structural and sustainable performance indicators. Similar results are shown in the work by Fissha, et al. [59], which showed that the BNN models outperformed traditional neural networks with noisy datasets.
Another interesting finding is a key parameter, fibre content, in both structural and sustainable performance prediction. The fibre content is beneficial to improve the structural performance, especially in the aspect of shear capacity, which is a common consensus [38]. However, the addition of fibre will not be increasing the GHG emission and cost budgets of beams sharply. In this context, based on the aid of models proposed in this study, it will be more easily for civil designers to find the balance point between structural performance and sustainable development, improving the efficiency of obtaining the optimum fibre content and achieving cleaner production.
For a better understanding of how to use the proposed ML models to obtain a sustainable and structural design, there are two assumed case study proposed.

7.1. Structural Design

After a brief review, the experimental and numerical study published in 2021 by Tahenni, et al. [60] will be used to evaluate how ML models support engineering design and how to formalise engineering knowledge. There are five high-strength steel fibre-reinforced concrete beams built in this study, with details shown in Table 11.
In the study of Tahenni et al. [39], the experimental results were compared with proposed non-linear finite element models (FEM). FEM is a powerful tool that can provide an excellent predicting ability to complex systems in engineering with its advantage in efficiency, accuracy, versatility, and visualization. In this study, the prediction result from BNN models was used to compare with FEM, and the results are shown in Table 12.
According to Table 12, compared with the FEM, the ML methods show similar predicting ability. However, the limitation of FEM in efficiency, time consumption, and cost makes it hard to be widely used to support the structural design. With a similar predicting ability, data-driven methods can efficiently process large amounts of data quickly and accurately. Based on the few key features and limited time consumption, reliable predicting results can be provided by ML models for engineers to justify the structural performance compared with FEM. Overall, applying ML in structural design can lead to a more efficient and cost-effective approach that is better optimized for safety.

7.2. Sustainable Design

Some beams in the bridge that need to be replaced are assumed, and the max loading applied in the mid of beams is 550 kN. The cross-section of the beams is a width of 300 mm, the depth is 550 mm. The design concrete strength is C60, the shear span is 1500 mm, the longitudinal ratio is 1%, and the partial factors are 1.2. Assuming the designer prefer not to change the current cross-section design and would like to use a more environmentally friendly way to design the beams, the proposed models in this study can support sustainable design perfectly.
Figure 12 demonstrates the sustainable and structural design proceeds of high-strength fibre-reinforced concrete beams with the aid of proposed ML models. According to Figure 12, the first step is to propose several reasonable concrete mixes. Because of the design strength is C60, three collected concrete mixes from published literature about C60 are shown in Table 13.
In the quantitative assessment, Table 13 shows the structural and sustainable performance indicators with the optimal developed BNN model. In accordance with the same table, the concrete mix proposed by Li has the lowest GHG emissions, and the cost budget is cheaper than the rest of the mixes. This is due to the addition of slag that replace sparts of cement. Moreover, due to the limited use of cement, the total cost of the beams is cheaper.
The next step is to use the ML models to predict the structural performance. According to the assumed information, the maximum load in the mid of the beam is 550 kN, and the shear strength can be calculated by using the half of peak load (shear force) divided to the area of the cross-section. In that case, the maximum shear strength is 1.83 Mpa. After multiplying it by the partial factors of 1.2, the result is equal to 2.2 Mpa. According to Table 14, most of the designs with fibre concrete higher than 1% can meet the design requirement, and the structural performance of the mix design from Gao is higher than other designs. However, this study concluded the design provided by Li with the fibre content of 1% is the optimal concrete mix design. This is because Li’s design leads to sustainable development and lower price than other concrete mixes.
It is widely recognized that the reality beam design can be more complex than this assumed case study. However, it is evident that significant time can be saved and it is possible for designers to work on multiple designs simultaneously. Because of the complexity of fibre-reinforced concrete beams, especially with the high-strength concrete mix, the traditional empirical and semi-empirical formulas should not be encouraged in future. The data-driven ML models can provide more accuracy and are faster than traditional formula design. Moreover, the results of GHG emissions and cost budgets can be seen and compared directly with the aid of proposed ML models. In the future, with the increasing of the datasets, more properties of high-strength fibre reinforcement concrete beams can be evaluated at the same time.

7.3. Future Scope

A review of the recently published papers reveals that an increasing number of researchers are focusing on adapting the ML models to solve the structural engineering problems. Most of proposed ML models are more reliable than traditional formulas. However, most of ML models are developed for specific structure parameter, and there are very limited studies that discuss and evaluate two or more parameters in using ML models to predict structural performance. As a consequence, this study coupled machine learning to propose novel data-driven models that enable the prediction of the three key parameters related to structural performance and two parameters related to sustainable development. The proposed model is a reliable design method for designers or civil engineers to effectively maintain the balance between structural reliability and environmental sustainability. However, the current datasets are focused on the three key structural parameters only, and the aspect of durability has not been identified. Further work should pay attention to updating the datasets about the corrosion rate or chloride penetration, shrinkage, and creep. Moreover, most of the current ML models are black-box systems, which make it difficult to apply them with current design standards and integrate them for further designs. Future studies should expand the range of predicting parameters and experimental results based on current datasets and develop new ML algorithms that are easily interpretable, which can facilitate the updates to the current design standards. In addition, this study considered the sustainable design with the aspect of GHG emission and cost budget. For a better understanding of how to implement these models in the practical application, it is suggested that future researchers should focus on the development of ML model systems related to durability, fatigue resistance, and in-suit applications.

8. Conclusions

In this paper, three ML models are adopted to predict the shear strength, flexural capacity, and stiffness of high-strength concrete beams, and they are further compared with three empirical equations and an ML prediction formula. The prediction capabilities of the ML models are evaluated based on criteria such as R2, MSE, and MAE. It is found that all proposed models show outstanding prediction abilities in terms of shear strength, flexural capacity, and stiffness. Moreover, this study also evaluated the sustainable performance of high-strength fibre-reinforced concrete beams with the same proposed ML models, for which it is a time-saving and cost-efficient method for engineers to achieve a balance between the sustainable design and structure design. In addition, the following key conclusions can be drawn from the results of this paper:
  • A strong correlation coefficient R2 ≥ 0.89 is observed for the training, testing, and validating datasets of three ML models (ANN, Xgboost, and BNN). The comparison analysis illustrates that the BNN model performs better than the other ML models, with the highest predicted R2 of flexural capacity and shear stiffness, and the second higher predicted R2 of shear strength. The BNN model has been proven to have good prediction ability than traditional neural network.
  • When comparing the error analysis of the models’ training phase, the Xgboost model has the lowest statistical errors and the highest R2, followed by the ANN and BNN models. However, the Xgboost model shows poorer performance in testing datasets, indicating its poor generalisation ability.
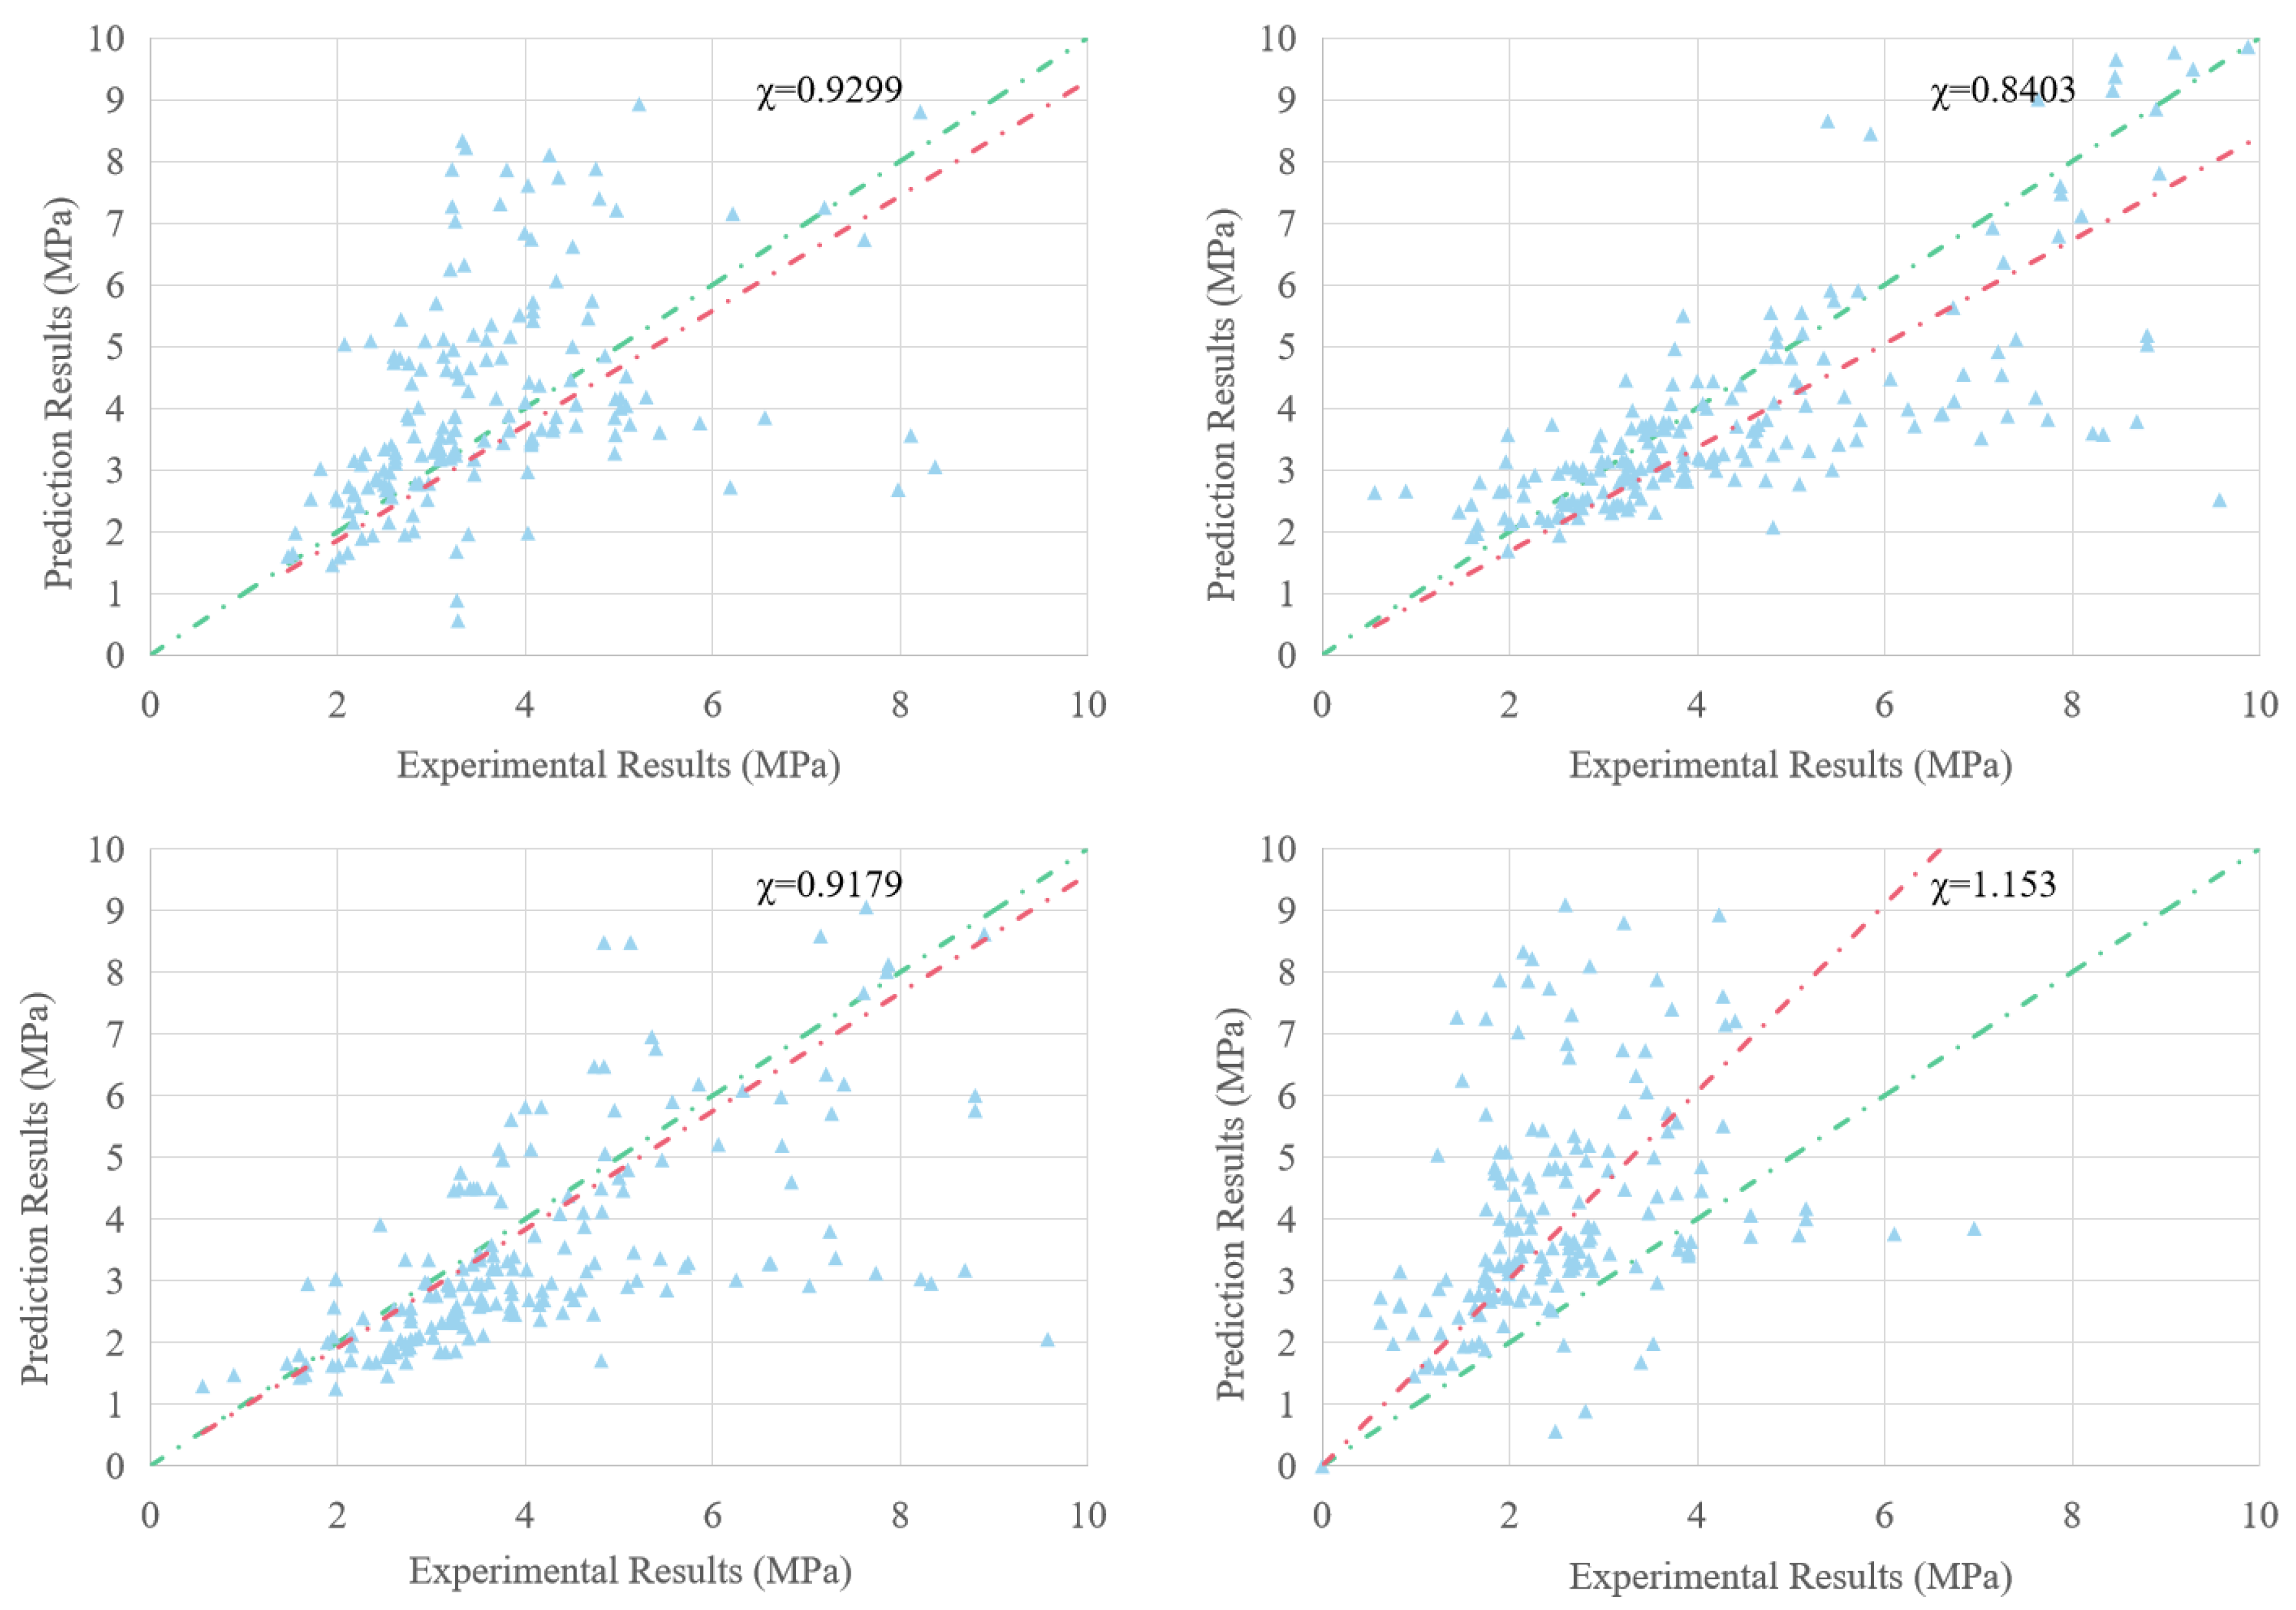
  • In terms of the proposed empirical equations, the Ashour formula developed on the basis of regression analysis shows the best prediction ability with χ of 0.9579. However, the ML models proposed in this paper has the best shear strength prediction ability, where χ is 0.9716, 1.0044, 0.9579 for ANN, BNN and Xgboost models, respectively.
  • In the section of sensitivity analysis, the longitudinal ratio and shear span show the strongest potential relationship with shear strength prediction. In contrast to the shear strength prediction, stiffness is sensitive to the synergetic effect among concrete, steel rebar, and fibre effect. In addition, the dimension effect exerts the greatest influence on the prediction of flexural capacity.
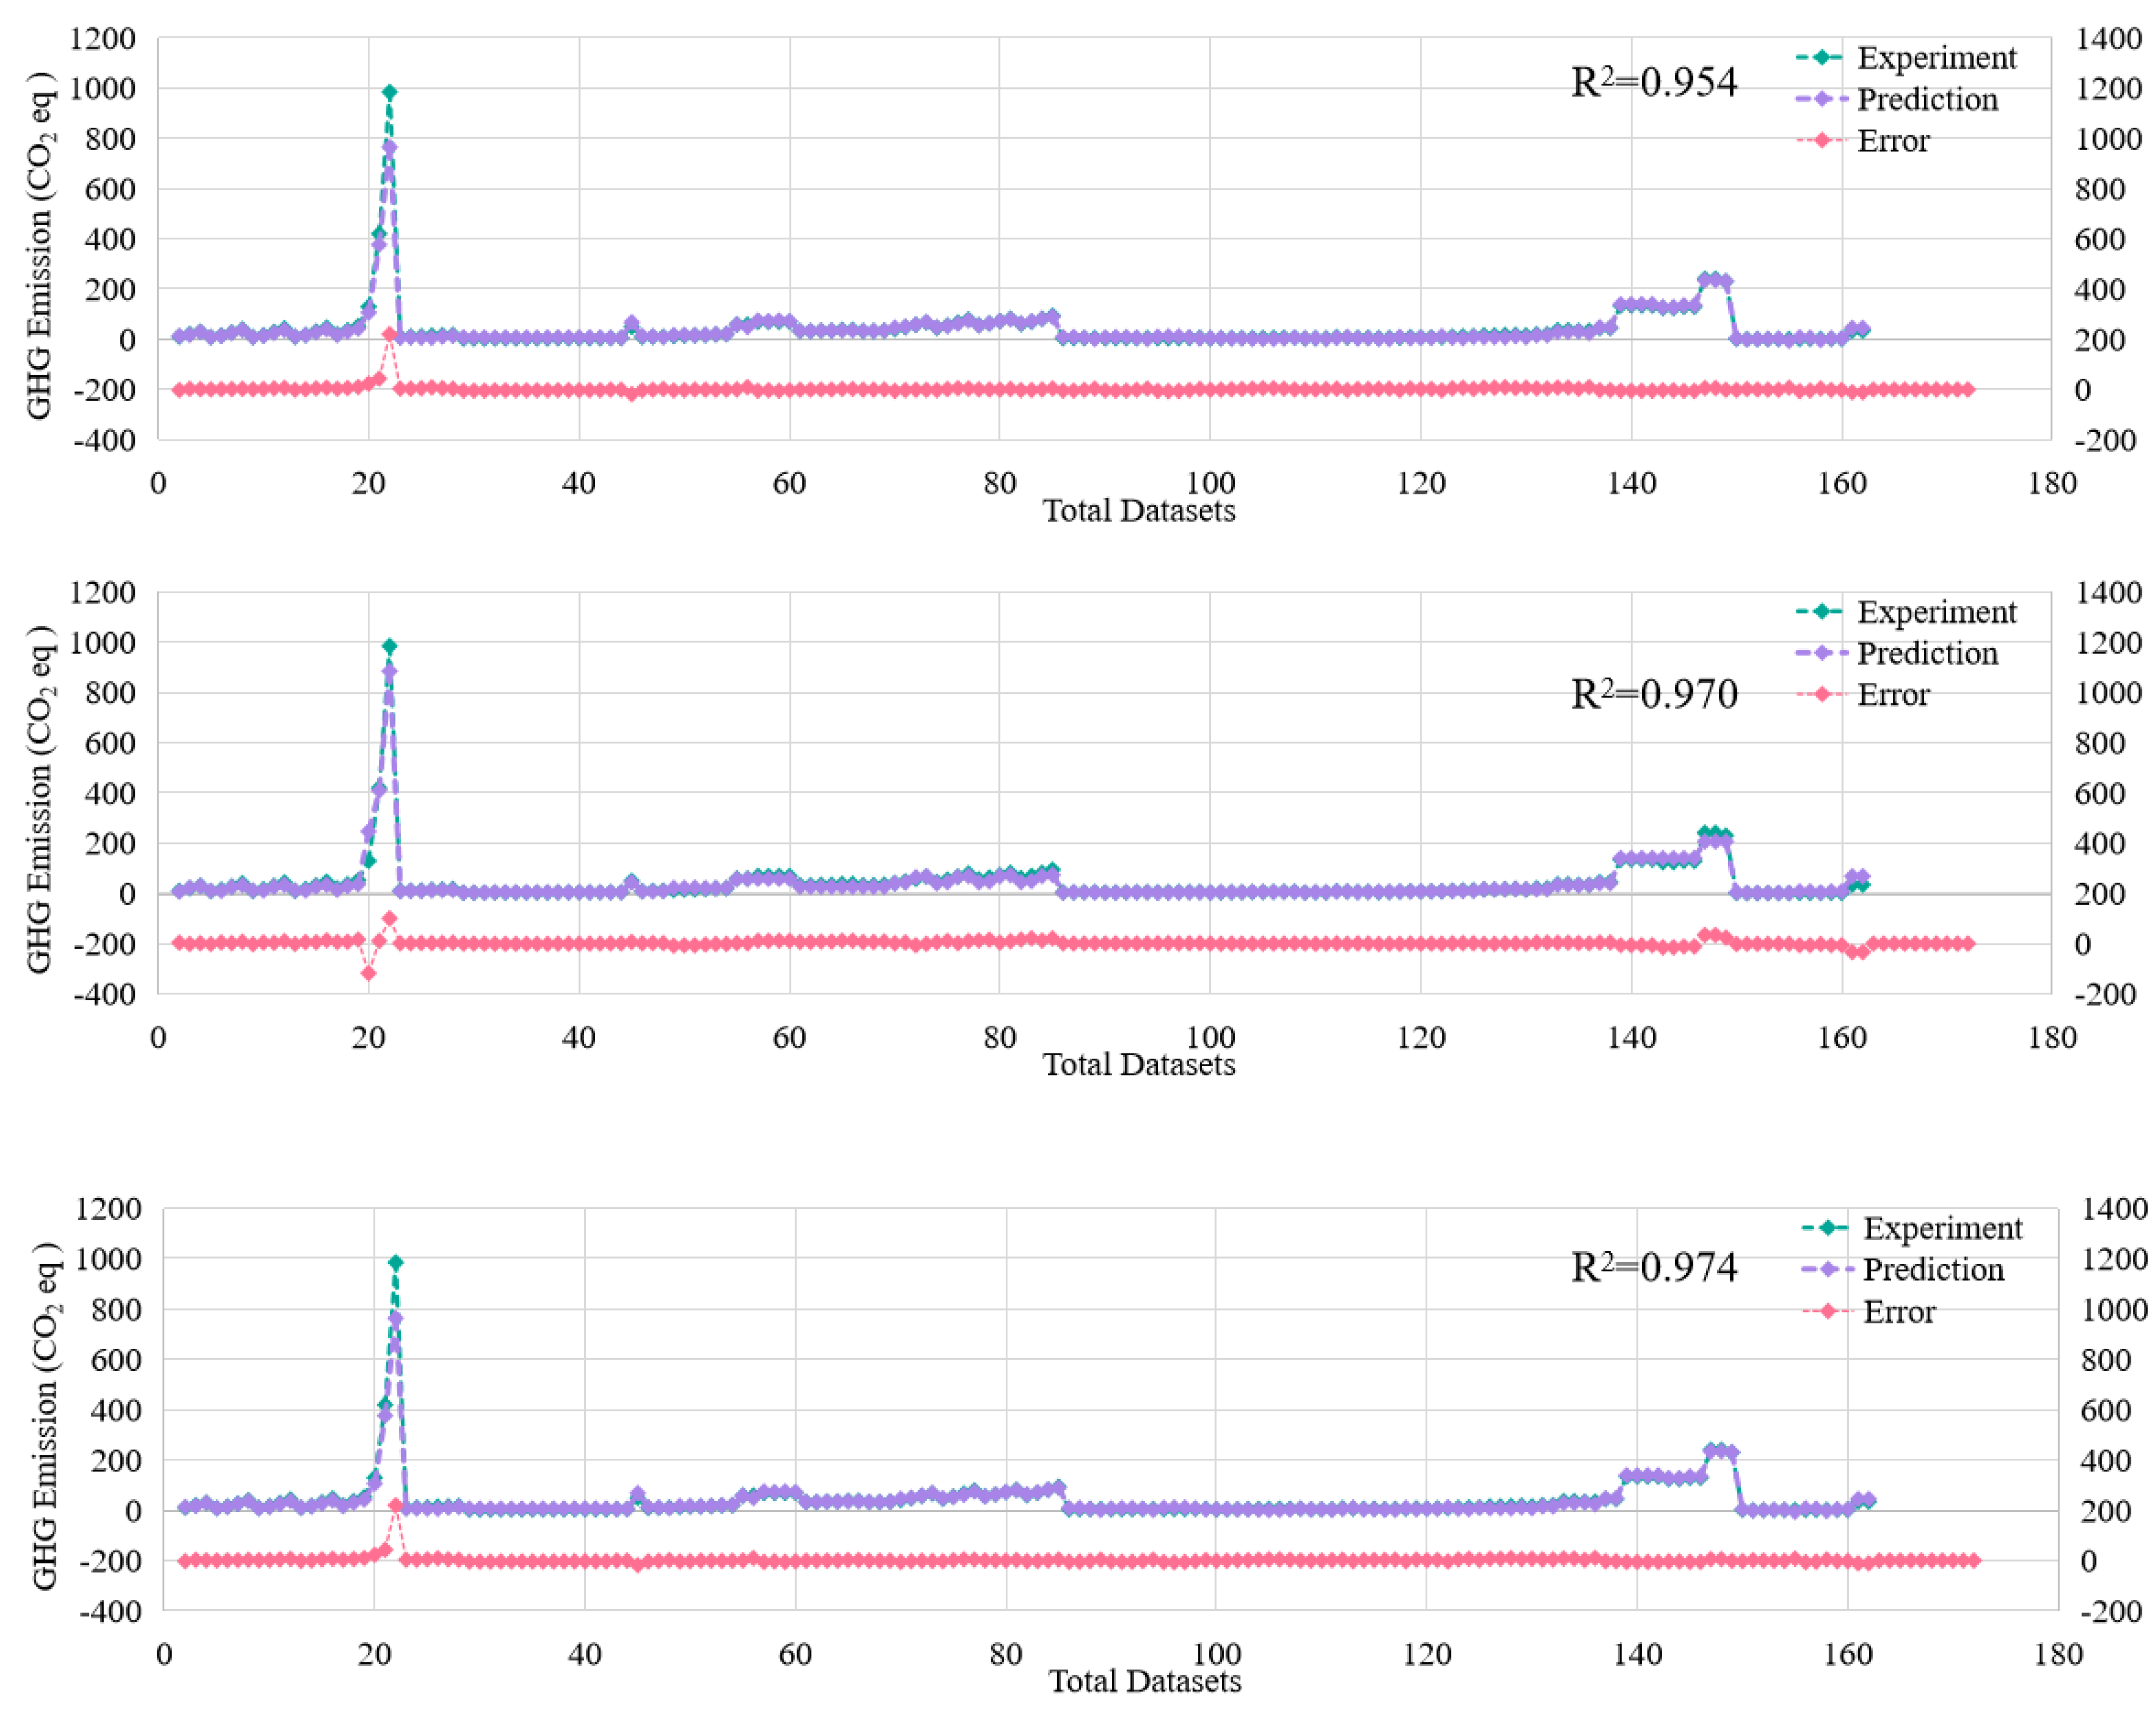
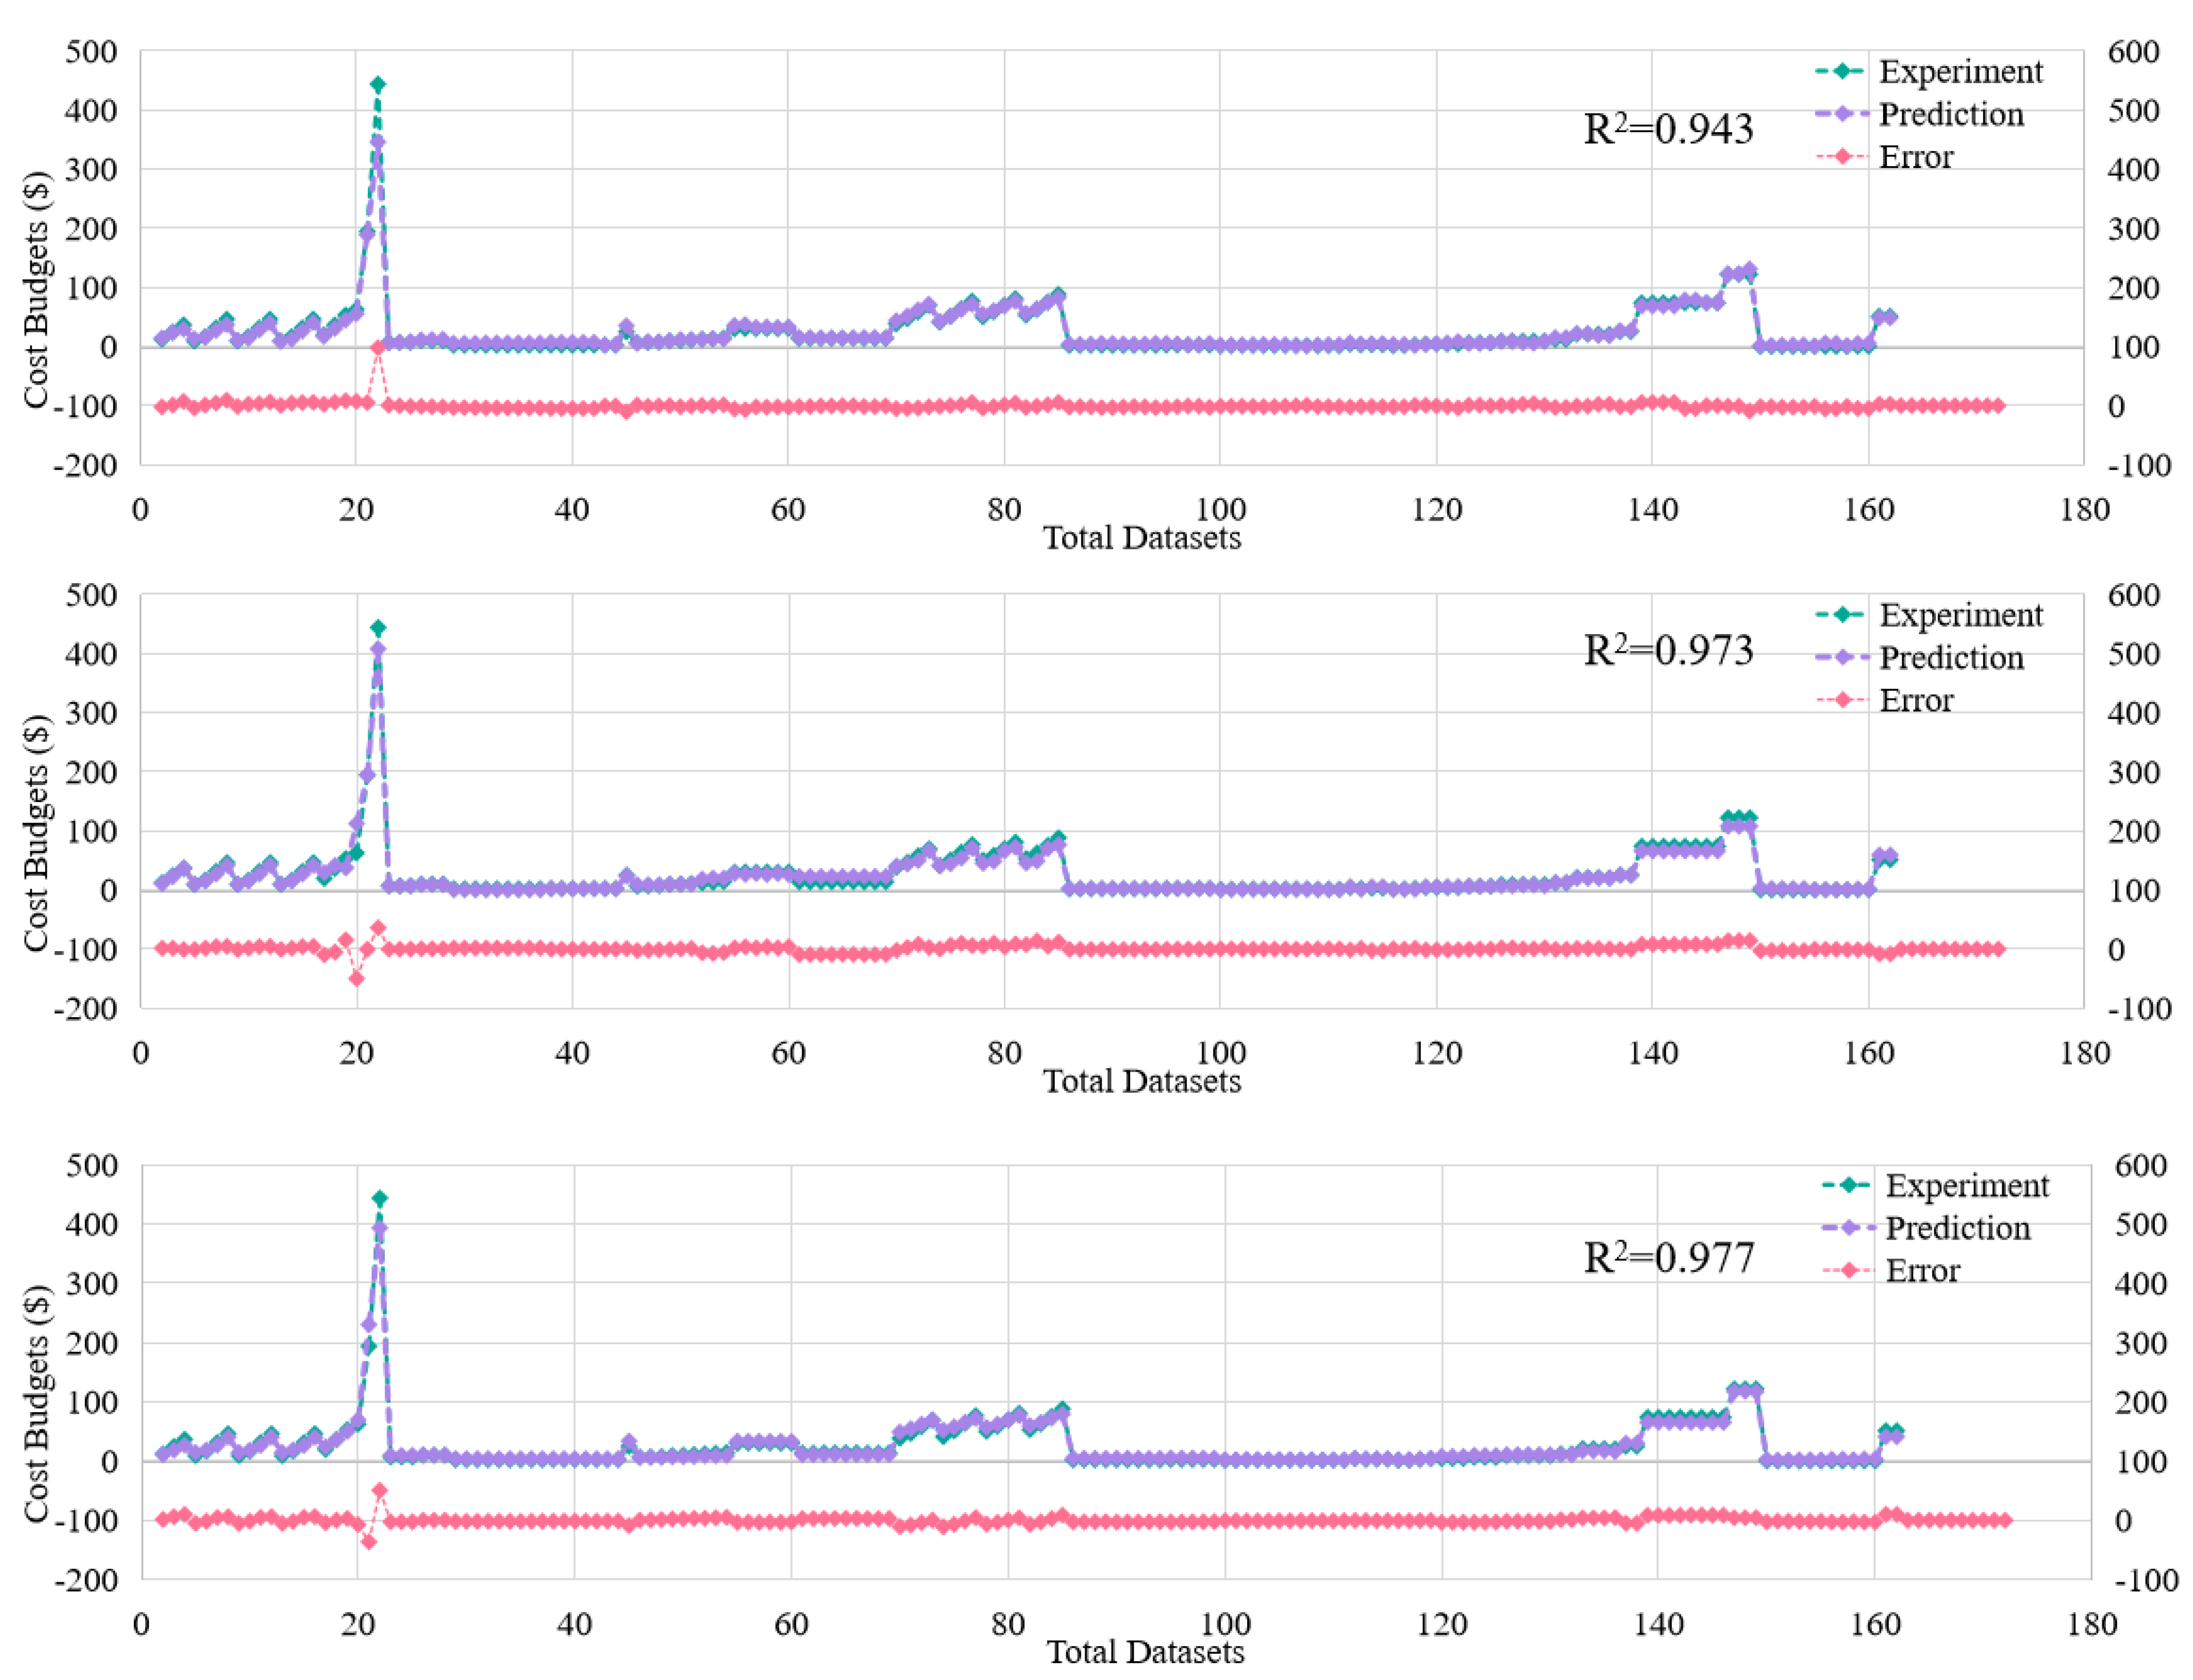
  • This study proposed two models for the prediction of GHG emissions and cost budgets, which revealed that the fibre content has limited effect on the increase in GHG emissions and cost budgets. A strong correlation coefficient R2 ≥ 0.94 is observed for the training, testing, and validation datasets of three ML models (ANN, Xgboost, and CNN), and NN models outperform the other models. In this context, increasing the addition of fibre in the structure is a good way to balance both sustainable development and structure performance.
  • Based on the proposed models in this study, the optimum design with the consideration of both structural and sustainable performance can be easily calculated. This study aimed to apply the ML models to real-world application. To achieve this, two studies were conducted, which revealed that the proposed ML models can be used to replace some function of FEM and evaluate the sustainable performance of concrete mixes. With the aid of the proposed models, it will be beneficial for researchers to improve design efficiency and support the strategy of sustainable development.
  • The proposed models mainly focus on the structural performance and sustainable ability. As described in the section of discussion, the study did not address the resistance of corrosion resistance, fatigue, and the freeze-thaw cycle. Further works should focus on the durability and fatigue properties of high-strength fibre-reinforced concrete beams and expand the current datasets.

Author Contributions

S.K. developed the concept; X.Q. did the data collection, and data analysed; X.Q. contributed the manuscript; S.K. and X.Q. reviewed the paper. All authors wrote the paper. All authors have read and agreed to the published version of the manuscript.

Funding

This research was funded by the European Commission, grant number: H2020-MSCA-RISE No. 691135 and Shift2Rail H2020-S2R Project No. 730849.

Institutional Review Board Statement

Not applicable.

Informed Consent Statement

Not applicable.

Data Availability Statement

Data can be made available upon reasonable request.

Acknowledgments

The authors are sincerely grateful to European Commission for the support of the H2020-RISE Project No. 691135 “RISEN: Rail Infrastructure Systems Engineering Network”, which enables a global research network that tackles the grand challenge in railway infrastructure resilience and advanced sensing in extreme environments. In addition, this project is partially supported by European Commission’s Shift2Rail, H2020-S2R Project No. 730849 “S-Code: Switch and Crossing Optimal Design and Evaluation”.

Conflicts of Interest

The authors declare no conflict of interest.

Appendix A

Table A1. Datasets.
Table A1. Datasets.
AuthorNumber of BeamCompressive Strength
MPa
Fibre Content
%
Longitudinal Ratio %Shear
Span
Cross Section
(W × D) mm
Fibre Type
Ashour, Hasanain and Wafa [15]1892~101.320.5~1.50.37~4.581, 2, 4, 6125 × 215Hooked
Yoo and Yang [64]362.30.751.52, 4, 6300 × 420
450 × 648
600 × 887
Hooked
Manju, et al. [65]682~83.80.5~1.511.5, 2.5185 × 220Hooked
Tahenni, et al. [66]1663.1~650~31.16~1.52.2100 × 135Hooked
de Lima Araújo, et al. [67]158.87111.5370 × 350Hooked
Kwak, et al. [68]962.6~68.60~0.751.52, 3, 4125 × 212Hooked
Alzahrani [69]661.6~730~0.751.463200 × 350Hooked
Singh and Jain [70]953.4~64.60.75~1.52.673.49150 × 253Hooked
Vamdewalle and Mortelmans [71]16108.5~1120~0.751.871.75, 2.5, 3.5, 4.5200 × 300Hooked
Cho and Kim [72]1454.3~89.90~21.3~2.91.05120 × 167.5Hooked
Narayanan and Darwish [73]2057.3~65.80.25~32~5.722, 2.5, 3130 × 130Crimped
Shin, et al. [74]13800~13.592, 3, 4.5, 6100 × 175Plain
Noghabai [75]1772~93.30.5~12.87~4.472.77~3.33200 × 180
200 × 235
200 × 410
300 × 570
Plain and Hooked
Uomoto, et al. [76]4541.52.21.5~2.5182 × 182Plain
Hwang, et al. [77]358~880.5~14.783100 × 165Hooked
Li, et al. [78]1162.611.1~3.31~363.5 × 10²Crimped
Adebar, et al. [79]254.1~54.80.4~0.752.141.63150 × 560Hooked
Cohen and Aoude [80]159.40.51.523.77125 × 212Hooked
Pansuk, et al. [81]2109.2~110.90.753.482.75200 × 273Hooked

References

  1. Chakraborty, D.; Awolusi, I.; Gutierrez, L. An explainable machine learning model to predict and elucidate the compressive behavior of high-performance concrete. Results Eng. 2021, 11, 100245. [Google Scholar] [CrossRef]
  2. Lee, J.-Y.; Shin, H.-O.; Yoo, D.-Y.; Yoon, Y.-S. Structural response of steel-fiber-reinforced concrete beams under various loading rates. Eng. Struct. 2018, 156, 271–283. [Google Scholar] [CrossRef]
  3. Dao, D.V.; Adeli, H.; Ly, H.-B.; Le, L.M.; Le, V.M.; Le, T.-T.; Pham, B.T. A sensitivity and robustness analysis of GPR and ANN for high-performance concrete compressive strength prediction using a Monte Carlo simulation. Sustainability 2020, 12, 830. [Google Scholar] [CrossRef] [Green Version]
  4. Wu, H.; Lin, X.; Zhou, A. A review of mechanical properties of fibre reinforced concrete at elevated temperatures. Cem. Concr. Res. 2020, 135, 106117. [Google Scholar] [CrossRef]
  5. Divyah, N.; Thenmozhi, R.; Neelamegam, M.; Prakash, R. Characterization and behavior of basalt fiber-reinforced lightweight concrete. Struct. Concr. 2021, 22, 422–430. [Google Scholar] [CrossRef]
  6. Prakash, R.; Thenmozhi, R.; Raman, S.N.; Subramanian, C. Fibre reinforced concrete containing waste coconut shell aggregate, fly ash and polypropylene fibre. Rev. Fac. Ing. Univ. Antioq. 2020, 94, 33–42. [Google Scholar] [CrossRef] [Green Version]
  7. Prakash, R.; Raman, S.N.; Subramanian, C.; Divyah, N. Eco-friendly fiber-reinforced concretes. In Handbook of Sustainable Concrete and Industrial Waste Management; Elsevier: Amsterdam, The Netherlands, 2022; pp. 109–145. [Google Scholar]
  8. Majain, N.; Rahman, A.B.A.; Adnan, A.; Mohamed, R.N. Bond behaviour of deformed steel bars in steel fibre high-strength self-compacting concrete. Constr. Build. Mater. 2022, 318, 125906. [Google Scholar] [CrossRef]
  9. Prakash, R.; Thenmozhi, R.; Raman, S.N.; Subramanian, C. Characterization of eco-friendly steel fiber-reinforced concrete containing waste coconut shell as coarse aggregates and fly ash as partial cement replacement. Struct. Concr. 2020, 21, 437–447. [Google Scholar] [CrossRef]
  10. Prakash, R.; Divyah, N.; Srividhya, S.; Avudaiappan, S.; Amran, M.; Naidu Raman, S.; Guindos, P.; Vatin, N.I.; Fediuk, R. Effect of steel fiber on the strength and flexural characteristics of coconut shell concrete partially blended with fly ash. Materials 2022, 15, 4272. [Google Scholar] [CrossRef]
  11. Amin, A.-K.A.F.; Keong, C.K.; Geem-Eng, T. Mechanical behaviour of Steel fibre reinforced concrete beams: A review. IOP Conf. Ser. Mater. Sci. Eng. 2020, 920, 012032. [Google Scholar] [CrossRef]
  12. Luo, Z.; Yang, L.; Liu, J. Embodied carbon emissions of office building: A case study of China’s 78 office buildings. Build. Environ. 2016, 95, 365–371. [Google Scholar] [CrossRef] [Green Version]
  13. Khuntia, M.; Stojadinovic, B.; Goel, S.C. Shear strength of normal and high-strength fiber reinforced concrete beams without stirrups. Struct. J. 1999, 96, 282–289. [Google Scholar]
  14. Al-Ta’an, S.; Al-Feel, J.R. Evaluation of shear strength of fibre-reinforced concrete beams. Cem. Concr. Compos. 1990, 12, 87–94. [Google Scholar] [CrossRef]
  15. Ashour, S.A.; Hasanain, G.S.; Wafa, F.F. Shear behavior of high-strength fiber reinforced concrete beams. Struct. J. 1992, 89, 176–184. [Google Scholar]
  16. Salehi, H.; Burgueño, R. Emerging artificial intelligence methods in structural engineering. Eng. Struct. 2018, 171, 170–189. [Google Scholar] [CrossRef]
  17. Zhang, X.; Li, Z.-X.; Shi, Y.; Wu, C.; Li, J. Fragility analysis for performance-based blast design of FRP-strengthened RC columns using artificial neural network. J. Build. Eng. 2022, 52, 104364. [Google Scholar] [CrossRef]
  18. Mangalathu, S.; Jang, H.; Hwang, S.-H.; Jeon, J.-S. Data-driven machine-learning-based seismic failure mode identification of reinforced concrete shear walls. Eng. Struct. 2020, 208, 110331. [Google Scholar] [CrossRef]
  19. Sandeep, M.S.; Tiprak, K.; Kaewunruen, S.; Pheinsusom, P.; Pansuk, W. Shear strength prediction of reinforced concrete beams using machine learning. In Structures; Elsevier: Amsterdam, The Netherlands, 2023; pp. 1196–1211. [Google Scholar]
  20. Hoang, N.-D. Estimating punching shear capacity of steel fibre reinforced concrete slabs using sequential piecewise multiple linear regression and artificial neural network. Measurement 2019, 137, 58–70. [Google Scholar] [CrossRef]
  21. Feng, D.-C.; Liu, Z.-T.; Wang, X.-D.; Jiang, Z.-M.; Liang, S.-X. Failure mode classification and bearing capacity prediction for reinforced concrete columns based on ensemble machine learning algorithm. Adv. Eng. Inform. 2020, 45, 101126. [Google Scholar] [CrossRef]
  22. Yan, H.; He, Z.; Gao, C.; Xie, M.; Sheng, H.; Chen, H. Investment estimation of prefabricated concrete buildings based on XGBoost machine learning algorithm. Adv. Eng. Inform. 2022, 54, 101789. [Google Scholar] [CrossRef]
  23. Reddy, S.; Akashdeep, S.; Harshvardhan, R.; Kamath, S. Stacking Deep learning and Machine learning models for short-term energy consumption forecasting. Adv. Eng. Inform. 2022, 52, 101542. [Google Scholar]
  24. Qian, Y.; Sufian, M.; Hakamy, A.; Farouk Deifalla, A.; El-said, A. Application of machine learning algorithms to evaluate the influence of various parameters on the flexural strength of ultra-high-performance concrete. Front. Mater. 2023, 9, 1114510. [Google Scholar] [CrossRef]
  25. Kang, M.-C.; Yoo, D.-Y.; Gupta, R. Machine learning-based prediction for compressive and flexural strengths of steel fiber-reinforced concrete. Constr. Build. Mater. 2021, 266, 121117. [Google Scholar] [CrossRef]
  26. Shatnawi, A.; Alkassar, H.M.; Al-Abdaly, N.M.; Al-Hamdany, E.A.; Bernardo, L.F.A.; Imran, H. Shear Strength Prediction of Slender Steel Fiber Reinforced Concrete Beams Using a Gradient Boosting Regression Tree Method. Buildings 2022, 12, 550. [Google Scholar] [CrossRef]
  27. Rahman, J.; Ahmed, K.S.; Khan, N.I.; Islam, K.; Mangalathu, S. Data-driven shear strength prediction of steel fiber reinforced concrete beams using machine learning approach. Eng. Struct. 2021, 233, 111743. [Google Scholar] [CrossRef]
  28. Pakzad, S.S.; Roshan, N.; Ghalehnovi, M. Comparison of various machine learning algorithms used for compressive strength prediction of steel fiber-reinforced concrete. Sci. Rep. 2023, 13, 3646. [Google Scholar] [CrossRef]
  29. Alzabeebee, S.; Al-Hamd, R.K.S.; Nassr, A.; Kareem, M.; Keawsawasvong, S. Multiscale soft computing-based model of shear strength of steel fibre-reinforced concrete beams. Innov. Infrastruct. Solut. 2023, 8, 63. [Google Scholar] [CrossRef]
  30. Shahnewaz, M.; Alam, M.S. Genetic algorithm for predicting shear strength of steel fiber reinforced concrete beam with parameter identification and sensitivity analysis. J. Build. Eng. 2020, 29, 101205. [Google Scholar] [CrossRef]
  31. Kara, I.F. Empirical modeling of shear strength of steel fiber reinforced concrete beams by gene expression programming. Neural Comput. Appl. 2013, 23, 823–834. [Google Scholar] [CrossRef]
  32. Adhikary, B.B.; Mutsuyoshi, H. Prediction of shear strength of steel fiber RC beams using neural networks. Constr. Build. Mater. 2006, 20, 801–811. [Google Scholar] [CrossRef]
  33. Yaseen, Z.M. Machine learning models development for shear strength prediction of reinforced concrete beam: A comparative study. Sci. Rep. 2023, 13, 1723. [Google Scholar] [CrossRef] [PubMed]
  34. El-Sayed, A.K.; El-Salakawy, E.F.; Benmokrane, B. Shear capacity of high-strength concrete beams reinforced with FRP bars. ACI Mater. J. 2006, 103, 383. [Google Scholar]
  35. Yang, I.-H.; Joh, C.; Kim, K.-C. A comparative experimental study on the flexural behavior of high-strength fiber-reinforced concrete and high-strength concrete beams. Adv. Mater. Sci. Eng. 2018, 2018, 7390798. [Google Scholar] [CrossRef] [Green Version]
  36. Boulekbache, B.; Hamrat, M.; Chemrouk, M.; Amziane, S. Influence of yield stress and compressive strength on direct shear behaviour of steel fibre-reinforced concrete. Constr. Build. Mater. 2012, 27, 6–14. [Google Scholar] [CrossRef]
  37. Vu, N.S.; Li, B.; Beyer, K. Effective stiffness of reinforced concrete coupling beams. Eng. Struct. 2014, 76, 371–382. [Google Scholar]
  38. Lantsoght, E.O. How do steel fibers improve the shear capacity of reinforced concrete beams without stirrups? Compos. Part B Eng. 2019, 175, 107079. [Google Scholar] [CrossRef]
  39. Song, P.; Hwang, S. Mechanical properties of high-strength steel fiber-reinforced concrete. Constr. Build. Mater. 2004, 18, 669–673. [Google Scholar] [CrossRef]
  40. ACI Committee. Building Code Requirements for Structural Concrete (ACI 318-05) and Commentary (ACI 318R-05); American Concrete Institute: Farmington Hills, MI, USA, 2005. [Google Scholar]
  41. Narayanan, R.; Darwish, I. Use of steel fibers as shear reinforcement. J. Struct. Eng. 1987, 84, 216–227. [Google Scholar]
  42. Kaewunruen, S.; Sresakoolchai, J.; Huang, J.; Zhu, Y.; Ngamkhanong, C.; Remennikov, A.M. Machine Learning Based Design of Railway Prestressed Concrete Sleepers. Appl. Sci. 2022, 12, 10311. [Google Scholar] [CrossRef]
  43. Mangalathu, S.; Heo, G.; Jeon, J.-S. Artificial neural network based multi-dimensional fragility development of skewed concrete bridge classes. Eng. Struct. 2018, 162, 166–176. [Google Scholar] [CrossRef]
  44. Jahangir, H.; Eidgahee, D.R. A new and robust hybrid artificial bee colony algorithm–ANN model for FRP-concrete bond strength evaluation. Compos. Struct. 2021, 257, 113160. [Google Scholar] [CrossRef]
  45. Dong, W.; Huang, Y.; Lehane, B.; Ma, G. XGBoost algorithm-based prediction of concrete electrical resistivity for structural health monitoring. Autom. Constr. 2020, 114, 103155. [Google Scholar] [CrossRef]
  46. Cui, L.; Chen, P.; Wang, L.; Li, J.; Ling, H. Application of Extreme Gradient Boosting Based on Grey Relation Analysis for Prediction of Compressive Strength of Concrete. Adv. Civ. Eng. 2021, 2021, 8878396. [Google Scholar] [CrossRef]
  47. Chicco, D.; Warrens, M.J.; Jurman, G. The coefficient of determination R-squared is more informative than SMAPE, MAE, MAPE, MSE and RMSE in regression analysis evaluation. PeerJ Comput. Sci. 2021, 7, e623. [Google Scholar] [CrossRef]
  48. Willmott, C.J.; Matsuura, K. Advantages of the mean absolute error (MAE) over the root mean square error (RMSE) in assessing average model performance. Clim. Res. 2005, 30, 79–82. [Google Scholar] [CrossRef]
  49. Bentz, E.C. Sectional Analysis of Reinforced Concrete Members; University of Toronto: Toronto, ON, Canada, 2000. [Google Scholar]
  50. Lim, H.; Wee, T.; Mansur, M.; Kong, K. Flexural behavior of reinforced lightweight aggregate concrete beams. In Proceedings of the 6th Asia-Pacific Structural Engineering and Construction Conference (APSEC 2006), Kuala Lumpur, Malaysia, 5–6 September 2006; pp. 5–6. [Google Scholar]
  51. Amin, M.N.; Ahmad, W.; Khan, K.; Ahmad, A.; Nazar, S.; Alabdullah, A.A. Use of Artificial Intelligence for Predicting Parameters of Sustainable Concrete and Raw Ingredient Effects and Interactions. Materials 2022, 15, 5207. [Google Scholar] [CrossRef] [PubMed]
  52. Anderson, J.; Moncaster, A. Embodied carbon of concrete in buildings, Part 1: Analysis of published EPD. Build. Cities 2020, 1, 198–217. [Google Scholar] [CrossRef]
  53. Ouellet-Plamondon, C.; Habert, G. Life cycle assessment (LCA) of alkali-activated cements and concretes. In Handbook of Alkali-Activated Cements, Mortars and Concretes; Elsevier: Amsterdam, The Netherlands, 2015; pp. 663–686. [Google Scholar]
  54. Kim, T.H.; Tae, S.H.; Chae, C.U.; Choi, W.Y. The environmental impact and cost analysis of concrete mixing blast furnace slag containing titanium gypsum and sludge in South Korea. Sustainability 2016, 8, 502. [Google Scholar] [CrossRef] [Green Version]
  55. Qin, X.; Kaewunruen, S. Environment-friendly recycled steel fibre reinforced concrete. Constr. Build. Mater. 2022, 327, 126967. [Google Scholar] [CrossRef]
  56. Özdemir, A.; Günkaya, Z.; Özkan, A.; Ersen, O.; Bilgiç, M.; Banar, M. Lifecycle assessment of steel rebar production with induction melting furnace: Case study in Turkey. J. Hazard. Toxic Radioact. Waste 2018, 22, 04017027. [Google Scholar] [CrossRef]
  57. Teh, S.H.; Wiedmann, T.; Castel, A.; de Burgh, J. Hybrid life cycle assessment of greenhouse gas emissions from cement, concrete and geopolymer concrete in Australia. J. Clean. Prod. 2017, 152, 312–320. [Google Scholar] [CrossRef] [Green Version]
  58. Wang, Y.; Su, F.; Guo, Y.; Yang, H.; Ye, Z.; Wang, L. Predicting the microbiologically induced concrete corrosion in sewer based on XGBoost algorithm. Case Stud. Constr. Mater. 2022, 17, e01649. [Google Scholar] [CrossRef]
  59. Fissha, Y.; Ikeda, H.; Toriya, H.; Adachi, T.; Kawamura, Y. Application of Bayesian Neural Network (BNN) for the Prediction of Blast-Induced Ground Vibration. Appl. Sci. 2023, 13, 3128. [Google Scholar] [CrossRef]
  60. Tahenni, T.; Bouziadi, F.; Boulekbache, B.; Amziane, S. Experimental and numerical investigation of the effect of steel fibres on the deflection behaviour of reinforced concrete beams without stirrups. In Structures; Elsevier: Amsterdam, The Netherlands, 2021; pp. 1603–1619. [Google Scholar]
  61. Gao, D.; Huang, Y.; Yuan, J.; Gu, Z. Probability distribution of bond efficiency of steel fiber in tensile zone of reinforced concrete beams. J. Build. Eng. 2021, 43, 102550. [Google Scholar] [CrossRef]
  62. Zheng, Y.; Wu, X.; He, G.; Shang, Q.; Xu, J.; Sun, Y. Mechanical properties of steel fiber-reinforced concrete by vibratory mixing technology. Adv. Civ. Eng. 2018, 2018, 9025715. [Google Scholar] [CrossRef] [Green Version]
  63. Li, X.; Xue, W.; Fu, C.; Yao, Z.; Liu, X. Mechanical properties of high-performance steel-fibre-reinforced concrete and its application in underground mine engineering. Materials 2019, 12, 2470. [Google Scholar] [CrossRef] [Green Version]
  64. Yoo, D.-Y.; Yang, J.-M. Effects of stirrup, steel fiber, and beam size on shear behavior of high-strength concrete beams. Cem. Concr. Compos. 2018, 87, 137–148. [Google Scholar] [CrossRef]
  65. Manju, R.; Sathya, S.; Sylviya, B. Shear strength of high-strength steel fibre reinforced concrete rectangular beams. Int. J. Civ. Eng. Technol. 2017, 8, 1716–1729. [Google Scholar]
  66. Tahenni, T.; Chemrouk, M.; Lecompte, T. Effect of steel fibers on the shear behavior of high strength concrete beams. Constr. Build. Mater. 2016, 105, 14–28. [Google Scholar] [CrossRef]
  67. de Lima Araújo, D.; Nunes, F.G.T.; Toledo Filho, R.D.; de Andrade, M.A.S.J.A.S.T. Shear strength of steel fiber-reinforced concrete beams. Acta Sci. Technol. 2014, 36, 389–397. [Google Scholar] [CrossRef]
  68. Kwak, Y.-K.; Eberhard, M.O.; Kim, W.-S.; Kim, J. Shear strength of steel fiber-reinforced concrete beams without stirrups. ACI Struct. J. 2002, 99, 530–538. [Google Scholar]
  69. Alzahrani, F. Shear Behaviour of Steel Fibre-Reinforced High Strength Lightweight Concrete Beams without Web Reinforcement. Ph.D. Dissertation, Memorial University of Newfoundland, St. John’s, NL, Canada, 2018. [Google Scholar]
  70. Singh, B.; Jain, K. Appraisal of Steel Fibers as Minimum Shear Reinforcement in Concrete Beams. ACI Struct. J. 2014, 111, 1191–1202. [Google Scholar] [CrossRef]
  71. Vamdewalle, M.I.; Mortelmans, F. Shear capacity of steel fiber high-strength concrete beams. Spec. Publ. 1994, 149, 227–242. [Google Scholar]
  72. Cho, S.-H.; Kim, Y.-I. Effects of steel fibers on short beams loaded in shear. Struct. J. 2003, 100, 765–774. [Google Scholar]
  73. Narayanan, R.; Darwish, I. Shear in mortar beams containing fibers and fly ash. J. Struct. Eng. 1988, 114, 84–102. [Google Scholar] [CrossRef]
  74. Shin, S.-W.; Oh, J.-G.; Ghosh, S. Shear behavior of laboratory-sized high-strength concrete beams reinforced with bars and steel fibers. Spec. Publ. 1994, 142, 181–200. [Google Scholar]
  75. Noghabai, K. Beams of fibrous concrete in shear and bending: Experiment and model. J. Struct. Eng. 2000, 126, 243–251. [Google Scholar] [CrossRef]
  76. Uomoto, T.; Weerarathe, R.; Furukoshi, H.; Fujino, H. Shear strength of reinforced concrete beams with fiber reinforcement. In Proceedings of the Third International RILEM Symposium on Developments in Fiber Reinforced Cement and Concrete; Sheffield University Press Unit: Sheffield, UK, 1986; pp. 553–562. [Google Scholar]
  77. Hwang, J.-H.; Lee, D.H.; Kim, K.S.; Ju, H.; Seo, S.-Y. Evaluation of shear performance of steel fibre reinforced concrete beams using a modified smeared-truss model. Mag. Concr. Res. 2013, 65, 283–296. [Google Scholar] [CrossRef]
  78. Li, V.C.; Ward, R.J.; Hamza, A.M. Steel and Synthetic Fibers as Shear Reinforcement. 1992. Available online: https://deepblue.lib.umich.edu/bitstream/handle/2027.42/84724/li_ACImaterial92.pdf?sequence=1 (accessed on 13 March 2023).
  79. Adebar, P.; Mindess, S.; Pierre, D.S.; Olund, B. Shear tests of fiber concrete beams without stirrups. Struct. J. 1997, 94, 68–76. [Google Scholar]
  80. Cohen, M.; Aoude, H. Shear behavior of SFRC and SCFRC beams. In Proceedings of the 3rd International Structural Specialty Conference, Annual Conference—Canadian Society for Civil Engineering, University of Ottawa, Ottawa, ON, Canada, 6–9 June 2012; Volume 3, pp. 6–9. [Google Scholar]
  81. Pansuk, W.; Nguyen, T.N.; Sato, Y.; Den Uijl, J.; Walraven, J. Shear capacity of high performance fiber reinforced concrete I-beams. Constr. Build. Mater. 2017, 157, 182–193. [Google Scholar] [CrossRef]
Figure 1. Review of ML Datasets.
Sustainability 15 06640 g001
Figure 2. Flowchart for the working principle.
Sustainability 15 06640 g002
Figure 3. Prediction results of shear capacity. The above figures depict the prediction error results of the ANN model, the Xgboost model, and the BNN model, respectively.
Sustainability 15 06640 g003
Figure 4. Prediction results of flexural capacity. The above figures depict the prediction error results of the ANN model, the Xgboost model, and the BNN model, respectively.
Sustainability 15 06640 g004
Figure 5. Prediction results of shear stiffness. The above figures show the prediction error results of the ANN model, the Xgboost model, and the BNN model, respectively.
Sustainability 15 06640 g005
Figure 6. Prediction results of different formulas. Note: Green line is the diagonal line which is y = x, and the red line is the optimum fitting line.
Sustainability 15 06640 g006
Figure 7. Prediction results of different models. The upper left figure shows the prediction results of the ANN model, the upper right picture shows the Xgboost model, and the lower figure shows the BNN model. Note: Green line is the diagonal line which is y = x, and the red line is the optimum fitting line.
Sustainability 15 06640 g007
Figure 8. SHAP explanation models. The upper left figure shows the shear strength prediction of the BNN model, the upper right picture shows the flexural predicting BNN model, and the lower figure shows the shear stiffness predicting BNN model.
Sustainability 15 06640 g008
Figure 9. Prediction results of GHG emission. The above figures show the prediction error results of the ANN model, the Xgboost model, and the BNN model, respectively.
Sustainability 15 06640 g009
Figure 10. Prediction results of Cost budget. The above figures show the prediction error results of the ANN model, the Xgboost model, and the BNN model, respectively.
Sustainability 15 06640 g010
Figure 11. SHAP explanation models. The left figure shows the GHG emission prediction of the BNN model, and the right picture shows the cost budgets prediction of BNN model.
Sustainability 15 06640 g011
Figure 12. Flow diagram of sustainable and structural design proceeds of high-strength fibre-reinforced concrete beams.
Sustainability 15 06640 g012
Table 1. Overview of relevant published paper.
ScholarML
Methodology
Best Predicting AbilityBeam Properties for Prediction
Research related to Steel Fibre-reinforced
Concrete Beams
Qian, Sufian, Hakamy, Farouk Deifalla and El-said [24]SVR, MLP, Gradient boostingR2 of 0.91 with
Testing Datasets with Gradient boosting model
Flexural strength prediction of ultra-high-performance concrete
Pakzad, et al. [28]MLR, KNN, SVR, RF, GB, Xgboost, AdaBoost, ANN, and CNN.R2 of 0.928 with
Total Datasets with CNN model
Compressive strength prediction
Kang, Yoo and Gupta [25]MLR, KNN, SVR, RF, GB, Xgboost.RMSE of 3.6144 with
Total Datasets with Xgboost model
Compressive and flexural strength prediction
Research related to Steel Fibre-reinforced
Concrete Beams with Shear Strength Prediction
Number of Datasets
Alzabeebee, et al. [29]Evolutionary polynomial regression analysisR2 of 0.93 with
Testing and Training Datasets
235
Jesika Rahman [27]AdaBoost, CatBoost, Xgboost, ANN, SVR, et al.R2 of 0.739 with
Testing Datasets with Xgboost model
507
A Shatnawi [26]Gradient boosting regression treeR2 of 0.969 with
Training Datasets
330
Shahnewaz and Alam [30]Genetic AlgorithmR2 of 0.9 with total datasets358
Kara [31]Genetic ProgrammingAAE of 11.39101
Adhikary and Mutsuyoshi [32]Neural NetworksSEM of 0.3385
Yaseen [33]M5, RF, and ELMR2 of 0.87 with
Testing Datasets with ELM model
112
Note: AAE is the average absolute error and SEM is the standard error of mean.
Table 2. Overview of the proposed formula.
AuthorsFormulas
Khuntia et al. [13] v f r c = ( 0.167 α + 0.28 V f l f d f ) f c k
Al-Ta’an et al. [14] v f r c = ( 1.6 f c k + 960 ρ 1 d a e + 8.5 β V f l f d f ) / 9
Ashour et al. [15] v f r c = 2.11 f c k + 7 V f l f d f d a + 17.2 ρ d a for a/d>2.5
v f r c = 0.7 f c k + 7 V f l f d f d a + 17.2 ρ d a 2.5 a d + 0.41 τ V f l f d f for a/d<2.5
Kara I F [31] v f r c = ρ l d c 0 c 1 ( d a ) 3 + F 1 d 0.25 c 2 + c 3 0.5 f c k ( d ) 0.5
Table 3. Overview of the datasets.
ParametersTitle 2Title 3
Compressive Strength
MPa
53.4112
Fibre Content %03
Longitudinal Ratio %0.374.78
Shear Span13.77
Cross Section
(W × D) mm
100 × 135600 × 887
Fibre TypeHooked, Crimped and Plain
Table 4. Prediction results of shear strength.
ResultsTrainTestTotal
Models R2MSEMAER2MSEMAER2MSEMAE
Xgboost0.9960.0030.0350.8520.0240.0620.8580.1110.112
ANN0.9800.0150.0260.8940.0520.0950.9270.0590.070
BNN0.9940.0050.0460.8950.0590.0970.9680.0290.074
Table 5. Prediction results of flexural strength.
ResultsTrainTestTotal
Models R2MSEMAER2MSEMAER2MSEMAE
Xgboost0.9960.0030.0350.8520.0240.0620.8580.1110.112
ANN0.9800.0150.0260.8940.0520.0950.9270.0590.070
BNN0.9940.0050.0460.8950.0590.0970.9680.0290.074
Table 6. Prediction results of shear strength.
ResultsTrainTestTotal
Models R2MSEMAER2MSEMAER2MSEMAE
Xgboost0.989 0.010 0.072 0.821 0.131 0.197 0.714 0.288 0.352
ANN0.985 0.015 0.097 0.765 0.440 0.519 0.869 0.161 0.228
BNN0.949 0.046 0.155 0.881 0.080 0.215 0.907 0.070 0.204
Table 7. Prediction results of different formulas and models.
KaraAl-Ta’anAshourKhuntiaANNXgboostBNN
SD0.4490.3680.3660.4570.1130.1390.187
Mean1.1810.8760.8790.6971.0110.9731.025
CV38.03742.01641.60265.58411.14114.33318.28
AAE0.3750.2380.2740.4340.1510.2230.103
χ0.92990.84030.95791.51530.97161.00440.9579
Note: SD is the standard deviation, CV is Coefficient of Variation, and the AAE is the Average Absolute Error.
Table 8. Per-unit of GHG emissions and price with different raw materials.
Constituents of ConcreteGWP/kg CO2 eqPrice/$/kgResource
Basic Concrete Composition
Ordinary Portland Cement0.8840.125Anderson and Moncaster [52]
Coarse Aggregates0.004290.0099Ouellet-Plamondon and Habert [53]
Fine Aggregates, Sand0.00240.0099Ouellet-Plamondon and Habert [53]
Water0.000150.0016Ouellet-Plamondon and Habert [53]
Supplementary Materials
Silica Fume0.003130.5Ouellet-Plamondon and Habert [53]
Blast Furnace Slag0.03290.05Kim, et al. [54]
Superplasticizer0.74925Ouellet-Plamondon and Habert [53]
Steel Fibre 2.21Qin and Kaewunruen [55]
Steel Rebar0.720.56536Özdemir, et al. [56]
Table 9. Prediction results of GHG emission.
ResultsTrainTestTotal
Models R2MSEMAER2MSEMAER2MSEMAE
Xgboost0.9990.0010.0200.8940.0230.0500.9700.0250.067
ANN0.9800.0110.0300.9710.0050.0560.9540.0350.070
BNN0.9860.0020.0420.9810.0170.0530.9740.0220.063
Table 10. Prediction results of Cost budget.
ResultsTrainTestTotal
Models R2MSEMAER2MSEMAER2MSEMAE
Xgboost0.999 0.001 0.019 0.852 0.043 0.077 0.973 0.023 0.080
ANN0.981 0.009 0.024 0.980 0.002 0.035 0.943 0.039 0.056
BNN0.989 0.018 0.053 0.981 0.002 0.042 0.977 0.020 0.082
Table 11. Beam details from the Tahenni, Bouziadi, Boulekbache and Amziane [60].
ConcreteCompressive StrengthFibre ContentAspect RatioShear Force (kN)Shear Stiffness (kN/mm)
HSC650-30.8118.19
FRHSC-1-606416546.2818.51
FRHSC-1-856028050.8222.18
FRHSC-2-6063.116546.8720.06
FRHSC-2-856528052.522.85
Beam Information
Cross Section100 × 150 mm
Shear Span Ratio 2.2
Longitudinal reinforcement ratio 1.16%
Table 12. Predicting results compared between FEM and BNN models.
ResultsShear Strength (MPa)Shear Stiffness (kN/mm)
Models HSCFRHSC-1-60FRHSC-1-85FRHSC-2-60FRHSC-2-85HSCFRHSC-1-60FRHSC-1-85FRHSC-2-60FRHSC-2-85
Exp2.33 3.51 3.85 3.55 3.98 18.19 18.51 22.18 20.06 22.85
FEM-3.343.83---18.1120.85--
Exp/FEM-1.051.00---1.021.06--
BNN2.93 3.30 3.64 3.63 4.02 17.11 18.62 24.37 19.37 29.44
Exp/BNN0.80 1.06 1.06 0.98 0.99 1.06 0.99 0.91 1.04 0.78
Table 13. C60 steel fibre-reinforced concrete mix.
Mix FromCementWaterSandGravelFibre ContentSPSlagSF
Gao, et al. [61]52916464611100, 0.5%, 1% and 1.5%6.348--
Zheng, et al. [62]451.8164660.81078.20, 0.5%, 1%, 1.5% and 2%4.9--
Li, et al. [63]400164.3557.21099.50, 0.5%, 1% and 1.5%7.225105
Note: The unit of the parameters are kg/m3.
Table 14. Predicted results of assumed study.
Fibre
Content
Shear
(MPa)
Flexural
(N·m)
Stiffness
(N/mm) 103
Carbon Emission
(kg CO2 eq)
Cost
($)
Ranking
Gao, Huang, Yuan and Gu [61]01.46863.9834.16237.96111.853
0.51.91964.1135.21240.53113.69
12.381070.5739.55243.06115.51
1.53.041163.9542.24245.56117.32
Zheng, Wu, He, Shang, Xu and Sun [62]01.25744.4227.05220.13100.332
0.51.73832.1728.77222.68102.16
12.211038.9031.86225.20104.00
1.52.751108.7935.25227.70105.84
23.491112.1338.64230.20107.70
Li, Xue, Fu, Yao and Liu [63]01.44897.1734.12226.8289.251
0.51.891051.4735.20229.3491.12
12.361088.2239.56231.8492.99
1.52.991130.0441.66234.3494.85
Disclaimer/Publisher’s Note: The statements, opinions and data contained in all publications are solely those of the individual author(s) and contributor(s) and not of MDPI and/or the editor(s). MDPI and/or the editor(s) disclaim responsibility for any injury to people or property resulting from any ideas, methods, instructions or products referred to in the content.

