Abstract
Hazardous waste may be an environmental and public health threat if not managed properly and may contribute to a regional multi-hazard when other natural disasters also exist. Hazardous and toxic waste may cause industrial disaster if its risks are not well identified and mitigated. This study aims to model the city/district-based risk assessment for each type of hazardous waste in Central Java Province for anticipating hazardous waste disasters and necessary responses. The concept of disaster is used as the method in this study, consisting of hazard, vulnerability, and capacity. The results showed that the generation of hazardous waste in Central Java Province was very large, amounting to 2,886,974.024 tons in 2021. The hazardous waste produced was sourced from 1233 types of businesses/activities in Central Java Province, with 4042 types of hazardous waste. The healthcare sector is identified as the sector that produces the most hazardous waste. Overall, the risk levels of the majority of hazardous waste types fall into the low category.
1. Introduction
Hazardous waste is waste with hazardous properties that can be flammable, corrosive, reactive, or toxic [1]. Hazardous waste can be a risk to human health because of its quantity, concentration, and physical or chemical characteristics that can cause illnesses and significantly contribute to increased mortality. Furthermore, it can also pose a danger to the environment if it is not properly managed [2]. To seek the appropriate management for hazardous waste in each setting, risk assessment is needed to determine the risk priority, which can help the decision makers to identify any possible actions that can be taken to manage the risks [3].
One of the main sources of hazardous waste is industries that involve heavy metals in their activities, such as electronic, painting, metal formation, and automobile industries. Industries that produce volatile chemicals, flammables components, organic solvents, nuclear reactors, and petroleum also become a source of hazardous waste [4]. The types of hazardous waste produced by each business sector are also very diverse. In China, there are 3000 hazardous chemicals that are currently being produced and used, with 148 of them identified as highly toxic materials [5]. In Spain, the largest amount of hazardous waste was identified in the manufacture sector, specifically in the base-metal industry, which generated 2.63 million tons of hazardous waste, followed by the chemical, pharmaceutical, rubber, and plastic industries as the second largest producers of hazardous waste with 1.45 million tons. Meanwhile, industries that produce computers, electronics, optical products, electrical equipment, and motor vehicles ranked 3rd among the industries that produced the highest amount of hazardous waste, generating 656,000 tons of hazardous waste in 2016 [6].
The existence of industry in a region does indeed help to improve the local economy, but it can also lead to disasters, known as industrial disasters, triggered by technological failures. Densely populated urban areas with unplanned allocation of infrastructure, especially the industrial and warehousing facilities, can be under risk of fires, explosions, or toxic substance release in the areas near the community [7]. Those events will not only kill or injure many people inside and outside the factory, but the spread of these hazardous substances will also damage the environment around the factory.
Hazardous waste is one of the causes of global ecological hazards, as well as the cause of environmental disasters [5]. Several investigations had been taken in the past which indicate improper waste management, specifically poor and illegal practices of hazardous waste disposal, which had caused contamination of soil and groundwater [8]. Contaminated sites were found in regions in many low- and middle-income countries, such as Ramis River in Peru, which was polluted by arsenic from mine tailings, affecting 15,000 local residents who used the river as their source of drinking water; the soil in Eastern Ghana which was polluted by mercury due to gold mining activities, which put more than 5000 people at risk; the soil and air in an industrial town in Kazakhstan which was polluted by lead, putting 40,000 people who were inhaling the highly contaminated vapors at risk; and hexavalent chromium which was found polluting the rivers, waterways, soil, and fields in India, risking the life of 60,000 local residents [9]. There are also notable catastrophic events in Japan even though the country is highly developed, such as Minamata disease which killed more than 1000 people because of methylmercury ingested by the fish in the water, and Itai-itai disease, which killed 380 people residing in rice farming areas irrigated by a river contaminated by cadmium. Many contaminated sites were a result of both earlier and present industrial activities that caused an accumulation of countless hazardous chemical contaminants in the environment [10]. Therefore, hazardous waste should be managed properly to prevent it from polluting the environment and posing threats to human health.
Disaster events can be calculated by measuring the potential losses that may be caused by paying attention to hazards which have the potential to cause damage or loss of human life. Attention also needs to be given to vulnerability, which is a compilation of conditions and circumstances of consequences (physical, social, economic, and environmental factors) that can adversely affect disaster relief efforts. In determining the danger of hazardous waste, there are various conditions that are characteristic of hazardous waste [11] including dangerous nature; toxic to human health; exposure routes of hazardous waste that can pose a danger to humans [12]; physical form, composition, and reactivity (fire and explosion) [13]; location, types and existing laws and regulations [12]; the amount of hazardous waste generation [12,13], and the quantification of which has the potential to create an emergency in the event of accidental spillage and release of hazardous waste from various locations.
It is also necessary to consider the capacity of the community. Capacity is the strength and potential ability to prevent, survive, reduce, and be prepared for an emergency and disaster [14,15,16]. Public policy and the national disaster management used to put their focus on recovery or relief efforts after the disaster happened. However, resources are limited, especially when the scale of disaster increases [17]. Several efforts should be taken to improve the capacity of the community, such as issuing disaster risk reduction policies; establishing effective coordination and operational cooperation between all related organizations and institutions with the protection and rescue forces; providing infrastructure and equipment with the aims to protect and rescue; holding training for disaster preparedness; and performing risk assessment to develop protection and rescue plans [18].
Assessing the risk of hazardous waste in thousands of contaminated sites used to be a difficult process in United States before the Hazard Ranking System (HRS) was published by the Environmental Protection Agency (EPA) in 1990 [9]. Meanwhile, the Government of the Republic of Indonesia has also released a regulation in 2018 in the form of Regulation of the Minister of Environment and Forestry Number P.101/Menlhk/Setjen/Kum.1/11/2018 on Guidelines for Recovery of Hazardous and Toxic Waste-Contaminated Land. The regulation consists of hazardous waste categories, contaminant impacts on those affected, hazardous waste management, the existence of institutional for hazardous waste emergency response in provincial scale, and emergency programs. However, there are few differences between both regulations. For example, in EPA, the pathways are also included and evaluation is still needed to assess the likelihood of future or continuing release, and migration potential of the hazardous materials [9], while this is not the case in the Ministerial Regulation.
In Indonesia, the generation of hazardous waste has also increased from 200,000 tons/year in 1990 to 1,000,000 tons/year in 2010 [9]. The province with the third-largest population in Indonesia is Central Java Province. This province has 35 districts/cities with a total population of 36,742,501 people. The number of working factories in Central Java continues to rise as both foreign and local investments pour in.
Currently, existing studies on hazardous waste risk assessment in Indonesia are still limited, whereas risk assessment is very important to protect the public health and the environment. Without a proper, accurate, and detailed risk assessment, the impact of hazardous waste on the community will be unpredictable and proper mitigation actions cannot be taken, leading to possible huge impacts to the community. Hence, performing risk assessment is important to overcome hazardous waste disasters in Central Java. This study aims to model the city/district-based risk assessment for each type of hazardous waste in Central Java Province for anticipating hazardous waste disasters and necessary responses, with the development of identification parameters or elements of hazardous and toxic substances and hazardous and toxic waste risk assessment as the primary novelty aspect of this study. Furthermore, remodeling the risk and causes of risk in industrial disasters by categorization of the disaster, hazardous and toxic substances, and hazardous and toxic waste aspects is also conducted.
2. Materials and Methods
2.1. Research Location
This research was performed in Central Java Province, Indonesia.
2.2. Data Collection
Data collection methods applied in this study were in-depth interviews and focus group discussions with local industries and environmental and forestry key personnel in Central Java’s Districts using a well-developed checklist approved by the Ministry of Environmental and Forestry (MEF). After data collection was completed, risk assessment was conducted using a semi-quantitative analysis, with probability, vulnerability, and hazard criteria based on the Ministry of Environment and Forestry (MEF)-approved method. The potential hazards and the level of exposure were scrutinized in the risk assessment. Referring to the Regulation of the MEF Number 74 of 2019 on Hazardous Material and Hazardous Wastes Management Emergency Program, data and information required for risk assessment are:
- type of industries,
- activity of industries,
- hazardous waste category,
- hazardous waste classification,
- hazardous waste generation,
- source of hazardous waste,
- potential threats to public health,
- hazardous waste management capacity,
- the existence of institutions for hazardous waste emergency response,
- provincial hazardous waste emergency program.
Based on the provisions of the Ministry of Environment’s regulations, business units/activities in Indonesia are divided into 6 sectors: manufacture, agroindustry, energy and oil and gas mining, infrastructure, services, and health care (Table 1). The source of data was the recording and reporting system of the Ministry of Environment and Forestry of the Republic of Indonesia.

Table 1.
Industry Sector Classification According to the Regulation of the Ministry of Environment and Forestry in Indonesia.
2.3. Risk Analysis and Risk Rating
Data that were relevant to hazardous waste were categorized based on the hazardous waste category, hazardous waste classification, hazardous waste generation, source of hazardous waste, potential threats to public health, hazardous waste management capacity, institutional hazardous waste emergency responses, and provincial hazardous waste emergency program. According to Peraturan Pemerintah Republik Indonesia No. 22/2021, category 1 is for hazardous materials that have an acute (fast or sudden) and direct impact on humans, as well as a negative impact on the environment. Meanwhile category 2 is for a hazardous material that has a non-acute effect (delay) and has an indirect impact on humans and the environment. This category has toxicity that tends to be sub-chronic or chronic (long-term). The collected data were assessed to determine the risk rating using the risk potential hazard value criteria as listed in Table 2.
Table 2.
Hazardous Waste Potential Hazard Value Criteria.
After the risk had been rated, data were calculated using the following formula:
2.4. Risk Matrix
All results of the categorization of hazardous waste, hazardous waste generation, number of impacted populations, hazardous waste management capacity, institutional hazardous waste emergency response, and provincial hazardous waste emergency program were given a score using a Likert scale of 1 to 3 to determine the probability of risk. The scores of 1.5–3, 0.8–1.5, and 0–0.7 are categorized as high, medium, and low risks, respectively (Figure 1).
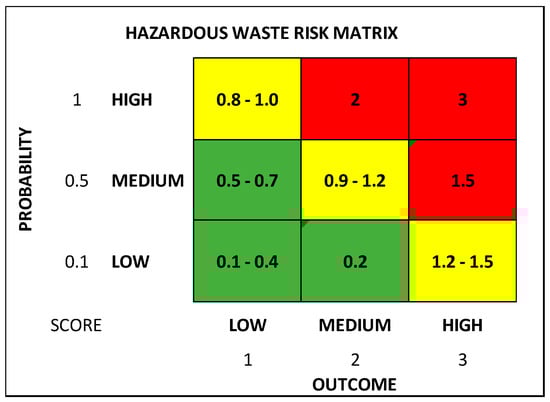
Figure 1.
Hazardous Waste Risk Matrix.
2.5. Data Analysis
The scores acquired from the risk level were summed up and divided by the number of samples to obtain the average score of the industrial disaster potential.
2.6. Risk Mapping
This mapping used the Geographic Information System (GIS) to portray districts in Central Java based on the risk level of hazardous waste. Based on this mapping, the trend, distribution, and identification of which district that has the highest risk were analyzed.
2.7. Ethical Approval
This study was approved by of the Research and Community Engagement Ethical Committee of Public Health, Universitas Indonesia, with the approval number Ket-35/UN2.F10.D11/PPM.00.02/2023.
3. Results
3.1. General Description of Central Java and Hazardous Waste Generation
Central Java, as reflected by its name, is a 32,801 km2 area located in the central part of Java Island with a large population totaling 37.49 million [10]. There are 1233 units of businesses/activities/industries in Central Java, generating 4042 types of hazardous waste. In 2021, the total amount of hazardous waste generated in Central Java was 2,886,974.024 tons. The healthcare sector was the sector that generated the largest amount of hazardous waste in this province, which is in line with the number of residents in Central Java Province as the province with the 3rd largest population in Indonesia, which makes it necessary to have a large number of health care facilities. The breakdown of the amount, average, minimum–maximum, and standard deviation of hazardous waste generation by sector of various business units/activities is presented in Table 3.
Table 3.
Hazardous Waste Generation Data (Tons/Year) By Sector in Central Java Province in 2021.
The city/district that produced the most hazardous waste generation was Kebumen District, while the district that produced the least hazardous waste was Karanganyar District. On average, each city/district in Central Java Province produces hazardous waste of 671.858 tons/year, with a very wide minimum and maximum value range of 0.00001–1,541,386 tons/year. The following (Table 4) is the amount of hazardous waste generation, average, maximum and minimum, as well as the standard deviation from hazardous waste generation based on city/district in Central Java Province:
Table 4.
Amount of Hazardous Waste Generation (Tons/Year) by District/City in Central Java Province in 2021.
When the generation of hazardous waste was identified per sector by city/district, the generation of hazardous waste in the manufacture sector was mostly occurred in in Boyolali District. The generation of hazardous waste in the agro-industrial sector mostly occurred in Kudus District. In the energy and oil and gas mining sectors, most hazardous waste was generated in Jepara District. The city of Semarang produced the most hazardous waste in the infrastructure sector while Magelang District produced the most hazardous waste in the service sector. In the health care sector, Kebumen District produced the most hazardous waste. Details of hazardous waste generation by district/city and sector are found in Table 5.
Table 5.
Hazardous Waste Data (Tons/Year) of Various Sectors by City/District in Central Java Province in 2021.
3.2. Types and Characteristics of Hazardous Waste in Central Java Province
From all hazardous waste produced in Central Java Province from all sectors, most had the characteristics of toxicity. However, there was also hazardous waste with flammable, corrosive, reactivity, and infectious characteristics. The following (Table 6) was the results of the type and characteristics of hazardous waste identification in Central Java Province:
Table 6.
Identification of Type and Characteristics of Hazardous Waste by Sector in Central Java Province in 2021.
3.3. Descriptive of Hazardous Waste Potential Criteria
Majority of the hazardous waste category produced in Central Java Province were identified as value 1 (hazardous waste category 2). Hazardous waste generation were mostly less than 10 tons. All cities & districts already have management of hazardous waste. The following (Table 7) was the description of hazardous waste score in Central Java Province:
Table 7.
Description of Hazardous Waste Score in Central Java Province in 2021.
3.4. Hazardous Waste Risk Level by City/District
Based on the risk calculations, the average risk of hazardous waste in Central Java Province was 0.501. Rembang District had the highest risk score for the hazardous waste type, with an average of 0.684, while Wonosobo District had the lowest risk value for the hazardous waste type at 0.409. The results of the risk analysis of hazardous waste types by district/city in Central Java Province are presented in the following Table 8 below:
Table 8.
Hazardous and Toxic Waste Risk Score by District/City in Central Java Province in 2021.
Most cities/districts in Central Java Province had an average percentage of hazardous waste type risk level in the low category (Figure 2). Rembang District had a large percentage of the medium risk level category for hazardous waste.
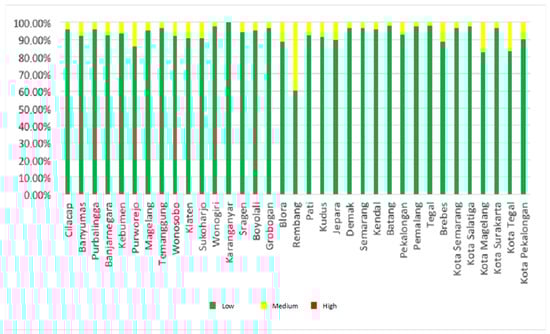
Figure 2.
Average Percentage of Hazardous Waste Risk Level by District/City in Central Java Province in 2021.
3.5. Geographical Distribution Patterns of Hazardous Waste
Figure 3 and Figure 4 depict the geographical distribution of the hazardous waste producing sector. It is clear that the geographical distribution of the hazardous waste-producing sector in Central Java Province (purple dot) tends to be evenly distributed and centered in the middle of the province, following the existence and geographical positions of large cities/districts.
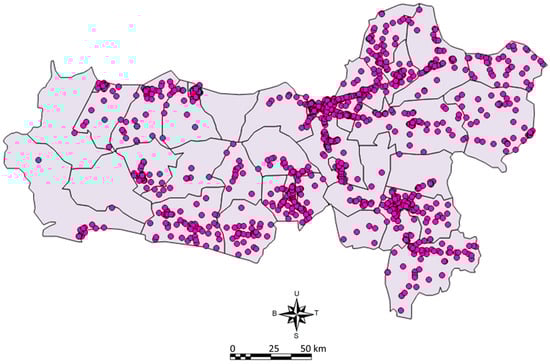
Figure 3.
Spread of the hazardous waste-producing sector in Central Java Province.
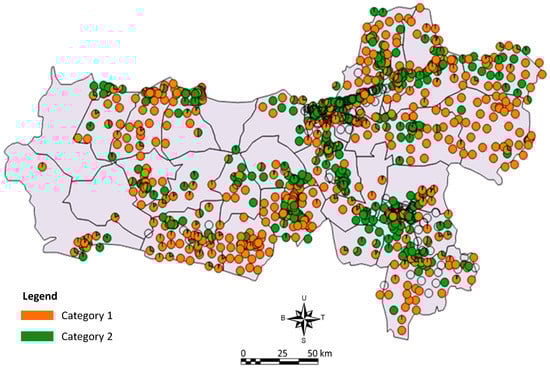
Figure 4.
Composition of hazardous waste categories 1 and 2 in Central Java Province.
Figure 4 shows that the composition of the hazardous waste-producing sector in Central Java Province, which shows an almost similar proportion between category 1 and category 2 hazardous waste categories.
Figure 5 demonstrates that that category 1 hazardous waste hotspots in Central Java Province overlapped with each other, especially the hazardous waste-producing sector points from health care facilities, industrial areas, and oil and gas and mining fields. Meanwhile, the category 2 hazardous waste hotspots overlapped with the hazardous waste-producing sector points from the electrification and industrial fields (Figure 6). This is supported by the modeling of the composition of hazardous waste category 1 (Figure 7) which shows health care, industry, and manufacture sites as the sectors that produced hazardous waste category one in Magelang district, Jepara district, Sukoharjo district, and Semarang City. In contrast, it was somewhat different for the modeling the composition of hazardous waste category 2 (Figure 8) which showed the electricity, oil and gas, and industry sector domination in various areas, including Jepara, Sukoharjo, Temanggung, Demak, Wonogiri, Salatiga, Pekalongan, Cilacap, and Semarang districts/cities.
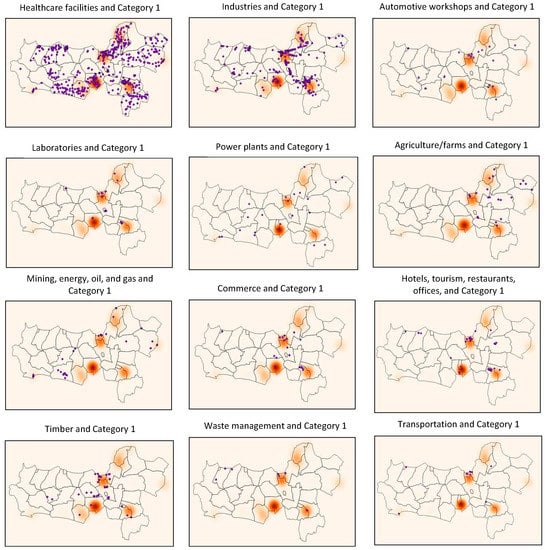
Figure 5.
Relationship between Hazardous Waste-Producing Sector Distribution (Purple Point) and Category 1 Hazardous Waste Hotspot (Orange Dot) in Central Java Province.
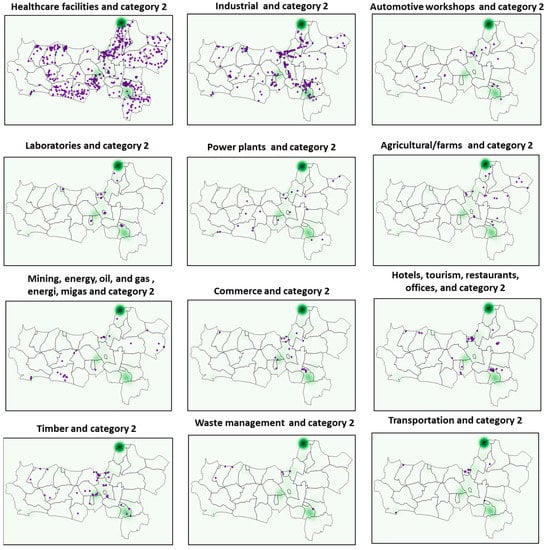
Figure 6.
Relationship between the Distribution of Hazardous Waste-Producing Sector (Purple Point) and Hazardous Waste (Green Dot) Category 2 Hotspots in Central Java Province.
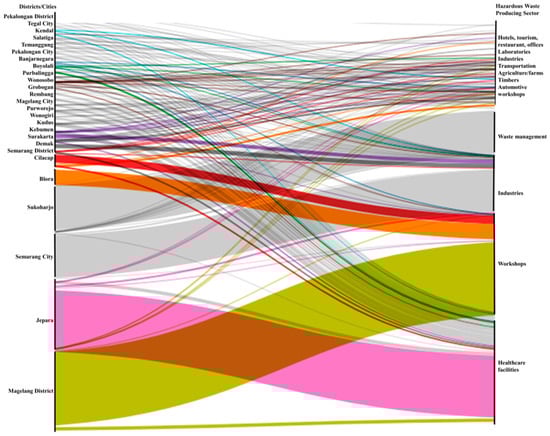
Figure 7.
Modeling of Hazardous Waste Category 1 Composition in Central Java Province.
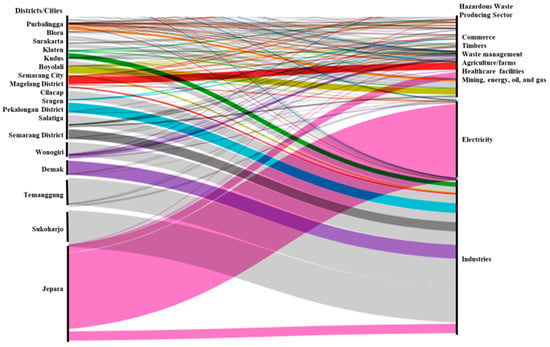
Figure 8.
Modeling of Hazardous Waste Category 2 Composition in Central Java Province.
3.6. Disaster Risk Index in Central Java Province
The Indonesian Disaster Risk Index (Index Risiko Bencana Indonesia, IRBI) is an index which describes the risk level of disasters within certain areas (province or district). Thus, the calculation of the disaster-prone index is obtained from the casualties (deaths and injuries) and damage (houses and facilities/infrastructure) as the impacts of a disaster and population density. In calculations using the IRBI, the index studied is the disaster risk. Disaster risk is an assessment of the likelihood of an estimated impact if the hazard becomes a disaster. Therefore, the calculation emphasizes the potential possibility and magnitude of the impact as measured by the exposure of each hazard and the combination of several existing hazards (multi-hazard). IRBI currently focuses on natural disasters, whilst the need to include industrial disaster in the future is already identified.
Central Java Province has five active volcanoes, namely Mount Slamet, Mount Dieng, Mount Sindoro, Mount Sumbing, and Mount Merapi. In addition, Central Java is also home to several active faults across the area, namely the Baribis Kendeng Fault, Ajibarang Fault, Ungaran Fault, Merapi-Merbabu Fault, Muria Fault, and Pati Thrust Fault. In the south of Central Java, there is also the Java Megathrust Zone with a Central Java Segment. This condition puts the districts/cities in Central Java Province in a moderate- to-high risk class, with all types of threats faced by this province. As many as 26% of districts/cities have a high IRBI category. The highest IRBI score is identified in Brebes District, while the lowest is found in Surakarta City. Based on the 2021 IRBI, Central Java Province has a risk index of 125.73 (moderate). The Disaster Risk Index score in Central Java Province by district/city is presented in Table 9.
Table 9.
Disaster Risk Index Score and Category by District/City in Central Java Province in 2021.
Description of disaster risk level categories at the provincial level is provided below:
- Total Score of <13: Class 1 → Low-Risk Class
- Total Score of 13–144: Class 2 → Medium-Risk Class
- Total Score of >144: Class 3 → High-Risk Class
According to the IRBI, the high-risk threats in Central Java Province are forest and land fires, droughts, and floods. Forest and land fire disasters dominate the cities or districts in Central Java Province. Table 10 describes the level of natural disaster risk in Central Java in more detail.
Table 10.
Risk Index Score by Disaster Type by City/District in Central Java Province in 2021.
4. Discussion
4.1. Central Java and Hazardous Waste Generation
The results of this study suggested that Central Java has a variety of kinds of hazardous waste (HW) generated in the area, comprising of 4042 types of HW that are generated in large amounts, totaling 2,886,974,024 tons during 2021. This amount is similar to the total HW produced in the whole of Nigeria [4]. Our results suggest that the sector that generates the largest amount of hazardous waste is the healthcare sector. This is likely linked to the large population of Central Java Province which makes it necessary for this province to provide a large number of health care facilities. This condition is reinforced by a map showing the generation of hazardous waste from health care facilities that spreads throughout Central Java Province. This situation is different from the situation in Spain, where the manufacturing sector accounts for 80% of hazardous waste generation, with the service sector as the second hazardous waste-contributing sector [7]. In China, hazardous waste generation accounts for 11.62 million tons in 2005 [18]; hence, the hazardous waste generated in Central Java is much higher when compared to China. The different waste generation amounts in different sectors are likely to be influenced by the activities of each type of business in an area. In addition, the range of hazardous waste generation produced from each type of hazardous waste in each city is very wide. This is because there is no uniform guideline on how to calculate the risk analysis of hazardous waste. Indeed, the large amount of hazardous waste generated create a high risk to the large population of Central Java Province, as well as creating a huge challenge in the environmental management. Furthermore, any failure on hazardous waste management will bring a high potential risk to the human health within the province.
4.2. Types and Characteristics of Hazardous Waste in Central Java
Most hazardous waste produced in Central Java is toxic waste, followed by flammable, corrosive, reactive, and infectious waste. In Nigeria, toxic waste is also the most produced hazardous waste, generated from carbon dioxide gas flaring, electronic waste, household waste, and oil spillage [19]. The government of Central Java needs to be prepared for potential industrial disasters derived from hazardous waste. Indeed, the diverse types of hazardous waste produced in the province make it mandatory for this province to have a better hazardous waste management, including the basic approach from EPA’s Cradle-to-Grave Hazardous Waste Management Program, as well as better hazardous waste generation identification, transportation, recycling, treatment, storage, disposal, and regulations [20]. Emergency responses in case of failures in hazardous waste management need to be prepared, including the emergency response plan, emergency responders, human resources capacities, infrastructure and response facilities, coordination, and communication system for better emergency responses under potential hazardous waste emergencies. The government of Central Java needs to implement the Penta helix approach in collaboration with the industries and communities to deal with industrial disasters. The Penta helix approach involves academia, industry, communities, the media, and government in accident prevention, risk communication, industrial disaster response, and recovery [20].
4.3. Hazardous Waste Risk Level in Central Java
Most cities/districts in Central Java Province have a low risk for hazardous waste (92.52%), with a small percentage of cities/districts in the medium category (7.48%). No city/district is in the high-risk category for hazardous waste. This is likely due to the fact that the amount of hazardous waste generated in each type of business/activity is so large that when it is categorized using the existing formula, the result still shows the low-risk category. The regulation of the Government of the Republic of Indonesia is different from the EPA. The Government Regulations of the Republic of Indonesia stated that the generation of hazardous waste with a weight of more than 30 tons (300,000/month) is considered to reflect a high-risk category. Meanwhile, when referring to the EPA, the high-risk generation of hazardous waste is achieved when the waste generated is more than 1000 kg/month. Thus, it is necessary to recalculate and regroup for the determination of category of hazardous waste generation.
From the perspective of the city/district, Rembang District (40%) has a medium average risk for hazardous waste while the area with the lowest category risk is Karanganyar District (100%). Although the risk level of each type of hazardous waste is still mostly low, the Provincial government must be aware of the existence of multi-hazards, because this province is prone to natural disasters, such as floods, forest and land fires, and droughts. If hazardous waste is not managed properly and a flood occurs, the waste will spread to various regions in Central Java, affecting a broad area and a lot of people. Mismanagement of hazardous waste in some developing countries have shown to cause environmental contamination and major threats to public health [21].
4.4. Geographical Distribution Patterns of Hazardous in Central Java
Based on our GIS mapping, it is clearly shown that the distribution of hazardous waste in Central Java is quite disperse throughout the area. Meanwhile the distribution of industrial plants as a source of hazardous waste in Changhua County in Taiwan is clustered in some areas [22]. The potential risks of environmental damage and contamination should be a high concern since the majority of the areas in this province generate hazardous waste. Indeed, environmental monitoring of potential contamination to environmental media including air, water and land should be strictly conducted to prevent environmental damage and potential leachate of hazardous waste to the environment. The health and safety of the workers should also be a concern as they are vulnerable to hazards, as shown in the case of Dhaka [23,24] where operators did not consider the occupational health and safety of their employees, leading to potentially dire consequences. Furthermore, since most of the hazardous waste is derived from healthcare facilities, it is suggested that proper infectious hazardous waste management should be implemented to prevent uncontrolled final disposal sites, such as those in Palestine [25]. Since Central Java also has a high risk of natural disaster, future research is needed to evaluate the impact of natural hazards triggering technological disasters, or Natech, similar to the study conducted in Cilegon area [26,27].
5. Conclusions and Suggestions
Central Java Province consist of 35 cities/districts with a total of 1233 activities/businesses generating 4042 types of hazardous waste. In 2021, the amount of hazardous waste generated in Central Java Province was 2,886,974.024 tons, with the healthcare sector as the largest contributor to hazardous waste generation in the province. Therefore, hazardous waste management in the health care sector must receive strong attention from the local government, by making a guideline for hazardous waste management in health facilities available and by providing training for personnel who manages hazardous waste in healthcare facilities.
Most cities/districts in Central Java Province have a low risk level for hazardous waste (92.52%), with a small percentage (7.48%) in the medium category and none categorized as high risk. Although the risk level of each type of hazardous waste is still mostly low, the provincial government must be aware of multi-hazard potentials due to the existing natural disaster potential shown by a high Disaster Risk Index for this province, with forest and land fires, droughts, and floods as the potential disasters of concern.
The characteristics of hazardous waste generated in this province are mostly toxic and infectious. The geographical distribution of the hazardous waste-producing sector in Central Java shows that the geographical distribution pattern of the hazardous waste-producing sector tends to be evenly distributed and centered in the middle area due to the existence and geographical position of large cities/districts. The composition of the hazardous waste-producing sector appears to be almost similar between category 1 and category 2. Hazardous waste category 1 is generally dominated by the health care facilities, workshops, industrial areas, and oil and gas and mines in Magelang (District), Jepara, Sukoharjo, and Semarang (city), while hazardous waste category 2 is dominated by electricity, oil, and gas and industry sectors in Jepara, Sukoharjo, Temanggung, Demak, Wonogiri, Salatiga, Pekalongan, Cilacap and Semarang (district).
The healthcare sector needs to receive the most attention in hazardous waste management and preparation for relevant emergencies. Based on the characterization, most hazardous waste is toxic and infectious in nature; thus, it is crucial to prepare emergency equipment and reduce exposure to these types of waste by developing a tailored regional emergency plan and exposure reduction measures. The alternative actions that could be taken to reduce the risk from hazardous waste disaster in Central Java can be seen in the Table 11 below.
Table 11.
Risk Identifications and Recommended Actions to Reduce the Risk.
Author Contributions
Conceptualization, F.L. and Z.; methodology, F.L.; software, A.M.; validation, F.L. and Z.; formal analysis, S.F.; investigation, B.H.; resources, S.P.; data curation, S.A.S. and S.P.; writing—original draft preparation, Z.; writing—review and editing, Z., F.L., L.F. and R.S.; visualization, A.Z.; supervision, F.L.; project administration, S.F.; data analysis, S.F.; funding acquisition, Z. All authors have read and agreed to the published version of the manuscript.
Funding
This research was funded by the Research and Community Engagement Universitas Indonesia through grant number NKB-1291/UN2.RST/HKP.05.00/2022.
Institutional Review Board Statement
Not applicable.
Informed Consent Statement
Not applicable.
Data Availability Statement
Not applicable.
Conflicts of Interest
The authors declare no conflict of interest.
References
- Categories of Hazardous Waste Generators. Available online: https://www.epa.gov/hwgenerators/categories-hazardous-waste-generators (accessed on 15 November 2022).
- U.S. Environmental Protection Agency. Introduction to United States Environmental Protection Agency Hazardous Waste Identification; U.S. Environmental Protection Agency: Washington, DC, USA, 2005.
- Pascarella, G.; Rossi, M.; Montella, E.; Capasso, A.; de Feo, G.; Snr, G.B.; Nardone, A.; Montuori, P.; Triassi, M.; D’auria, S.; et al. Risk analysis in healthcare organizations: Methodological framework and critical variables. Risk Manag. Healthc. Policy 2021, 14, 2897–2911. [Google Scholar] [CrossRef] [PubMed]
- Hassan Amal, I.; Saleh, H.M. Hazardous Waste Management. 2022. Available online: https://remote-lib.ui.ac.id:2075/10.1016/B978-0-12-824344-2.00012-4 (accessed on 5 December 2022).
- Xu, L.; Deng, Y.; Mancl, K. Environmental disaster risk reduction-oriented centralized treatment of hazardous wastes: A novel approach for production-distribution decision optimization in China. Int. J. Disaster Risk Reduct. 2019, 40, 101263. [Google Scholar] [CrossRef]
- Camacho, J.A.; Ruíz-Peñalver, S.M.; Rodríguez, M. Identification of leading hazardous waste-generating industries with high improvement potential in Spain. Sci. Total Environ. 2020, 731, 139207. [Google Scholar] [CrossRef] [PubMed]
- Das, A.; Gupta, A.K.; Mazumder, T.N. Vulnerability assessment using hazard potency for regions generating industrial hazardous waste. J. Hazard. Mater. 2012, 209, 308–317. [Google Scholar] [CrossRef] [PubMed]
- Fazzo, L.; Minichilli, F.; Santoro, M.; Ceccarini, A.; Della Seta, M.; Bianchi, F.; Comba, P.; Martuzzi, M. Hazardous waste and health impact: A systematic review of the scientific literature. Environ. Health 2017, 16, 107. [Google Scholar] [CrossRef] [PubMed]
- Caravanos, J.; Gualtero, S.; Dowling, R.; Ericson, B.; Keith, J.; Hanrahan, D.; Fuller, R. A Simplified Risk-Ranking System for Prioritizing Toxic Pollution Sites in Low- and Middle-Income Countries. Ann. Glob. Health 2014, 80, 278. [Google Scholar] [CrossRef] [PubMed]
- Martuzzi, M.; Pasetto, R.; Martin-Olmedo, P. Industrially contaminated sites and health. In Journal of Environmental and Public Health; Hindawi Publishing Corporation: New York, NY, USA, 2014; Volume 2014. [Google Scholar] [CrossRef]
- Guo, J.; Luo, C. Risk assessment of hazardous materials transportation: A review of research progress in the last thirty years. J. Traffic Transp. Eng. 2022, 9, 571–590. [Google Scholar] [CrossRef]
- Antillator, B.P.; Bjerregaard, M.; Jonsson, L. Disaster Waste Management Guidelines. Environment 2011, 1–16. Available online: http://www.mendeley.com (accessed on 4 December 2022).
- Misra, V.; Pandey, S.D. Hazardous waste, impact on health and environment for development of better waste management strategies in future in India. Environ. Int. 2005, 31, 417–431. [Google Scholar] [CrossRef] [PubMed]
- Coppola, D.P. Introduction to International Disaster Management; Elsevier: Amsterdam, The Netherlands, 2006. [Google Scholar]
- Koenig, K.; Schultz, C. Koenig and Schultz’s Disaster Medicine: Comprehensive Principles and Practices; Cambridge University Press: Cambridge, UK, 2010. [Google Scholar]
- The Johns Hopkins and the International Federation of Red Cross and Red Crescent Societies. Control of communicable diseases in emergencies. In Public Health Guide for Emergencies; The Johns Hopkins and the International Federation of Red Cross and Red Crescent Societies: Geneva, Switzerland, 2007; pp. 285–371. [Google Scholar] [CrossRef]
- Chen, F.; Shirazi, Z.; Wang, L. Building scientific capacity in disaster risk reduction for sustainable development. Cult. Sci. 2021, 4, 40–54. [Google Scholar] [CrossRef]
- Cvetković, V.M.; Tanasić, J.; Ocal, A.; Kešetović, Ž.; Nikolić, N.; Dragašević, A. Capacity Development of Local Self-Governments for Disaster Risk Management. Int. J. Environ. Res. Public Health 2021, 18, 10406. [Google Scholar] [CrossRef]
- Zangina, A.S.; Ali, A.F. An Overview of Hazardous Waste Management in Nigeria. Dutse J. Pure Appl. Sci. 2021, 7, 214–221. [Google Scholar] [CrossRef]
- Akpan, V.E.; Olukanni, D.O. Hazardous waste management: An African overview. Recycling 2020, 5, 15. [Google Scholar] [CrossRef]
- Sanito, R.C.; Bernuy-Zumaeta, M.; You, S.J.; Wang, Y.F. A review on vitrification technologies of hazardous waste. J. Environ. Manag. 2022, 316, 115243. [Google Scholar] [CrossRef] [PubMed]
- Lin, Y.; Chu, H.; Wu, C.; Chang, T.; Chen, C. Hotspot Analysis of Spatial Environmental Pollutants Using Kernel Density Estimation and Geostatistical Techniques. Int. J. Environ. Res. Public Health 2011, 8, 75–88. [Google Scholar] [CrossRef] [PubMed]
- Waste Statistics. Available online: https://ec.europa.eu/eurostat/statistics-explained/index.php?title=Waste_statistics#Hazardous_waste_generation (accessed on 6 November 2022).
- Visvanathan, C. Hazardous Waste Management in Southeast Asia. Retrieved from Asian Institute of Technology. Available online: http://faculty.ait.ac.th/visu/wp-content/uploads/sites/7/2019/01/HWMSA.pdf (accessed on 10 November 2022).
- BPS Central Java Province, Indonesia. Available online: https://jateng.bps.go.id/ (accessed on 10 November 2022).
- Rocklöv, J.; Sjödin, H. High population density catalyse the spread of COVID-19. J. Travel Med. 2020, 27, taaa038. [Google Scholar] [CrossRef] [PubMed]
- Duan, H.; Huang, Q.; Wang, Q.; Zhou, B.; Li, J. Hazardous waste generation and management in China: A review. J. Hazard. Mater. 2008. [CrossRef] [PubMed]
Disclaimer/Publisher’s Note: The statements, opinions and data contained in all publications are solely those of the individual author(s) and contributor(s) and not of MDPI and/or the editor(s). MDPI and/or the editor(s) disclaim responsibility for any injury to people or property resulting from any ideas, methods, instructions or products referred to in the content. |
© 2023 by the authors. Licensee MDPI, Basel, Switzerland. This article is an open access article distributed under the terms and conditions of the Creative Commons Attribution (CC BY) license (https://creativecommons.org/licenses/by/4.0/).