Article

Do Carbon Emission Trading Schemes Promote the Green Transition of Enterprises? Evidence from China

1
College of Economics, Ocean University of China, Qingdao 266100, China
2
Institute of Marine Development, Ocean University of China, Qingdao 266100, China
3
College of Economics and Management, Shandong University of Science and Technology, Qingdao 266590, China
*
Author to whom correspondence should be addressed.
Sustainability 2023, 15(8), 6333; https://doi.org/10.3390/su15086333
Submission received: 9 February 2023 / Revised: 5 March 2023 / Accepted: 13 March 2023 / Published: 7 April 2023

Abstract

:
As one of the environmental governance tools used to achieve green and low-carbon development in China, the ability of carbon emission trading schemes (CETS) to promote the green transition of enterprises is key to assessing the effectiveness of their implementation. Therefore, this paper used the panel data of China A-share listed heavy-polluting enterprises from 2010 to 2019, adopted the super-SBM model and GML index to measure the green total factor productivity (GTFP) of enterprises as an indicator of green transition, and further employed a staggered difference-in-difference model (DID) based on propensity score matching (PSM) to investigate the impact and mechanism of CETS on the green transition of enterprises. The results revealed that CETS significantly improved the green development efficiency of heavy-polluting enterprises and promoted green transition. In addition, the promotion was more pronounced among enterprises with weak cost transfer abilities, low levels of financing constraints, and high-quality internal control systems as well as in areas with high environmental enforcement intensity. More importantly, the mechanism analysis showed that heavy-polluting enterprises mainly chose to increase green technological innovation, especially substantive green technological innovation, and accelerated productive capital renewal to achieve their green transition targets. This study provides empirical evidence for improving the construction of the national carbon emission trading market and promoting the green transition and low-carbon development of heavy-polluting enterprises.

1. Introduction

As the issue of global warming becomes increasingly prominent, vigorously promoting carbon emission reduction has become a daunting task for the international community. China, the top emitter of greenhouse gases [1], proposed in 2015 the target of achieving carbon peaking around 2030 and reducing carbon emissions per unit of GDP by 60–65% compared with 2005 [2]. Subsequently, General Secretary Xi Jinping announced at the 75th session of the United Nations General Assembly that China would strive to achieve carbon neutrality by 2060 [3]. In recent years, the Chinese government has been committed to exploring effective governance solutions to achieve CO2 emission reduction. Among them, carbon emission trading schemes (hereinafter referred to as CETS) are a major institutional innovation to control and reduce carbon emissions and promote green and low-carbon development by using market mechanisms. Since 2013, eight provinces and cities have started CETS one after another. Shenzhen initiated trading in June 2013; Shanghai and Beijing followed in November 2013; Guangdong and Tianjin launched trading in December 2013; and Chongqing and Hubei started in April and June 2014, respectively. Then, Fujian joined them in December 2016. The national carbon emission trading market began online trading on 16 July 2021. As of 31 December, 2162 key emission units in the power generation industry were included in the national carbon emission trading market, with a cumulative turnover of 179 million tons of carbon emission allowances and a cumulative turnover of CNY 7.661 billion, while the pilot carbon emission trading market had a cumulative turnover of 483 million tons of carbon emission allowances and a cumulative turnover of CNY 8.622 billion [4].
Meanwhile, in the context of the “double carbon” goal and green development, the green transition of enterprises is drawing more and more attention at the practical level both at home and abroad [5,6,7]. In March 2021, the 14th Five-Year Plan (2021–2025) for National Economic and Social Development of the People’s Republic of China proposed the concept of green transition several times based on the goal of “double carbon” and explicitly stated that China should vigorously develop green technological innovation and promote the green transformation of key industries and important fields. However, the high resource consumption and high pollution emissions caused by China’s traditional industrial enterprise growth model have become a huge obstacle to green transition, especially for enterprises in heavy-pollution industries [8]. How to promote the green transition of heavy-polluting enterprises has become an important issue worthy of in-depth study at present.
Throughout the available studies, a portion of the literature focuses on media monitoring, green M&A, tax incentives, and financial subsidies to study the green transition of enterprises [8,9,10,11], while another portion of the literature is based on the new institutional economics theory, exploring the impact of environmental regulation on the green transition of enterprises, including environmental technology standards [12], environmental taxes [13], mandatory CSR disclosure policies [14] and green credit policy [7,15]. However, there is a lack of in-depth exploration on the policy perspective of CETS. China’s CETS is mainly designed to place restrictions on the carbon emissions of enterprises in heavy-polluting industries. For one thing, the establishment of CETS theoretically imposes carbon emission caps on regulated enterprises, forcing them to reduce carbon emissions and improve their environmental performance [16]. For another thing, it provides effective economic incentives to induce the carbon reduction behavior of enterprises, encourages enterprises to save energy, reduce emissions, and utilize low-carbon energy when making production, operation, and investment decisions, and promotes the green transformation of enterprises [17]. In practice, however, the effect of CETS depends on a range of factors, including the stringency and rationality of the policy itself and the coping strategies of micro-enterprises. It remains to be verified whether CETS will promote the development of production patterns from highly polluting to low-carbon, thus backward forcing the green transition of enterprises. In addition, the analysis of its mechanism has important theoretical and practical significance for the country to develop a green economy and promote high-quality economic development. The purpose of this paper was as follows: (1) To determine whether CETS can exert a green transition effect on heavy-polluting enterprises. (2) In particular, if the answer is yes, analyze the mechanism of CETS to exert a green transition effect on heavy-polluting enterprises. (3) Further, to determine whether there is significant asymmetry in this positive green transition effect on heterogeneous enterprises. To solve the above problem, this paper considered CETS as a “quasi-natural experiment,” used the data of A-share listed heavy-polluting enterprises from 2010–2019, and applied a staggered DID model based on propensity score matching (PSM-DID) to investigate the impact of CETS on the green transition of heavy-polluting enterprises.
This study contributes to the existing literature as follows: (1) Regarding the research topic, this paper is one of the few studies in China that provides empirical evidence for the impact of CETS on the green transition of heavy-polluting enterprises from a micro perspective. Existing research has mainly studied the impact of CETS on regional green development and industrial green transition at the macro level, but there is a lack of empirical evidence at the micro level. In fact, micro-enterprise level research can more scientifically reveal the real impact of CETS on the green transition of the economy. (2) Regarding the research methodology, this paper regarded CETS as a quasi-natural experiment. To overcome the possible impact of sample selectivity on the empirical analysis, the propensity score matching (PSM) method was used to find a suitable “control group” for the “treatment group,” and after matching, a staggered difference-in-difference (DID) analysis was conducted to obtain more reliable estimation results as far as possible. In practice, the launch of CETS is a gradual process. Most of the existing studies simply take 2013 or 2014 as the policy point, which is both unrealistic and vulnerable to confounding factors. (3) Regarding the research perspective, in addition to analyzing the green technological innovation mechanism emphasized by Porter’s hypothesis [18], this paper also tested the capital renewal mechanism, namely, CETS urges enterprises to speed up the elimination of old equipment with high energy consumption and high pollution emissions in production processes and replace it with new production equipment that is more green and environmentally friendly, thus improving production technology and energy utilization efficiency and realizing green transformation. Green technological innovation and productive capital renewal are two common approaches to green transition for heavy-polluting enterprises. The existing research usually treats them as two independent perspectives and only studies one, ignoring the complementary relationship between them. However, in reality, the difference between the actual productivity and technology levels of enterprises means that they are both feasible choices for the green transition of heavy-polluting enterprises.
The remainder of this paper is organized as follows. Section 2 is a literature review. Section 3 introduces theoretical mechanism and hypotheses. Section 4 presents the method and data of this paper. Section 5 presents the empirical results. Section 6 provides the further discussion, including the results and discussion of the mechanism and heterogeneity analyses. This research concludes with a conclusion and policy recommendations in Section 7.

2. Literature Review

2.1. Environmental Regulations and Green Transition of Enterprises

The relationship between environmental regulations and the green transition of enterprises has been discussed to some extent in the existing literature, mainly emerging the following views: First, the “regulatory disincentive” theory argues that the implementation of strict environmental regulation policies will increase the cost of coping with the regulation [19], thus having a “crowding-out effect” on the enterprises’ productive resources and investment in technology R&D [20,21] and potentially hindering the overall green transition of enterprises through the potential loss of output and profit [22]. Second, the “regulatory incentive” theory suggests that flexible environmental regulations will backward force enterprises to pay more attention to pollution reduction and clean production by constraining their polluting behavior, thus pushing them to make green technological innovation and transformation [7,12,14,15]. Different from the above two views, some other scholars believe that the relationship between environmental regulations and the green transition of enterprises is nonlinear [23,24]. For example, He and Qi [23] used the industrial pollution source key survey enterprise database and empirically found that, overall, the impact of environmental regulation intensity on the green total factor productivity of enterprises showed an inverted “U” development trend.

2.2. Research Related to Carbon Emission Trading Schemes

The CETS literature has explored many topics. One topic is to evaluate the efficiency of the construction of CETS, such as the effectiveness of carbon prices [25,26], the controllability of transaction costs [27], and the rationality of quota allocation [28,29]. Another topic is to assess the effect of CETS on the economy, society, and the environment, such as the passive impact of CETS on carbon emissions and carbon intensity [30,31] and the effect of CETS on green economic development [32,33], industry green transition [34,35], the stock market [36], productivity [37,38], and so on. However, owing to data limitations, most of the above studies focus on the macro level.
At present, a relatively small body of literature has focused on the micro (enterprises) impacts of CETS, mainly examining the impact of the policy on enterprises’ technological innovation [39,40,41], productivity [42,43], employment [44], and economic performance [45,46,47]. The impact of CETS on the green transition of enterprises has not yet sufficiently been explored. The existing literature mainly includes studies on the micro policy effects of CETS from the perspective of enterprise transition. For instance, from an enterprise behavior perspective, Dai et al. [48] used a difference-in-difference model (DID) to examine whether carbon emission trading schemes can boost the transition of manufacturing enterprises and realize the Porter effect. Using the micro data of listed companies from Chinese stock “A” markets, Tang et al. [49] found that carbon emission trading schemes are significantly beneficial to the improvement of total factor productivity of enterprises. A part of the literature, studies also include the impact of CETS on the green development behavior of enterprises from the perspective of the green technology innovation of enterprises. For example, focusing on listed companies in 31 provinces (municipalities or autonomous regions) from 1990 to 2018, Chen et al. [50] found the CETS has significantly decreased the proportion of green patents by approximately 9.26%. Luo et al. [51] examined the impact of CETS on the behavior of enterprises, such as low-carbon management, carbon asset transactions, and energy saving and emission reduction technology, and found that CETS has a positive impact on the three types of enterprise behavior. In short, few studies have explored the micro impact of CETS from the comprehensive perspective of green transition.

2.3. Research related to the Evaluation of Green Transition

There are various evaluation methods for green transition, most of which are mainly single- or multi-factor evaluation indicators. The former mainly reflects the relationship between energy consumption and economic output, which commonly includes energy intensity, energy efficiency improvement, and pollution emission reduction. For example, Zhai and An [52] used single-factor evaluation indicators to measure green transition performance. The latter used green total factor productivity (GTFP) [53,54]. The measurement methods of GTFP mainly include parametric and non-parametric methods. The parametric analysis method is represented by stochastic frontier analysis (SFA) [55]. However, SFA models need to set up a specific form of production function and make strict assumptions [56]. The non-parametric method is represented by data envelopment analysis (DEA), which does not need to strictly assume the production function’s specific form and can simulate the productivity of multiple decision-making units using the method of linear programming [57]. DEA models for measuring GTFP mainly include slack-based measure (SBM) [58], super-SBM [59], directional distance function (DDF) [60], slack-based measure directional distance function (SBM-DDF) [61], evidence-based measure (EBM) [62], etc. Because the DEA method is analyzed from a static perspective, it is unable to analyze the dynamic efficiency changes of GTFP over time. Therefore, some scholars use the Malmquist-Luenberger index (ML) based on the DEA model to evaluate the dynamic change of GTFP [63]. However, the Malmquist-Luenberger index (ML) calculation process suffers from the potential linear programming infeasibility problem. Oh [64] further proposed the global Malmquist-Luenberger index (GML) to overcome these drawbacks. At present, scholars mostly combine the DEA model with the ML or GML indexes to measure GTFP [65].
In summary, the existing literature on environmental regulations affecting the green transformation of enterprises provides critical ideas and a theoretical basis for further research in this paper. Nevertheless, these studies often have made different conclusions due to different research objects, sample periods, and other factors. In studies evaluating the effects of carbon emission trading policies, scholars have provided more discussion from the perspectives of carbon emission, economic development, productivity, and technological innovation. However, in a comprehensive view, there is still some room for improvement in the existing studies. For instance, the overall volume of research on carbon emission trading policies at the micro level is scant and primarily focuses on enterprise technological innovation, productivity, and business performance and has not yet sufficiently paid attention to the impact of policies on the green transformation of enterprises. In fact, this effect is crucial to the achievement of China’s “dual carbon” strategy goal, the overall green transformation of the economy and society, and sustainable development. Therefore, a systematic assessment of the effect of carbon emission trading policies on enterprises’ green transformation constitutes the starting point of this study.

3. Theoretical Mechanism and Hypotheses

3.1. CETS and Green Transition of Heavy-Polluting Enterprises

The green transition of an enterprise essentially requires a complete green revolution of its production. This process needs significant reinvestment and technological R&D in management concepts, institutional frameworks, production processes, and product design. The high level of investment and uncertainty of returns leads to a lack of sufficient incentives for managers to conduct the transition.
Nevertheless, after the implementation of CETS, the incentive for the green transition of a heavy-polluting enterprise may be higher under the external pressure of stakeholders, the internal cost pressure of the enterprise, and incentive factors. Regarding the external pressure, organizational legitimacy theory suggests that the behavior of an enterprise should conform to the judgmental assumptions of social rules and basic values; otherwise, it will be difficult for the enterprise to survive [66]. Green and low-carbon development is the “principal melody” of today’s economic and social development, as well as the realistic demand of external stakeholders for heavy-polluting enterprises. In practice, external stakeholders, such as suppliers, customers, creditors, and the public, assess the rationality and legality of the enterprises’ environmental actions and then carefully decide whether to continue to invest and provide them raw materials or loans [67]. Thus, under the restrictions of CETS, heavy-polluting enterprises will actively engage in green transition to gain the recognition and resources of all stakeholders. Regarding the internal cost pressure, CETS, as an external shock, will directly increase the cost of an enterprise’s pollution discharge. This cost increase will prompt managers to seriously reflect on the shortcomings of the enterprise’s green development [68], effectively compensate for the inherent deficiencies of their enterprise governance mechanisms [69], incorporate carbon emission into their production decision elements, conduct proactive environmental management strategies, and thus carry out green production. Regarding the incentive factors, heavy-polluting enterprises not only alleviate the environmental cost pressure through green transition but also provide products and services to the market that are more in line with green requirements than their competitors, thus improving their corporate reputation image, enhancing their long-term value, and gaining a sustainable green competitive advantage [70]. Given this, CETS will promote heavy-polluting enterprises to actively carry out green transition. Synthesizing the above analysis, Hypothesis 1 was proposed.
Hypothesis 1.
The conduct of the CETS will promote the green transition of heavy-polluting enterprises.

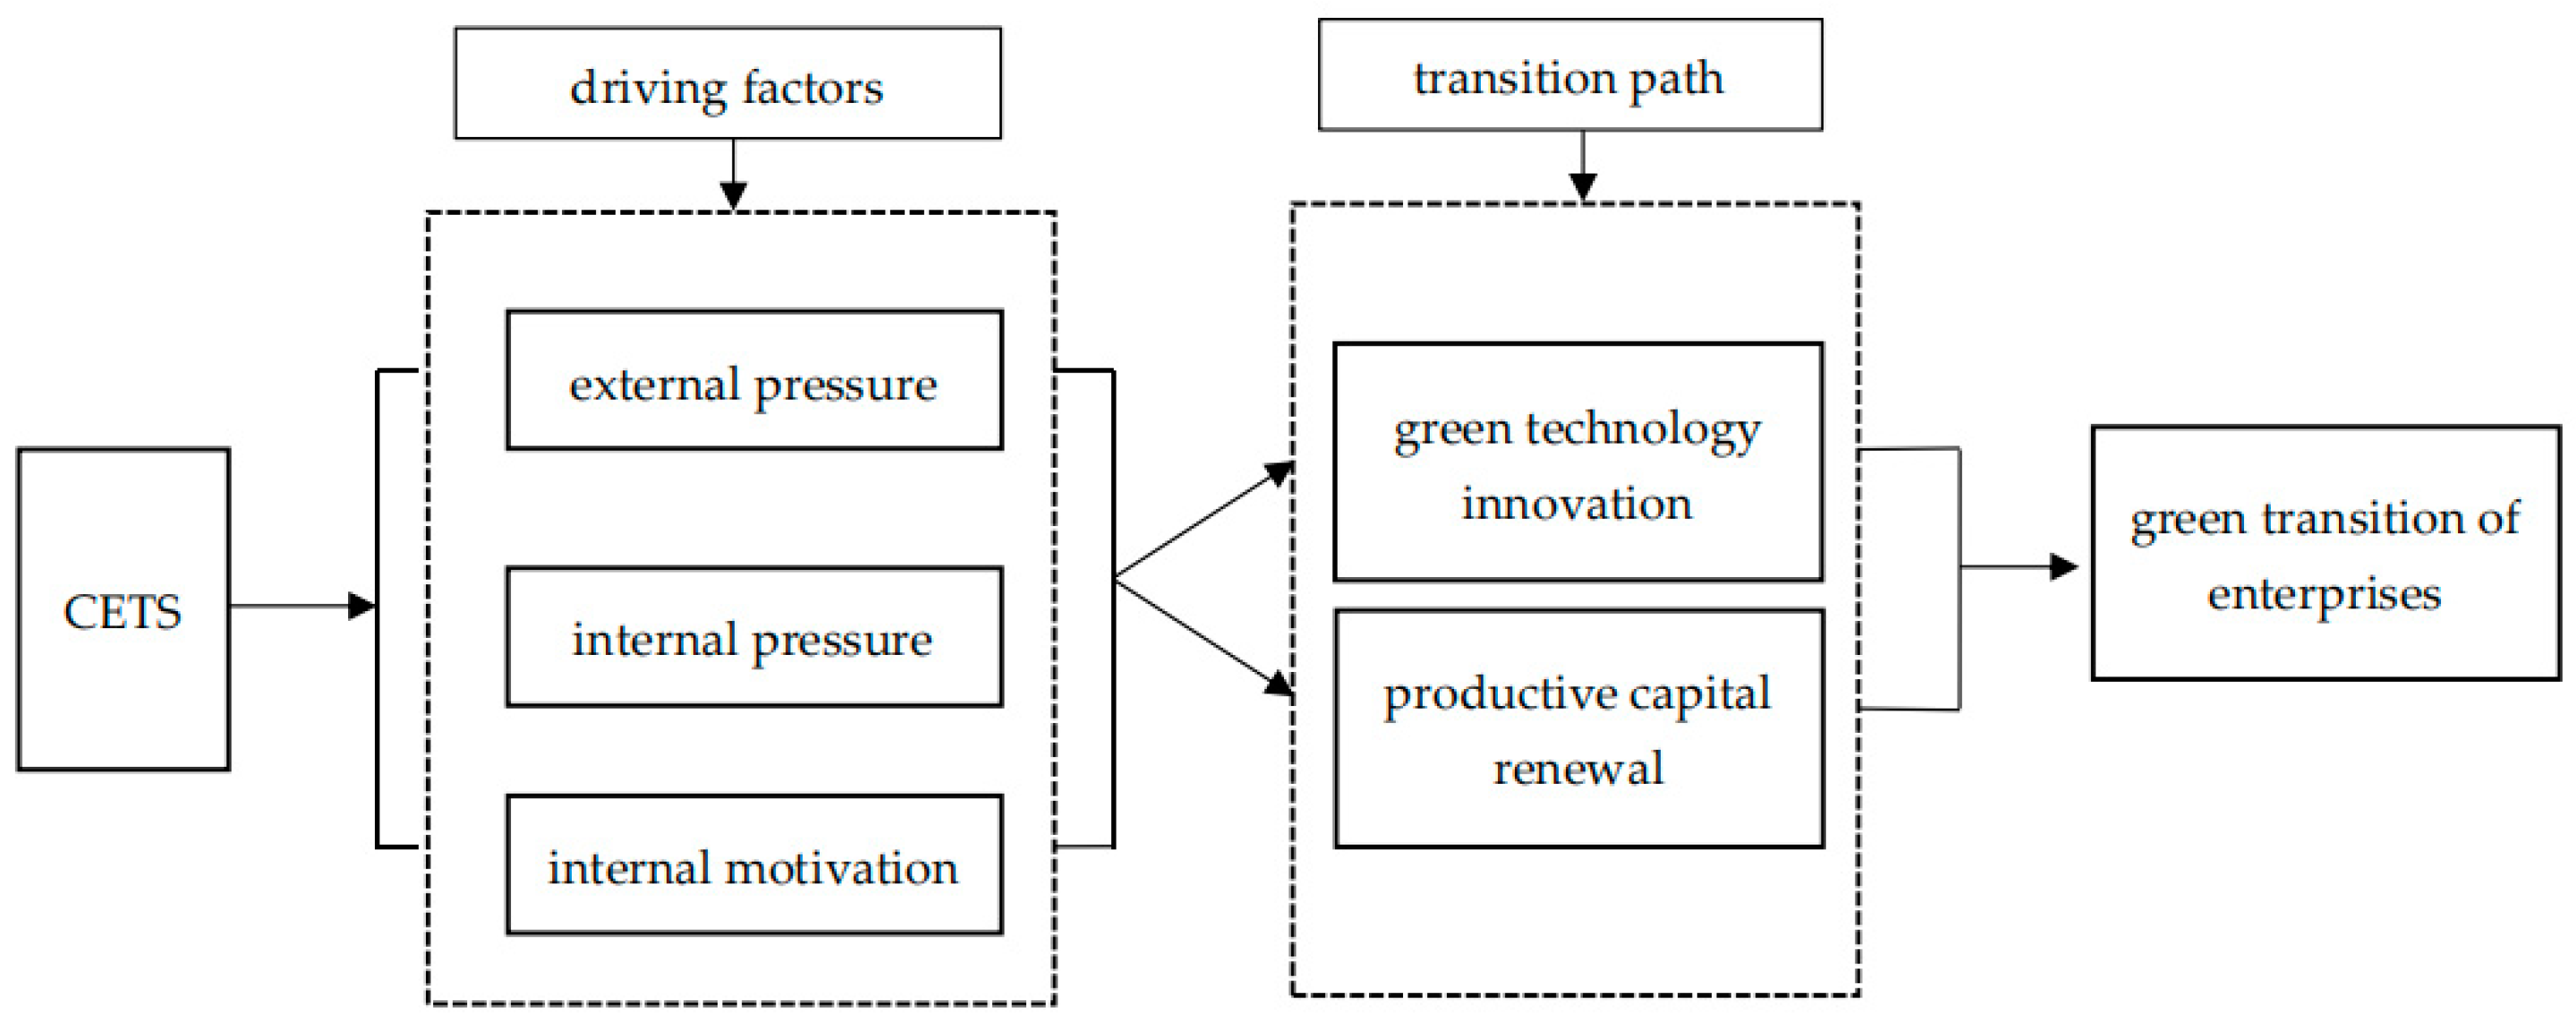
3.2. Analysis of the Impact Mechanism of CETS to Promote the Green Transition of Heavy-Polluting Enterprises

Creative destruction theory holds that the innovation compensation obtained through technological innovation is one of the most critical factors by which enterprises gain new competitive advantages and make a smooth transition [71]. However, due to the risk characteristics of technological innovation, such as high capital input, long profit cycle, and income uncertainty, the key to whether an enterprise conducts technological innovation activities depends on the degree of incentives it obtains [72].
Under the institutional arrangement of CETS, the uncertainty of enterprise technological innovation decreases [73] while the potential benefits increase, especially green technological innovation with energy conservation and emission reduction effects. This is mainly reflected in the following aspects: First, green production technological innovation can promote the efficient recycling of resources, reduce pollution emissions, and establish cost-saving advantages [74]. Second, green technological innovation is the fundamental way to reduce carbon emissions [75]. When an enterprise reduces its carbon emissions through green technology innovation and its actual carbon emissions are less than the carbon quota issued by the government, the remaining quota can obtain emission reduction benefits through carbon market transactions, which means that the emission reduction or even zero emissions achieved through green technological innovation can become an “asset” for enterprise development. Third, using green production technologies, enterprises can create new consumer demand, capture market share, and improve business performance. Thus, after the implementation of CETS, the enhanced potential benefits of green technological innovation will motivate enterprises to strengthen green technology R&D and promote green transition. Many scholars have provided evidence that CETS promotes green technological innovation in enterprises [41,42].
In fact, in addition to green technological innovation, another essential path for technological progress and productivity improvement of industrial enterprises is productive capital renewal, i.e., by renewing production equipment and thus absorbing advanced production technologies [76], which should likewise be a feasible option for the green transition of enterprises under CETS [77], especially for those with low productivity and a weak technological base [78]. Kerr and Newell [79] analyzed the data of American oil refineries from 1971 to 1995 and found that environmental regulatory policies affected the environmental performance of enterprises more by increasing the adoption of existing clean technologies than by encouraging technology R&D. Zhang and Lv [80] and Wan et al. [12] discovered similar evidence based on the cleaner production standards policy and environmental technology standards policy, respectively. Under CETS, enterprises will carry out more green technological innovation activities, but at the same time, it is very likely that they will directly rely on production equipment renewal, namely, speeding up the elimination of old production equipment with high energy consumption and high carbon emissions and replacing it with new production equipment that is more low-carbon and green, thus improving production technology, enhancing energy efficiency, optimizing energy consumption structure, increasing productivity, and thus achieving green transition. Accordingly, Hypothesis 2 was proposed:
Hypothesis 2.
CETS can promote the green transition of heavy-polluting enterprises through two paths: green technological innovation and productive capital renewal.
According to the above theoretical analysis, under carbon emission trading schemes and driven by multiple factors, such as external pressure from stakeholders, internal cost pressure, and internal incentives, enterprises incorporate green and sustainable business plans into production decision-making and actively encourage managers to carry out green innovation activities and productive capital renewal activities so as to achieve a “win-win” between environmental protection and enterprise competitiveness improvement, thereby realizing green transition. Figure 1 shows the theoretical mechanism of CETS affecting the green transition of enterprises.

3.3. Heterogeneity Analysis of CETS Promoting the Green Transformation of Heavy-Polluting Enterprises

First, according to the analysis of Hypothesis 1 in Section 3.1, the cost pressure of pollution control is an important reason why CETS forces the green transition of heavy-polluting enterprises. However, it has been shown that under the cost constraint of environmental regulations, enterprises generally have a high incentive to pass on costs [81]. Cost transfer will lower the environmental cost pressure under CETS, which in turn could affect the green transition of enterprises. The intensity of cost transfer depends to a large extent on the cost transfer ability of the enterprise. Thus, the cost transfer ability is critical in enterprise decisions about passing on the cost or conducting green transition. For example, when an enterprise has a relatively strong cost transfer ability, as evidenced by higher bargaining power with customers or greater competitiveness in the product market, it can transfer the regulatory cost to downstream customers or consumers at a lower cost, thus relieving the pressure of environmental compliance and decreasing the impetus for green transition. In contrast, when the cost transfer ability of an enterprise is relatively weak, the significant potential loss of passing on the environmental costs makes it challenging for the enterprise to do so efficiently. At this time, the incentive for an enterprise to fundamentally circumvent regulatory costs through green transition increases under the effect of higher regulatory costs. Accordingly, Hypothesis 3a was proposed.
Hypothesis 3a.
The promotion effect of CETS on the green transition of heavy-polluting enterprises is relatively greater among enterprises with weak cost transfer abilities.
Second, based on the analysis of Hypothesis 2 in Section 3.2, heavy-polluting enterprises can achieve green transition through two approaches: green technological innovation and productive capital renewal, both of which require a large amount of enterprise funds. External financing, as a vital source of capital for enterprises, can provide a guarantee for the smooth realization of their green transition. However, there are obvious differences in access to external financing for enterprises with different levels of financing constraints and their responses to CETS may be different. When the level of financing constraints in an enterprise is high, the enterprise’s external financing needs for green technology R&D, clean production equipment replacement, etc., cannot be met and the higher transition cost and operational risk will make the enterprise less motivated to promote green transition. Conversely, the cost and risk of green transition can be shared by external financing when an enterprise has a low level of financing constraints, lessening the cash flow pressure faced in the process of green transition. At this moment, a heavy-polluting enterprise will proactively leverage external funds to support its development in a green and low-carbon direction and then fundamentally comply with environmental regulatory requirements. Accordingly, Hypothesis 3b was proposed.
Hypothesis 3b.
The promotion effect of CETS on the green transition of heavy-polluting enterprises is relatively greater among enterprises with low levels of financing constraints.
Third, the smooth achievement of the green transition of enterprises demands a deep adjustment of the development strategy toward green development, and the internal control system is a crucial institutional resource for strategic management. A high-quality internal control system can assist in the strategic orientation of the dominant logic of the enterprise to converge with the national logic. Hence, the promotion effect of CETS on the green transition of heavy-polluting enterprises may vary depending on the quality of the internal control system. For enterprises with high-quality internal control systems, their business strategies are often formulated in a scientific process to avoid making arbitrary decisions [82]. Moreover, when confronted with the constraints of CETS, enterprise managers will make decisions on green transition based on the height of the enterprises’ future development, control the risks in the green transition process, and supervise the implementation of green transition strategies in order to respond to the “double carbon” goal and green development concept. Regarding enterprises with poor-quality internal control systems, the decisions made by managers are most likely to be the result of short-sighted behavior in response to CETS rather than prudent consideration, making it difficult to effectively convey the message of green transition. Therefore, Hypothesis 3c was proposed.
Hypothesis 3c.
The promotion effect of CETS on the green transition of heavy-polluting enterprises is relatively greater among enterprises with high-quality internal control systems.
Fourth, stringent environmental legislations and environmental law enforcement are needed for the effective implementation of CETS. This is mainly because the target objects of CETS are mostly enterprises in heavy-pollution industries such as power generation, petrochemicals, and chemicals, which have been the pillar enterprises of local economic development for a long period and have significant negotiating power in the emission game with local environmental protection departments. To maintain high economic growth, local officials may allow polluters to secretly discharge pollution, thus affecting the effectiveness of CETS. Generally speaking, the higher the regional environmental enforcement intensity, the more rule implementation, related standards, and corresponding regulatory systems are compatible with the operation of CETS. At this time, the cost of non-compliance is high, and the pressure effect brought by CETS will be more prominent, with a stronger promotion effect on the green transition of heavy-polluting enterprises. Thus, Hypothesis 3d was proposed:
Hypothesis 3d.
The promotion effect of carbon emission trading policies on the green transition of heavy-polluting enterprises is relatively greater among enterprises in regions with high environmental enforcement intensity.

4. Methodology

4.1. Data Source and Processing

Based on the “List of Listed Companies in Environmental Protection Verification Industry Classification Management” established by the Ministry of Environmental Protection in 2008, this paper selected companies belonging to heavy-polluting industries among A-share listed companies in Shanghai and Shenzhen and used 2010–2019 as the study interval. To ensure the quality of the sample data, the following pre-processing was conducted: (1) Exclude the sample of enterprises listed after 2010 and the sample of ST, ST*, and delisted enterprises during the period 2010–2019. (2) Exclude the sample of enterprises with missing information on key indicators. (3) Use balanced panel data for regression analysis, where missing values are filled in by multiple interpolations. Moreover, winsorization was performed on 1% and 99% percentile of continuous variables to eliminate outlier interference. After the above data processing, a total of 374 heavy-polluting enterprises were finally screened. The data were drawn from the China Stock Market & Accounting Research Database (CSMAR Database), RESET Database, Chinese Research Data Services Platform (CNRDS), China Statistical Yearbook of Industrial Economy, China Statistical Yearbook of Cities, China Statistical Yearbook of Prices, and regional statistical bulletins.

4.2. Research Model

The study aimed to test whether CETS can promote the green transition of heavy-polluting enterprises, and the effective method in the literature for evaluating the effect of policy implementation was the difference-in-difference model (DID). The DID model divides the research object into the treatment group (the area where the policy is implemented) and the control group (the area where the policy is not implemented), and uses double differences between the cross-section and time series generated by exogenous public policy to judge the policy effect [83]. The model’s main advantages are that it not only effectively eliminates the interference of other factors on dependent variables, but estimation bias caused by missing variables can be fixed in the model [84]. The DID model has been widely used for the evaluation of policies in recent years [85]. Considering that CETS is launched in batches, this paper employed a staggered difference-in-difference model (DID) and divided the entire sample data into two groups. One group included enterprises located in CETS pilot regions (denoted as the treatment group) and the other group included enterprises never located in the CETS pilot regions (denoted as the control group). A critical prerequisite for employing the DID model is that the treatment and control groups must satisfy the parallel trend assumption [86], i.e., there is no systematic difference in the trends of the examined variables between the treatment and control groups prior to the implementation of the policy. In practice, however, the heterogeneity among enterprises was so great that the assumption was extremely difficult to satisfy. The propensity score matching (PSM) method developed by Rosenbaum and Rubin [87] was used to address the above problem.
The PSM model matches the treatment and control groups according to the propensity score of the multidimensional matching index, which makes the enterprises in the treatment groups match those in the control groups as much as possible before the policy was implemented. Thus solving the problem caused by the fact that the treatment and control groups in the DID model did not fully possess the common trend hypothesis before being affected by the policy. The PSM model cannot avoid the endogenous problem caused by the omission of variables, which can be solved by the DID model, thereby obtaining the “policy treatment effect.” Therefore, this paper selected the method of combining PSM and DID to estimate the green transformation effect of CETS more accurately.

4.2.1. Propensity Score Matching (PSM)

The core idea of propensity score matching (PSM) is that, according to the conditional independence assumption, the probability of enterprises entering pilot projects must be similar in the treatment and control groups and be comparable. Therefore, for the enterprises in the treatment group, it is necessary to find the enterprises belonging to the control group in order to make the observable characteristic variables of the two groups match as much as possible. The specific operations are as follows: First, select the characteristic variables affecting the enterprises entering carbon emission trading pilot projects, and construct a logit model to calculate the propensity score (P score) for each enterprise with the following formula:
P i X = P D i = 1 X = X i
where X i is the characteristic variable affecting the entry of enterprises into the carbon emission trading pilot projects, and D i is the treatment group dummy variable. Second, based on the propensity score (P score), select the specific matching principle. Then, for each enterprise in the treatment group, find enterprises closest to their P score from the control group as the new control group.

4.2.2. A Staggered Difference-in-Difference Model

After adopting the PSM method to match the control and treatment groups in order to make the data selection more random and meet the parallel trend assumption, this paper employed a staggered difference-in-difference model to estimate the effects of CETS. The corresponding constructed model is shown as follows:
G T i t = β 0 + β 1 C a r b o n _ p o l i c y i t + γ X i + α i + α t + ε i t
In Equation (2), the explanatory variable G T i t refers to the level of the green transition of the heavy-polluting enterprise i at year t. α i and α t are the enterprise’s fixed effects and year fixed effects, respectively. X i is a set of control variables. ε i t is a stochastic error term. The variable of interest is C a r b o n _ p o l i c y i t , a dummy variable that is equal to one in the years after the district in which the heavy-polluting enterprise i is located launched CETS, and zero otherwise. The coefficient, β 1 , therefore indicates the effect of CETS on the green transition of the heavy-polluting enterprise. A positive and significant β 1 means that CETS exerted a positive effect on the green transition of the heavy-polluting enterprise, while a negative and significant β 1 means that CETS inhibited the green transition of the enterprise.
To verify the influencing mechanism of CETS on the green transition of heavy-polluting enterprises, the following model was set:
Y i t = β 0 + β 1 C a r b o n _ p o l i c y i t + γ X i + α i + α t + ε i t
The explanatory variable Y i t in Equation (3) is a mechanism variable, and the meanings of the other variables are the same as in Equation (2). Based on the analysis of the theoretical mechanisms in the previous section, this paper intended to test the following two influencing mechanisms: green technological innovation and productive capital renewal.

4.3. Variable and Definition

4.3.1. Green Transition of Enterprises (GT)

The green transition of enterprises requires a change in production methods to achieve the coordinated development of economic and ecological benefits, a significant manifestation of which is the improvement of green total factor productivity (GTFP) [88]. Therefore, this paper used GTFP to measure the green transition of enterprises. Data envelopment analysis (DEA) is a common efficiency evaluation method that is widely used in measuring GTFP because of its many advantages, such as not needing to set any weights or needing to set the specific form of the production function in advance. However, the traditional DEA model could not eliminate the relaxation problem caused by the component; thus, biases could exist in the efficiency evaluation. The slack-based measure (SBM) model tries to solve the defects of the traditional DEA model by introducing relaxed input and output variables directly into the production function [89], but the multiple effective units in the calculation process prevents further comparing and ranking the performance of these effective units. Given this, the super-SBM model developed by Tone solves the sorting and difference comparison problems among effective units [90]. The super-SBM model can only measure GTFP in a single period, while economic development is a long-term dynamic process. It is unrealistic to analyze GTFP changes at a single point in time for a specific DMU. To solve the time continuity problem, some scholars use the Malmquist-Leuenberger index (ML) based on the SBM model to evaluate the dynamic changes in GTFP [63]. The SBM model and ML index have been widely used to measure GTFP. However, the Malmquist-Luenberger index (ML) calculation process suffers from the potential linear programming infeasibility problem. Oh [64] further proposed the global Malmquist-Luenberger index (GML) to overcome these drawbacks. Therefore, this paper used the super-SBM and GML index methods to calculate the GTFP of enterprises. Moreover, the measured GML index can only reflect the growth rate of GTFP but not the GTFP itself. Therefore, this study assumed that the GTFP in 2010 was equal to one. The factor is multiplied by the GML index in each period to derive the GTFP of a given enterprise from 2010 to 2019. The introduction of the super-SBM model and global Malmquist-Luenberger index (GML) are shown in Appendix A. The calculation of GTFP mainly considers the following input and output indicators: (1) Labor, capital, and energy inputs. Capital inputs are calculated using the perpetual inventory method with the following formula: K t = K t 1 ( 1 δ t ) + I t P t , where K t and K t 1 denote the capital stock in periods t and t − 1, respectively; δ t is the depreciation rate, which is taken as 5% [91]; I t is the investment in fixed assets in period t; and P t is the investment price index in period t in the province where the firm is located (with 2010 as the base period). Labor input is denoted by the number of employees in the enterprise. Energy input is expressed by the industrial electricity consumption of the enterprise. Since these data were missing, this paper referred to the method described by Wu et al. [92] using the data of the city where the enterprises are located. (2) Expected output is represented by the total industrial output value of the enterprise and deflated by the Producer Price Index for Industrial Products with two-digit industry codes. (3) Unexpected output is denoted by the SO2 emissions, wastewater emissions, and dust emissions from the enterprise. Due to the unavailability of enterprise-level pollution data, referring to existing literature [92], this paper used the municipal-level pollution data to measure the pollution emissions of enterprises.

4.3.2. Carbon Emission Trading Schemes (CETS)

The carbon emission trading schemes were set as a dummy variable (Carbon_policy) in the model, which was equal to one in the years after the district in which heavy-polluting enterprises are located carried out carbon emission trading schemes, and zero otherwise.

4.3.3. Mechanism Variables

(1)
Green technological innovation. Referring to the definition and classification of green technological innovation by existing scholars [93], the number of green patent applications was applied to measure green technological innovation (Patent_gre), which was the sum of the number of green invention patent applications and green utility model patent applications. In addition, the numbers of green invention patent applications and green utility model patent applications were used to measure the substantial green technological innovation (Green_inv) and strategic green technological innovation (Green_uti) in this paper, respectively.
(2)
Productive capital renewal. Drawing on the existing literature [12,80], this paper selected the fixed asset investment (Inv), depreciation (Depre), and depreciation rate (Depre_rate) to measure and reflect the productive capital renewal of enterprises.

4.3.4. Control Variables

Referring to the existing literature on the green transition of enterprises, this paper set control variables at the enterprise and city levels: (1) Enterprise-level control variables included the enterprise’s size (size), asset-liability ratio (lev), return on total assets (roa), independent director ratio (indep), board size (board), revenue growth rate (growth), book to market ratio (bm), age of listing (listage), Tobin’s Q (tobinq), and operating cash flow (cashflow). (2) City-level control variables included regional GDP (lngdp) and industrial structure (industry). The definition and descriptive statistics of the main variables in this paper are shown in Table 1 and Table 2, respectively.

5. Empirical Results

5.1. Propensity Score Matching

Carbon emission trading policy pilot projects were conducted in batches in 2013, 2014, and 2016. Thus, drawing on practices such as those of Blundell and Dias [94], this paper adopted a year-by-year matching method to match the multi-period treatment group with the control group. To avoid the influence of policy effects on the matching results, this paper set the matching time to the year before the launch of CETS, i.e., 2012, 2013, and 2015, and determined the total control group based on the principle of intersection, namely, the intersection of the control groups matched multiple times was the matched control group sample. This paper used the radius matching method for matching. The following variables were selected to calculate the probability of the heavy-polluting enterprises entering carbon emission trading pilot projects: enterprise size (size), asset-liability ratio (lev), return on total assets (roa), independent director ratio (indep), board size (board), revenue growth rate (growth), book to market ratio (bm), age of listing (listage), Tobin’s Q (tobinq), and operating cash flow (cashflow). Then, we matched each treatment group with the control group by propensity score within a given tolerance (radius).
To ensure the effectiveness of the matching results, a balance hypothesis test was conducted in this paper. Table 3 presents the details of the matching variables before and after the PSM. The main text only shows the matching results in 2013; the matching results in 2014 and 2016 can be seen in Appendix A. Compared with the data before matching, the absolute value of the standardized deviation of all the characteristic variables of the treatment and control groups dropped to 20%, complying with the criterion that “the absolute value of the standard deviation is less than 20% indicating good matching effect” [87]. Moreover, none of the t-values were significant at the 10% level. The above analysis suggested that there was no longer a significant difference between the treatment and control groups on the main characteristic variables after matching, indicating that the matching results were reliable. Finally, 92 heavy-polluting enterprises in the treatment group and 209 heavy-polluting enterprises in the control group were obtained according to the principle of intersection in the year-by-year matching method.

5.2. Benchmark Regression Results

To analyze the impact of CETS on the green transition of heavy-polluting enterprises, this paper employed a two-way fixed effect model to perform a Benchmark regression test on Equation (2). The DID regression results after PSM are shown in Table 4.
Column (1) only tested the influence of the core explanatory variable (Carbon_policy), while columns (2) and (3) sequentially added control variables at the enterprise and city levels on this basis. From the results of columns (1)–(3), it can be seen that the coefficients of Carbon_policy were significantly positive and all passed the 1% significance test. Thus, the coefficient estimates of the benchmark model revealed that the launch of CETS had a significant and positive impact on the green total factor productivity improvement of heavy-polluting enterprises in policy pilot areas relative to heavy-polluting enterprises in non-policy pilot areas, confirming that CETS contributes significantly to the green transition of heavy-polluting enterprises. Hypothesis 1 was verified.
Regarding the control variables, enterprise size (size), return on total assets (roa), and revenue growth rate (growth) were significantly and positively associated with the green transition of heavy-polluting enterprises in columns (2) and (3). These results indicated that the higher the profitability, market share, and larger overall size of the enterprise, the higher the level of green transition of heavy-polluting enterprises. This may be because large enterprises have more resource advantages, greater market share, and more robust profitability than small enterprises, which all benefit the green transition of enterprises. The coefficient of regional GDP was significantly positive in column (3), showing that the higher the level of local economic development, the more successful the green transition of enterprises. This is principally because regions with a high level of economic development can provide financial and technological support for the green transition of enterprises. On the contrary, board size (board) and age of listing (listage) were significantly and negatively related to the green transition of enterprises in columns (2) and (3). These results demonstrated that the level of green transition was lower in enterprises with higher ages and larger board sizes. This may be because older enterprises have relatively cured internal management and do not pay enough attention to green development. In addition, excessive board size has a direct impact on management and decision-making and thus influences the green transition of enterprises.
To ensure the reliability of the benchmark regression results, various robustness tests were conducted in the paper, as shown below.

5.3. Robustness Test

  • Change the matching method of PSM
The above empirical results were obtained using the radius matching method. In the robustness test, this study continued to use the kernel matching method to rematch the treatment and control groups, and then regression analysis on Equation (2) was performed based on the rematched samples. The results are shown in Table 5. Column (1) shows that the coefficient of Carbon_policy was 0.1537, which was significant at the 1% level. As a result, in comparison with the previously obtained results, the coefficient and significance of Carbon_policy did not change substantially. The conclusion that CETS had a significantly positive effect on the green transition of heavy-polluting enterprises still held.
2.
Use one-period lagged control variables
Considering the possible reverse influence between the selected variables and the selected carbon emission trading pilot regions, in order to reduce the potential endogeneity problem, all control variables were lagged by one period and then incorporated into Equation (2) for re-regression. The results are listed in column (2) of Table 5. It can be observed that the coefficient and significance of Carbon_policy were generally consistent with the results of the benchmark regression. However, this estimated coefficient was slightly higher due to the control variables lagging by one period and the degree of control becoming weaker. The robustness of the findings was again verified.
3.
Counterfactual analysis
This paper conducted a counterfactual test by artificially setting a policy time point. Specifically, this was performed by making each batch of policy implementation one period and two periods in advance, respectively, thus constructing two “pseudo-Carbon_policy” variables (Carbon_policy-1, Carbon_policy-2). The Carbon_policy presented in Table 2 was replaced by two “pseudo-Carbon_policy” variables. At this point, if the coefficients of the two “pseudo-Carbon_policy” variables were not significant, this would indicate that the green transition of heavy-polluting enterprises was caused by CETS rather than other factors. Conversely, the conclusion would not be robust. According to columns (1) and (2) in Table 6, the coefficients of the two “pseudo-Carbon_policy” variables were no longer significant. In summary, the benchmark regression results were reliable.
4.
Eliminate interference from other environmental policies
In addition to CETS, other environmental regulation policies were conducted in the same period that may have interfered with the benchmark regression results. Hence, this study gathered environmental policies carried out during the period of CETS implementation and conducted the corresponding sample processing: (1) To exclude the interference of new environmental protection laws implemented since 1 January 2015, only the years 2010–2014 were selected as the study period in this section, and the results are shown in column (1) of Table 7. The coefficient of Carbon_policy in column (1) remained significantly positive, in line with the results in Table 2. (2) In July 2014, the Ministry of Water Resources promulgated the Notice on the Piloting of Water Rights, which designated seven provinces (Guangdong, Inner Mongolia, Jiangxi, Hubei, Henan, Gansu, and Ningxia) as pilot provinces for water rights trading, which may have had similar effects as CETS. Consequently, the sample data of the seven provinces were excluded to re-estimate Equation (2). The results are presented in column (2) of Table 7 and were generally consistent with the benchmark regression results. (3) The low-carbon city pilot policies implemented in batches in 2010, 2012, and 2017 may also have affected the reliability of the regression results, so the effect of this policy needed to be eliminated. Since there were too many low-carbon pilot cities involved, removing this part of the sample would have too much impact on the regression results. Therefore, we generated another three new interaction terms by multiplying the year dummy variables of 2010, 2012, and 2017 and the policy dummy (Treat) and adding them to Equation (2). Heavy-polluting enterprises located in pilot areas of CETS were the treatment group denoted by Treat = 1, while heavy-polluting enterprises located in non-pilot areas were the control group denoted by Treat = 0. As seen from column (3) of Table 7, the results were not substantially changed compared to the benchmark regression results. (4) The CETS pilot areas involved four major cities directly under the jurisdiction of the central government, Beijing, Tianjin, Shanghai, and Chongqing, which are often the pioneer areas for important policies, and the state often applies preferential policies to their education, science and technology, capital, transportation, foreign trade, and foreign investment. Therefore, the four city samples were excluded to further eliminate the interference of several other unconsidered policies in these four cities. Unsurprisingly, the coefficient in column (3) of Table 7 was comparable to the benchmark regression results in Table 4.
5.
Considering the heterogeneous treatment effects of staggered DID
De Chaisemartin and D’Haultfoeuille [95] found that when a staggered DID model was used to evaluate the policy effect, a significant estimation bias may exist because of “heterogeneous treatment effects.” Therefore, De Chaisemartin and D’Haultfoeuille [95] suggested that the “twowayfeweights” command in Stata software should be employed to perform robustness tests for possible “heterogeneity treatment effects” of the model. An obtained heterogeneity treatment robustness indicator closer to one indicates a more robust result for the model heterogeneity test; conversely, a less robust result is indicated. Based on the above method, this paper applied the “twowayfeweights” command to re-test the regression results, and the results showed that the heterogeneity treatment robustness indicator was about 0.7195, suggesting to some extent that the heterogeneity treatment effect did not have a substantial impact on the regression results. This result once again proved the robustness of the benchmark regression results.

6. Further Discussion

6.1. Mechanism Analysis

The above analysis showed that the implementation of CETS effectively promoted the green transition of heavy-polluting enterprises. Then, through what channels do the policies exert influence on the green transition of enterprises? This necessitated an in-depth exploration of the inherent influence mechanisms between the two. As analyzed above, CETS likely promoted the green transition of enterprises by inducing green technological innovation and accelerating productive capital renewal. Accordingly, this paper adopted a two-way fixed effect model to perform a mechanism test on Equation (3).

6.1.1. Green Technological Innovation

Regarding the effect of green technological innovation, columns (1)–(3) of Table 8 report the regression results with the numbers of green patent applications (Pantent_gre), green invention patent applications (Green_inv), and green utility model patent applications (Green_uti) as dependent variables, respectively. As can be seen from column (1), the implementation of CETS did not promote a significant increase in the number of green patent applications. When further distinguishing green patent categories, the coefficient of Carbon_policy was 0.0688 in column (2), which was significant at the 5% level, and was positive but not significant in column (3). Namely, CETS played a significant positive role in promoting substantive green technological innovation in heavy-polluting enterprises, but the induced effect on green technological innovation at the overall level as well as strategic green technological innovation was not significant. The above results demonstrated that substantial green technological innovation was the primary approach for the green transition of heavy-polluting enterprises under CETS. The possible reason is that green invention patents are high-level technological innovation projects with high technical content and long-term effect of energy saving and emission reduction and they are difficult to be developed, whereas green utility model patents have low technical content and less difficulty to be developed., i.e., they are low-level innovation projects catering to government policies. After the implementation of CETS, it is only through CO2 emission reduction that enterprises can obtain economic benefits by selling carbon quotas in the carbon emission trading market. Otherwise, enterprises will bear additional economic costs due to excessive CO2 emissions, which provides an internal incentive and motivation for enterprises to focus on high-quality green invention patents. Only substantial green technological innovation can meet the requirements of environmental regulation and financial performance gain of enterprises. Although green utility model patents may meet the requirements of government environmental supervision, it is difficult for enterprises to obtain more economic benefits in carbon emission trading. Therefore, under the constraint of CETS, heavy-polluting enterprises will focus on high-quality green invention patents (substantive green technological innovation) instead of green utility model patents (strategic green technological innovation).
Consequently, without distinguishing the categories of green technological innovation, the induced effect of CETS on green technological innovation is mainly reflected at the substantive green technological innovation level and more limited at the overall level. By now, the impact mechanism of green technological innovation was verified.

6.1.2. Productive Capital Renewal

Regarding the effect of productive capital renewal, columns (1)–(3) of Table 9 present the regression results with fixed asset investment (Inv), depreciation (Depre), and depreciation rate (Depre_rate) as dependent variables, respectively. As shown in column (1), the increase in fixed asset investment (Inv) in heavy-polluting enterprises was raised by 15.63% after the implementation of CETS. From column (2), it is not difficult to observe that the launch of CETS increased the current-year depreciation (Depre) of enterprises by 4.39%. When the depreciation rate (Depre_rate) was employed as a proxy indicator for capital renewal, the results in column (3) indicated that the depreciation rate of heavy-polluting enterprises accelerated by 0.1890 percentage points after the implementation of CETS. This finding further supported the results of the theoretical analysis that under the constraints of CETS, heavy-polluting enterprises accelerate their capital renewal and invest in the use of more advanced and environmentally friendly new equipment in production processes to achieve green transition. Hypothesis 2 was proven.

6.2. Heterogeneity Analysis

Based on the identification of the average effect of CETS on the green transition of heavy-polluting enterprises, this paper further examined the differences in the effects of CETS on heterogeneous enterprises from two aspects: the internal and external characteristics of the enterprises.

6.2.1. Heterogeneity Effect of Different Cost Transfer Abilities

To test Hypothesis 3a, this paper characterized the cost transfer ability of enterprises from the following two dimensions: (1) The degree of competition in the product market (PMCD) measured by the Herfindahl-Hirschman Index (HHI). When the HHI of the heavy-polluting enterprise is greater than the annual median, the PMCD is equal to one, indicating that the degree of competition in the product market of the industry to which the enterprise belongs is relatively low and that there are relatively few similar substitutes in the market. In this case, enterprises can pass on environmental costs in the form of price mark-up at a small cost, indicating a stronger cost transfer ability. On the contrary, when the PMCD is equal to zero, the cost transfer ability of the enterprise is weaker. (2) The bargaining power of the enterprise over its customers (BP) measured by customer concentration, which is calculated by the ratio of the top five customers (Top_5). If the Top_5 of the enterprise is smaller than the annual median, the BP is equal to one, indicating that the enterprise’s customers are relatively dispersed and the cost transfer ability is strong; otherwise, the BP is equal to zero, meaning that the customers are relatively concentrated and the cost-shifting ability of the enterprise is weak.
On this basis, two new interaction items of the product market competition dummy variable (PMCD) and the policy dummy variable (Carbon_policy) and of the bargaining power dummy variable (BP) and the policy dummy variable (Carbon_policy) were respectively introduced into Equation (2) to examine whether the effects of CETS show significant differences depending on the cost transfer ability. As presented in columns (1) and (2) of Table 10, it can be observed that the estimated coefficients of Carbon_policy*PMCD and Carbon_policy*BP were significantly negative in the case of a significantly positive coefficient for the Carbon_policy. This revealed that the promotion effect of CETS on the green transition of heavy-polluting enterprises was relatively greater among enterprises with weak cost transfer abilities. Hypothesis 3a was verified.

6.2.2. Heterogeneity Effect of Different Levels of Financing Constraints

To test Hypothesis 3b, the WW index constructed by Whited and Wu [96] was used to measure the level of financing constraints (FC) of enterprises. The FC is equal to one when the WW index of a heavy-polluting enterprise is greater than the annual median, indicating that the enterprise faces a higher degree of financing constraints; conversely, the FC is equal to zero. The new interaction item created by multiplying the financing constraints dummy variable (FC) and the policy dummy variable (Carbon_policy) was introduced into Equation (2) to investigate the distinction in the impact of different financing environments on the green transition of enterprises. The results in column (3) of Table 10 show that the regression coefficient of Carbon_policy*FC was negative when the coefficient of Carbon_policy was significantly positive at the 1% level, suggesting that the promotion effect of CETS on the green transition of heavy-polluting enterprises was relatively greater among enterprises with low levels of financing constraints. Hypothesis 3b was confirmed.

6.2.3. Heterogeneity Effect of Different Internal Control Systems

To test Hypothesis 3c, this paper utilized the internal control index constructed by the Dibo database (DIB) to measure the internal control quality (IC) of the enterprises. A value of one was allocated to the IC when the corresponding internal control index of the enterprise was greater than the annual median, indicating a higher quality of the internal control system; in contrast, a value of zero was allocated to the IC. Further, the interaction item of the internal control quality (IC) dummy variable and the policy dummy variable (Carbon_policy) was introduced into Equation (2). Column (4) of Table 10 reports the regression results that the estimation coefficients of Carbon_policy and Carbon_policy*IC were all significantly positive, which demonstrated that when the quality of internal control systems of heavy-polluting enterprises was relatively lower, the positive impact of CETS on the green transition of enterprises was somewhat constrained, thus supporting Hypothesis 3c.

6.2.4. Heterogeneity Effect of Different Environmental Enforcement Intensities

To verify Hypothesis 3d, this paper measured the environmental enforcement intensity in different regions based on the ratio (RATE) of the total value of fees levied on waste discharge to the number of establishments, which were published in the China Environmental Yearbook. The dummy variable of environmental enforcement intensity (EEI) was defined according to the median of RATE in each province in the year 2012 before the implementation of CETS, that is, the dummy variable (EEI) was equal to one when RATE in the province in which the heavy-polluting enterprise was located was greater than the median, denoting that the environmental enforcement intensity was higher; conversely, EEI equal to one meant that the environmental enforcement intensity was weaker. Then, the practice of introducing the interaction item was repeated. The results in column (5) of Table 10 show that the coefficient of Carbon_policy *EEI was 0.3181 and significant at the 5% level. Thus, the stronger the environmental enforcement intensity in the region in which the enterprise was located, the more obvious the force effect of CETS on the green transition of the heavy-polluting enterprise, thereby supporting Hypothesis 3d.

7. Conclusions

Regarding CETS launched in 2013 as a quasi-natural experiment, this paper used the data of A-share listed heavy-polluting enterprises from 2010 to 2019 to empirically analyze the effect of CETS on the green transition of heavy-polluting enterprises by adopting a staggered difference-in-difference model (DID) based on propensity score matching (PSM). This study produced the following main conclusions: First, CETS significantly improves the green development efficiency of heavy-polluting enterprises and promotes the green transition of enterprises. Our findings remained robust throughout robustness tests, including changing the matching method of PSM, using one-period lagged control variables, counterfactual analysis, and so on. Second, the empirical results of the mechanism analysis showed that substantial green technological innovation and productive capital renewal are two effective intrinsic approaches for heavy-polluting enterprises to achieve green transition under the constraints of CETS. Third, there are significant differences in the effect of CETS on heterogeneous enterprises; specifically speaking, the positive impact of CETS on the green transition of heavy-polluting enterprises is more pronounced among enterprises with weaker cost transfer abilities, lower levels of financing constraints, higher quality internal control systems, and enterprises located in regions having stronger environmental enforcement intensity.

8. Recommendations

Based on the research conclusions of this paper, we propose the following policy recommendations to better improve the national carbon emissions trading market and promote the green transition of enterprises.
First, addressing the problem of the green transition of heavy-polluting enterprises in the process of developing a low-carbon circular economy in China, the decisive role of the market mechanism should be given full play. Unlike command-and-control environmental policies, which are based on administrative orders compelling enterprises to reduce pollution and emissions, market-based environmental policies utilize incentive and constraint mechanisms to induce enterprises to incorporate environmental management into their decision-making so that they can minimize their compliance costs and improve their productivity, thus achieving a “win-win” situation for both environmental protection and high-quality development. We provide robust evidence that CETS can considerably help heavy-polluting enterprises to get out of the green development dilemma and boost their green transition. Therefore, to comprehensively promote the development of heavy-polluting enterprises in a green and low-carbon direction, the guiding role of the market trading mechanism should be fully exploited to establish a higher quality price signal system for green and low-carbon development.
Second, financial investment in enterprises’ green and low-carbon technology R&D and productive capital renewal should be increased. This paper found that CETS can promote green transition by inducing green technological innovation and capital renewal in heavy-polluting enterprises. Thus, in view of the fact that CETS may increase enterprises’ environmental compliance costs and crowd out R&D investment, the government should provide certain subsidies and policy preferences to enterprises, especially large enterprises with strong R&D capabilities, so that they can play the role of “leaders” in technological innovation. In addition, for enterprises with weak R&D capacities and great need for capital renewal, the government also needs to increase financial and tax support and set up special funds to support and steer them towards upgrading their production equipment and transforming their production technology.
Third, strengthening environmental enforcement intensity to ensure effective implementation of CETS is warranted. This paper revealed that the promotion effect of CETS on the green transition of heavy-polluting enterprises increased with the strengthening of environmental enforcement intensity, i.e., environmental administrative supervision is an essential guarantee to improve the effectiveness of CETS. Consequently, environmental protection departments should strengthen environmental enforcement intensity and increase penalties for non-compliance and excess emissions by enterprises.
Finally, the financing mechanism for heavy-polluting enterprises should be improved to enhance the green transition effect of CETS. The pilot policies had greater impact on heavy-polluting enterprises with weak levels of financing constraints. Hence, the government should improve the financing mechanism for the green transition of enterprises, including both government-based green subsidies and green tax concessions as well as the market-oriented green credit mechanism, thus providing a two-pronged approach to effectively guarantee the supply of funds for the green transition of enterprises.
Due to the limitations of the research, this paper may have the following deficiencies, which are expected to be improved in further research. Firstly, this study attempted to provide empirical evidence on the impact of CETS on the green transition of enterprises, but measuring the green transition of enterprises is a challenging issue. Due to data availability, we adopted green total factor productivity (GTFP) as a proxy of the green transition of enterprises, which had some potential limitations. Future research will aim to find ways in which to better measure the green transition of enterprises. Secondly, only green technology innovation and productive capital renewal were tested when analyzing the impact mechanism of CETS to promote the green transition of enterprises. There may be other impact mechanisms that need to be explored. Therefore, further research is needed to conduct theoretical analysis and empirical tests on the potential mechanisms in order to generate practical insight. Finally, because CETS itself is still in the process of promotion and expansion, the disclosure of more data will enable us to track and analyze policies in the future and carry out more dimensional expansion research.

Author Contributions

Conceptualization, S.X.; Data curation, W.P.; Funding acquisition, S.X. and D.W.; Methodology, S.X., W.P. and D.W.; Writing—original draft, S.X. and W.P.; Writing—review & editing, S.X., W.P. and D.W. All authors have read and agreed to the published version of the manuscript.

Funding

This research was supported by the National Social Science Foundation of China (18VHQ003).

Institutional Review Board Statement

Not applicable.

Informed Consent Statement

Not applicable.

Data Availability Statement

The data shown in this research are available on request.

Conflicts of Interest

The authors declare no conflict of interest.

Appendix A

Table A1. PSM balance test (2014).
VariableUnmatchedMean%bias%Reductt Test
MatchedTreatment
Group
Control
Group
|bias|tp > |t|
sizeU22.06522.487−32.876.8−1.200.231
M22.09122.189−7.6−0.190.848
levU0.53750.510712.168.70.460.078
M0.54590.53753.80.090.645
roaU0.03490.028412.425.60.420.672
M0.02800.0328−9.2−0.240.814
indepU0.36180.3676−12.267.3−0.440.664
M0.36080.3627−4.0−0.100.921
boardU2.22012.2153.1−16.90.100.922
M2.23092.2253.6−0.100.925
growthU0.17280.098726.273.20.770.442
M0.16200.14227.00.160.874
bmU1.57581.866−18.266.2−0.610.541
M1.6471.7451−6.1−0.150.879
listageU2.53182.390226.690.51.030.303
M2.49232.47892.50.070.948
tobinqU1.77761.503636.548.91.280.201
M1.72411.58418.70.480.637
cashflowU0.07570.051833.353.51.320.189
M0.06240.0735−15.5−0.430.671
Table A2. PSM balance test (2016).
VariableUnmatchedMean%bias%Reductt Test
MatchedTreatment
Group
Control
Group
|bias|tMatched
sizeU22.54922.609−4.8−80.8−1.200.231
M22.54922.4418.6−0.190.848
levU0.48430.4882−2.196.8−0.070.948
M0.48430.4844−0.1−0.000.999
roaU0.00500.0161−17.326.3−0.630.528
M0.0050−0.003212.70.300.770
indepU0.36940.36744.495.30.160.872
M0.36940.36930.20.010.996
boardU2.1632.1876−14.898.5−0.490.622
M2.1632.16270.20.010.995
growthU0.0138−0.034115.1−2.20.600.552
M0.0138−0.035115.40.380.706
bmU0.77951.1121−36.794.8−1.040.300
M0.77950.76221.90.090.926
listageU2.63172.57614.672.90.510.613
M2.63172.61674.00.110.915
tobinqU2.16732.2857−9.259.8−0.300.762
M2.16732.2149−3.7−0.110.912
cashflowU0.05230.0554−4.3−53.4−0.170.867
M0.05230.0571−6.7−0170.868

Super-Efficiency SBM Model and Global Malmquist-Luenberger (GML) Productivity Index

This paper used the super-efficiency SBM model with the undesired output because it needed to consider pollution emissions. Suppose there are n enterprises in the model, each enterprise is a DMU (DMUj, j = 1,2…n). Each DMU has three types of input–output indices, including m types of input x ( x i , j R n m + ), s 1 types of expected output y g ( y i , j g R s 1 n + ), and s 2 types of unexpected output y b ( y i , j b R s 2 n + ). Therefore, the environment technology function is as follows:
P x = x , y g , y b x k = 1 n λ k x k , y g k = 1 n λ k y k g , y b k = 1 n λ k y k b , λ 0
In Formula (A1), λ is the weight of the sectional input–output data and a nonnegative variable. The returns to scale are variable.
A super-SBM model considering the undesired output is constructed as follows:
m i n ρ = 1 m k = 1 m x i x i k 1 s 1 + s 2 ( r = 1 s 1 y g y i k g + r = 1 s 2 y b y i k b )
s . t . x j = 1 , k n x i j λ j ;
y g j = 1 , k n y j g λ j ;
y b j = 1 , k n y j b λ j ;
x x 0 , 0 y b y k g , y b y k b ;
j = 1 , k n λ j = 1
where ρ is the target efficiency value, λ is the weight vector, and subscript k is the decision unit to be measured. The direction distance function can be obtained by solving the super-SBM index under the production possibility set during the appropriate period as follows:
D 0 G ( x t , y t , b t , y t , b t )
According to the directional distance function solved by super-SBM model, the GML index from period to period can be obtained as follows:
G M L t t + 1 = 1 + D 0 G x t , y t , b t , y t , b t 1 + D 0 G x t + 1 , y t + 1 , b t + 1 , y t + 1 , b t + 1
G M L t t + 1 = G T E C t t + 1 + G T C t t + 1
The GML index measurement can be decomposed into green technology efficiency (GTEC) and green technology progress (GTC) through linear programming. GTEC represents the efficiency changes due to improved production systems, economies of scale, and experience accumulation. In contrast, GTC results from efficiency changes because of improved production technology and process innovation. The GML index reflects the annual growth rate of the enterprise’s GTFP.

References

  1. Yang, X.; Jiang, P.; Pan, Y. Does China’s carbon emission trading policy have an employment double dividend and a Porter effect? Energy Policy 2020, 142, 111492. [Google Scholar] [CrossRef]
  2. Fang, K.; Zhang, Q.; Long, Y.; Yoshida, Y.; Sun, L.; Zhang, H.; Dou, Y.; Li, S. How can China achieve its Intended Nationally Determined Contributions by 2030? A multi-criteria allocation of China’s carbon emission allowance. Appl. Energy 2019, 241, 380–389. [Google Scholar] [CrossRef]
  3. Mallapaty, S. How China could be carbon neutral by mid-century. Nature 2020, 586, 482–484. [Google Scholar] [CrossRef]
  4. Wang, K.; Li, S.Y. China’s Carbon Market: Reviews and Prospects (2022). J. Bejing Inst. Technol. (Soc. Sci. Ed.) 2022, 24, 33–42. [Google Scholar]
  5. Ortega-Gras, J.J.; Bueno-Delgado, M.V.; Cañavate-Cruzado, G.; Garrido-Lova, J. Twin Transition through the Implementation of Industry 4.0 Technologies: Desk-Research Analysis and Practical Use Cases in Europe. Sustainability 2021, 13, 13601. [Google Scholar] [CrossRef]
  6. Chatzistamoulou, N.; Tyllianakis, E. Commitment of European SMEs to resource efficiency actions to achieve sustainability transition. A feasible reality or an elusive goal? J. Environ. Manag. 2022, 321, 115937. [Google Scholar] [CrossRef]
  7. Niu, H.; Zhao, X.; Luo, Z.; Gong, Y.; Zhang, X. Green credit and enterprise green operation: Based on the perspective of enterprise green transformation. Front. Psychol. 2022, 13, 1041798. [Google Scholar] [CrossRef] [PubMed]
  8. Pan, A.; Liu, X.; Qiu, J.; Shen, Y. Can green M&A of heavy polluting enterprises achieve substantial transformation under the pressure of media. China Ind. Econ. 2019, 2, 174–192. [Google Scholar]
  9. Zhang, J.J.; Yu, L.; Bi, Q.; Pan, J. Media supervision, environmental regulation and firm green investment. J. Shanghai Univ. Financ. Econ. 2016, 185, 91–103. [Google Scholar]
  10. Qian, B.I.; Hong-yuan, L.I. Can Green Tax Incentives Promote Green Transformation of Enterprises. J. Guizhou Univ. Financ. Econ. 2019, 37, 89. [Google Scholar]
  11. Dang, D. Can environmental subsidies promote the green investment of enterprises? Mod. Econ. 2020, 11, 109. [Google Scholar] [CrossRef] [Green Version]
  12. Wan, P.B.; Yang, M.; Chen, L. How do environmental technology standards affect the green transition of China’s manufacturing industry—A perspective from technological transformation. China Ind. Econ. 2021, 9, 118–136. [Google Scholar]
  13. Yu, L.C.; Zhang, W.G.; Bi, Q. Can the reform of environmental protection fee-to-tax promote the green transformation of high-polluting enterprises. China Popul. Resour. Environ. 2021, 31, 109–118. [Google Scholar]
  14. Wang, X.Q.; Ning, J.H. Can mandatory social responsibility disclosure drive corporate green transformation?—Evidence based on green patent data of listed companies in China. J. Audit Econ. 2020, 35, 69–77. [Google Scholar]
  15. Hu, G.; Wang, X.; Wang, Y. Can the green credit policy stimulate green innovation in heavily polluting enterprises? Evidence from a quasi-natural experiment in China. Energy Econ. 2021, 98, 105134. [Google Scholar] [CrossRef]
  16. Martin, R.; Muûls, M.; Wagner, U.J. The impact of the European Union Emissions Trading Scheme on regulated firms: What is the evidence after ten years? Rev. Environ. Econ. Policy 2016, 10, 129–148. [Google Scholar] [CrossRef] [Green Version]
  17. Zhang, X.; Zhang, D.; Yu, R. Theory and Practice of China’s National Carbon Emissions Trading System. Manag. World 2021, 37, 80–95. [Google Scholar]
  18. Porter, M.E.; Van der Linde, C. Toward a new conception of the environment-competitiveness relationship. J. Econ. Perspect. 1995, 9, 97–118. [Google Scholar] [CrossRef] [Green Version]
  19. Liu, Y.; Li, Z.; Yin, X. Environmental regulation, technological innovation and energy consumption—A cross-region analysis in China. J. Clean Prod. 2018, 203, 885–897. [Google Scholar] [CrossRef]
  20. Gans, J.S. Innovation and climate change policy. American Economic Journal. Econ. Policy 2012, 4, 125–145. [Google Scholar]
  21. Rassier, D.G.; Earnhart, D. Does the porter hypothesis explain expected future financial performance? The effect of clean water regulation on chemical manufacturing firms. Environ. Resour. Econ. 2010, 45, 353–377. [Google Scholar] [CrossRef]
  22. Li, S.B.; Guo, Y.L. The Economic Impact and Policy Instrument Choice of Envronmental Regulaton: A Literature Review. Ind. Organ. Rev. 2021, 1, 200–219. [Google Scholar]
  23. He, L.Y.; Qi, X.F. Environmental Regulation and Green Total Factor Productivity: Evidence from China’s Marine Economy. Pol. J. Environ. Stud. 2021, 30, 5117–5131. [Google Scholar]
  24. Zhu, X.; He, M.; Li, H. Environmental regulation, governance transformation and the green development of Chinese iron and steel enterprises. J. Clean Prod. 2021, 328, 129557. [Google Scholar] [CrossRef]
  25. Tvinnereim, E.; Mehling, M. Carbon pricing and deep decarbonisation. Energy Policy 2018, 121, 185–189. [Google Scholar] [CrossRef]
  26. Bayer, P.; Aklin, M. The European Union emissions trading system reduced CO2 emissions despite low prices. Proc. Natl. Acad. Sci. USA 2020, 117, 8804–8812. [Google Scholar] [CrossRef] [Green Version]
  27. Bakam, I.; Balana, B.B.; Matthews, R. Cost-effectiveness analysis of policy instruments for greenhouse gas emission mitigation in the agricultural sector. J. Environ. Manag. 2012, 112, 33–44. [Google Scholar] [CrossRef]
  28. Qi, X.; Han, Y. The design of the intertemporal trading ratio of carbon quotas. J. Clean Prod. 2022, 370, 133481. [Google Scholar] [CrossRef]
  29. He, W.; Zhang, B.; Li, Y.; Chen, H. A performance analysis framework for carbon emission quota allocation schemes in China: Perspectives from economics and energy conservation. J. Environ. Manag. 2021, 296, 113165. [Google Scholar] [CrossRef]
  30. Chen, S.; Shi, A.; Wang, X. Carbon emission curbing effects and influencing mechanisms of China’s Emission Trading Scheme: The mediating roles of technique effect, composition effect and allocation effect. J. Clean Prod. 2020, 264, 121700. [Google Scholar] [CrossRef]
  31. Wu, Y.; Qi, J.; Xian, Q.; Wu, J.D. The carbon emission reduction effect of China’s carbon market—The perspective of the coordination between market mechanism and administrative intervention. China Ind. Econ. 2021, 8, 114–132. [Google Scholar]
  32. Zhu, B.; Zhang, M.; Huang, L.; Wang, P.; Su, B.; Wei, Y.M. Exploring the effect of carbon trading mechanism on China’s green development efficiency: A novel integrated approach. Energy Econ. 2020, 85, 104601. [Google Scholar] [CrossRef]
  33. Zhang, S.; Wang, Y.; Hao, Y.; Liu, Z. Shooting two hawks with one arrow: Could China’s emission trading scheme promote green development efficiency and regional carbon equality? Energy Econ. 2021, 101, 105412. [Google Scholar] [CrossRef]
  34. Zhou, Z.; Ma, Z.; Lin, X. Carbon Emissions Trading Policy and Green Transformation of China’s Manufacturing Industry: Mechanism Assessment and Policy Implications. Front. Environ. Sci. 2022, 10, 1543. [Google Scholar] [CrossRef]
  35. Lei, Y.; Zhang, X.; Peng, W. Can China’s Policy of Carbon Emissions Trading Optimize Manufacturing Structure? Evidence from Guangdong Based on a Synthetic Control Approach. Sustainability 2022, 14, 3302. [Google Scholar] [CrossRef]
  36. García, A.; García-Álvarez, M.T.; Moreno, B. The impact of EU allowance prices on the stock market indices of the European power industries: Evidence from the ongoing EU ETS phase III. Organ. Environ. 2021, 34, 459–478. [Google Scholar] [CrossRef]
  37. Mo, J.Y. Environmental policy and R&D productivity: A case study from the Korean Emissions Trading Scheme. Sci. Public Policy 2022, 50, 120–128. [Google Scholar]
  38. Li, X.; Shu, Y.; Jin, X. Environmental regulation, carbon emissions and green total factor productivity: A case study of China. Environ. Dev. Sustain. 2022, 24, 2577–2597. [Google Scholar] [CrossRef]
  39. Li, X.; Guo, D.; Feng, C. The Carbon Emissions Trading Policy of China: Does It Really Promote the Enterprises’ Green Technology Innovations? Int. J. Environ. Res. Public Health 2022, 19, 14325. [Google Scholar] [CrossRef]
  40. Calel, R.; Dechezleprêtre, A. Environmental policy and directed technological change: Evidence from the European carbon market. Rev. Econ. Stat. 2016, 98, 173–191. [Google Scholar] [CrossRef] [Green Version]
  41. Bel, G.; Joseph, S. Policy stringency under the European Union Emission trading system and its impact on technological change in the energy sector. Energy Policy 2018, 117, 434–444. [Google Scholar] [CrossRef]
  42. Xiao, J.; Li, G.; Zhu, B.; Xie, L.; Hu, Y.; Huang, J. Evaluating the impact of carbon emissions trading scheme on Chinese firms’ total factor productivity. J. Clean Prod. 2021, 306, 127104. [Google Scholar] [CrossRef]
  43. Koch, N.; Themann, M. Catching up and falling behind: Cross-country evidence on the impact of the EU ETS on firm productivity. Resour. Energy Econ. 2022, 69, 101315. [Google Scholar] [CrossRef]
  44. Yu, D.J.; Li, J. Evaluating the employment effect of China’s carbon emission trading policy: Based on the perspective of spatial spillover. J. Clean Prod. 2021, 292, 126052. [Google Scholar] [CrossRef]
  45. Marin, G.; Marino, M.; Pellegrin, C. The impact of the European Emission Trading Scheme on multiple measures of economic performance. Environ. Resour. Econ. 2018, 71, 551–582. [Google Scholar] [CrossRef]
  46. Makridou, G.; Doumpos, M.; Galariotis, E. The financial performance of firms participating in the EU emissions trading scheme. Energy Policy 2019, 129, 250–259. [Google Scholar] [CrossRef]
  47. Ferrara, A.R.; Giua, L. Indirect cost compensation under the EU ETS: A firm-level analysis. Energy Policy 2022, 165, 112989. [Google Scholar] [CrossRef]
  48. Dai, Y.; Li, N.; Gu, R.; Zhu, X. Can China’s carbon emissions trading rights mechanism transform its manufacturing industry? Based on the perspective of enterprise behavior. Sustainability 2018, 10, 2421. [Google Scholar] [CrossRef] [Green Version]
  49. Tang, M.; Cheng, S.; Guo, W.; Ma, W.; Hu, F. Relationship between carbon emission trading schemes and companies’ total factor productivity: Evidence from listed companies in China. Environ. Dev. Sustain. 2022, 1–33. [Google Scholar] [CrossRef]
  50. Chen, Z.; Zhang, X.; Chen, F. Do carbon emission trading schemes stimulate green innovation in enterprises? Evidence from China. Technol. Forecast. Soc. Chang. 2021, 168, 120744. [Google Scholar] [CrossRef]
  51. Luo, Y.; Li, X.; Qi, X.; Zhao, D. The impact of emission trading schemes on firm competitiveness: Evidence of the mediating effects of firm behaviors from the guangdong ETS. J. Environ. Manag. 2021, 290, 112633. [Google Scholar] [CrossRef] [PubMed]
  52. Zhai, X.; An, Y. Analyzing influencing factors of green transformation in China’s manufacturing industry under environmental regulation: A structural equation model. J. Clean Prod. 2020, 251, 119760. [Google Scholar] [CrossRef]
  53. Gong, M.; You, Z.; Wang, L.; Cheng, J. Environmental regulation, trade comparative advantage, and the manufacturing industry’s green transformation and upgrading. Int. J. Environ. Res. Public Health 2020, 17, 2823. [Google Scholar] [CrossRef] [PubMed]
  54. Cheng, Z.; Li, L.; Liu, J. Natural resource abundance, resource industry dependence and economic green growth in China. Resour. Policy 2020, 68, 101734. [Google Scholar] [CrossRef]
  55. Zhang, F.; Yao, S.; Wang, F. The role of high-speed rail on green total factor productivity: Evidence from Chinese cities. Environ. Sci. Pollut. Res. 2022, 30, 15044–15058. [Google Scholar] [CrossRef]
  56. Kumbhakar, S.C.; Wang, H.; Horncastle, A.P. A Practitioner’s Guide to Stochastic Frontier Analysis Using Stata; Cambridge University Press: Cambridge, UK, 2015. [Google Scholar]
  57. Zhong, S.; Li, Y.; Li, J.; Yang, H. Measurement of total factor productivity of green agriculture in China: Analysis of the regional differences based on China. PLoS ONE 2021, 16, e0257239. [Google Scholar] [CrossRef]
  58. Wang, L.; Liu, B.; He, Y.; Dong, Z.; Wang, S. Have public environmental appeals inspired green total factor productivity? empirical evidence from Baidu Environmental Search Index. Environ. Sci. Pollut. Res. 2022, 30, 30237–30252. [Google Scholar] [CrossRef]
  59. Liu, D.; Zhu, X.; Wang, Y. China’s agricultural green total factor productivity based on carbon emission: An analysis of evolution trend and influencing factors. J. Clean Prod. 2021, 278, 123692. [Google Scholar] [CrossRef]
  60. Zhang, X.; Chen, X.; Lu, C.C.; Cheng, F.Y. A comparative analysis of slack-based green total factor productivity in China: A directional distance function. Water Air Soil Pollut. 2021, 232, 466. [Google Scholar] [CrossRef]
  61. Ma, Y.; Lin, T.; Xiao, Q. The Relationship between Environmental Regulation, Green-Technology Innovation and Green Total-Factor Productivity—Evidence from 279 Cities in China. Int. J. Environ. Res. Public Health 2022, 19, 16290. [Google Scholar] [CrossRef]
  62. Bao, B.; Jin, S.; Li, L.; Duan, K.; Gong, X. Analysis of green total factor productivity of grain and its dynamic distribution: Evidence from Poyang Lake Basin, China. Agriculture 2022, 12, 8. [Google Scholar] [CrossRef]
  63. Li, Y.; Chen, Y. Development of an SBM-ML model for the measurement of green total factor productivity: The case of pearl river delta urban agglomeration. Renew. Sustain. Energy Rev. 2021, 145, 111131. [Google Scholar] [CrossRef]
  64. Oh, D. A global Malmquist-Luenberger productivity index. J. Prod. Anal. 2010, 34, 183–197. [Google Scholar] [CrossRef]
  65. Qiu, S.; Wang, Z.; Geng, S. How do environmental regulation and foreign investment behavior affect green productivity growth in the industrial sector? An empirical test based on Chinese provincial panel data. J. Environ. Manag. 2021, 287, 112282. [Google Scholar] [CrossRef] [PubMed]
  66. Suchman, M.C. Managing legitimacy: Strategic and institutional approaches. Acad. Manag. Rev. 1995, 20, 571–610. [Google Scholar] [CrossRef]
  67. Johnsen, T.; Phillips, W.; Caldwell, N.; Lewis, M. Centrality of customer and supplier interaction in innovation. J. Bus. Res. 2006, 59, 671–678. [Google Scholar] [CrossRef]
  68. Grossman, G.M.; Helpman, E. Growth, trade, and inequality. Econometrica 2018, 86, 37–83. [Google Scholar] [CrossRef] [Green Version]
  69. Ambec, S.; Barla, P. A theoretical foundation of the Porter hypothesis. Econ. Lett. 2002, 75, 355–360. [Google Scholar] [CrossRef]
  70. Barney, J. Firm resources and sustained competitive advantage. J. Manag. 1991, 17, 99–120. [Google Scholar] [CrossRef]
  71. Schumpeter, J.A. The Theory of Economic Development: An Inquiry into Profits, Capital, Credit, Interest, and the Business Cycle (1912/1934); Trans. Publishers: Victoria, BC, Canada, 1982; Volume 1, p. 244. [Google Scholar]
  72. Borghesi, S.; Cainelli, G.; Mazzanti, M. Linking emission trading to environmental innovation: Evidence from the Italian manufacturing industry. Res. Policy 2015, 44, 669–683. [Google Scholar] [CrossRef]
  73. Goulder, L.H.; Parry, I.W. Instrument choice in environmental policy. Rev. Environ. Econ. Policy 2008, 2, 152–174. [Google Scholar] [CrossRef]
  74. King, A.A.; Lenox, M.J. Does it really pay to be green? An empirical study of firm environmental and financial performance: An empirical study of firm environmental and financial performance. J. Ind. Ecol. 2001, 5, 105–116. [Google Scholar] [CrossRef] [Green Version]
  75. Fan, Y. Top-level design of China’s carbon market: Policy objectives and economic impacts. J. Environ. Econ. 2018, 3, 1–7. [Google Scholar]
  76. Shi, D.; Li, P. Quality evolution and assessment of China’s industry over the past seven decades. China Ind. Econ. 2019, 35, 5–23. [Google Scholar]
  77. Perino, G.; Requate, T. Does more stringent environmental regulation induce or reduce technology adoption? When the rate of technology adoption is inverted U-shaped. J. Environ. Econ. Manag. 2012, 64, 456–467. [Google Scholar] [CrossRef] [Green Version]
  78. Shao, S.; Hu, Z.; Cao, J.; Yang, L.; Guan, D. Environmental regulation and enterprise innovation: A review. Bus. Strateg. Environ. 2020, 29, 1465–1478. [Google Scholar] [CrossRef]
  79. Kerr, S.; Newell, R.G. Policy-induced technology adoption: Evidence from the US lead phasedown. J. Indust. Econ. 2003, 51, 317–343. [Google Scholar] [CrossRef]
  80. Zhang, C.Y.; Lv, Y. Green production regulation and enterprise R&D innovation: Impact and mechanism research. Bus. Manag. J. 2018, 1, 71–89. [Google Scholar]
  81. Fabra, N.; Reguant, M. Pass-through of emissions costs in electricity markets. Am. Econ. Rev. 2014, 104, 2872–2899. [Google Scholar] [CrossRef] [Green Version]
  82. Liu, Q.; Luo, L.; Zhang, Y.; Chen, H. Concentration of managerial power, internal control, and accounting information quality. Nankai Bus. Rev. 2013, 16, 15–23. [Google Scholar]
  83. Zhang, W.; Li, G.; Guo, F. Does carbon emissions trading promote green technology innovation in China? Appl. Energy 2022, 315, 119012. [Google Scholar] [CrossRef]
  84. Lin, C.; Shao, S.; Sun, W.; Yin, H. Can the electricity price subsidy policy curb NOX emissions from China’s coal-fired power industry? A difference-in-differences approach. J. Environ. Manag. 2021, 290, 112367. [Google Scholar] [CrossRef]
  85. Li, B.; Han, Y.; Wang, C.; Sun, W. Did civilized city policy improve energy efficiency of resource-based cities? Prefecture-level evidence from China. Energy Policy 2022, 167, 113081. [Google Scholar] [CrossRef]
  86. Bertrand, M.; Duflo, E.; Mullainathan, S. How Much should We Trust Differences-in-Differences Estimates? Q. J. Econ. 2004, 119, 249–275. [Google Scholar] [CrossRef] [Green Version]
  87. Rosenbaum, P.R.; Rubin, D.B. The central role of the propensity score in observational studies for causal effects. Biometrika 1983, 70, 41–55. [Google Scholar] [CrossRef]
  88. Zhang, J.P.; Chen, S.Y. Financial Development, Environmental Regulations and Green Economic Transition. J. Financ. Econ. 2021, 47, 78–93. [Google Scholar]
  89. Tone, K. A slacks-based measure of efficiency in data envelopment analysis. Eur. J. Oper. Res. 2001, 130, 498–509. [Google Scholar] [CrossRef] [Green Version]
  90. Tone, K. A slacks-based measure of super-efficiency in data envelopment analysis. Eur. J. Oper. Res. 2002, 143, 32–41. [Google Scholar] [CrossRef] [Green Version]
  91. Wang, Y.; Yao, Y.D. Sources of China’s economic growth 1952–1999: Incorporating human capital accumulation. China Econ. Rev. 2003, 14, 32–52. [Google Scholar] [CrossRef] [Green Version]
  92. Wu, J.; Xia, Q.; Li, Z. Green innovation and enterprise green total factor productivity at a micro level: A perspective of technical distance. J. Clean Prod. 2022, 344, 131070. [Google Scholar] [CrossRef]
  93. Li, W.J.; Zheng, M. Is it substantive innovation or strategic innovation? Impact of macroeconomic policies on micro-enterprises’ innovation. Econ. Res. J. 2016, 4, 60–73. [Google Scholar]
  94. Blundell, R.; Costa Dias, M. Evaluation methods for non-experimental data. Fisc. Stud. 2000, 21, 427–468. [Google Scholar] [CrossRef]
  95. De Chaisemartin, C.; D’Haultfoeuille, X. Two-way fixed effects estimators with heterogeneous treatment effects. Am. Econ. Rev. 2020, 110, 2964–2996. [Google Scholar] [CrossRef]
  96. Whited, T.M.; Wu, G. Financial constraints risk. Rev. Financ. Stud. 2006, 19, 531–559. [Google Scholar] [CrossRef]
Figure 1. Theoretical mechanism model.
Sustainability 15 06333 g001
Table 1. Variables and definitions.
Variable TypeVariableVariable SymbolVariable Description
Dependent variablegreen transitionGTexpressed by the green total factor productivity (GTFP)
Independent variablecarbon emission trading schemeCarbon_policyequals 1 in the years after the district in which heavy-polluting enterprises are located has carried out carbon emission trading policies, and 0 otherwise.
Mechanism Variablesgreen technological innovationPatent_greln(number of green patent applications + 1)
substantial green technological innovationGreen_invln(number of green invention patent applications + 1)
strategic green technological innovationGreen_utiln(number of green utility model patent applications + 1)
fixed asset investmentInvln(cash paid to acquire fixed assets, intangible assets, and other long-term assets)
depreciationDepreln(depreciation)
depreciation rateDepre_ratedepreciation/fixed asset investment
Control variablesenterprise sizesizeln(total assets)
asset-liability ratiolevyear-end total debt divided by year-end total assets.
return on total assetsroanet profit/average balance of total assets
independent director ratioindepnumber of independent directors/total number of directors
board sizeboardln(number of board members)
revenue growth rategrowth(operating income in yeart+1 − operating income in yeart)/(operating income in yeart)
book to market ratiobmbook value/total market value
age of listinglistageln(current year − year of launch + 1)
Tobin’s Qtobinqratio of enterprise market value to asset replacement cost;
operating cash flowcashflownet cash flow/total assets
the regional GDPlngdpln(gdp)
industrial structureindustrypercentage of secondary industry
Table 2. Descriptive statistics.
VariableObsMeanSDMinMax
GTFP37401.36180.83030.25535.0971
size374022.63831.421520.021726.4580
lev37400.48290.20320.05740.9411
roa37400.03790.0598−0.16970.2414
indep37400.36910.05070.30770.5714
board37402.20010.19981.60942.7080
growth37400.14340.3410−0.46892.1079
bm37401.44081.40540.14087.5598
tobinq37401.77941.07980.84626.8636
listage37402.47390.600703.2581
cashflow37400.06130.0668−0.12150.2489
lngdp374017.49601.084515.216619.6049
industry37400.46310.10830.18630.6865
Patent_gre37400.50440.970207.3421
Green_inv37400.35690.819507.2277
Green_uti37400.29660.719405.1240
Inv374012.43471.90244.030419.6172
Depre374019.04871.661414.3126.07
Depre_rata37400.05570.02000.02090.1597
Table 3. PSM balance test (2013).
VariableUnmatchedMean%bias%Reductt Test
MatchedTreatment GroupControl Group|bias|tp > |t|
sizeU22.80622.3827.686.12.300.022
M22.55822.617−3.8−0.230.816
levU0.46260.5100−24.181.2−1.770.078
M0.47020.4791−4.5−0.250.801
roaU0.03910.03537.046.80.510.614
M0.03540.03343.70.210.836
indepU0.37600.365319.398.71.560.119
M0.37030.37010.30.020.988
boardU2.23772.213911.469.90.880.381
M2.22142.2286−3.4−0.190.848
growthU0.12910.079612.683.31.030.305
M0.12970.12142.10.110.914
bmU1.55771.6067−3.581.3−0.260.796
M1.5641.55480.60.040.970
listageU2.1452.2767−20.683.0−1.660.097
M2.18422.16173.50.190.847
tobinqU1.45651.582−15.699.4−1.100.273
M1.48591.4867−0.1−0.010.966
cashflowU0.07550.058226.170.81.990.047
M0.240.06737.60.450.655
Table 4. Regression results of the effect of CETS on the green transition of heavy-polluting enterprises.
VariableGT
(1)(2)(3)
Carbon_policy0.2481 ***
(5.2586)
0.2270 ***
(4.8556)
0.1415 ***
(3.0961)
size 0.2570 ***
(4.0978)
0.2198 ***
(3.5248)
lev 0.0624
(0.4423)
0.1131
(0.8355)
roa 0.7191 **
(2.1727)
0.7419 **
(2.3466)
indep 0.4936
(1.2207)
0.6093
(1.5917)
board −0.2830 **
(−2.0596)
−0.2580 *
(−1.9309)
growth 0.1709 ***
(2.9804)
0.1855 ***
(3.3018)
bm −0.0041
(−0.1842)
−0.0053
(−0.2504)
listage −0.1578 **
(−2.5466)
−0.1649 ***
(−2.7228)
tobinq 0.0315
(1.4174)
0.0234
(1.1262)
cashflow −0.0294
(−0.1207)
−0.0360
(−0.1505)
lngdp 1.2495 ***
(10.4228)
industry 0.6550
(1.3395)
enterprise fixed effectYesYesYes
year fixed effectYesYesYes
Observations301030103010
Adjusted R20.49290.51370.5414
Note: The parentheses are t-values calculated by the robust standard errors. ***, **, and * indicate significance at 1%, 5%, and 10%, respectively.
Table 5. Change the matching method of PSM and use one-period lagged control variables.
VariableGT
(1)(2)
Carbon_policy0.1537 ***
(3.3497)
0.1704 ***
(3.2015)
controlYesNo
L. controlNoYes
enterprise fixed effectYesYes
year fixed effectYesYes
Observations30202709
Adjusted R20.54660.5690
Note: The parentheses are t-values calculated by the robust standard errors. *** indicates significance at 1%.
Table 6. Counterfactual analysis.
VariableGT
(1)(2)
Carbon_policy-10.0679
(1.2562)
Carbon_policy-2 −0.0147
(−0.2006)
controlYesYes
enterprise fixed effectYesYes
year fixed effectYesYes
Observations30103010
Adjusted R20.54000.5397
Note: The parentheses are t-values calculated by the robust standard errors.
Table 7. Elimination of interference from other environmental policies.
VariableGT
(1)(2)(3)(4)
Carbon_policy0.0835 *
(1.6669)
0.1893 ***
(3.0295)
0.1348 **
(2.1355)
0.1336 **
(2.24)
controlYesYesYesYes
enterprise fixed effectYesYesYesYes
year fixed effectYesYesYesYes
Treat*Year2010 −0.0365
(−0.4080)
Treat*Year2012 0.0909
(0.8201)
Treat*Year2017 0.1414 **
(1.9938)
Observations1505225030102650
Adjusted R20.40830.55050.54180.5001
Note: The parentheses are t-values calculated by the robust standard errors. ***, **, and * indicate significance at 1%, 5%, and 10%, respectively.
Table 8. Green technological innovation.
VariablePantent_gre
(1)
Green_inv
(2)
Green_uti
(3)
Carbon_policy0.0500
(1.1906)
0.0688 **
(1.9690)
0.0117
(0.3720)
controlYesYesYes
enterprise fixed effectYesYesYes
year fixed effectYesYesYes
Observations301030103010
Adjusted R20.62830.62210.5343
Note: The parentheses are t-values calculated by the robust standard errors. ** indicates significance at 5%.
Table 9. Productive capital renewal.
VariableInv
(1)
Depre
(2)
Depre_rate
(3)
Carbon_policy0.1452 **
(2.5217)
0.0430 *
(1.7982)
0.1890 *
(1.8275)
controlYesYesYes
enterprise fixed effectYesYesYes
year fixed effectYesYesYes
Observations301030103010
Adjusted R20.81970.96340.5955
Note: The parentheses are t-values calculated by the robust standard errors. **, and * indicate significance at 5%, and 10%, respectively.
Table 10. Heterogeneity analysis.
VariableCost Transfer AbilityFinancing
Constraints
(3)
Internal
Control
(4)
Environmental
Enforcement
(5)
(1)(2)
Carbon_policy0.1883 ***
(3.3100)
0.2564 ***
(3.7723)
0.2410 ***
(3.9186)
0.0918 *
(1.6948)
0.1756 ***
(3.6711)
Carbon_policy*PMCD−0.1075 *
(−1.6680)
Carbon_policy*BP −0.1750 **
(−2.2305)
Carbon_policy*FC −0.2428 ***
(−3.0990)
Carbon_policy*IC 0.0932 *
(1.7851)
Carbon_policy*EEI 0.3181 **
(2.3484)
controlYesYesYesYesYes
enterprise fixed effectYesYesYesYesYes
Year fixed effectYesYesYesYesYes
Observations30102790274327923010
Adjusted R20.53590.54590.55370.53880.5200
Note: The parentheses are t-values calculated by the robust standard errors. ***, **, and * indicate significance at 1%, 5%, and 10%, respectively.
Disclaimer/Publisher’s Note: The statements, opinions and data contained in all publications are solely those of the individual author(s) and contributor(s) and not of MDPI and/or the editor(s). MDPI and/or the editor(s) disclaim responsibility for any injury to people or property resulting from any ideas, methods, instructions or products referred to in the content.

