Article

Research on the Impact of Urban Expansion on Habitat Quality in Chengdu

School of Architecture and Urban Planning, Lanzhou Jiaotong University, Lanzhou 730070, China
*
Author to whom correspondence should be addressed.
Sustainability 2023, 15(7), 6271; https://doi.org/10.3390/su15076271
Submission received: 21 February 2023 / Revised: 29 March 2023 / Accepted: 31 March 2023 / Published: 6 April 2023

Abstract

:
Land use changes caused by urban expansion have a significant impact on regional ecological environment and biodiversity. Exploring the impact of urban expansion on habitat quality can guide the future sustainable development path and ecological conservation of cities. The InVEST model was used to evaluate the habitat quality indices of Chengdu in the three periods covering 2000, 2010 and 2020; land use intensity was used to quantitatively characterize the projection of urban expansion on spatial structure and then analyze the impact of urban expansion on habitat quality; we then proposed a spatial control zoning strategy. The results show that: (1) from 2010 to 2020, construction land in Chengdu grew by 140.58%, 5.52 times the expansion rate of the previous decade, as the city entered a phase of rapid development; (2) the center of gravity of construction land moved in a “back to the center-eastward” trajectory and the city shifted to a compact expansion development pattern; (3) urban expansion was an important cause of habitat quality decline as the overall habitat quality in Chengdu was on a degradation trend, with a spatial distribution of habitat quality characterized by high habitat quality in the eastern and western regions and low habitat quality in the central region; and (4) habitat quality and land use intensity showed a significant negative spatial correlation. The study area was dominated by two clusters: “high land use intensity–low habitat quality” and “low land use intensity–high habitat quality”. The results of the study show that researchers can protect high-quality habitat space in cities, improve habitat quality in areas of habitat degradation in urban expansion, and guide the green and sustainable development of urban land use in the future.

1. Introduction

According to statistics, more than 4 billion people worldwide currently live in urban areas; the size of urban populations continues to increase, with 60% of the global population (nearly 5 billion people) expected to live in cities by 2030. [1] The advancement of urbanization has led to an increase in human demand for ecosystem services in natural ecosystems [2]; humans are meeting the demand for land for construction by changing land use types and through urban land expansion. Urban expansion is a process of land use change that transforms non-urban land into urban land. [3,4] Urban expansion is characterized by the systematic construction and improvement of large-scale settlements, industries, centers of economic activity, and the transportation networks that accompany them [5]. However, economically oriented urban construction often neglects the protection of urban ecology. In recent years, the negative impacts of urban expansion on ecosystems have raised concerns. Urban expansion can affect ecological connectivity, ecosystem services, biodiversity, and urban river systems. Urban expansion has been shown to lead to loss of agricultural land [6], reduction in wildlife habitats [7], and biodiversity threats [8]. The impacts of urban expansion on habitats are divided into direct and indirect impacts. Urban expansion changes the original land properties and encroaches on the surrounding land, directly compressing the original natural habitat space. Meanwhile, a series of development, infrastructure construction, noise, sewage, air pollution, and surface temperature increases brought by urban expansion also affect the surrounding natural habitats to a certain; this represents the indirect impact of urban expansion on ecological environments [9,10,11]. Habitat fragmentation and degradation caused by urban expansion has become the main cause of regional habitat quality decline, biodiversity threats, and ecological security pattern destruction [12,13]; the final problem is also an important factor limiting sustainable urban development [14]. Therefore, exploring the effects of urban expansion on habitat quality and integrating habitat concepts into urban planning are important for achieving sustainable urban development and protecting native species.
The academic term habitat was first introduced by the American scholar Grinnel in 1917 [15]; habitat is defined as the spatial environment in which an organism lives. Habitat quality refers to the ability to provide suitable conditions for individuals and populations to survive [16]. Urban habitat is regarded in this study as the spatial collection of all habitats within the urban city limits. Habitat quality can reflect the level of regional biodiversity and ecological services, as well as the quality of the human living environment [17,18]. Habitat space in cities provides living space for native species and the integrity of habitat structure and layout in cities is the basis for balanced urban ecosystems and good habitats. Habitat quality assessment was initially applied mainly to animal habitats and nature reserves [19,20] to study the habitat quality of single species or populations. More recently, paired with the development of technology and the prominence of urban ecological problems, some scholars began to shift from micro- and meso-scale studies to macro-scale studies of urban habitat quality. There are two main aspects of current research on habitat quality in cities; the first aspect is the impact of human activities and the environment on the habitat of a single species [21,22,23,24]. For example, Regan et al. assessed habitat quality in the San Diego region by tracking data for 10 species and found that urban construction fragmented urban habitats; however, when habitat fragments were large enough, regional biodiversity could be secure [25]. It was also found that smaller blue–green spaces in cities (e.g., parks and squares) do not contribute much to urban biodiversity, compared to urban water ecosystems, large parks, and foothills, which provide better habitat spaces in cities [26]. The second aspect is the impact of socioeconomic development, land use changes, and other influences on habitat quality due to urban human activities [27,28]. Jiang et al. analyzed the correlation between economic data, population density, and habitat quality in the Guangdong–Hong Kong–Macao Greater Bay Area and found that economic and population growth were negatively correlated with the habitat quality of the region [29]. Han et al. found that the habitat quality in the Dongting Lake region showed fluctuations of “improvement–deterioration–stabilization–intensification of deterioration” with the change in land use type [30]. Zhong et al. found that habitat quality began to show improvement after land remediation and planning guidance and that land remediation brought ecological benefits to the area [31]. Xiang et al. found that urban land use change is the main cause of habitat quality degradation; therefore, their model simulated land use under different development scenarios in Tianjin and made habitat quality predictions, finding that urban habitat quality was superior under the ecological conservation scenario than other scenarios of development [32]. The response of habitat quality to land use change has been commonly studied in previous research, but this approach does not provide a good integrated picture of the relationship between regional development and habitat quality. Therefore, this study introduces land use intensity to comprehensively reflect and quantify the land use changes in urban expansion; it also makes recommendations for future urban development based on the spatial correlation characteristics of land use intensity and habitat quality.
Early habitat quality assessments often used indicators. For example, Valero [33] assessed the condition of river habitats by using the riparian zone vegetation index and river habitat index. Valero constructed a comprehensive index evaluation system to assess the habitat quality of the area; however, this research method ignored the impact of threat sources on the surrounding habitats. There are also scholars of ecology who have assessed the habitat quality of areas through field surveys by investigating the number of species as well as their spatial distribution [34,35]. This research method is good for making recommendations for species conservation but is more labor- and material-intensive. Some scholars have also studied the spatial relationship between habitats to assess habitat quality. For example, Young [36] constructed a grid of Black Country, UK, and assessed habitat quality by measuring the spatial connectivity of habitats between grids and the degree of habitat fragmentation. Along with the maturity and integration of RS, GIS, GPS and other technologies, scholars have quantified the habitat quality by constructing models. At this stage, scholars have used the MAXENT [37], SolVES [38], ARIES [39], HSI [40], and InVEST [41] models to measure habitat quality. Among them, the InVEST model is widely used with advantages over other models in terms of application cost, evaluation accuracy, and visual analysis [42]. The habitat quality module of the InVEST model can be used to assess the habitat quality of a region by combining the habitat suitability of the habitat itself with the influence of the surrounding environment; the InVEST model also performs well in large-scale regional studies.
Chengdu is a provincial capital city, the core city of Chengdu–Chongqing Economic Circle, and an important central city in the western region. In the context of high-speed urbanization, the contradiction between urban development and the ecological environment is increasingly prominent, while land use guidance under the perspective of ecological protection is a necessary measure for sustainable urban development. Based on the InVEST model and land use intensity, this paper analyzes the dynamic changes of habitat quality under the influence of urban expansion from 2000 to 2020; it also explores the spatial correlation characteristics between habitat quality and land use intensity by using Geoda software. Finally, an ecologically oriented spatial control zoning of the city is proposed to provide reference for future urban development and ecological protection paths.

2. Study Area

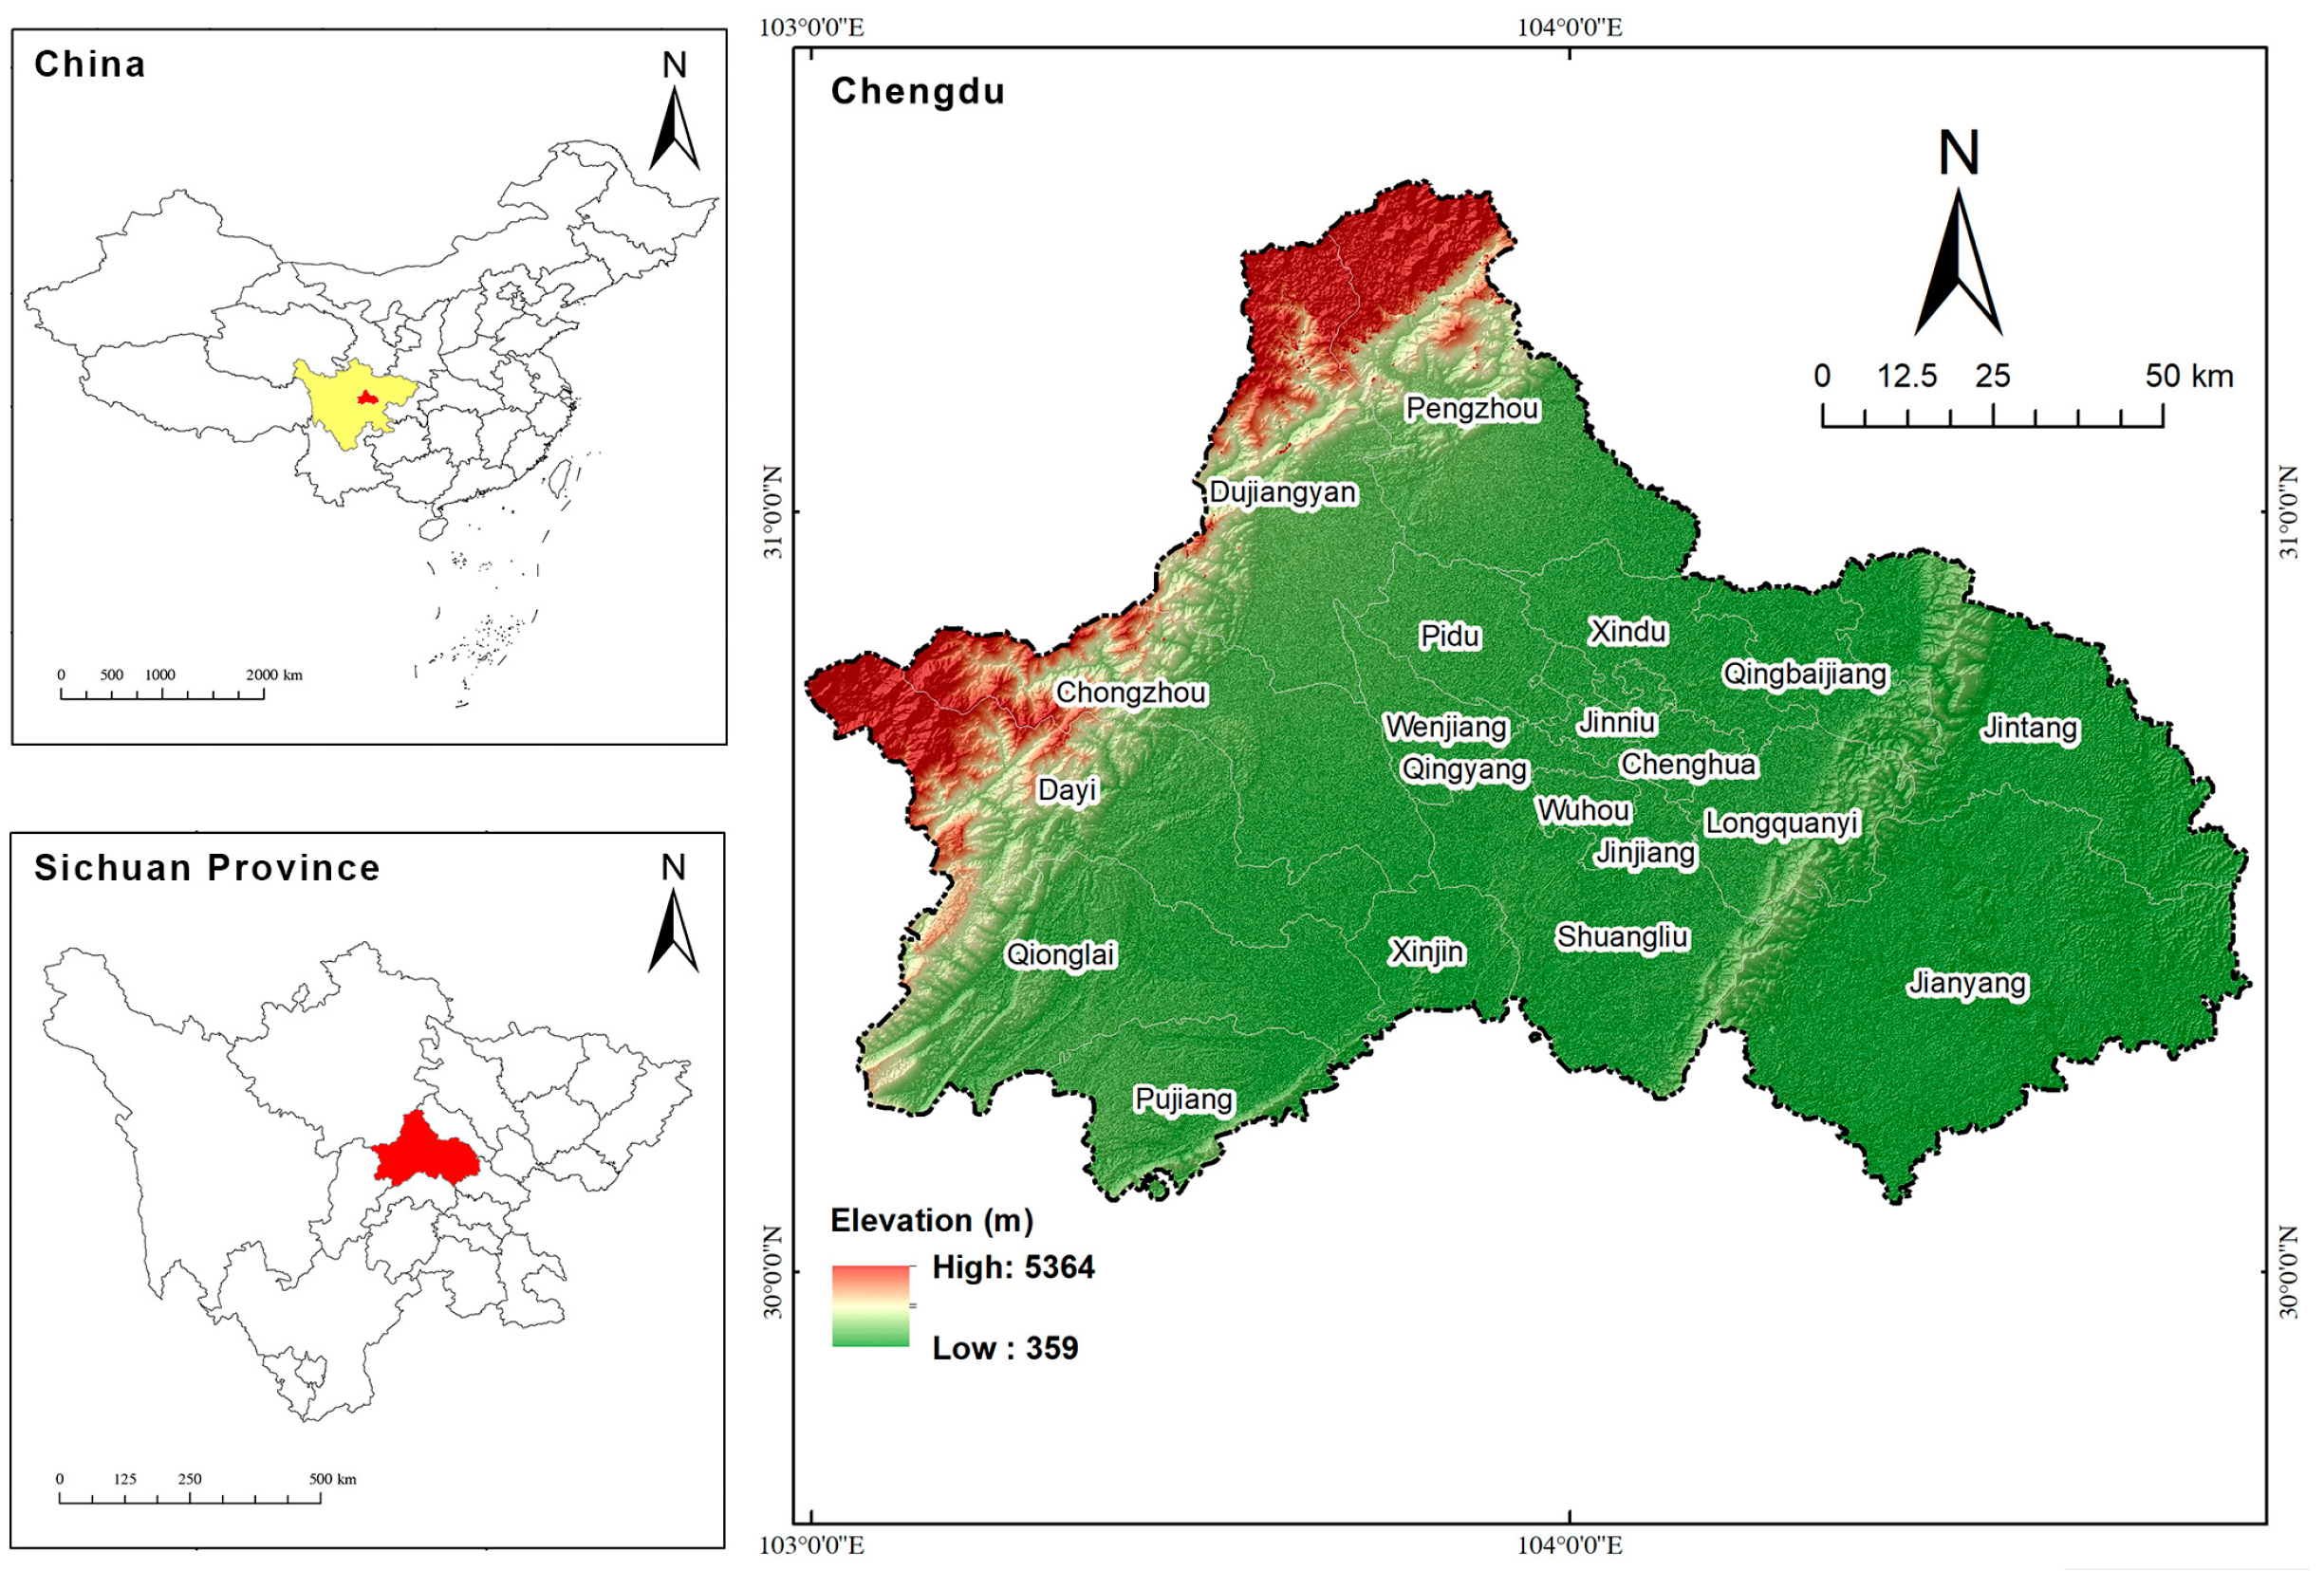
Chengdu is located in southwestern China and the western part of the Sichuan Basin (102°54′~104°53′ E, 30°05′~31°26′ N), as it shown in Figure 1. It has a subtropical monsoon climate with the climatic characteristics of early spring, hot summer, cool autumn, and warm winter. It is connected to Ziyang City to the east, Aba Tibetan and Qiang Autonomous Prefecture to the west, Ya’an City to the south, and Deyang City to the north. The city has 12 districts, 3 counties, and 5 county-level cities under its jurisdiction. The western edge of Chengdu is the Longmen Mountain Range and the eastern part straddles the Longquan Mountain Range. Chengdu has superior natural conditions and rich ecological resources. Chengdu’s western terrain is dominated by deep mountains and hills. The eastern part is an alluvial plain formed by seven rivers in the west, with loose and fertile land suitable for agriculture.

3. Research Data and Methods

3.1. Data Collection and Processing

The study data included elevation and slope data for Chengdu city, as well as land cover data and road data for the three periods covering 2000, 2010 and 2020. Elevation and slope data (DEM) with a spatial resolution of 30 m were obtained from the geospatial data cloud platform of the Computer Network Information Center of the Chinese Academy of Sciences (https://www.gscloud.cn/). Land cover data were obtained from the Global Land Cover Data (http://www.globallandcover.com/), while GlobeLand30 data used the WGS-84 coordinate system to reclassify land cover into grassland, woodland (including shrubland), wetland, and grassland using ArcGis 10.8 software according to research needs. Grassland, wetland, woodland, water, cultivated land, construction land, and glacial and permanent snow land were divided into seven categories (Figure 2). According to the study, three types of road vector data were used: highway, national highway, and railroad. Regional administrative boundaries were obtained from the Aliyun digital visualization platform.

3.2. Land Use Intensity Measurement

Land is the basis for carrying out urban development. The development and expansion of the city has changed the original type of land cover, while the high frequency of human construction activities has increased the intensity of land use. Land use intensity is introduced to quantify the spatial projection of urban expansion. Through the adoption of the Zhuang [43] measurement method, different types of land were assigned hierarchically (Table 1). Arcgis fishnet analysis was used to sample Chengdu city with 1 km × 1 km magnitude, totaling 13,979 grids, and land use intensity was assessed for each grid. The land use intensity is calculated as follows:
D = 100 × n = 1 1 Y i × Z i
D [ 100 ,   400 ]
D is the comprehensive land use intensity index and Y i is the graded assignment of land use intensity at level i. Z i is the percentage of the area of the measurement unit occupied by the land type of level i. The range of land use intensity measurement values is 100~400.

3.3. Habitat Quality Evaluation Based on InVEST Model

The InVEST model is a model that can quantitatively assess a variety of ecosystems. The habitat assessment module was based on the sensitivity of the land to threat factors and the distance from the threat source; the quality of the habitat was influenced by both distance and threat factors. Habitat quality was then spatially quantified. The impact intensity of the threat source was divided into two categories of linear decay and exponential decay in terms of distance; the habitat degradation assessment is then calculated by the formulae:
i rxy = 1 ( d x y d r   m a x )   Linear   decay  
i rxy = exp [ ( 2.99 d r   m a x ) d x y ]   Exponential   decay  
D x j = r = 1 R y = 1 Y r ( w r r = 1 R w r ) r y i r x y β x S j r
In Equations (2) and (3) i rxy is the distance decay function of the influence of the threat factor r contained in the x raster on the y raster. d x y is the distance between the assessed raster and the threat source. d r   m a x is the maximum influence distance of this threat factor; in Equation (4), D x j is the impact of habitat degradation on habitat j caused by the threat source contained in grid x, R is the number of threat factors, r is the threat factor, and Y r is the total number of rasters containing threat factors. w r is the weight of the threat factor, r y is the number of threat factors in grid y, β x is the accessibility of raster x, and S j r is the sensitivity of land cover of habitat j to threat r.
The habitat quality measurement formula is as follows:
Q x j = H j [ 1 ( D x j z D x j z + k z ) ]
Q x j [ 0 , 1 ]
In Equation (5), the H j is the habitat suitability of habitat j, z is the default constant of 2.5, k is the half-saturation constant; according to the InVEST user manual [44], the range of habitat quality values is from 0 to 1, and the more the value tends toward 1, the better the habitat quality.
By combing through the literature and taking into account the actual situation of the study area, cropland, construction land, and roads were selected as threat sources. The parameters in the model that needed to be adjusted according to the specific conditions of the study area mainly included the maximum impact distance and relative impact weight of the threat source, as well as the habitat suitability value of the land use type and its sensitivity to the threat source. This part is based on the InVEST model guidebook [20], which refers to the studies of relevant scholars [3,21,22,23], integrates the opinions of experts in the ecological field, and optimizes the study area with the actual conditions of the study area in order to determine the relevant parameters, as shown in Table 2 and Table 3 below.

3.4. Bivariate Spatial Autocorrelation

The spatial autocorrelation model is able to respond to the correlation of variables existing in the region; it is divided into global spatial autocorrelation and local spatial autocorrelation. The Moran’s I and Local Moran’s I are mostly used to describe the global spatial autocorrelation and local spatial autocorrelation. The calculation formula is as follows:
I = i = 1 n j i n W i j ( Y i Y ¯ ) ( Y j Y ¯ ) S 2 i = 1 n j i n W i j
S 2 = 1 n i = 1 n ( Y i Y ¯ ) in the formula denote the attribute values of units i and j, respectively; n is the number of spatial units counted (a total of 13,979 spatial units are divided in this paper); W i j is the weight matrix established based on the spatial adjacency relationship.
To explore the spatial correlation between multiple variables, related scholars evolved a bivariate spatial autocorrelation model based on the Moran index. The model is capable of exploring the spatial correlation between one variable and another. The calculation formula is as follows:
I l m p = Z l p q = 1 n W p q Z m q
where Z l p = ( X l p X l ¯ ) σ l ; Z m q = ( X m q X m ¯ ) σ m . X l p is the value of the l attribute of plot p and X m q is the value of the m attribute of plot q. X l ¯ , X m ¯ are the mean values of l and m; σ l , σ m are the variance values of l and m.
To reveal the spatial correlation characteristics of land use intensity and habitat quality, Moran scatter plots and LISA clustering maps were produced using GeoDa software 1.20.0.36 to analyze the spatial correlation between land use intensity and habitat quality. The Moran’s I index takes values in the range −1–1; its value is in positive correlation if it is greater than 0, negative correlation if it is less than 0, and random distribution if it is close to 0. The spatial distribution was divided into four quadrants, which corresponded to four spatial clusters of “high land use intensity–high habitat quality” (H–H), “high land use intensity–low habitat quality” (H–L), “low land use intensity–low habitat quality” (L–L) and “low land use intensity–high habitat quality” (L–H).

4. Results

4.1. Urban Expansion Characteristics

4.1.1. Land Use Evolution

As shown in Table 4 below, land in Chengdu is dominated by cultivated land, which accounts for 58.61% of the total urban area in 2020; cultivated land is distributed in the central and eastern parts of the study area around construction land. Woodland accounts for the second largest area at 23.13%, with woodland mainly concentrated in the Longmen Mountains in the west, the Longquan Mountains in the east and the southern part of Jinyang; construction land accounts for 13.02%, concentrated in the central part of the city.
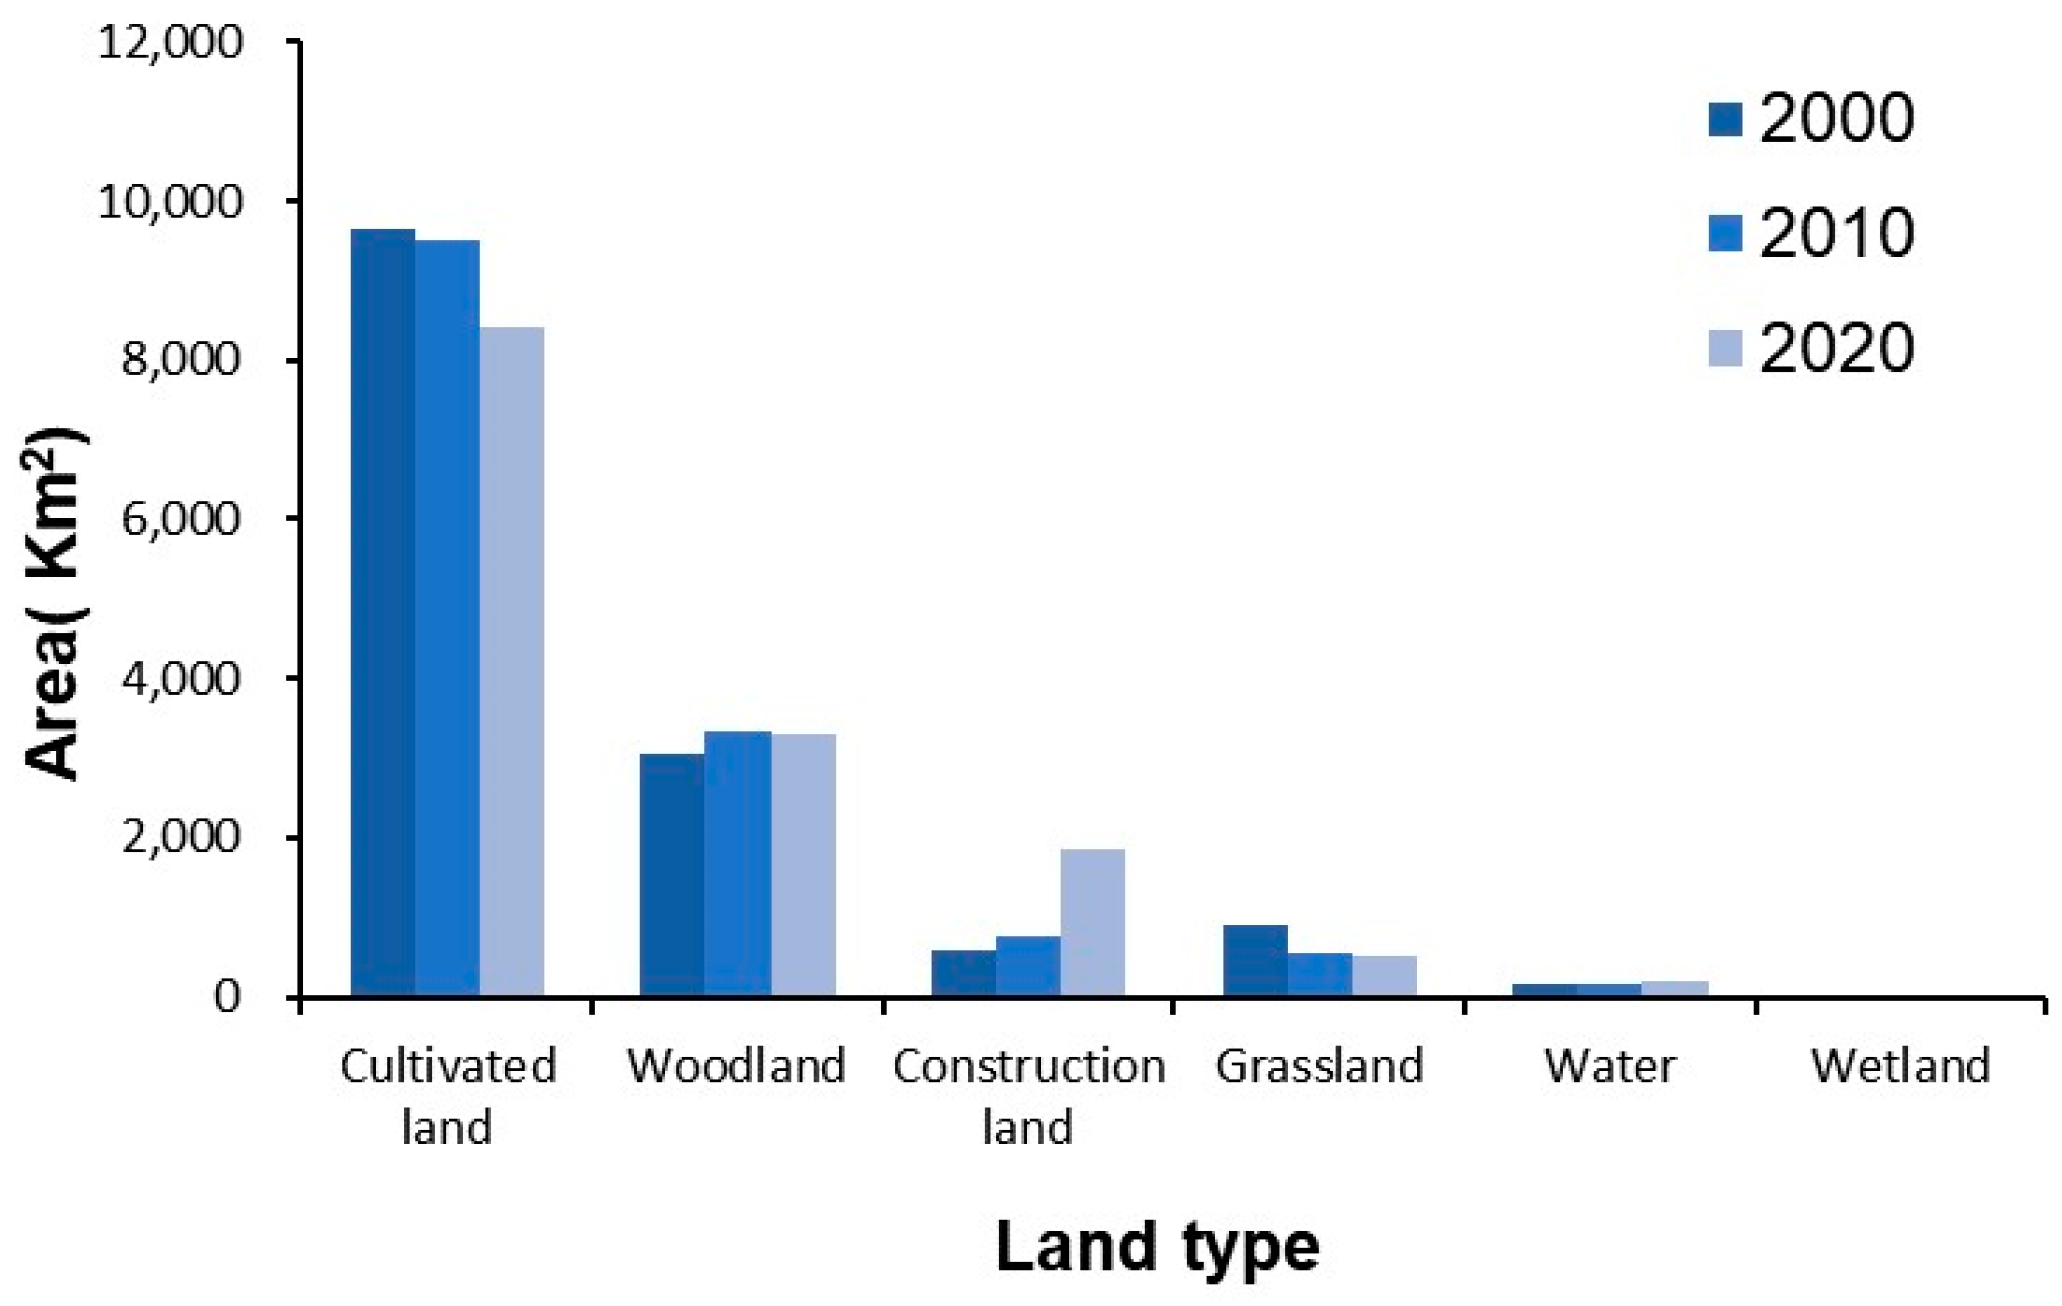
During the past 20 years, the area of cultivated land and grassland in Chengdu has continued to decrease, while the area of woodland has increased; the area of construction land has increased significantly, with an increase of 240.57%, as shown in Figure 3. From 2000 to 2010, the construction land increased by 197.42 km2 (increase of 34.12%) mainly due to the transfer of arable land and grassland; the transfer of arable land to construction land accounted for 84.48% of the total increase in construction land, while the transfer of grassland accounted for 13.80% of the increase in construction land. From 2010 to 2020, the area of construction land increased by 1121.85 km2, an increase of 140.58%; the area of cultivated land transferred to construction land accounted for 94.92% of the increase in the area of construction land. The period 2010–2020 saw 5.52 times increase in the area of construction land compared to 2000 to 2010, with the city entering a stage of rapid development.

4.1.2. Analysis of Urban Spatial Pattern

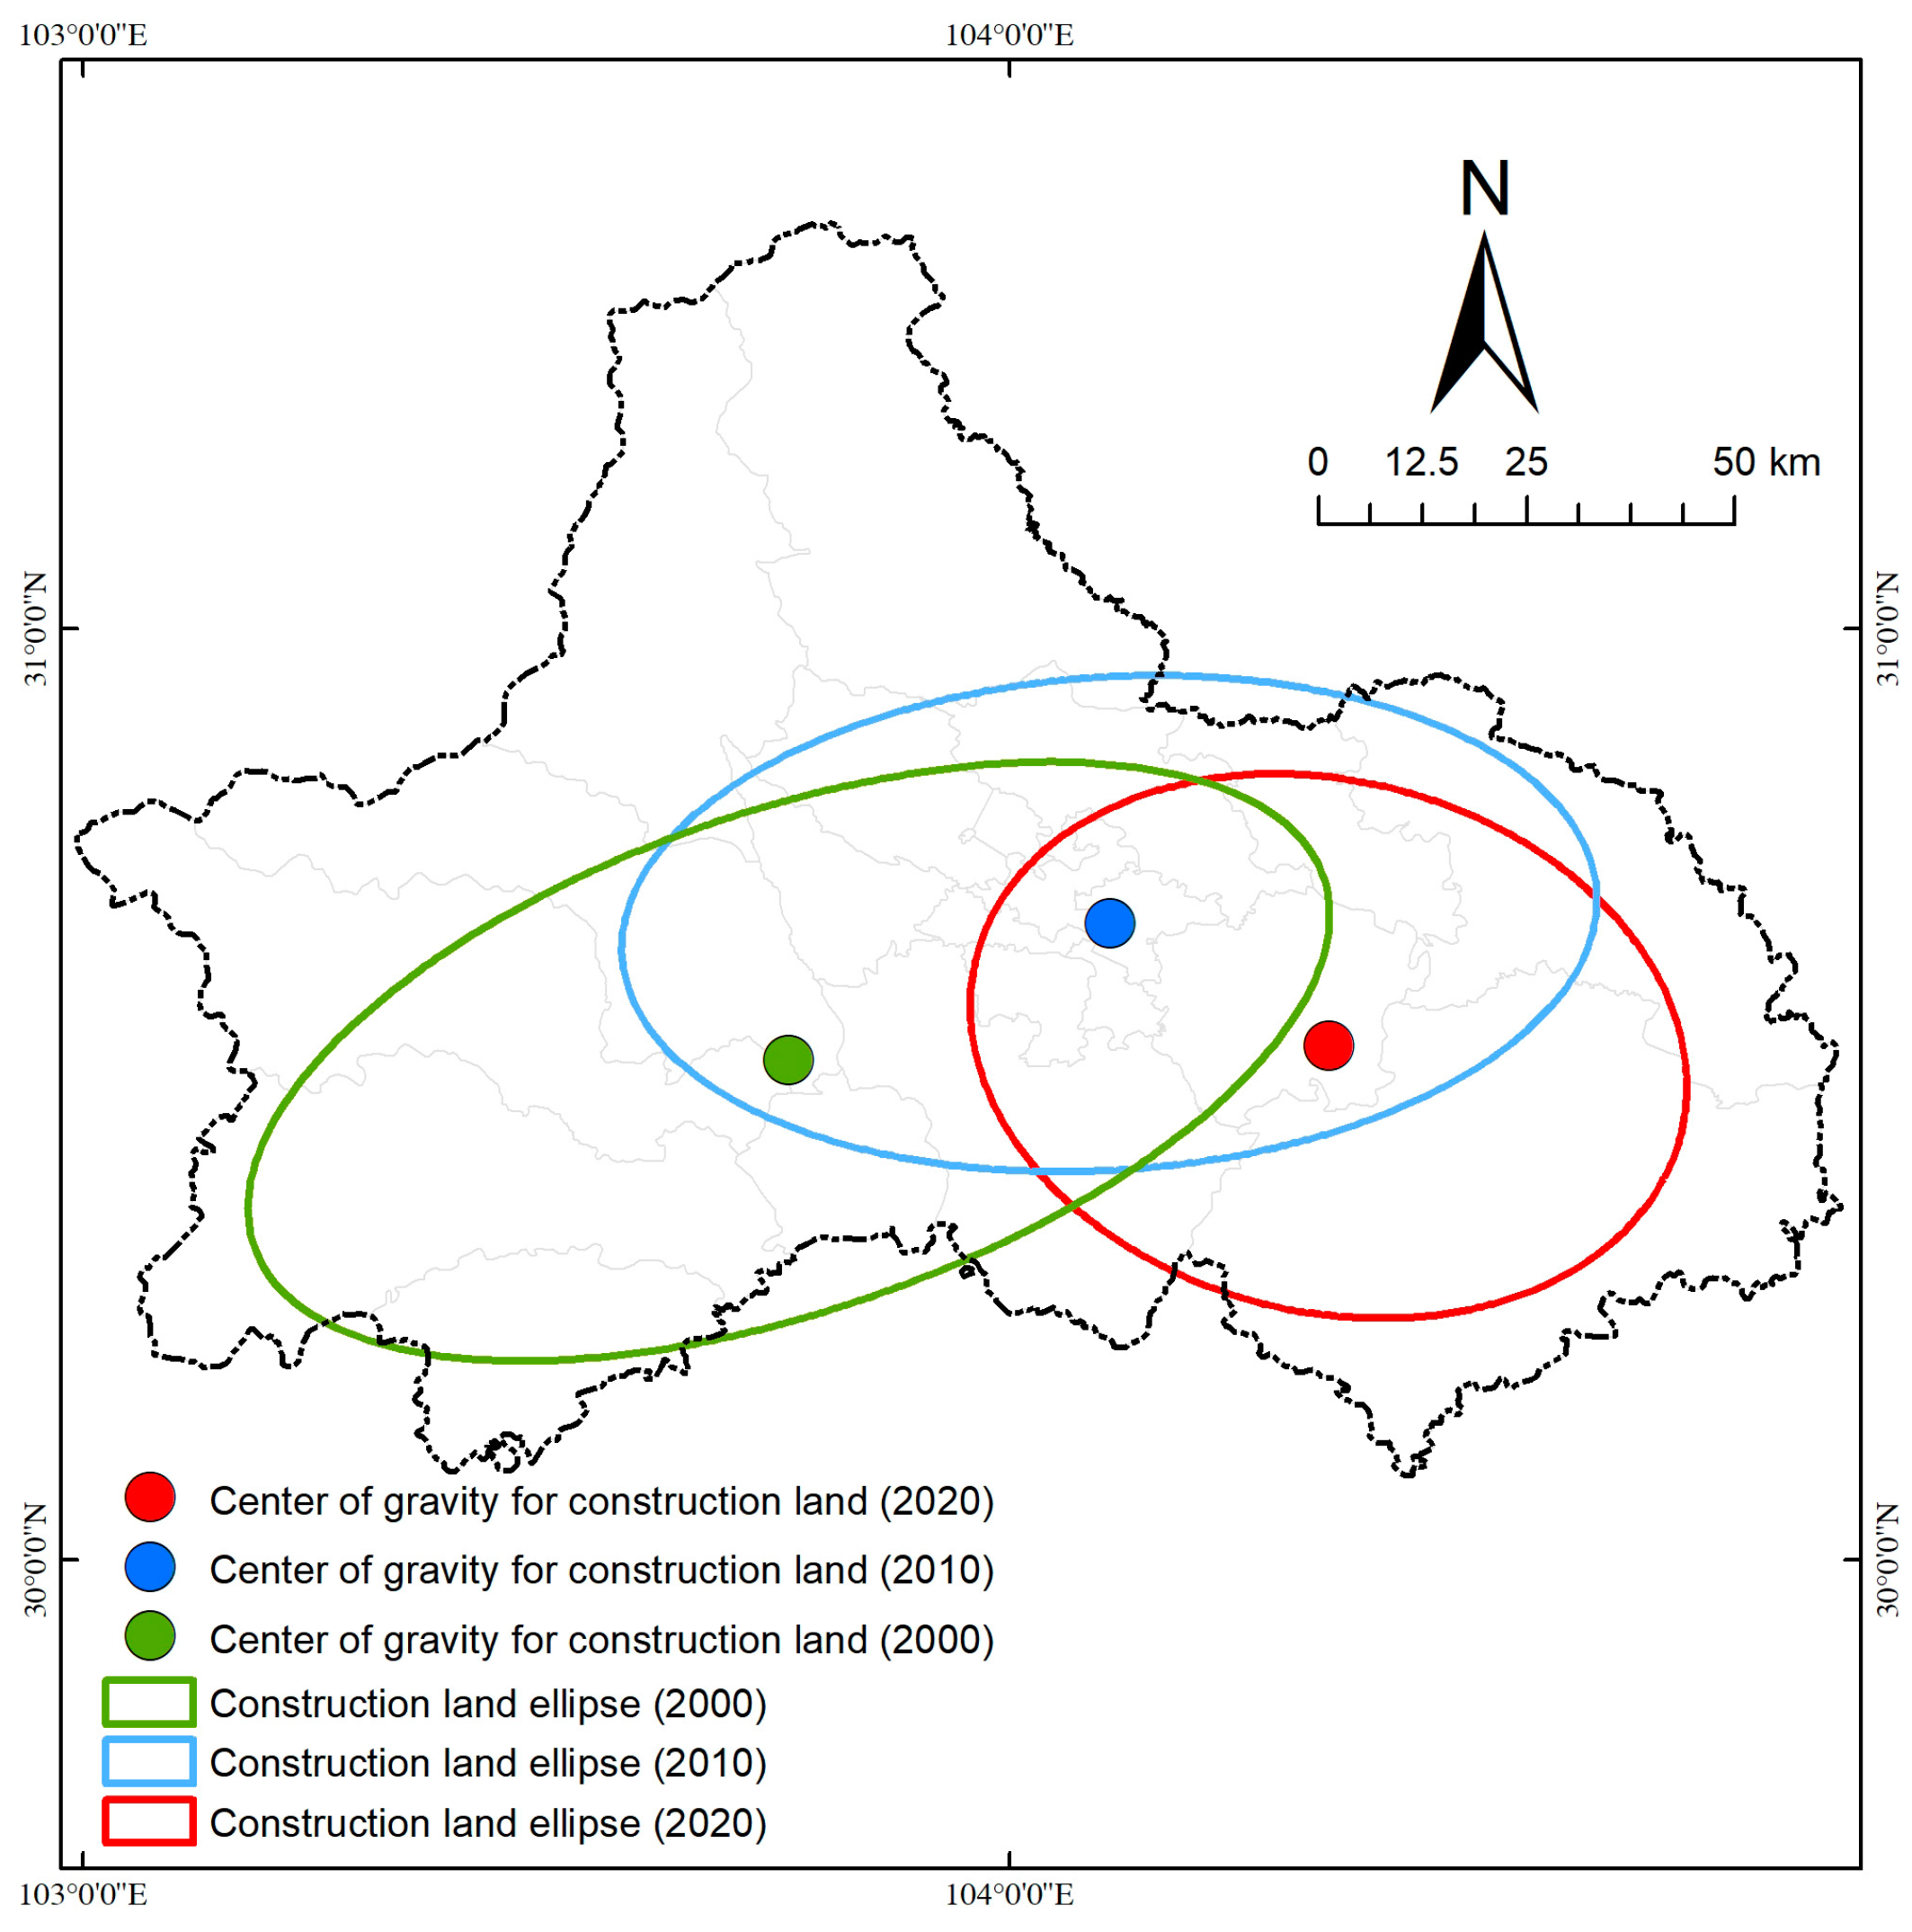
The standard deviation ellipse analysis was used to obtain the distribution of the center of gravity of construction land in the study area for three periods, as shown in Figure 4. For 20 years, the trajectory of the center of gravity of construction land showed a “back to the middle-eastward” movement, while the ratio of the long axis to the short axis of the standard deviation ellipse gradually decreased. In 2000, the center of gravity of construction land in Chengdu was located in the western part of the city, while the ratio of the long axis to the short axis was 2.04. In 2010, the center of gravity of construction land returned to the main urban area of Chengdu, with a ratio of long axis to short axis of 1.72. According to the new planning strategy, the focus of construction land shifted eastward to Longquanyi District in 2020, and the long-axis to short-axis ratio was 1.22. The elliptical long-axis to short-axis ratio of the standard deviation of construction land decreased gradually from 2010 to 2020, indicating that the city had shifted to a compact expansion pattern.

4.2. Habitat Quality Analysis

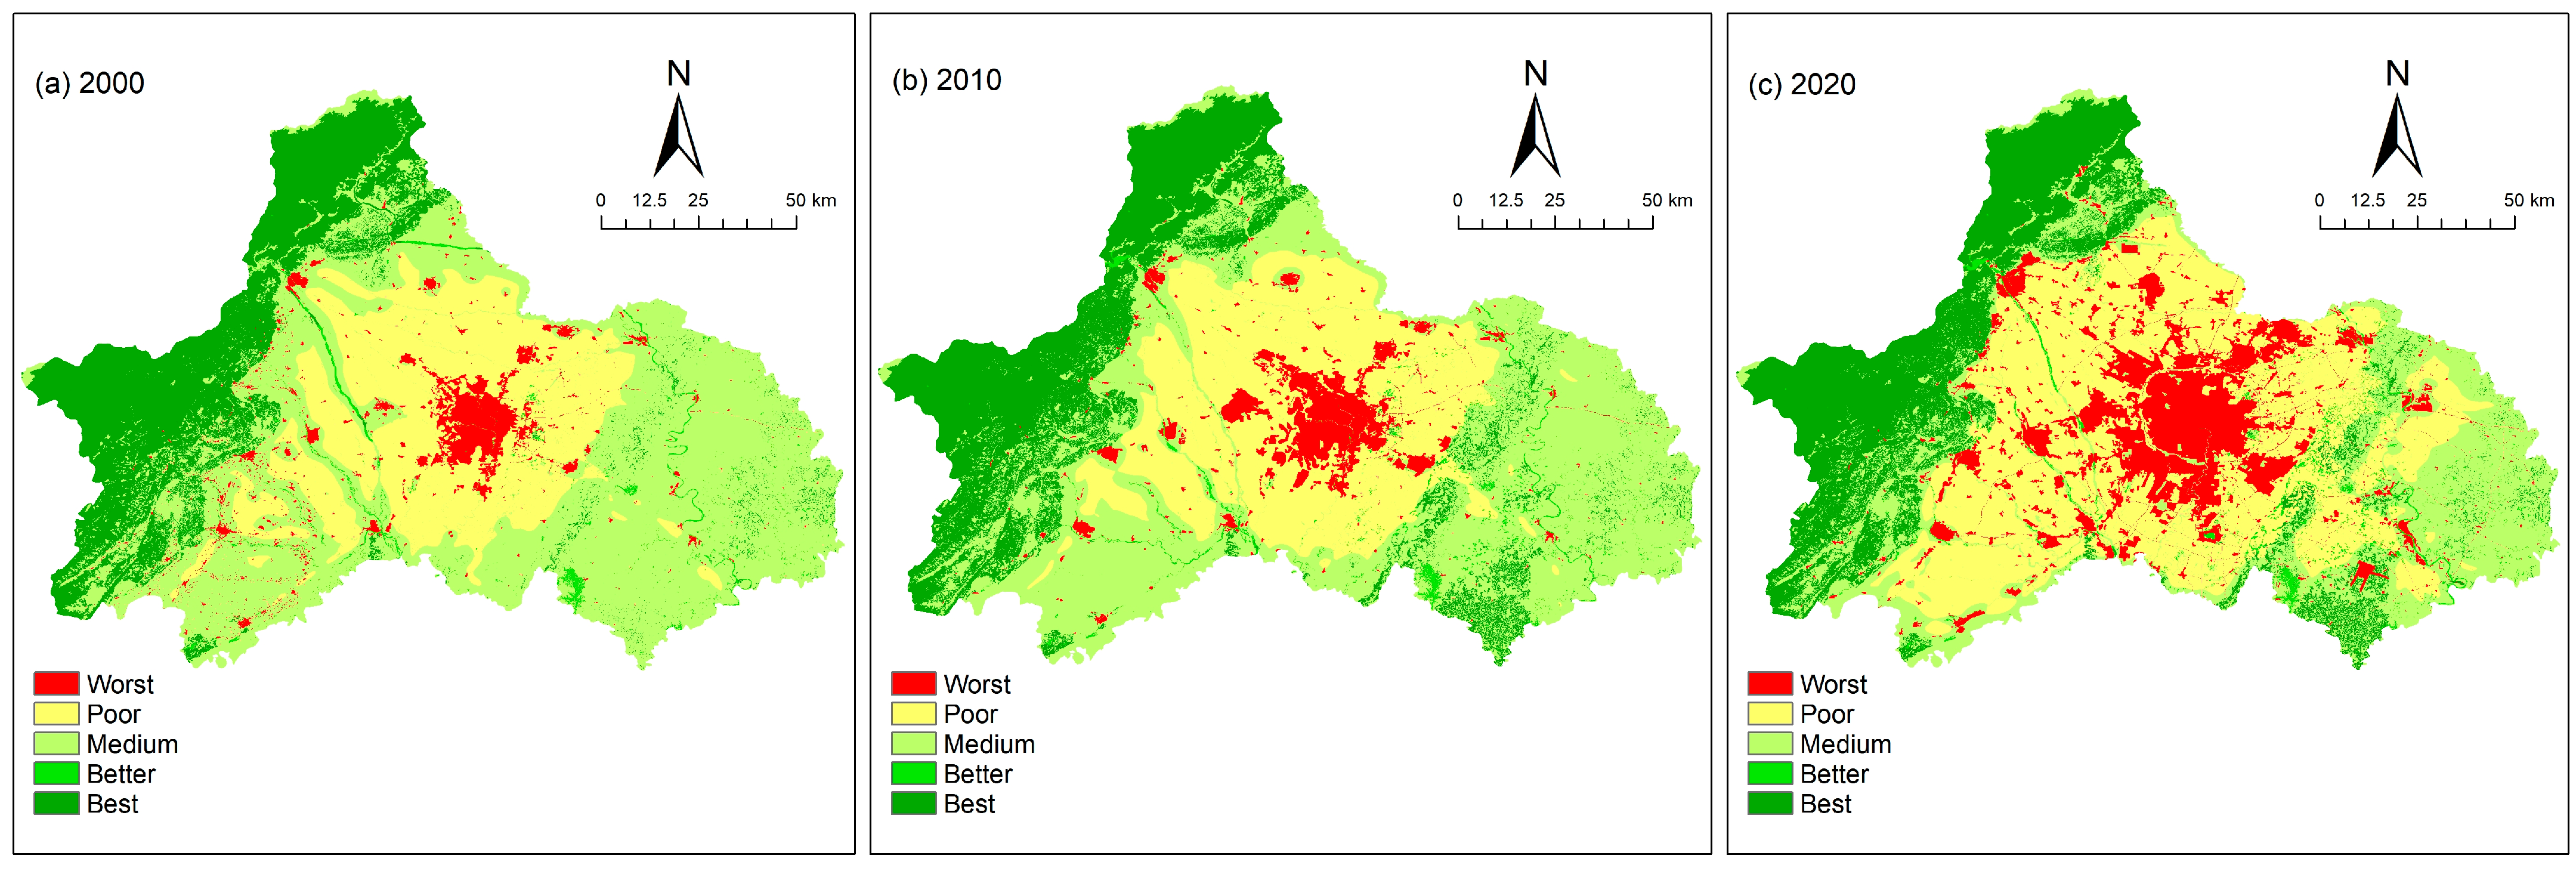
The Habitat Quality module of the InVEST model was run to obtain the habitat quality indices of Chengdu in three periods covering 2000, 2010 and 2020 (Figure 5). Based on the natural breakpoint grading method, the habitat quality indices were divided into five intervals: 0~0.2, 0.2~0.49, 0.49~0.83, 0.83~0.94, and 0.94~1.00, which were classified into five classes: worst, poor, medium, better, and best.
As shown in Figure 5, the area used to assess the overall habitat quality of Chengdu is bounded by the Longmen Mountain Range in the west and the Longquan Mountain Range in the east, mainly showing the spatial characteristics of high in the east and west and low in the middle. The “Better” and “Best” grade habitats are mainly distributed in the Longmen Mountains in the west, the Longquan Mountains in the east, and the Sanchahu Lake area in Jianyang; these areas have high forest cover and less intensive land use and, therefore, have better habitat quality. In addition, parcels of “Better” and “Best” habitat quality are distributed along the main streams of the Minjiang River, the Xi River, the Xiejiang River, and the Nanhe River in the plain water network. The land use types of the medium habitat quality plots are mainly arable land, concentrated in the Chengdu plain area and located around construction land; the habitat quality is influenced by construction land and roads. Worst-grade habitat quality parcels have a high overlap with construction land areas and are more affected by urban construction.
As shown in Table 5, the percentage of poor-grade habitats in the Chengdu metropolitan area is relatively large, accounting for 37.1% of the area; “medium” and “best” grade habitats account for 25.82% and 22.48%, respectively, while only 13.02% of the land was worst-grade habitat. In terms of time scale, the average habitat quality indices of Chengdu in 2000, 2010, and 2020 were 0.6049, 0.5991, and 0.5584, respectively, which decreased year by year in line with the overall habitat degradation trend. The main reason for the decrease in the habitat quality index in Chengdu is the significant decrease in the extent of medium-grade habitat areas combined with the increase in the extent of “poor” and “worst” grade habitat areas. Over the past 20 years, the percentage of medium-grade habitat decreased from 49.94% to 25.82%, a decrease of 48.30%; worst-grade increased by 222.27%, while poor-grade increased by 13.46%.
The spatial distribution of the habitat quality index for the three periods from 2000–2020 was analyzed by superposition–subtraction analysis, using Raster Calculator to obtain the habitat quality degradation maps for the three time spans of 2000–2010, 2010–2020, and 2000–2020 (Figure 6); the range for change in habitat quality index spread from −1 to 1.Aafter reading the relevant literature [45], the index was classified into 5 levels, where a change of −0.1~0.1 interval was a non-significant change. If the value was negative, the land habitat was degraded; the smaller the value, the more serious the degradation. If the value was positive, the land habitat had improved; the larger the value, the greater the habitat improvement. Habitat quality in the central part of Chengdu city was seriously degraded around the main urban area in the 20-year period from 2000 to 2020. In the same period, habitat quality in the Longquan Mountains improved, while the habitat quality along the main stream of Minjiang River and the Jianjiang River had degraded more severely due to the expansion of land for urban development and construction; large areas of forest land in Wenjiang District have been converted to construction land. The greatest magnitude and scale of habitat degradation occurred in Pidu District in the context of the construction of the Chengdu high-tech industrial zone, the arrival of a number of universities, and the expansion of construction land; thus, habitat degradation appeared relatively serious. The habitat of the eastern Longquan Mountains and the area around Sanchahu Lake improved due to the conversion of grassland to forest land; however, from 2010 to 2020, the land habitat in the central part of Chengdu was severely degraded. Habitat quality in the southern part of the city was degraded in a concentrated manner due to the expansion of construction land brought about by the construction of the South High-Tech Zone. Habitat improvement in the northern part of the main stream section of the Min River under ecological management. The construction of the Chengdu City Ring Ecological Park has improved the habitat in the southern part of the city center.

4.3. Habitat Quality and Urban Expansion Impact Analysis

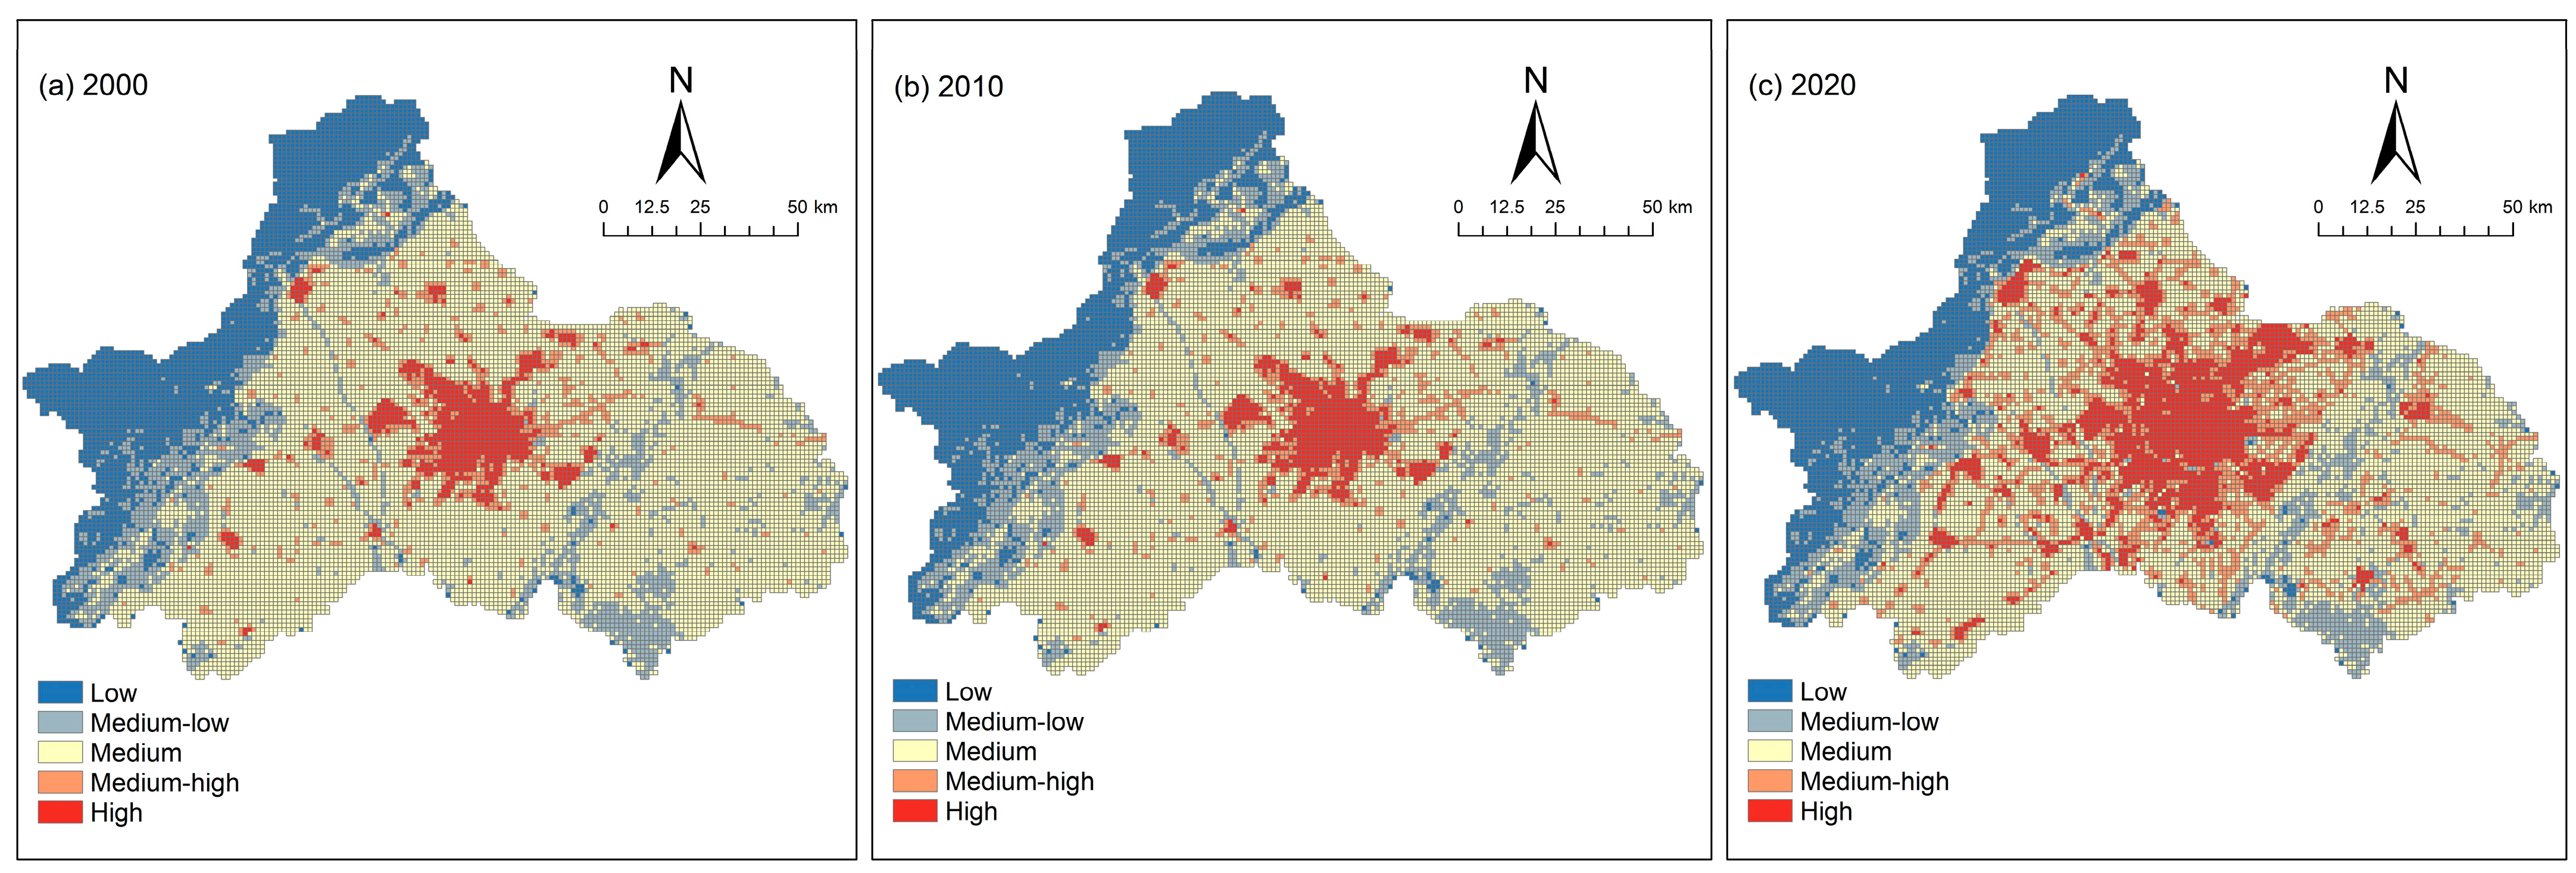
The distribution of urban land use intensity is shown in Figure 7. The land use intensity in Chengdu is dominated by parcels with medium land use intensity, while the spatial characteristics of land use intensity are low in the western region and high in the central region. As shown in Table 6, along with urban development, a large number of medium land use intensity parcels were converted to high land use intensity. Using superposition analysis, the land use intensity and habitat quality of the 13,979 grids analyzed in the municipal fishery network were integrated into the “land use intensity–habitat quality grade”; 12 types of land use intensity and habitat quality were obtained (Table 6). The highest percentage of “medium-high intensity–poor grade” land parcels in Chengdu was 32.82%. From the time scale, the percentage of “low intensity–best grade” and “low intensity–better grade” land parcels in Chengdu from 2000 to 2020 is relatively stable, with a change of −2.35% and 2.37%, respectively. This is the result of the conservation measures in the ecological conservation area of Chengdu. The percentage of “medium-high intensity-medium grade” plots decreased from 28.69% to 14.29, with a decrease of 50.21%, mainly because the habitat quality index was downgraded to poor-grade. The “medium-high intensity–poor grade” type of parcels had the largest growth rate and the largest scale, with the area share increasing from 25.47% to 32.82%, which represents an increase of 28.88%.
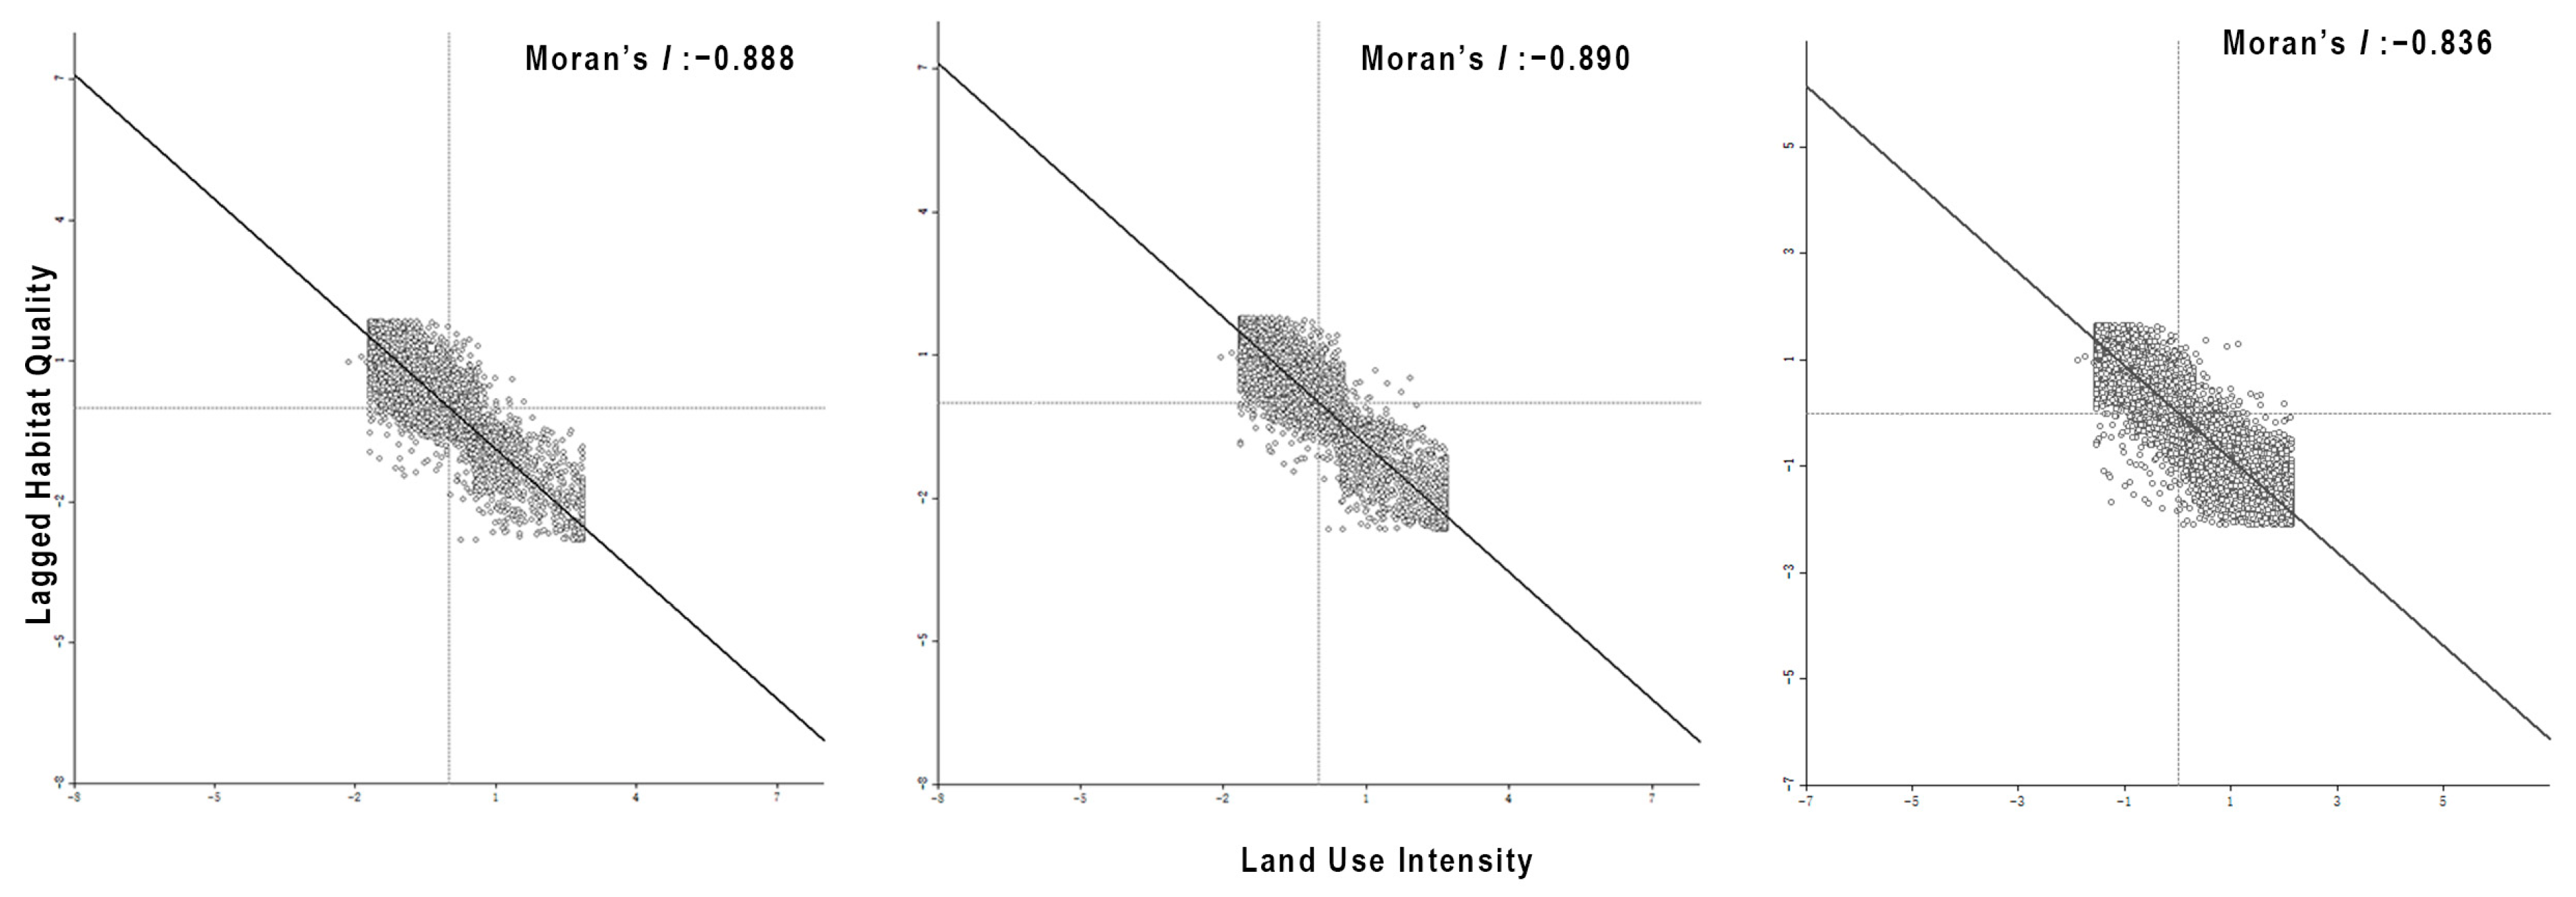
To further explore the spatial correlation between land use extent and habitat quality, a bivariate spatial autocorrelation model was used to analyze the spatial association characteristics of land use extent and habitat quality using GeoDa software. The Figure 8 shows that, the scatter is mainly distributed in the second quadrant (L–H) and the fourth quadrant (H–L), with Moran’s indices of −0.888, −0.890, and −0.836, respectively. Analysis of Moran’s index revealed that land use intensity and habitat quality were spatially significantly and negatively correlated, with habitat quality decreasing with increasing land use intensity. The spatial correlation between land use and habitat quality was strongest in 2010, while Moran’s index was −0.888 and −0.836 in 2000 and 2020, respectively. The spatial correlation between land use intensity and habitat quality showed an increasing trend followed by a decreasing trend.
We visualized spatial clustering using LISA clustering analysis (Figure 9). The results show that the spatial clustering of land use intensity and habitat quality in Chengdu is dominated by high land use intensity–low habitat quality (H–L) and low land use intensity–high habitat quality (L–H). High land use intensity–low habitat quality clusters are mainly distributed around urban settlements; The low land use intensity–high habitat quality clustering is mainly distributed in the Longmen Mountains in the west. The clustering space of low land use intensity–high habitat quality in 2020 appears in the eastern Longquan Mountains and the Sanchahu Lake region. It is noted that low land use intensity–low habitat quality (L–L) clustering occurs along the main streams of the Min River, the West River, and the South River in 2020, along with the construction of urban expansion. Some of the low land use intensity–high habitat quality clusters (L–H) in the western area of the Longmen Mountains were converted to high land use intensity–high habitat quality clusters (H–H). The impact of urban expansion on the neighborhood habitat space is responsible for the decrease in the absolute value of Moran index.

4.4. Regulatory Zoning Based on Habitat Quality and Land Use Intensity

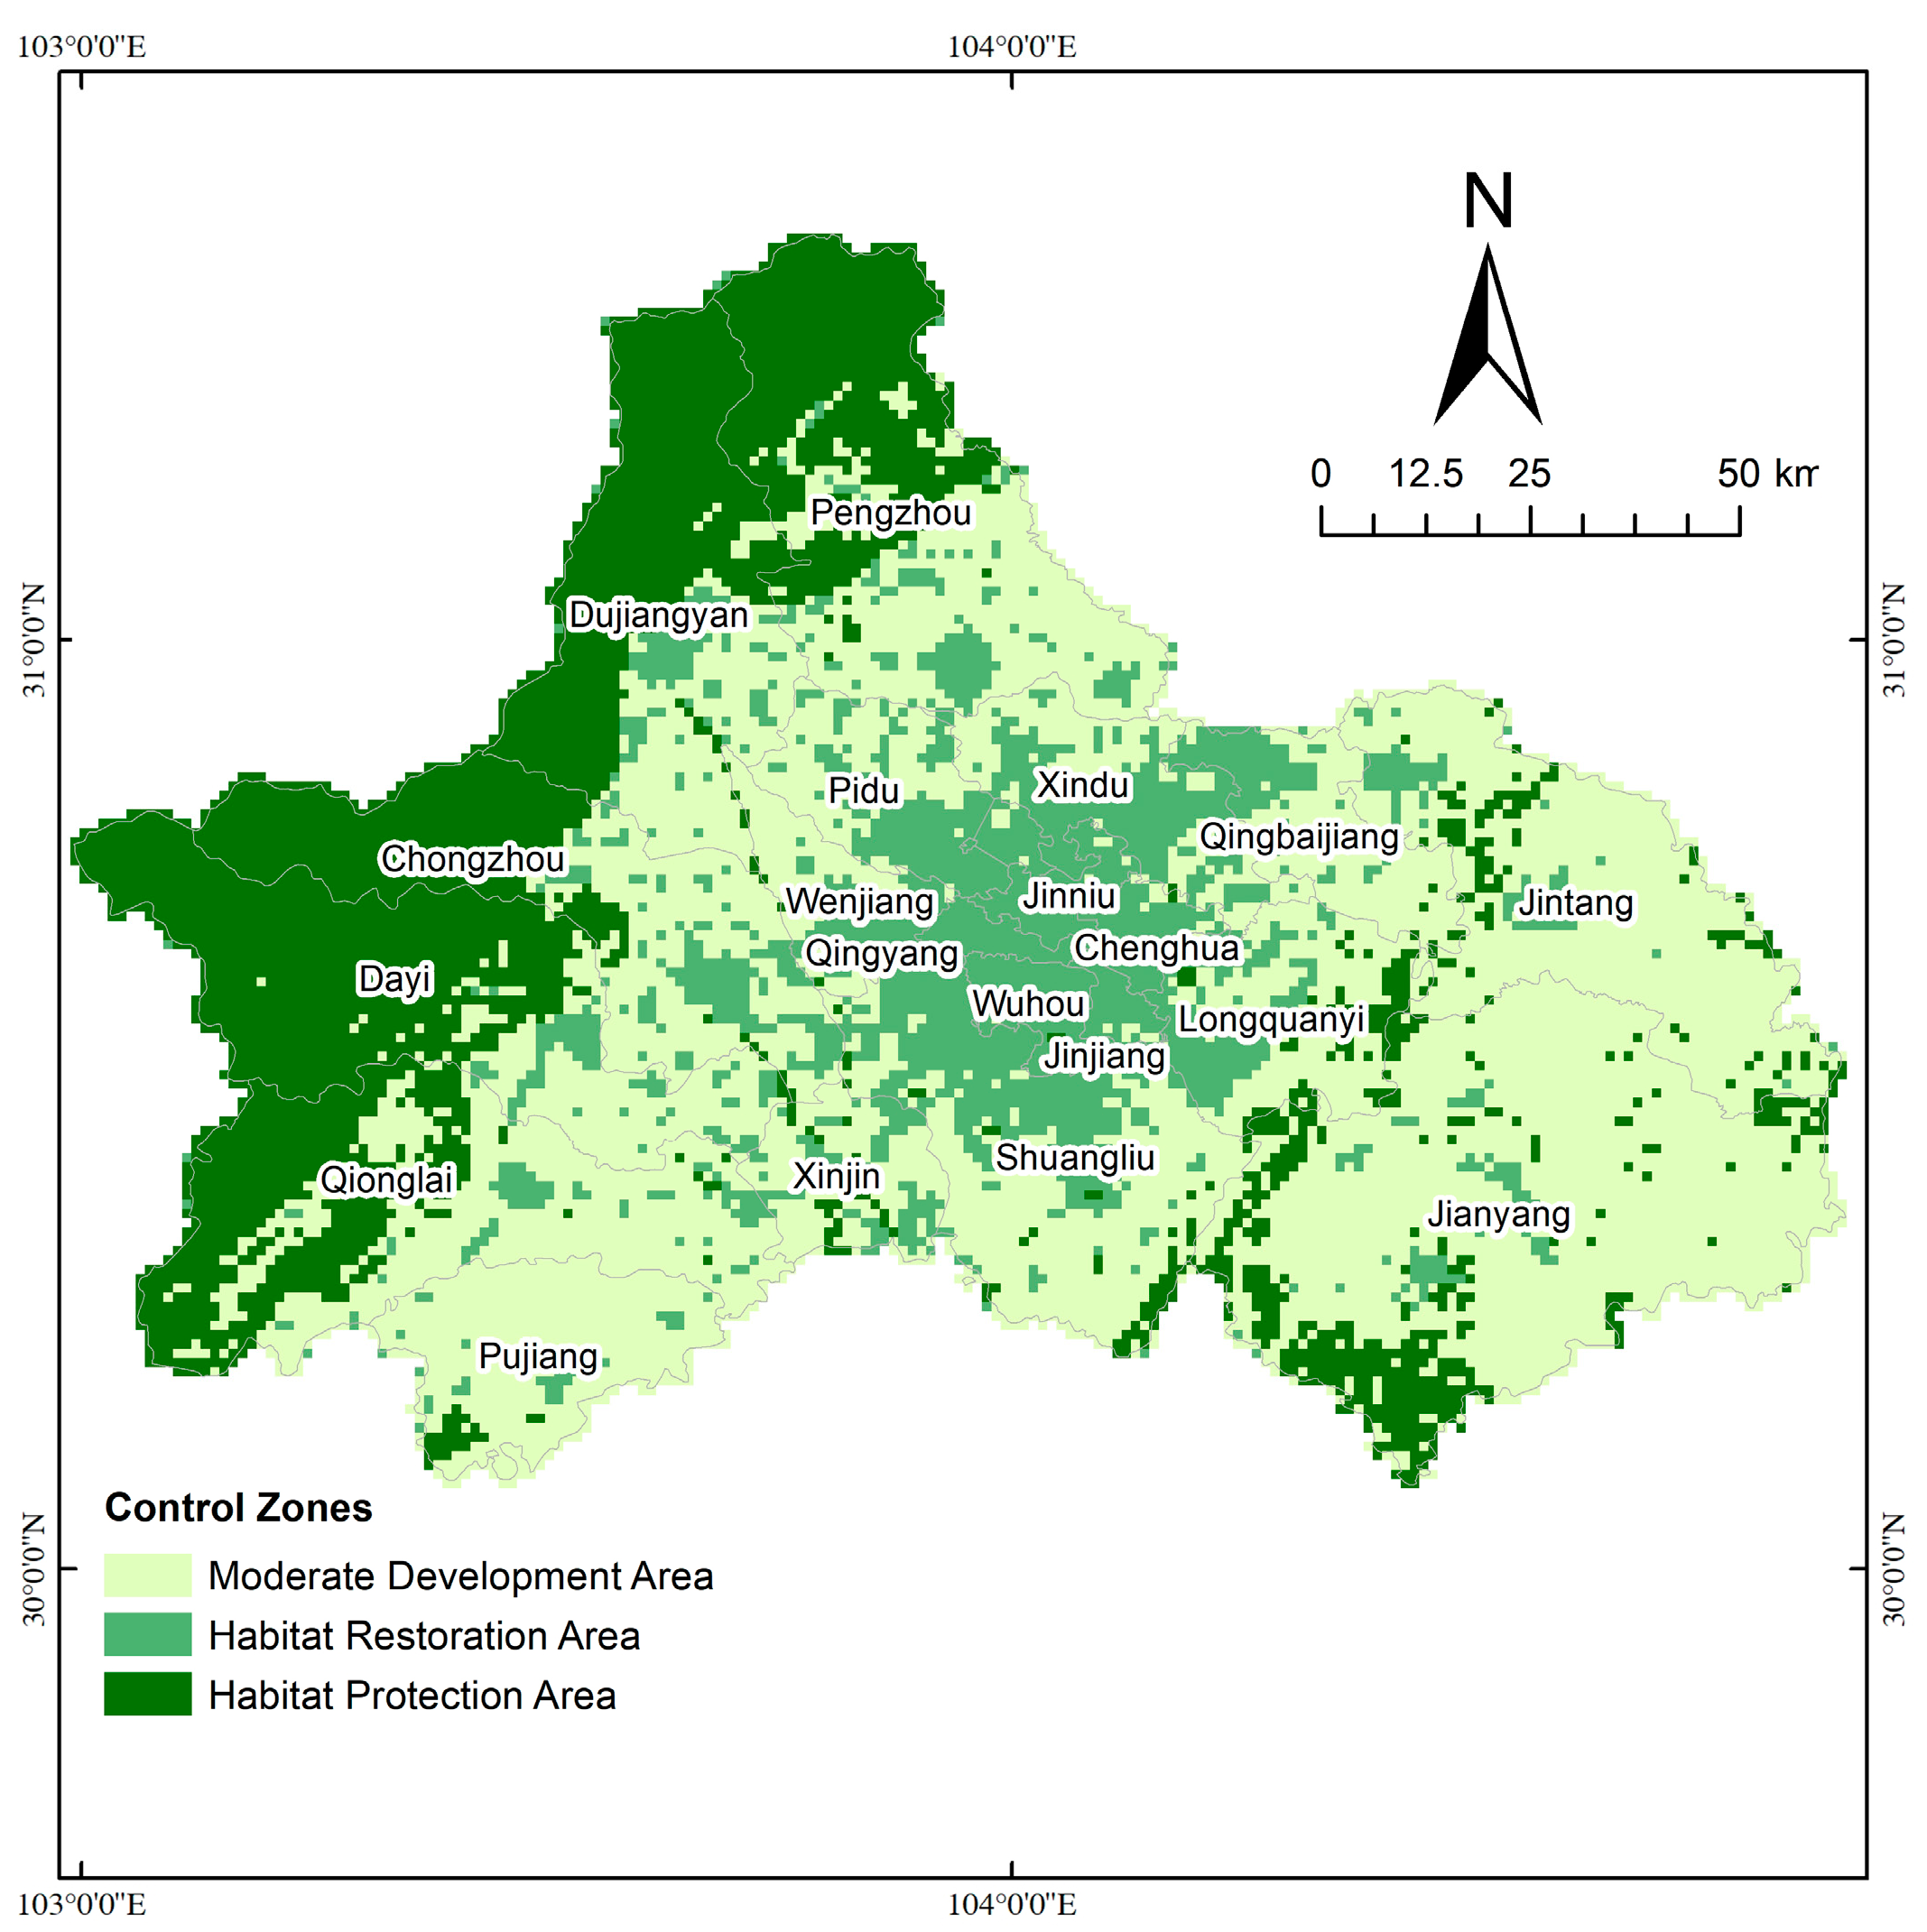
12 types of “land use intensity–habitat quality” are divided into three categories: habitat protection area, habitat restoration area, and moderate development area (Table 7), which constitute the spatial control zones of the city. The habitat protection area is an important ecological function area, which constitutes the ecological barrier of the city and is the core component of the habitat of plants and animals in Chengdu, while the habitat restoration area is the area used to reverse the degradation of land habitat caused by urban development where human beings are not satisfied with a high-quality living environment. Moderate development area is an area available for moderate urban development in the future under the perspective of ecological protection, as a guide for urban land use development.
The results of the spatial control zoning of the city are shown in Figure 10. The habitat protection area is mainly distributed in the western Longmen Mountains, the eastern Longquan Mountain Range, and the Sanchahu Lake area, as well as along the main streams of the Min River and the West River; the habitat restoration area is mainly concentrated in the central part of the city, as well as being scattered in the western area of the city. The moderate development area is concentrated in a large area east of the Longquan Mountains. The western area of the municipality is a concentrated agricultural area and the upper reaches of the municipal water sources; future development here should focus on protection and stabilizing and optimizing the habitat.

5. Discussion

The natural factors of the city determine the general ecological pattern, while human construction activities influence the habitat space. The assessment of habitat quality in Chengdu from 2000 to 2020 revealed that the distribution of habitat quality in Chengdu showed a distribution pattern of low habitat quality in the central part of the city and high habitat quality in the eastern and western parts of the city. Chengdu is located in the eastern part of the Sichuan Basin and contains a variety of terrain, including hills, mountains, and plains. The Longquan Mountains in the east and Longmen Mountains in the west provide good habitat space for Chengdu due to limited human disturbance and presently high habitat quality. The Chengdu Plain is an alluvial fan plain; the central plain area has been an important source of food and edible oil, and has been known as the “Land of Heaven”, since ancient times. Suitable construction conditions combined with deep cultural heritage have made the central region a concentrated area for urban construction. The high frequency of human construction activities in the central region also reduces the habitat quality in the central region.
Changes in habitat quality are a response to urban expansion. From 2000 to 2020, construction land in Chengdu continued to expand. Compared to the 34.12% increase in construction land in the first ten years of 2000–2010, the increase in construction land between 2010–2020 was 140.58%, an expansion rate 5.52 times faster than the previous decade. The expansion of cities continued to accelerate and the scale of construction land continued to increase. In the early high-speed development phase, ecology gave way to urban development. Changing land use types and habitat fragmentation due to urban expansion are important reasons for the decline in regional habitat quality. Urban expansion encroached on a large amount of cultivated land and grassland, and the overall habitat quality in 2000, 2010, and 2020 shows a decreasing trend. Due to the construction of the city, large areas of woodland in Wenjiang District have been converted to construction land; the magnitude and scale of habitat degradation is enormous. From 2010 to 2020, Chengdu vigorously developed the southern part of the city and, along with the construction of the Gaoxin South District, there was extensive degradation of regional habitat quality. In addition, it is worth noting that urban construction around the main stream of the Min River, the West River and the South River in the southwestern part of the city has led to a significant decline in habitat quality along the river. The spatial clustering of “low land use intensity–low habitat quality” (L–L) emerged along the river in the spatial correlation analysis; this represents the negative impact of urban expansion on the adjacent habitat space. As rivers are an important part of the ecosystem, urban construction in river areas should be strictly controlled in future urban planning to protect the river ecological corridors of the city. By analyzing the rate of urban expansion in Chengdu, it is found that the city has entered a rapid development phase since 2010, with the expansion of construction land being an inevitable trend. However, the impact of urban expansion on the habitat environment is negative; thus, urban construction should be controlled in future urban planning and urban land use guidance should be proposed to prevent disorderly urban expansion from destroying the quality habitat space of the city. These proposals would allow the ecological pattern of the city to be better protected and the sustainable development of the city to be realized. This study proposes spatial control suggestions for future urban development based on the spatial correlation between land use intensity and habitat quality. In the future, Chengdu should focus on protecting the two major ecological barriers, the Longmen Mountains in the east and the Longquan Mountains in the east, to protect the high-quality ecological space in the city. The western plains area is a concentrated area for agricultural production and an upstream area for urban water sources; thus, future development should focus on conservation to stabilize and optimize habitat quality. Habitat quality in the central plain area is low due to the high speed of urban construction in the studied period. In future urban planning, we should control the speed of urban construction and build green space within the city to restore the habitat quality of the region. Based on the analysis of urban expansion in Chengdu, it is found that the city entered a high-growth phase after 2010, with the expansion rate of the city being on a growth trend. It is also an effective path to protect the quality of urban habitats for the guidance of urban development in Chengdu. According to the analysis in Section 4.4, the urban development zone of Chengdu under ecological protection is located in the eastern part of the Longquan Mountains, which echoes the construction policy of the “Chengdu–Chongqing twin-city economic circle” in recent years.

6. Conclusions

This study used the InVEST model to assess the habitat quality in Chengdu from 2000 to 2020 and found that the overall habitat quality in Chengdu was on a decreasing trend. Spatial correlation analysis of land use intensity and habitat quality using GeoDa software revealed a significant negative correlation between land use intensity changes due to urban expansion and habitat quality. The impact of urban expansion on habitats is divided into direct and indirect impacts. Urban expansion encroaches on surrounding cultivated and grassland areas, compressing natural habitat space, and directly degrading regional habitats; at the same time, a series of human activities of urban expansion also have negative impacts on adjacent habitat spaces, most notably along some rivers in the southwestern part of the city. Therefore, this study recommends a municipal control zoning proposal based on the mechanism of urban expansion on habitat and the current situation of land use intensity and habitat quality. This land use guidance can protect the original high-quality ecological space in the city, while also providing ecologically oriented sustainable development suggestions for the future development of the city.
This study uses a regional macro-analysis to study the overall habitat quality of the city; however, the green spaces, such as parks and squares, that exist in the urban space are also part of the spatial composition of the urban habitat. In the study, it was found that the construction of urban ring parks along the Chengdu city bypass led to improvements in regional habitat quality. The green space within the city also had a positive effect on the urban habitat. Therefore, in the next study, we should further explore the correlation between green space and habitat in the city from a microscopic perspective to enrich the path of high-quality urban development.
Author Contributions

Conceptualization, X.X.; methodology, X.X.; software, Q.Z.; validation, X.X.; formal analysis, Q.Z.; investigation, Q.Z.; resources, X.X.; data curation, Q.Z.; writing—original draft preparation, X.X. and Q.Z.; writing—review and editing, X.X. and Q.Z.; visualization, Q.Z.; supervision, X.X.; project administration, X.X.; funding acquisition, X.X. All authors have read and agreed to the published version of the manuscript.

Funding

This research was funded by Basic Research program—Natural Science Foundation project, science and technology department of Gansu Province, grant number 22JR11RA158.

Institutional Review Board Statement

Not applicable.

Informed Consent Statement

Not applicable.

Data Availability Statement

Data are available with the corresponding author and can be shared upon reasonable request.

Conflicts of Interest

The authors declare no conflict of interest.

References

  1. United Nations. World Urbanization Prospects, The 2011 Revision: Highlights; UN: New York, NY, USA, 2012. [Google Scholar]
  2. Huang, G.; Zhou, W.; Cadenasso, M. Is everyone hot in the city? Spatial pattern of land surface temperatures, land cover and neighborhood socioeconomic characteristics in Baltimore, MD. J. Environ. Manag. 2011, 92, 1753–1759. [Google Scholar]
  3. Bai, X.; Chen, J.; Shi, P. Landscape urbanization and economic growth in China: Positive feedbacks and sustainability dilemmas. Environ. Sci. Technol. 2012, 46, 132–139. [Google Scholar] [CrossRef] [PubMed]
  4. López, E.; Bocco, G.; Mendoza, M.; Duhau, E. Predicting land-cover and land-use change in the urban fringe: A case in Morelia city, Mexico. Landsc. Urban Plan. 2001, 55, 271–285. [Google Scholar] [CrossRef]
  5. Surya, B.; Salim, A.; Hernita, H.; Suriani, S.; Menne, F.; Rasyidi, E.S. Land use change, urban agglomeration, and urban sprawl: A sustainable development perspective of Makassar City, Indonesia. Land 2021, 10, 556. [Google Scholar] [CrossRef]
  6. Bren d’Amour, C.; Reitsma, F.; Baiocchi, G.; Barthel, S.; Güneralp, B.; Erb, K.-H.; Haberl, H.; Creutzig, F.; Seto, K.C. Future urban land expansion and implications for global croplands. Proc. Natl. Acad. Sci. USA 2017, 114, 8939–8944. [Google Scholar] [CrossRef] [Green Version]
  7. McKinney, M.L. Urbanization, Biodiversity, and ConservationThe impacts of urbanization on native species are poorly studied, but educating a highly urbanized human population about these impacts can greatly improve species conservation in all ecosystems. Bioscience 2002, 52, 883–890. [Google Scholar] [CrossRef]
  8. Seto, K.C.; Güneralp, B.; Hutyra, L.R. Global forecasts of urban expansion to 2030 and direct impacts on biodiversity and carbon pools. Proc. Natl. Acad. Sci. USA 2012, 109, 16083–16088. [Google Scholar] [CrossRef] [Green Version]
  9. Ren, Q.; He, C.; Huang, Q.; Shi, P.; Zhang, D.; Güneralp, B. Impacts of urban expansion on natural habitats in global drylands. Nat. Sustain. 2022, 5, 869–878. [Google Scholar] [CrossRef]
  10. Hu, Y.; Xu, E.; Kim, G.; Liu, C.; Tian, G. Response of Spatio-Temporal Differentiation Characteristics of Habitat Quality to Land Surface Temperature in a Fast Urbanized City. Forests 2021, 12, 1668. [Google Scholar] [CrossRef]
  11. Zhou, X.; Xiao, L.; Lu, X.; Sun, D. Impact of road transportation development on habitat quality in economically developed areas: A case study of Jiangsu Province, China. Growth Chang. 2020, 51, 852–871. [Google Scholar] [CrossRef]
  12. Falcucci, A.; Maiorano, L.; Boitani, L. Changes in land-use/land-cover patterns in Italy and their implications for biodiversity conservation. Landsc. Ecol. 2007, 22, 617–631. [Google Scholar] [CrossRef]
  13. Sala, O.E.; Stuart Chapin, F.I.I.I.; Armesto, J.J.; Berlow, E.; Bloomfield, J.; Dirzo, R.; Huber-Sanwald, E.; Huenneke, L.F.; Jackson, R.B.; Kinzig, A.; et al. Global Biodiversity Scenarios for the Year 2100. Science 2000, 287, 1770–1774. [Google Scholar] [CrossRef] [PubMed]
  14. Egoh, B.; Reyers, B.; Rouget, M.; Bode, M.; Richardson, D.M. Spatial congruence between biodiversity and ecosystem services in South Africa. Biol. Conserv. 2009, 142, 553–562. [Google Scholar] [CrossRef]
  15. Morrison, M.L.; Marcot, B.; Mannan, W. Wildlife-Habitat Relationships: CONCEPTS and Applications; Island Press: Washington, DC, USA, 2012. [Google Scholar]
  16. Horne, B.V. Density as a Misleading Indicator of Habitat Quality. J. Wildl. Manag. 1983, 47, 893–901. [Google Scholar] [CrossRef]
  17. Fellman, J.B.; Eran, H.; William, D.; Sanjay, P.; Meador, J.P. Stream Physical Characteristics Impact Habitat Quality for Pacific Salmon in Two Temperate Coastal Watersheds. PLoS ONE 2015, 10, e0132652. [Google Scholar]
  18. Zhao, Q.; Wu, X. Research on the impact of land use change on habitat quality in Minjiang river basin based on InVEST Model. Ecol. Sci. 2022, 41, 1–10. [Google Scholar]
  19. Homyack, J.A. Evaluating habitat quality of vertebrates using conservation physiology tools. Wildl. Res. 2010, 37, 332–342. [Google Scholar] [CrossRef]
  20. Bazelet, C.S.; Samways, M.J. Identifying grasshopper bioindicators for habitat quality assessment of ecological networks. Ecol. Indic. 2011, 11, 1259–1269. [Google Scholar] [CrossRef]
  21. Lee, J.H.; Kil, J.T.; Jeong, S. Evaluation of physical fish habitat quality enhancement designs in urban streams using a 2D hydrodynamic model. Ecol. Eng. 2010, 36, 1251–1259. [Google Scholar] [CrossRef]
  22. Tolley, K.A.; Raw, R.N.; Altwegg, R.; Measey, J.G. Chameleons on the move: Survival and movement of the Cape dwarf chameleon, Bradypodion pumilum, within a fragmented urban habitat. Afr. Zool. 2010, 45, 99–106. [Google Scholar] [CrossRef]
  23. Bailly, J.; Scheifler, R.; Berthe, S.; Clément-Demange, V.-A.; Leblond, M.; Pasteur, B.; Faivre, B. From eggs to fledging: Negative impact of urban habitat on reproduction in two tit species. J. Ornithol. 2016, 157, 377–392. [Google Scholar] [CrossRef]
  24. Gomes, V.; Ribeiro, R.; Carretero, M.A. Effects of urban habitat fragmentation on common small mammals: Species versus communities. Biodivers. Conserv. 2011, 20, 3577–3590. [Google Scholar] [CrossRef]
  25. Markovchick-Nicholls, L.; Regan, H.M.; Deutschman, D.H.; Widyanata, A.; Martin, B.; Noreke, L.; Ann Hunt, T. Relationships between human disturbance and wildlife land use in urban habitat fragments. Conserv. Biol. 2008, 22, 99–109. [Google Scholar] [CrossRef] [PubMed]
  26. Aznarez, C.; Svenning, J.-C.; Taveira, G.; Baró, F.; Pascual, U. Wildness and habitat quality drive spatial patterns of urban biodiversity. Landsc. Urban Plan. 2022, 228, 104570. [Google Scholar] [CrossRef]
  27. Douglas, I. Urban habitat analysis. In The Routledge Handbook of Urban Ecology; Routledge: Oxfordshire, UK, 2010; pp. 489–501. [Google Scholar]
  28. Zhu, C.; Zhang, X.; Zhou, M.; He, S.; Gan, M.; Yang, L.; Wang, K. Impacts of urbanization and landscape pattern on habitat quality using OLS and GWR models in Hangzhou, China. Ecol. Indic. 2020, 117, 106654. [Google Scholar] [CrossRef]
  29. Jiang, W.; Wu, J. Spatio-temporal evolution of habitat quality in Guangdong-Hong Kong-Macao Greater Bay Area based on regional GDP and population spatial distribution. Acta Ecol. Sin. 2021, 41, 1747–1757. [Google Scholar]
  30. Han, Y.; Mao, Y.; Yang, L.; Wang, J.; Zhou, W. Dynamic responses of habitat quality to LUCC in the Dongting Lake basin. J. Cent. South Univ. For. Technol. 2023, 15, 5074. [Google Scholar]
  31. Zhong, L.; Wang, J. Evaluation on effect of land consolidation on habitat quality based on InVEST model. Trans. Chin. Soc. Agric. Eng. 2017, 33, 250–255. [Google Scholar]
  32. Li, X.; Liu, Z.; Li, S.; Li, Y. Multi-Scenario Simulation Analysis of Land Use Impacts on Habitat Quality in Tianjin Based on the PLUS Model Coupled with the InVEST Model. Sustainability 2022, 14, 6923. [Google Scholar] [CrossRef]
  33. Valero, E.; Álvarez, X.; Picos, J. An assessment of river habitat quality as an indicator of conservation status. A case study in the Northwest of Spain. Ecol. Indic. 2015, 57, 131–138. [Google Scholar]
  34. Johnson, M.D. Measuring habitat quality: A review. Condor 2007, 109, 489–504. [Google Scholar] [CrossRef]
  35. St-Laurent, M.-H.; Boulanger, Y.; Cyr, D.; Manka, F.; Drapeau, P.; Gauthier, S. Lowering the rate of timber harvesting to mitigate impacts of climate change on boreal caribou habitat quality in eastern Canada. Sci. Total Environ. 2022, 838, 156244. [Google Scholar] [CrossRef]
  36. Young, C.H.; Jarvis, P.J. Measuring urban habitat fragmentation: An example from the Black Country, UK. Landsc. Ecol. 2001, 16, 643–658. [Google Scholar] [CrossRef]
  37. Ding, Y.; Yao, Z.; Zhang, Z.; Chen, J.; Teng, L.; Liu, Z. Habitat suitability assessment of Moschus chrysogaster in Helan Mountain. Acta Ecol. Sin. 2023, 43, 1–7. [Google Scholar]
  38. Pan, J.; Ma, Y.; Chen, Y.; Cai, S.; Chen, Y. Biodiversity Assessment of Pudacuo National Park from the Perspective of Coupled Social-ecological System. J. Ecol. Rural Environ. 2022, 38, 609–620. [Google Scholar]
  39. Villa, F.; Ceroni, M.; Bagstad, K.; Johnson, G.; Krivov, S. ARIES (ARtificial Intelligence for Ecosystem Services): A new tool for ecosystem services assessment, planning, and valuation. In Proceedings of the 11th Annual BIOECON Conference on Economic Instruments to Enhance the Conservation and Sustainable Use of Biodiversity, Venice, Italy, 21–22 September 2009. [Google Scholar]
  40. Wang, Z.; Chen, Z.; Hao, C. Breeding Habitat Suitability Evaluation of Red-crown Crane in Zhaolong National Nature Reserve by the Method of Habitat Suitability Index. Wetl. Sci. 2009, 7, 197–201. [Google Scholar]
  41. Qin, B.; Lin, Y.; Zhao, J.; Chen, G.; He, W.; Lü, Q. Identification of Key Areas for the Ecological Restoration of Territorial Space in Kunming Based on the InVEST Model and Circuit Theory. China Environ. Sci. 2023, 43, 809–820. [Google Scholar]
  42. Hou, H.; Dai, E.; Zhang, M. A Review on InVEST Model for the Evaluation of Ecosystem Service Function. J. Cap. Norm. Univ. (Nat. Sci. Ed.) 2018, 39, 62–67. [Google Scholar]
  43. Zhuang, D.; Liu, J. Study on the model of regional differentiation of land use degreein in China. J. Nat. Resour. 1997, 12, 10–16. [Google Scholar]
  44. Sharp, R.; Chaplin-Kramer, R.; Wood, S.; Guerry, A.; Douglass, J. InVEST User’s Guide; The Natural Capital Project: Stanford, CA, USA, 2018. [Google Scholar]
  45. Zhao, B.; Li, S.; Ma, J.; Gao, Z.; Zhang, J.; Cao, X. Evaluation of habitat quality in Jilin Province based on InVEST model. J. Cap. Norm. Univ. (Nat. Sci. Ed.) 2022, 54, 132–141. [Google Scholar]
Figure 1. Location diagram of Chengdu.
Sustainability 15 06271 g001
Figure 2. Distribution of land use in Chengdu from 2000 to 2020.
Sustainability 15 06271 g002
Figure 3. Changes in the area of various regions in Chengdu from 2000 to 2020.
Sustainability 15 06271 g003
Figure 4. Transfer trajectories of the construction land gravity and standard deviational ellipse in Chengdu from 2000 to 2020.
Sustainability 15 06271 g004
Figure 5. Habitat quality distribution of Chengdu from 2000 to 2020.
Sustainability 15 06271 g005
Figure 6. Habitat quality changes in Chengdu from 2000 to 2020.
Sustainability 15 06271 g006
Figure 7. Land use intensity distribution in Chengdu from 2000 to 2020.
Sustainability 15 06271 g007
Figure 8. Moran scatter plot of land use intensity and habitat quality in Chengdu.
Sustainability 15 06271 g008
Figure 9. LISA cluster diagram of land use intensity and habitat quality in Chengdu.
Sustainability 15 06271 g009
Figure 10. Space controlled zoning in Chengdu.
Sustainability 15 06271 g010
Table 1. The classification values of land use degree.
Land Use TypeGlacier and Permanent Snow LandWoodland, Grassland, Water, WetlandCultivated LandConstruction Land
Grading index1234
Table 2. Threat factors and their stress intensity.
Stress ParametersMaximum Influence Distance/kmWeightWay of Decline
Cultivated land30.5Linear
Construction land100.9Exponential
Road20.2Linear
Table 3. Sensitivity parameters of land use types to threat factors.
CodeLand TypeSuitabilityThreat Factors
Cultivated LandConstruction LandRoad
10Cultivated land0.50.30.70.3
20Woodland10.60.40.7
30Grassland0.80.50.60.2
50Wetland10.650.80.5
60Water0.90.60.90.65
80Construction land0000
100Glaciers and permanent snow1111
Table 4. Land use transfer matrix for Chengdu, 2000–2020.
Time PeriodLand TypeGrasslandCultivated LandConstruction LandWoodlandWetlandWater
2000–2010Grassland430.9448.7639.27341.92.9428.57
Cultivated land23.919311.52240.4136.820.4616.06
Construction land1.6481.73491.390.860.122.82
Woodland61.9426.521.252951.6201.41
Wetland15.4215.10.80.533.433.9
Water8.3533.222.852.320.93105.15
2010–2020Grassland351.8346.2930.1777.9618.8216.78
Cultivated land69.48227.581064.980.493.1369.27
Construction land7.3120.04744.940.750.122.81
Woodland75.3183.5117.123153.280.183.46
Wetland0.032.750.2202.412.49
Water2.7619.849.452.193.1120.52
Table 5. Area percentage of each grade of habitat quality in Chengdu.
Habitat Quality LevelPercentage of Area (%)
200020102020
Worst4.045.4113.02
Poor23.7126.4737.17
Medium49.9444.0125.82
Better1.131.251.51
Best21.1722.8522.48
Table 6. Area percentage of each Region types in Chengdu.
Region TypePercentage of Area (%)
200020102020
Low intensity–worst0.090.110.14
Low intensity–best15.8115.4815.44
Low intensity–better3.333.473.41
Low intensity–medium0.930.620.72
Medium-low intensity–better1.021.121.14
Lower intensity–medium8.368.317.95
Medium intensity–medium13.3313.1812.27
Medium intensity–poor0.0100.08
Medium-high intensity–poor25.4723.8032.82
Medium-high intensity–medium28.6929.0114.29
High intensity–worst1.003.017.38
High intensity–poor1.971.904.37
Table 7. Zooning standard of space controlled zoning based on “land use intensity–habitat quality”.
Region Type“Land Use Intensity—Habitat Quality Grade”
Habitat protection areaLow intensity–Best, low intensity–Better; medium-low intensity–best; medium-low intensity–Better.
Habitat restoration areaLow intensity–poor; high intensity–worst; high intensity–poor; medium-high intensity–poor
Moderate development areaMedium-low intensity–medium; medium-high intensity–medium; medium intensity–medium; medium intensity–better
Disclaimer/Publisher’s Note: The statements, opinions and data contained in all publications are solely those of the individual author(s) and contributor(s) and not of MDPI and/or the editor(s). MDPI and/or the editor(s) disclaim responsibility for any injury to people or property resulting from any ideas, methods, instructions or products referred to in the content.