Article

Preventative Biofouling Monitoring Technique for Sustainable Shipping

Department of Marine Engineering, National Taiwan Ocean University, Keelung 20224, Taiwan
*
Author to whom correspondence should be addressed.
Sustainability 2023, 15(7), 6260; https://doi.org/10.3390/su15076260
Submission received: 22 February 2023 / Revised: 25 March 2023 / Accepted: 3 April 2023 / Published: 6 April 2023

Abstract

:
Monitoring and evaluating the biofouling status of a ship’s hull and its effects on the vessel’s performance attracts the attention of both researchers and industry. In this study, two types of monitoring equipment were used to observe organism growth on two fishing vessels for approximately six months. Combining underwater photography technology with periodic cleaning methods can effectively prevent the occurrence of problems including hull biofouling. The monitoring system developed in this study is cheap and easy to operate, and can be stored on board and regularly operated by the crew to eliminate various issues below the waterline, which in turn enhances sustainable shipping.

1. Introduction

1.1. Preventing Biofouling on Ships

Biofouling on ships can significantly increase friction loss during navigation, which in turn increases fuel consumption, causing economic losses and environmental damage [1,2]. As the ship sails, various marine organisms gradually attach themselves to the surface of the ship’s propeller, hull, and rudder. When certain conditions are met, they begin to multiply, forming a large biofouling system and increasing the roughness of the surface [3]. Action to minimize biofouling is best taken when a biofilm forms on the hull. Compared with various well-developed antifouling approaches, cleaning at an early stage is easier and does not harm the hull surface. However, the condition of the immersed hull surface cannot be easily observed, and the seriousness of biofouling is usually ignored until dry docking [4].
There are more than 4000 fouling organisms in the world’s oceans, ranging from microorganisms such as bacteria, diatoms, and algal spores to large fouling organisms such as barnacles, tubeworms, bryozoans, mussels, and algae [4]. Biofouling begins with a biofilm containing microorganisms and continues to develop into a diverse biofouling community under the right environmental conditions [5].
Krapp and Vranakis (2013) compared the power output of 32 ships and found that the output after 60 months was 36% higher than the output immediately after dry docking [6]. Farkas et al. studied a 13,000 TEU container ship and found its resistance increased by approximately 9.2% over 1.5 years [7]. Under some sailing conditions, severe macrofouling can raise the required propulsion power by 86% [8]. Based upon the results of a study regarding container ships, a 93% increase in ship drag was observed due to barnacle fouling [9].
Another study found that biofilm caused a 36.3% increase in propulsion power [10]. Over time, hull and propeller performance deteriorates, mainly due to biofouling and mechanical damage [10], resulting in reduced speed and maneuverability. This requires more propulsion power to operate the vessel, increasing fuel consumption and greenhouse gas emissions [11,12,13].
The issue of atmospheric emissions from ships has long been a concern of the International Maritime Organization (IMO). Various technologies and strategies that have been developed can effectively improve energy efficiency and reduce emissions, and in turn contribute to the global fight against climate change [4]. The various strategies for reducing emissions from marine shipping can be categorized into technical, operational, and market mechanisms [4]. The technical strategies mostly reduce the energy consumption of ships using various possible designs [5]. In terms of operational strategies, one set of systems aims to improve the efficiency of the ship’s propulsion system, while the other seeks to reduce frictional loss due to resistance [6]. The reduction of resistance can be achieved by optimizing the main dimensions of the ship and minimizing the roughness of the hull [6].

1.2. Other Issues Regarding Biofouling

Vessel biofouling is recognized as the main pathway for the introduction of foreign marine species. According to BBC News on 2 January 2023, the Viking Orion cruise ship was denied permission to dock in Adelaide, Australia, after the authorities discovered biofouling on its hull [14]. The Ministry for Primary Industries, New Zealand, completed a risk analysis indicating that biofouling species were likely to impact on environmental, economic, and societal values. To prevent the entry of biofouling in the first instance, New Zealand requires vessels entering the country to have a ‘clean hull’ [15].
Ships have been recognized as the major actor of global non-indigenous species dispersal [9] through pathways, e.g., ballast water to new ecosystems [10]. If the continued transfer of invasive species is left unrestricted, it will lead to catastrophic environmental damage [8]. Many studies have shown that invasive species can be transferred from one region to another by attaching them to the hulls of ships engaged in global trade [6,7,8]. In addition, antifouling paint renewal during dry docking can also cause environmental problems. The waste discharged into water and air includes blasting residue and dust containing various pollutants [16].
There are various types of antifouling technologies, based mainly on mechanical, physical, and chemical principles. Biofouling can be mitigated by repainting during dry-docking [16]. High-pressure abrasives are applied to remove the biofouling, followed by painting [16,17]. Underwater cleaning has been used to treat ship surfaces during mooring [18,19,20]. However, a number of countries and regions prohibit the procedure in their jurisdictional waters [21,22]. More recently, an en route hydro-blasting method was designed to interrupt the development of a fouling system before an excessive biofilm buildup [23].
Organic tin paints have been applied as an effective approach for decades [24,25]. Although effective, there are concerns regarding the release of active compounds into the environment [20,26]. Eelectrochemical technologies have also been used to inhibit biofilm colonization [27]. Additionally, self-polishing coatings are characterized by a high release rate followed by a constant rate [26,27,28].

1.3. Preventing Biofouling by Monitoring

Underwater monitoring is considered as an indispensable technology to determine the location, composition, and growth of biofilm, to allow the carrying out of simple cleaning in a timely manner [29]. In line with the issues raised in the foregoing discussion, this enables the hull to be cleaned immediately when the biofilm forms to effectively prevent biofouling.
Biological parameters such as adenosine triphosphate content indicate the most important energy-transferring component of all living cells [30]. Assimilable organic carbon, which promotes microbial growth and biofilm formation rate [31], is used to assess the ability to cause biofouling. However, these parameters are not suitable for the immediate observation of biofouling, as they cannot be directly assessed without sampling [32]. Ultrasonic time domain reflectometry has been used to monitor early biofilms that develop on polymer surfaces [29,30]. Membrane fouling simulator devices can be integrated with other precision monitoring equipment [32]. Although various monitoring biofouling techniques can provide useful information in the early stages of biofilm formation, to date their potential in developing and optimizing effective antifouling strategies for ship operators is limited [33].
In improving the effectiveness of underwater assessment of ships’ hulls and solving the problem of biofouling, underwater robot technology has an application value [32,33]. Unmanned underwater vehicles are subdivided into remotely operated vehicles (ROVs) [32], autonomous underwater vehicles (AUVs) [33], and towed vehicles [34]. With the development of electronic and computer technology, AUVs have gradually replaced ROVs as the mainstream of underwater robot technology [32]. However, the reliability and stability of AUV technology still needs to be tested [33], and its costs are much higher than those of ordinary ROVs in terms of technology or vehicle acquisition [34].

1.4. Objective of Study

The overall objective of this study is to observe the growth of hull organisms through monitoring methods, so as to use them as a basis for selecting the most appropriate anti-fouling countermeasures. Specifically, this study aims to identify the most suitable conditions for observing hull organisms. These conditions include available equipment, relevant parameters, timing and frequency, and a complete set of standard systems. Through this study, we aim to ensure that accurate monitoring of the biological development situation can be combined with hull-cleaning technology to help improve energy efficiency and reduce emissions from ships effectively.

2. Methods and Procedure

This study aims to establish a feasible technical procedure for the underwater photography of biofouling on ships’ hulls. The biofouling images and measuring data of fishing vessels were obtained in the Shenao Fishing Harbor in New Taipei, Taiwan. Two professional underwater cameras with different specifications were used to obtain underwater images at different shooting distances. We conducted three experiments in fishing harbors between November 2021 and April 2022. We conducted an image comparison to analyze the resolution under various shooting parameters and distances. The results obtained were then used to monitor the hull biofouling of two fishing vessels in the port. The images of hull biofouling before and after hull cleaning were analyzed and compared.

2.1. Experiment System

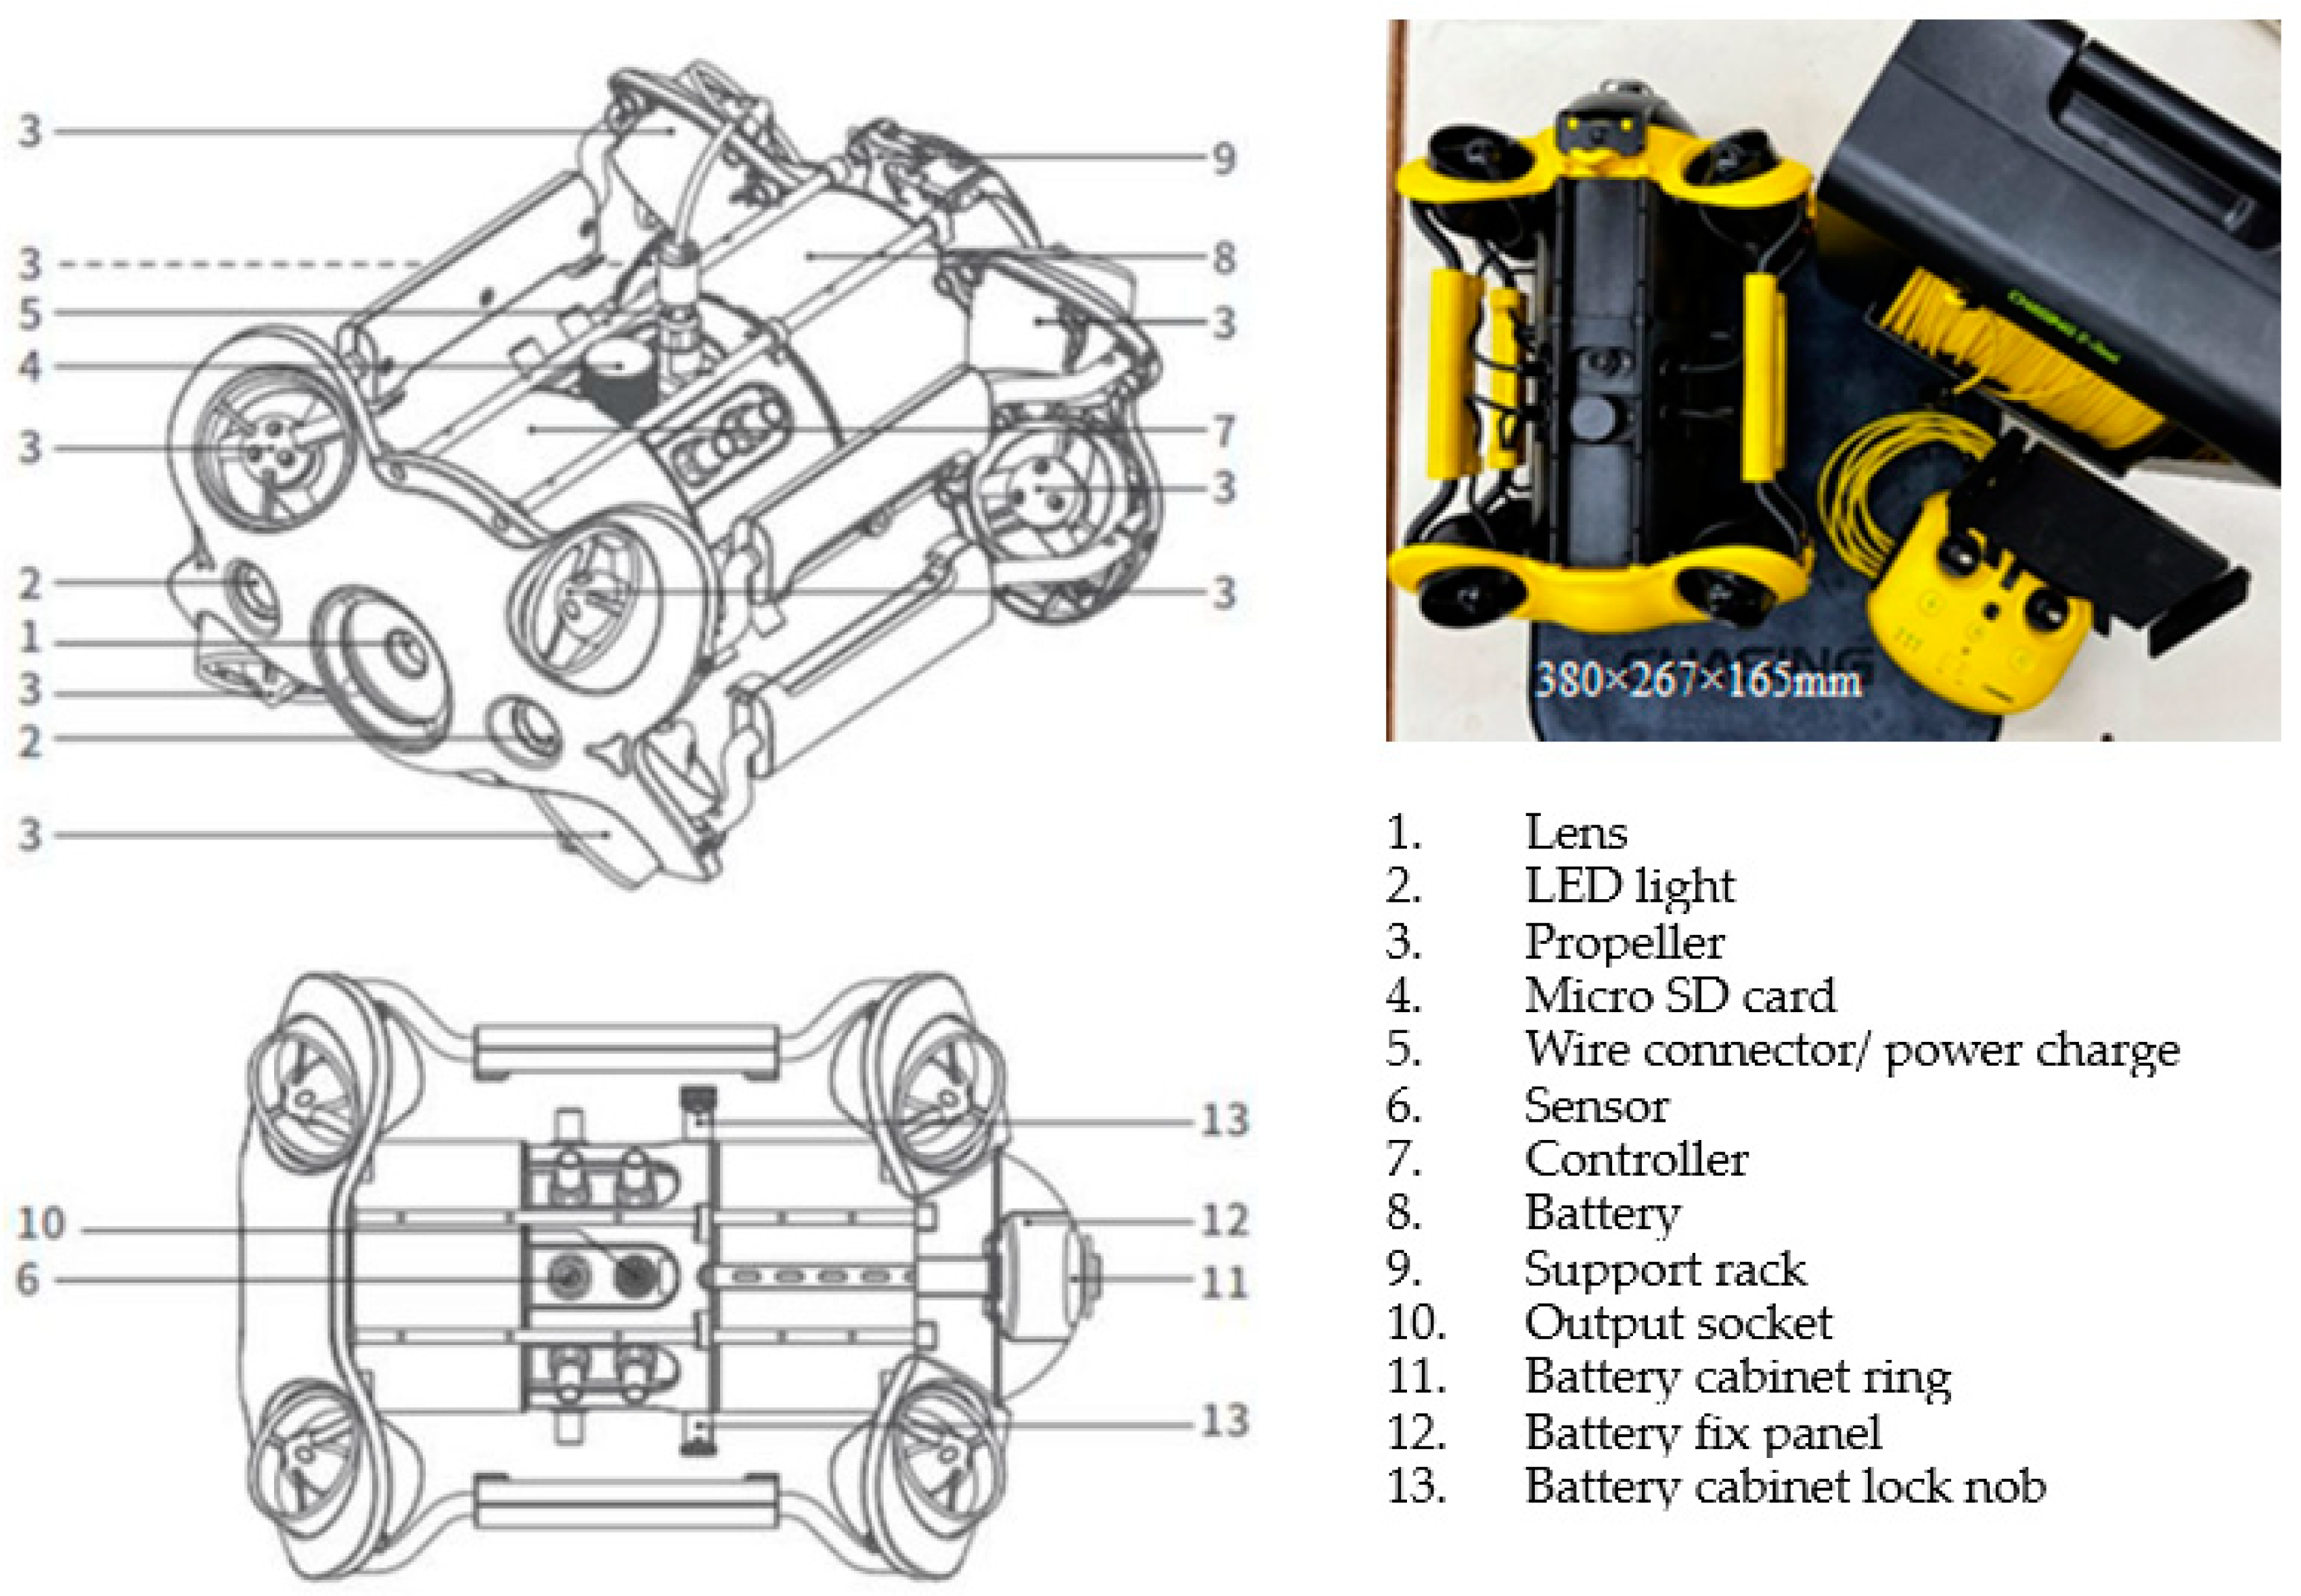
The equipment used for the experiment in this study included two camera robots, Chasing Dory (as shown in Figure 1) and Chasing M2 (as shown in Figure 2), to capture underwater images, and a digital lux meter to observe illuminance. Table 1 shows the specification of the equipment.

2.1.1. Chasing Dory

Chasing Dory is a small underwater drone with five thrusters for real-time observation, exploration, photography, and video capture. The drone can move vertically up and down, tilt ±45°, and dive up to 50 m, and is equipped with high-resolution photography lenses. Due to its small size, it can be carried in a backpack with a Wi-Fi buoy and a strap. The internal 4800 mAh battery allows up to approximately one hour of exploration with a full charge. It can be controlled by a smartphone or a standalone remote controller.

2.1.2. Chasing M2

Chasing M2 (Figure 2) adopts an 8-thruster full-vector layout, and has 360-degree all-round movement. The maximum speed is 3 knots, the maximum depth is 100 m, and the maximum radius is 200 m. It has a built-in 4K/12-megapixel EIS shockproof camera, 4000 lumens LED light, removable/replaceable battery, pluggable Micro SD memory card, aluminum alloy body (weighing less than 4.5 kg), and optional motorized winder.

2.1.3. Observation Illuminance

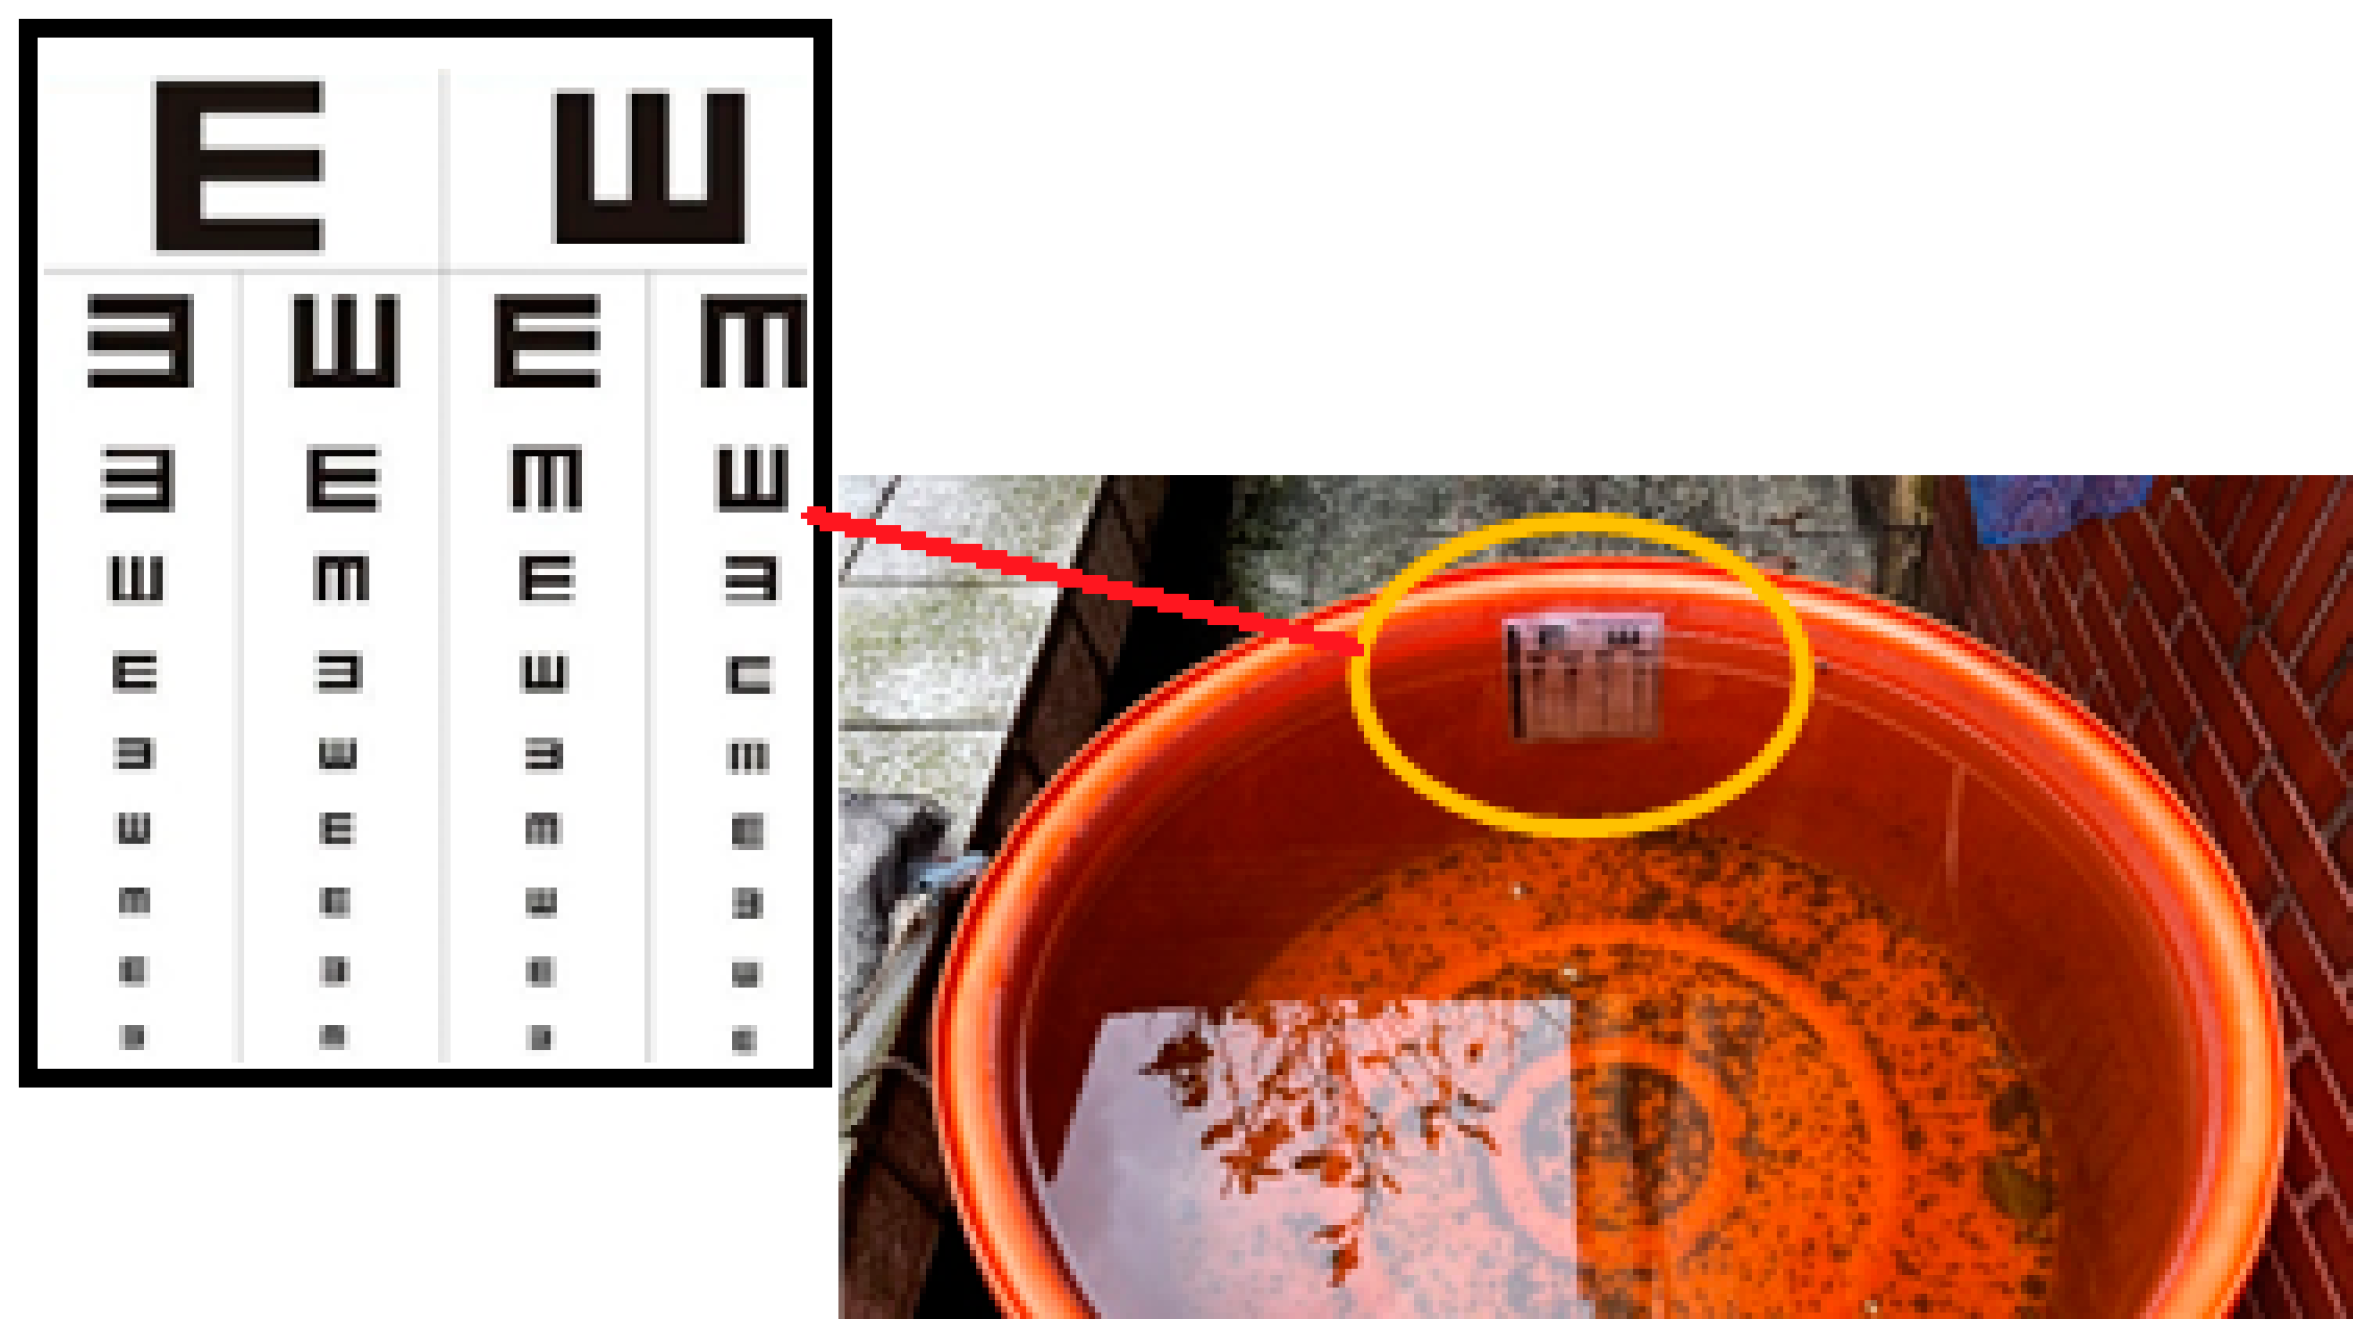
To maintain illuminance as consistently as possible during monitoring in the field, we established the relationship between water depth and illuminance in the laboratory. A digital lux meter (KONQOR Lux II) was used to measure illuminance as a function of water depth. Table 2 lists the specifications of the lux meter. We took images of an eye chart attached underwater, as shown in Figure 3, with two underwater cameras in optimal daylight conditions, tested at five different distance ranges.
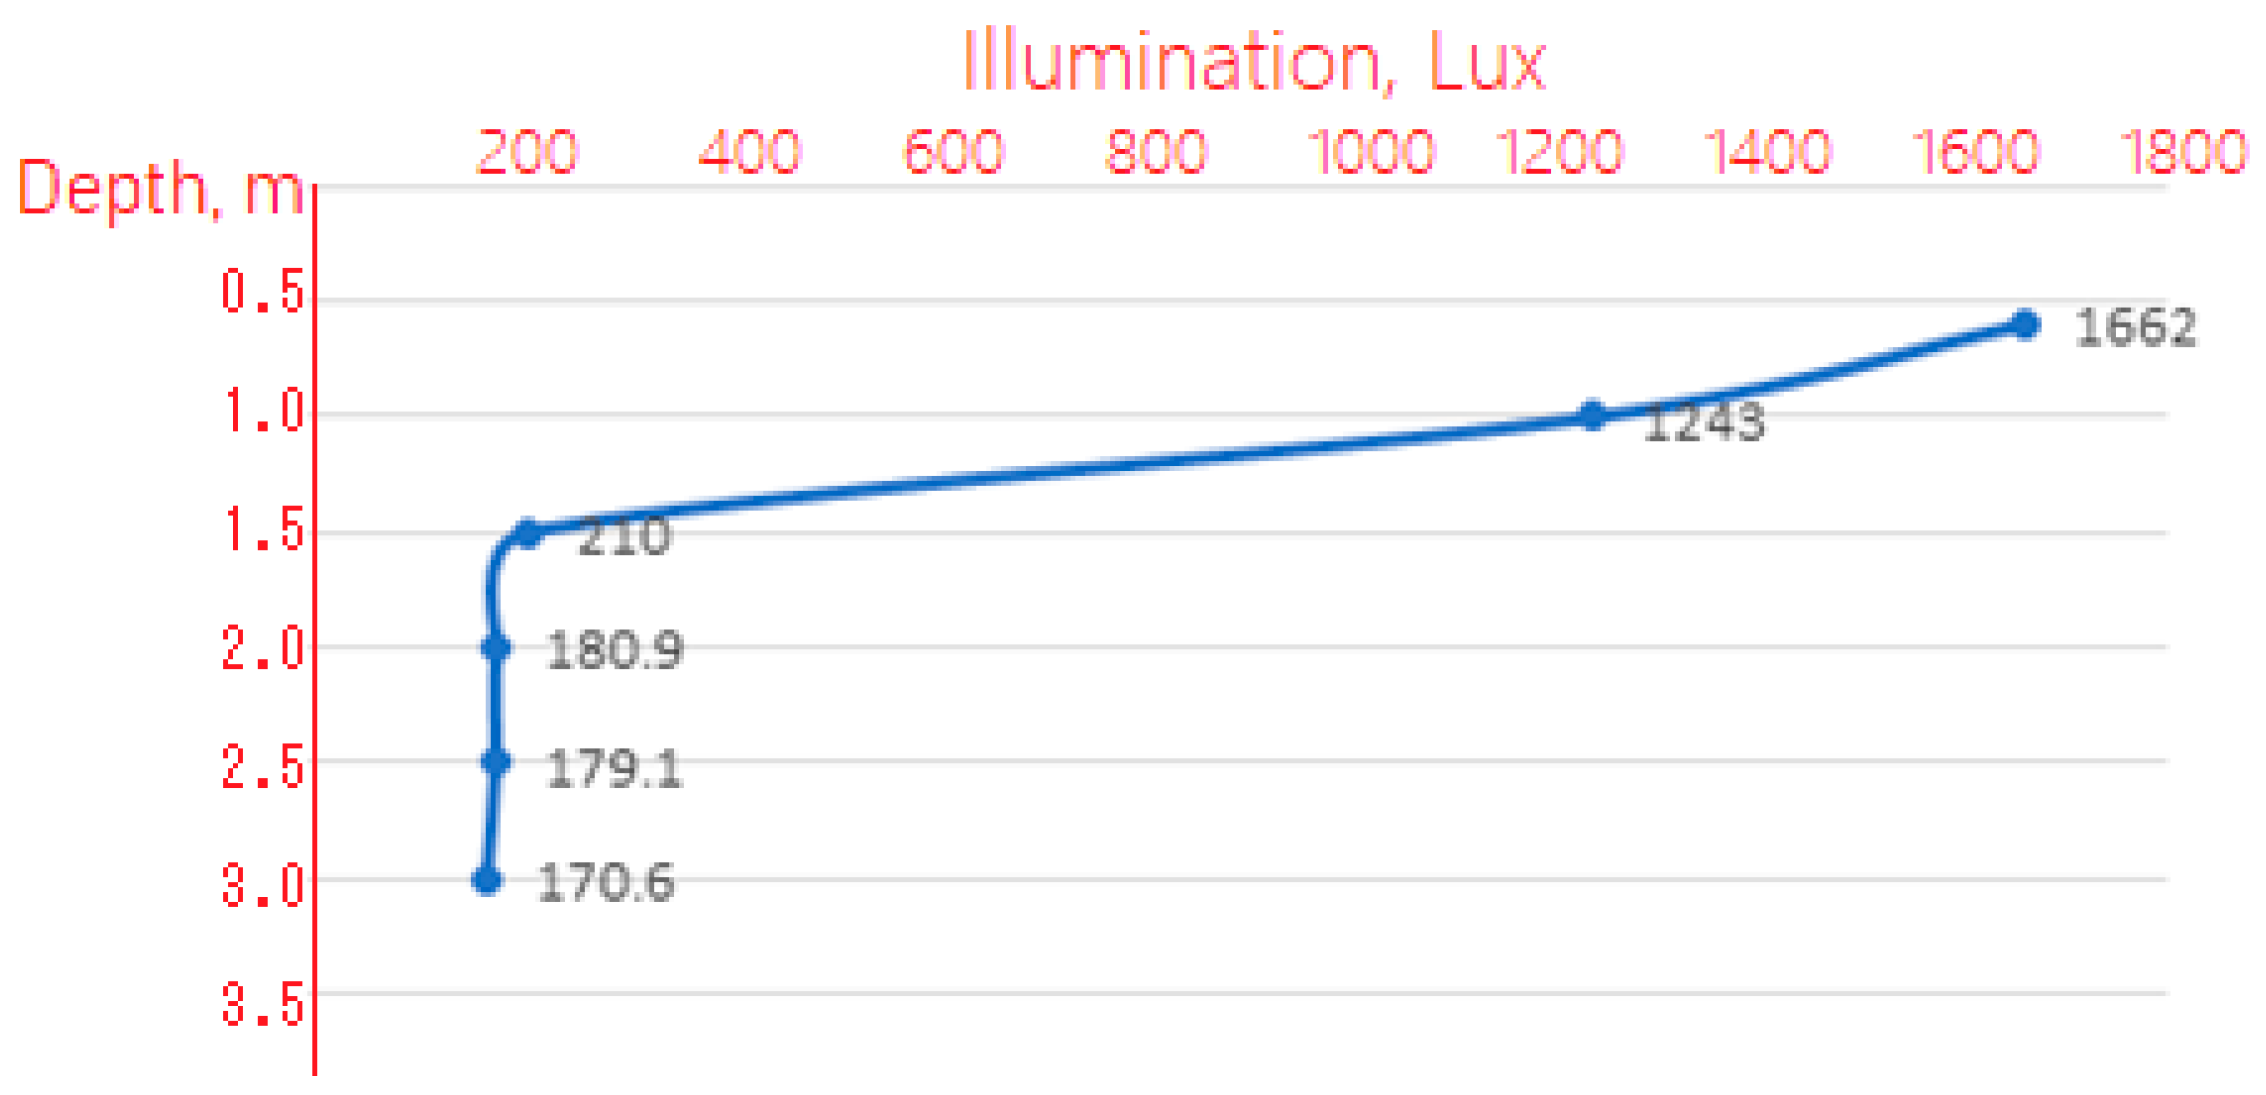
We established the relationship between illuminance and water depth of 0.6 M, 1 M, 1.5 M, 2 M, 2.5 M and 3 M. When taking images at different water depths, we adjusted artificial lights in a timely manner so that the observation and analysis of the final image was not affected by the ambient light conditions.

2.2. Study Fishing Harbor and Fishing Vessels

2.2.1. Shenao Harbor

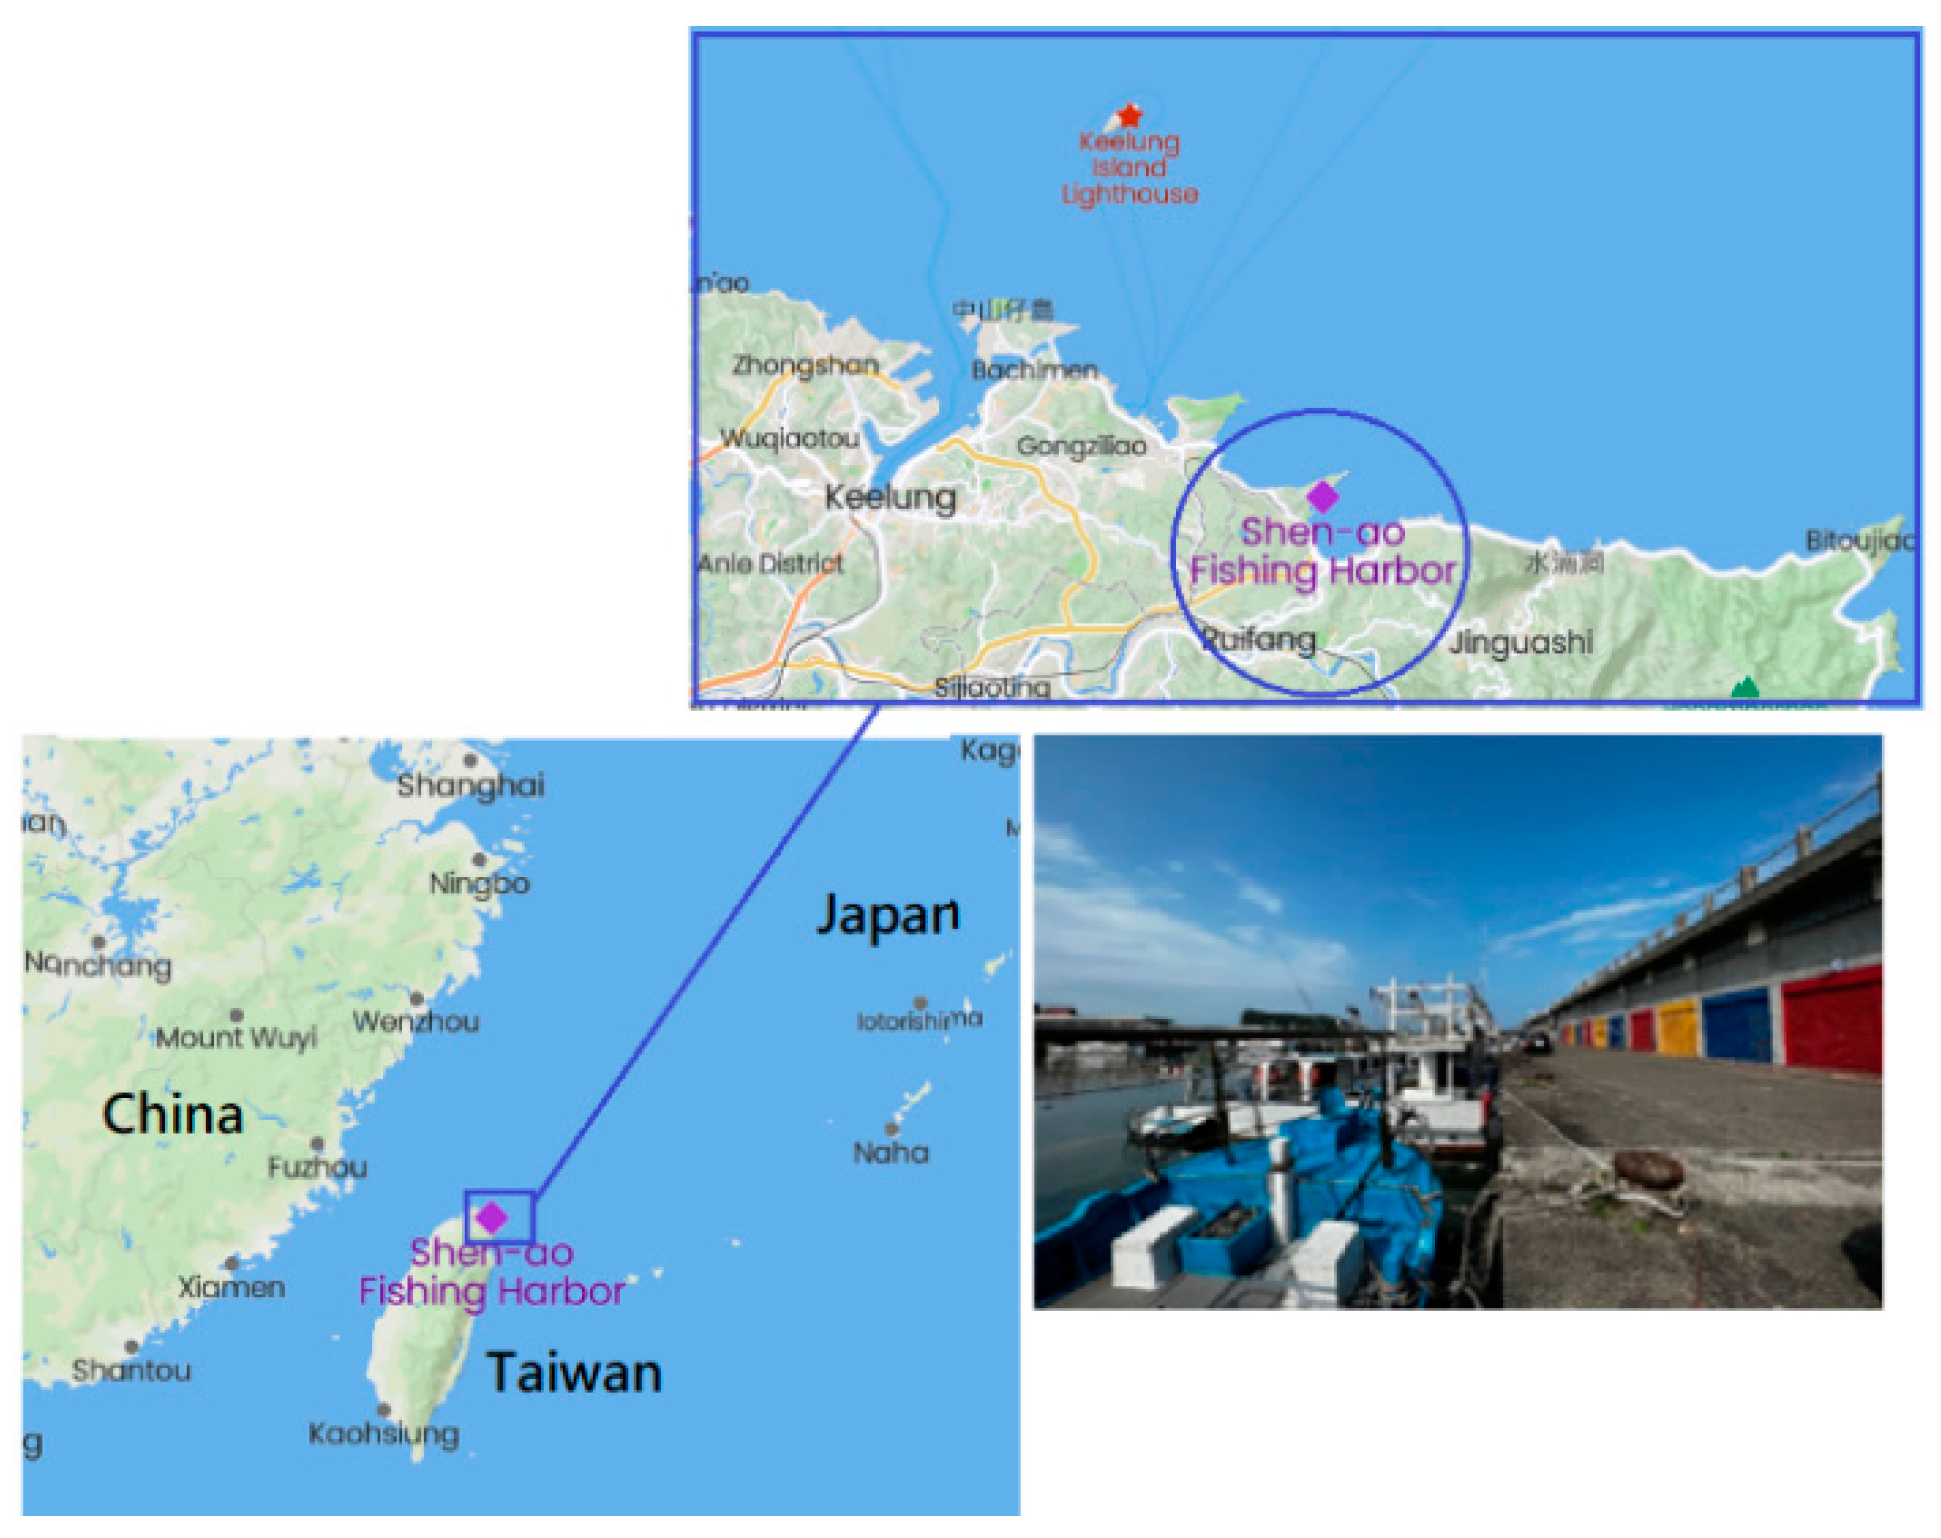
The mooring locations of the fishing vessels monitored in this study are shown in Figure 4. The vessels do not have a specific location; all are moored within a fixed range.

2.2.2. Monitoring Vessels

This study monitored two fishing vessels. The first vessel under test was a commercial fishing vessel with a total tonnage of 9.96 tons, a total length of 14.73 m, and a full draft of 1.2 m. The second tested vessel was a recreational fishing vessel with a total tonnage of 8.29 tons, a total length of 11.98 m, and a maximum speed of 10 knots. Other specifications of the vessels are shown in Table 3.
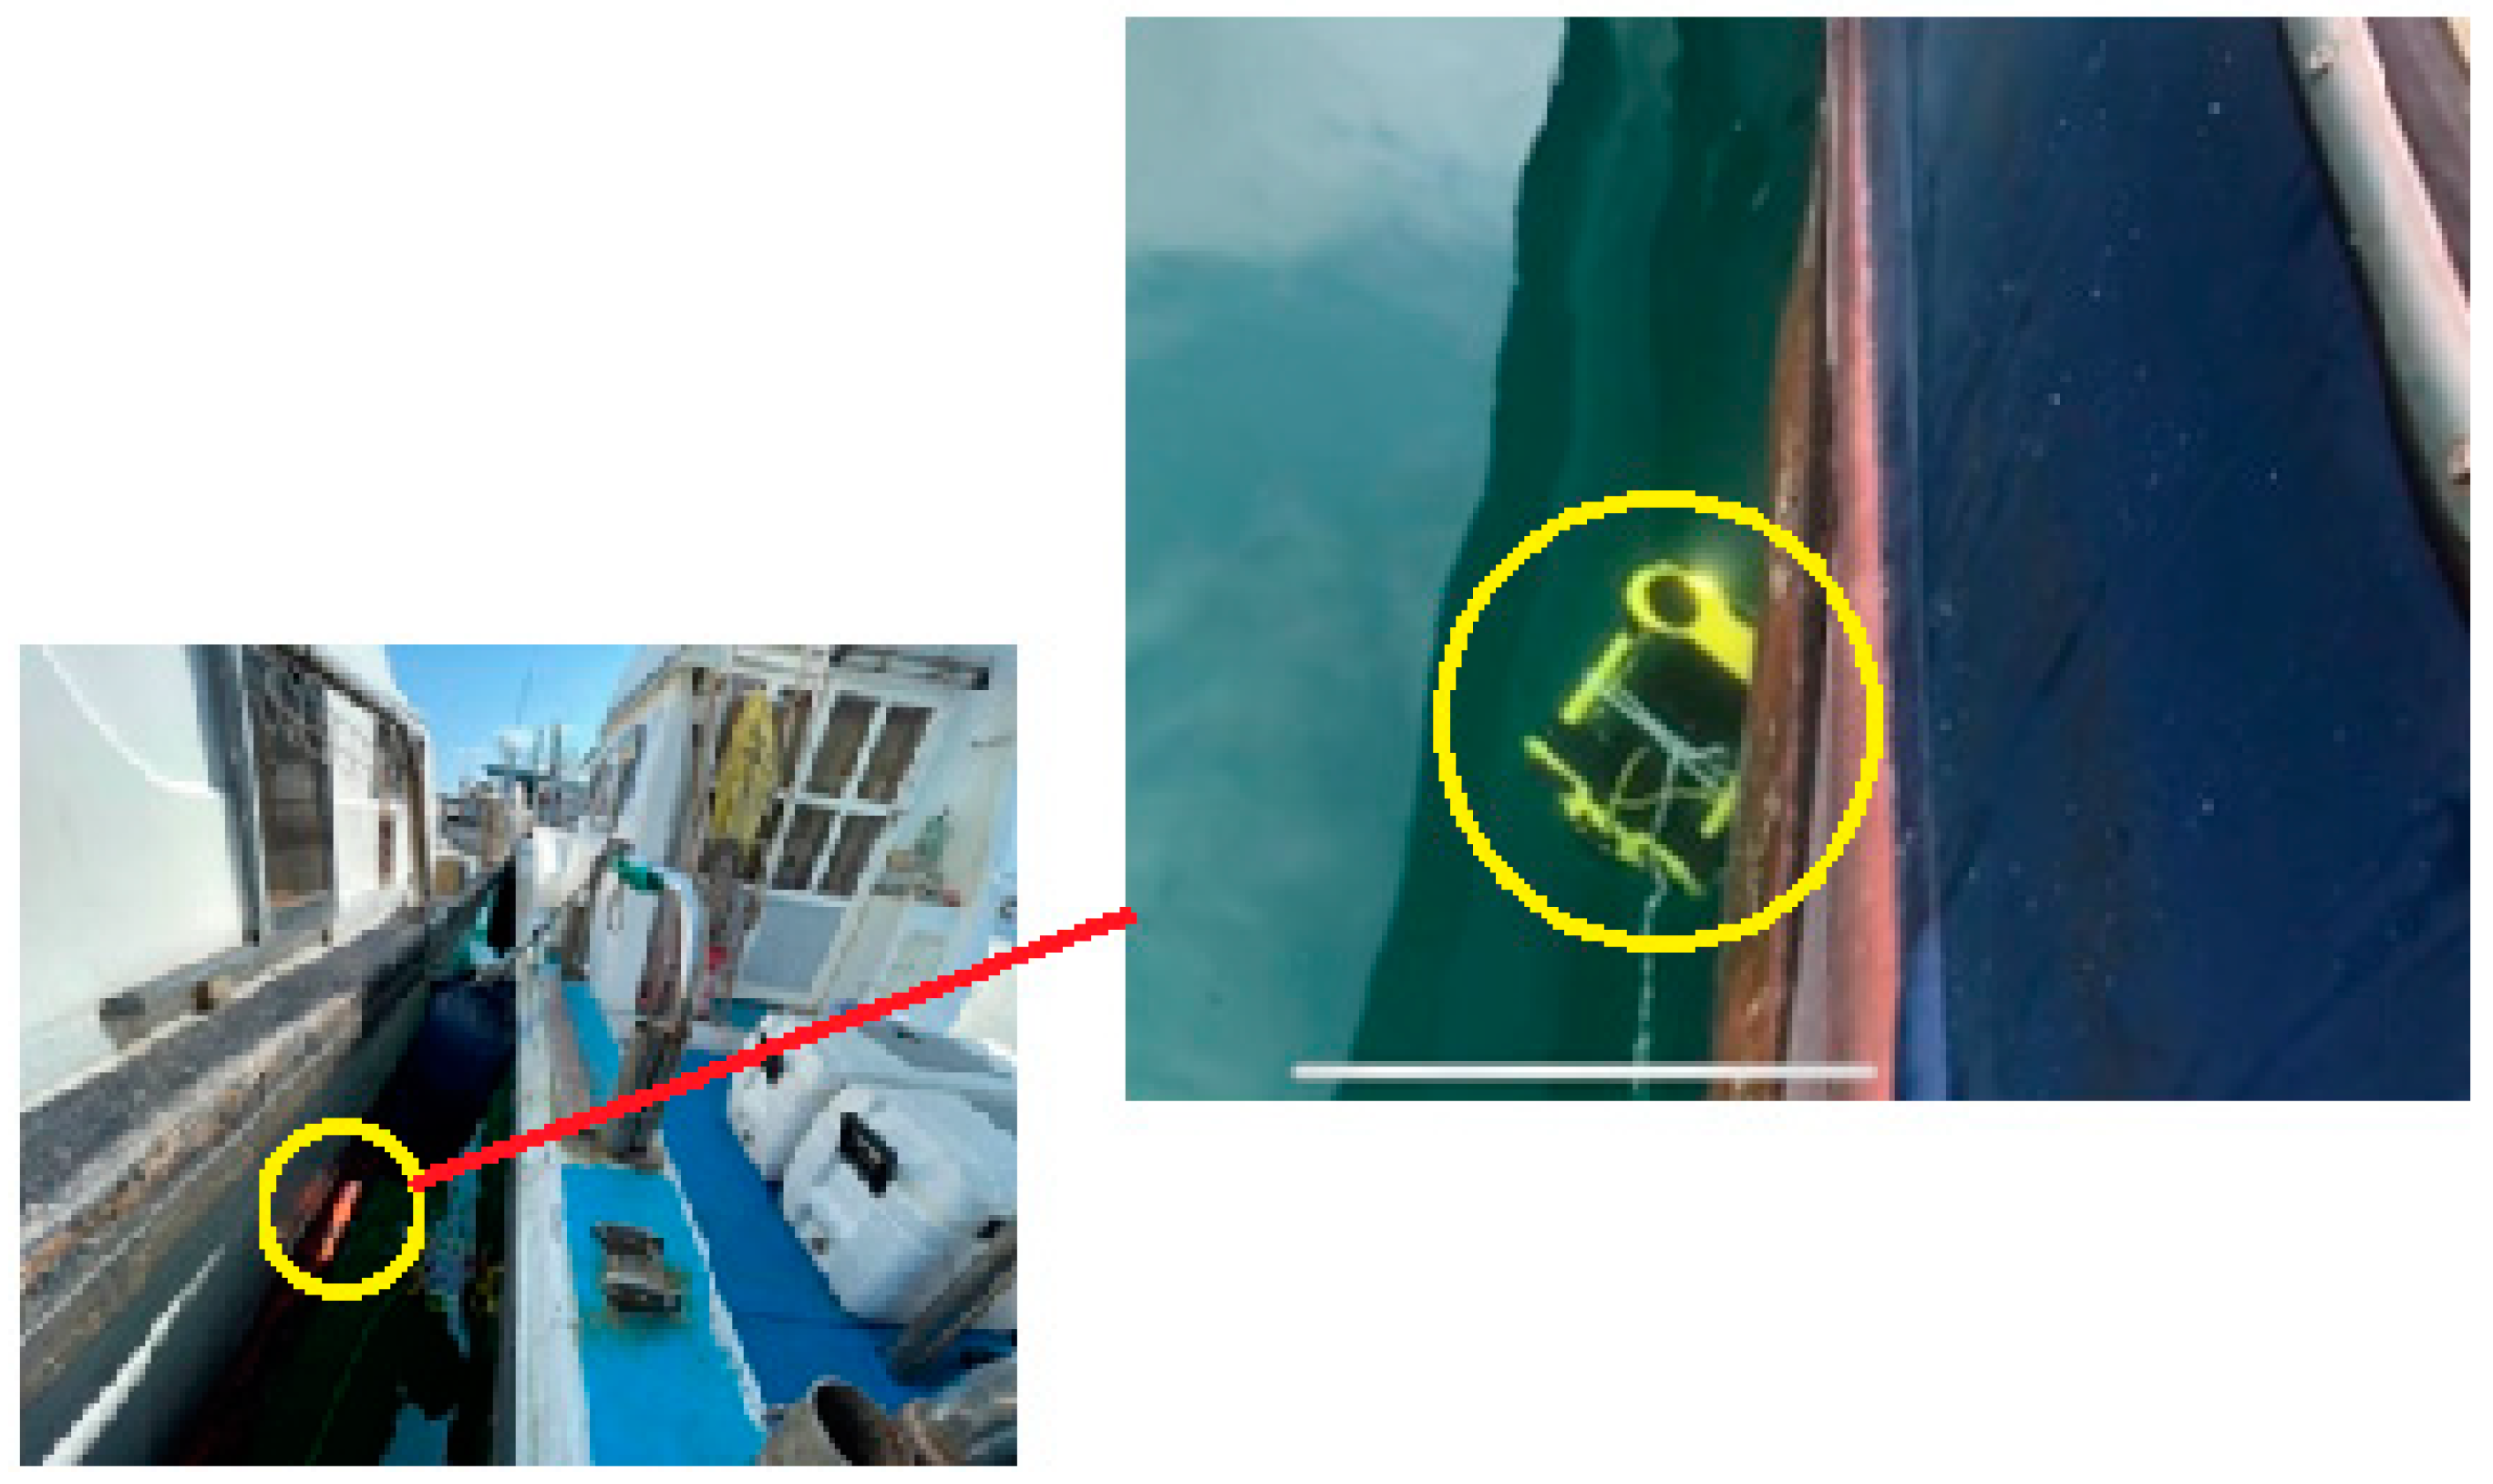
During the monitoring study, even if the current in the fishing port was low, we conducted the experiments without affecting other fishing boats. Figure 5 shows an underwater robot ready to take images in the water, along the port side of the hull.

3. Results

3.1. Optimal Distance Measurement

Table 4 shows the experimental images of Chasing Dory and Chasing M2. The resolution of the two underwater cameras is compared based on the image data. According to the five distance images, it was observed that the image resolution of the M2 model was significantly clearer than that of the Dory model. It presents better images for observing the biofouling of the ship’s hull underwater, which facilitates the monitoring. This indicates that the M2 model was superior to the Chasing Dory model in terms of image resolution.
Based on the results, we decided to use the image data from the M2 model as the basis for analyzing the most suitable observation distance for the next experiment. Experimental data from the M2 model shows that, at 10 cm, the distance between the lens and the observation paper is too close, resulting in confinement and blurring of the image. When we increased the distances to 30, 40, and 50 cm, the difficulty of observation increased. At 20 cm, the lens and the observation paper were in focus, the minimum pattern size was moderate, and the content of the picture could also be clearly observed. We thus decided to use 20 cm as the optimal distance for observing underwater biological fouling.

3.2. Comparison of Monitoring Functions

There are two major functional requirements when using an underwater camera in a marine environment with variable weather and currents to observe biofouling effectively. The first is to be able to adjust to any angle underwater flexibly, and the second is to be able to operate it easily, without having to spend extra time on professional courses.
In terms of lenses, according to the lens specifications of the two models, the lens set of the M2 model is more advanced than that of the Dory model, and the pictures taken underwater are clearer. As for the weight, both models weigh no more than 5 kg, and the Dory model weighs only 1.1 kg, making it much easier to carry out periodic inspections. In terms of control, the Dory model can move only along the Y and Z axes, compared with the M2 model, which can conduct observations over a wider range of movement.
Various factors may degrade the quality of monitoring. For example, if there is debris on the surface of the harbor water, this results in lower illumination in deeper water. In addition, since the refractive properties of water change with salinity, temperature, and so on, the transmittance becomes very low when various discharges from shore are mixed with harbor water, resulting in stratification (thermocline) and a decrease in light transmission.

3.3. Optimal Shooting Parameters

3.3.1. Relationship between Illuminance and Depth

Figure 6 shows the relationship between illuminance in Lux and water depth in meters we established in the laboratory. The water temperature was 19.6 ± 0.2 °C during the experiment. Based on the results of the study, we found that at an underwater boundary of 1.5 m, there were obvious illuminance changes. We speculate that the suspended particles in the water and the thermocline are the major factors affecting underwater illumination.

3.3.2. Underwater Image

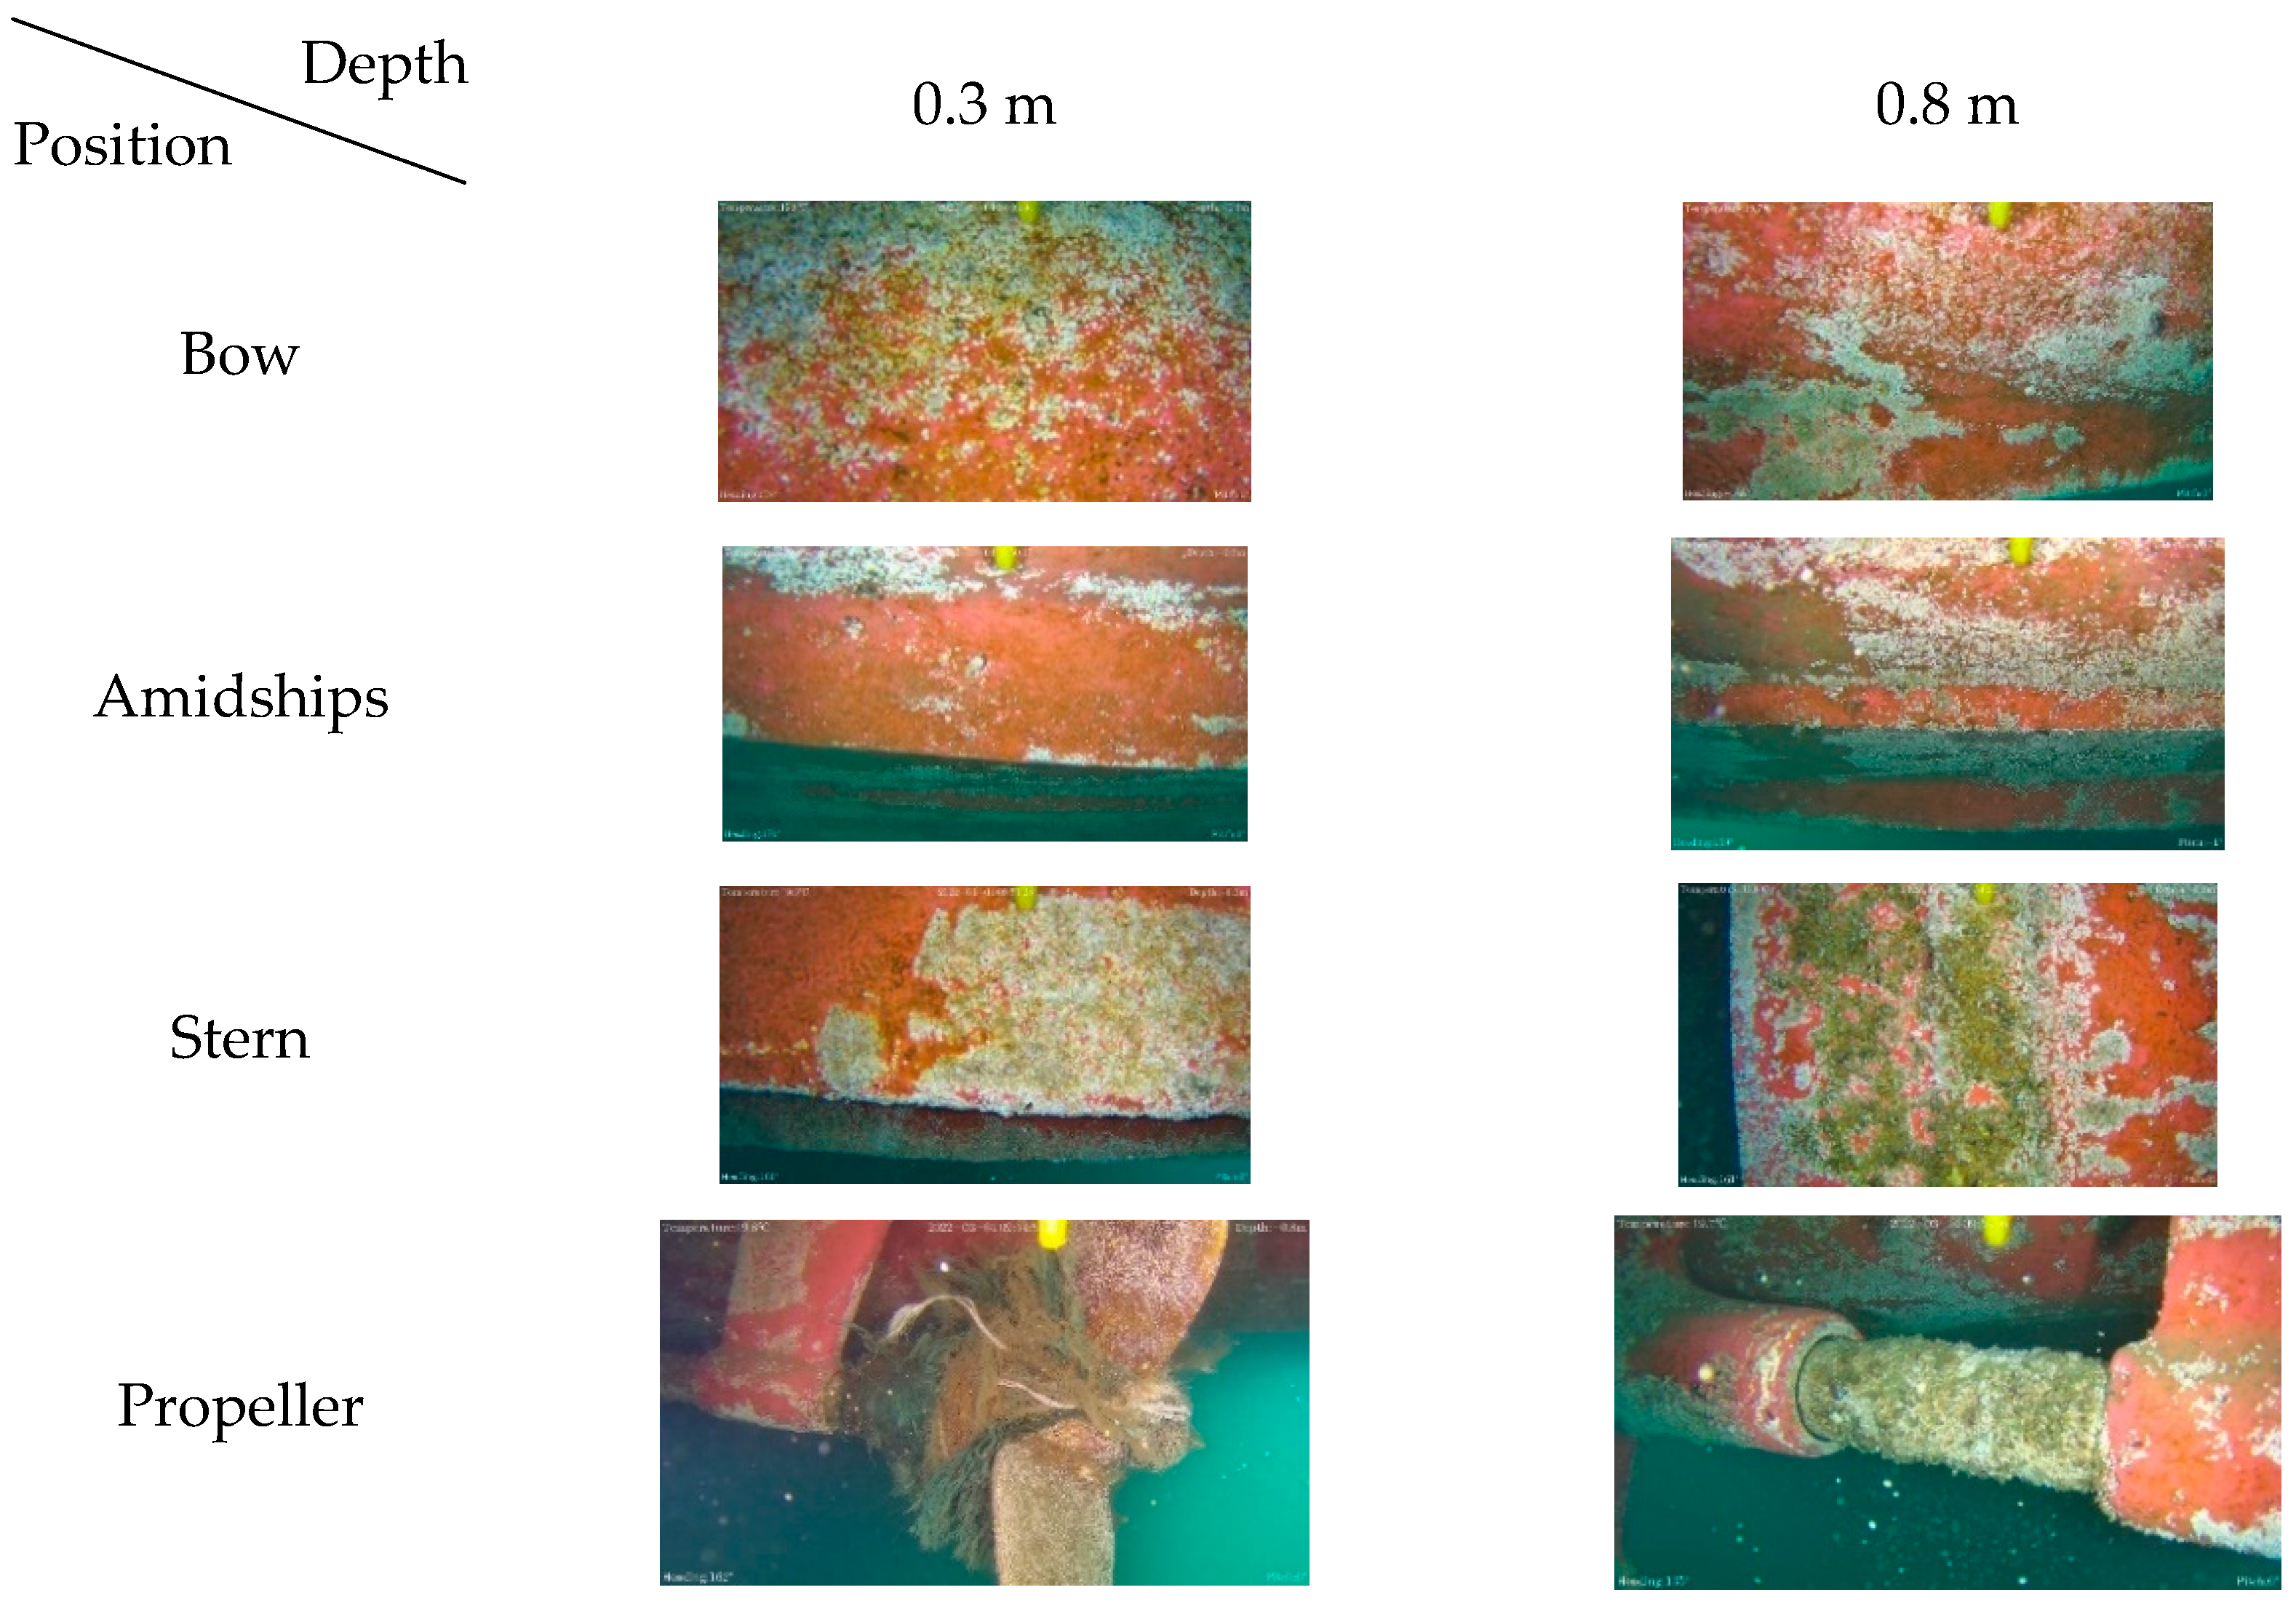
In this study, the fishing vessels under test were monitored on the port side (bow, amidships, stern, and thruster), at the optimal observation distance, i.e., 20 cm from the lens to the hull. Figure 7 shows the growth of underwater biofouling on the hull of Vessel #1. Fishing nets strangling the propeller are observed in the image. The issue can lead to a significant reduction in the propulsion output of the vessel, and an increase in fuel consumption.

3.3.3. Before and after Cleaning

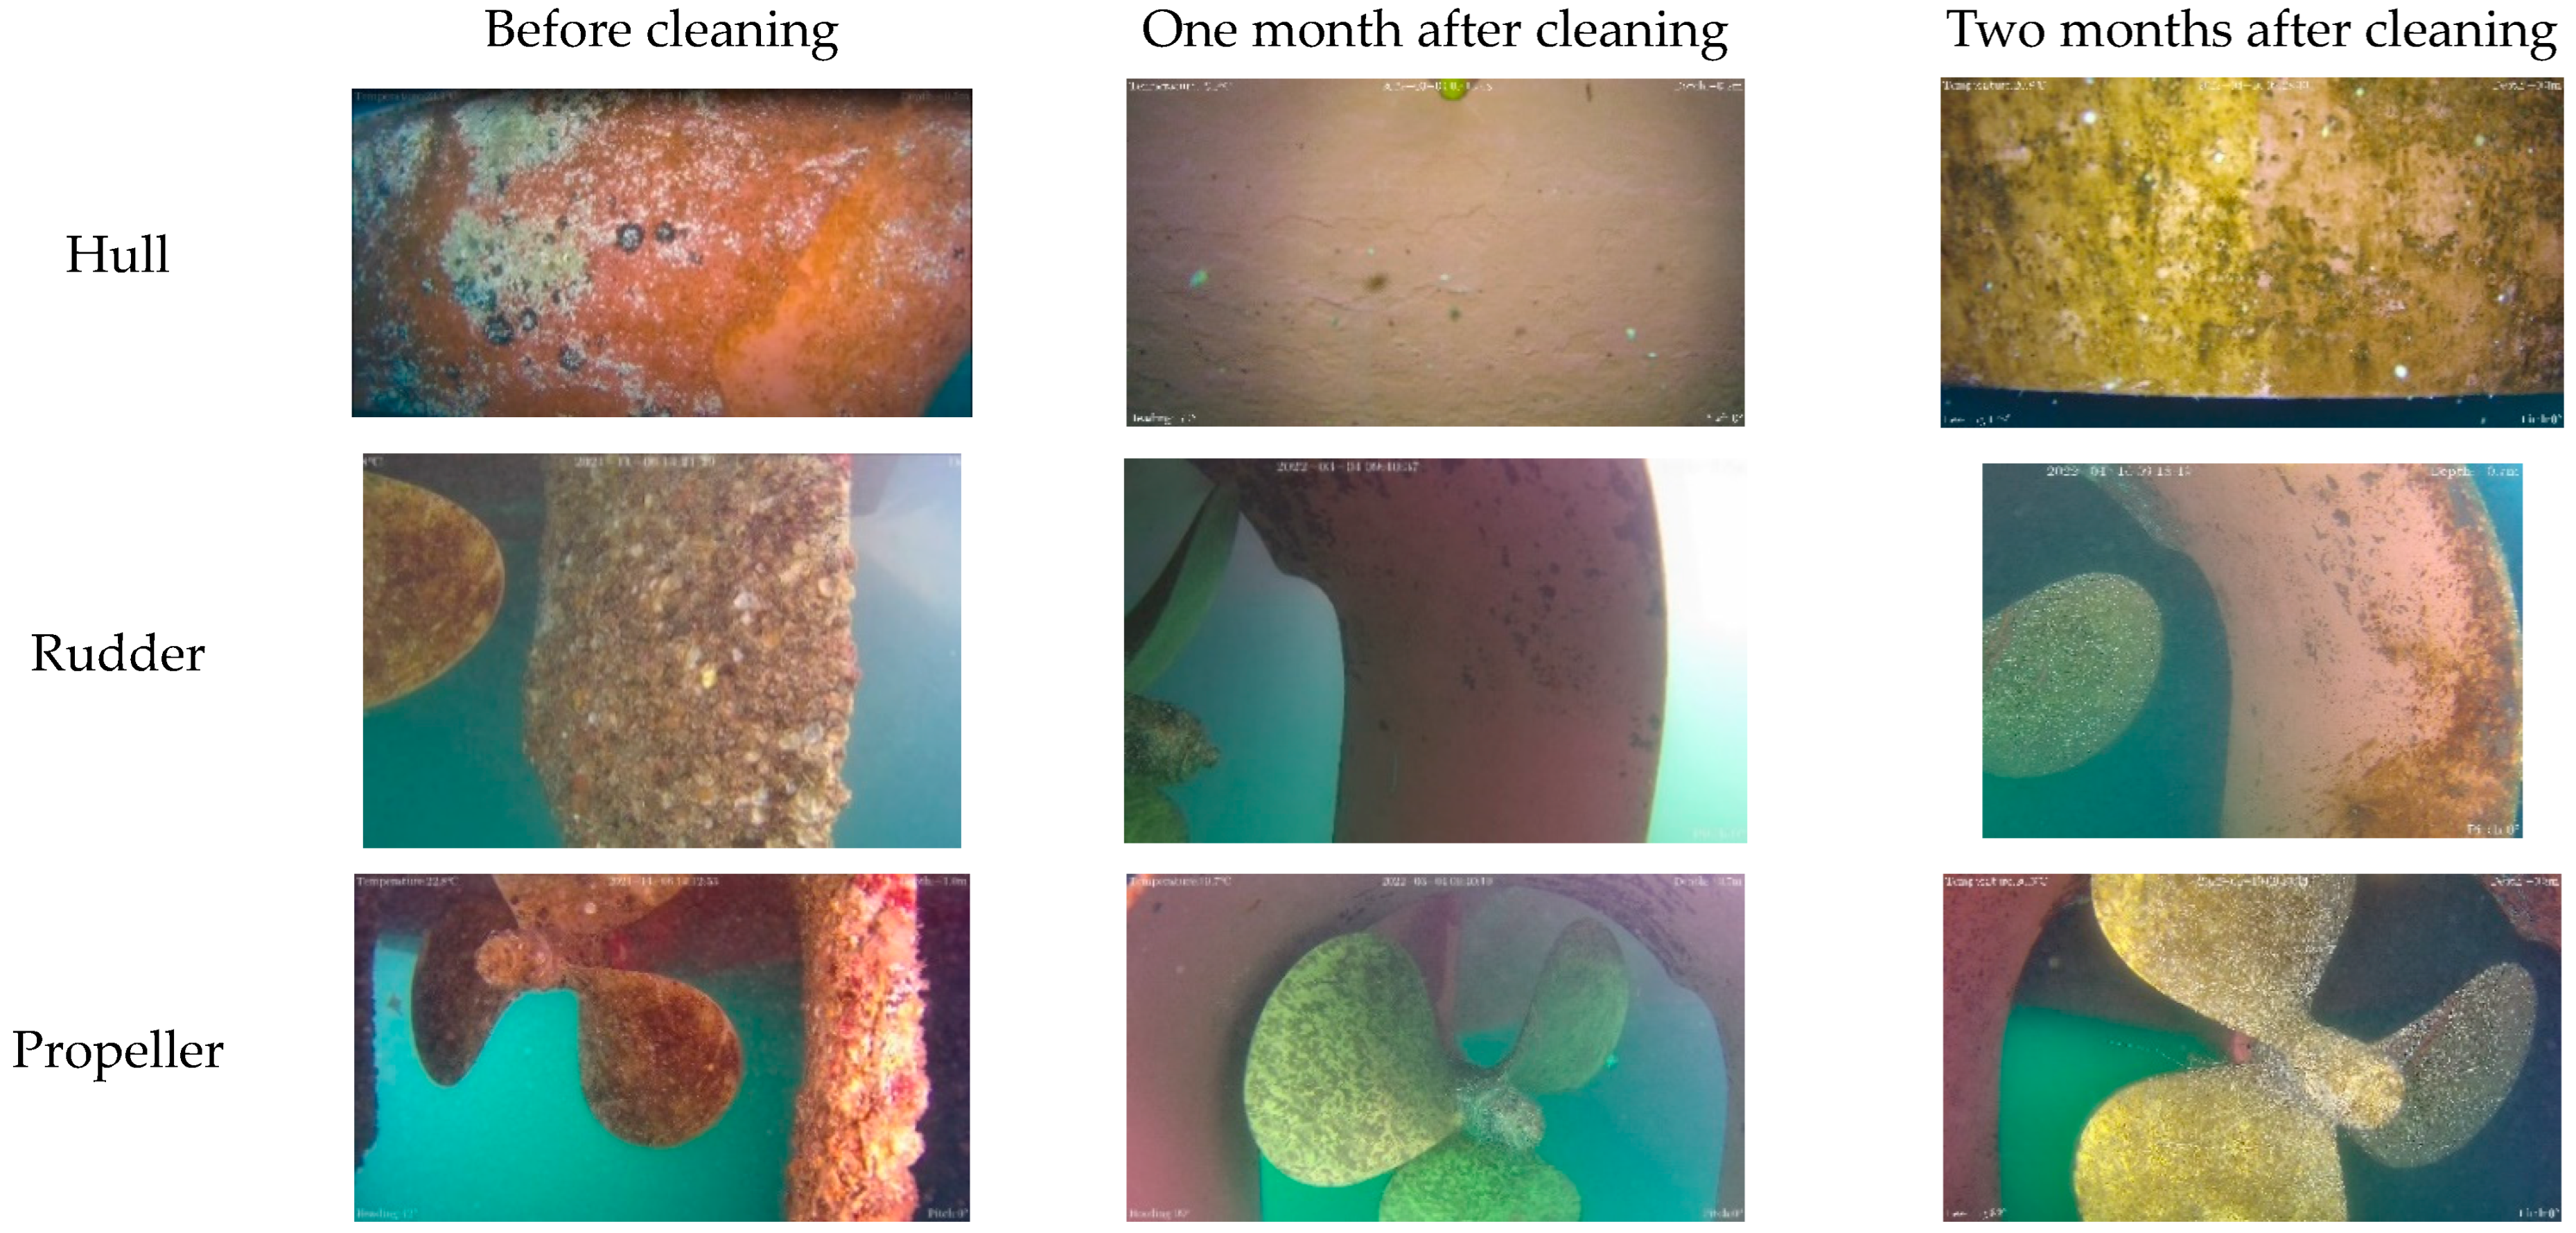
Figure 8 shows the growth of underwater biofouling on the hull of Vessel #2. On the left is an image of the hull that has not yet been cleaned. In the middle, the hull image was taken approximately one month after the hull was cleaned. On the right, the second hull image was taken approximately two months after the hull was cleaned.
One month after hull cleaning, according to the sailing records of the fishing vessels provided by the captain, a total of three voyages were made to the vicinity of Keelung Islet. The vessels were docked at the Shenao Fishing Port for the rest of the time. During this period, no obvious biofouling attachments were observed on the surface of the underwater hull. However, based upon the development process of the biological system, it can still be inferred that the adhering microfouling is developing into biofilms.
Figure 9 demonstrates that the fouling organisms can be clearly observed two months after the hull was cleaned. Attached seagrass and algae have developed on the major surface area of the hull. This can significantly increase the drag and fuel consumption of the fishing vessel. The rate of development of the biofouling systems during the two months is related to factors such as temperature, currents, the area in which the ship has sailed, and the length of time for which the ship has been docked [21,22,23].

4. Discussion

4.1. Reasons for Underwater Monitoring

The world cargo fleet includes 54,000 ships of 1000 gross tons and above [4]. Monitoring and evaluating the biofouling state and its effects on the ships’ performance is crucial for sustainable shipping. As time goes by, an increase in roughness of the ships’ hulls can be expected, and fuel consumption progressively increases [35]. For instance, approximately a year after dry-docking, the required propulsion output for operation has increased sharply [36].
A hull surface with biofouling growth tends to produce high levels of microorganisms, amplifying into major biofouling [37,38]. This can be mitigated effectively by intermittently interrupting the development of a biofilm [23]. The purpose of this paper is to regularly monitor the status of hull biofouling using a biofouling monitoring system. The system can ensure cleaning measures are taken in the early stages of biofilm formation. Further development into mature biofouling systems can thus be avoided.
The application of the developed monitoring system has the potential for both cost reduction and overall environmental benefit. It can be used to prevent the buildup of fouling on vessels of various types, and so reduce the global transfer of non-indigenous species [39,40].
Additionally, corrosion is widely recognized as the most serious issue for ships. Biofouling-induced corrosion is a main factor of marine corrosion [41]. The monitoring system may aid in identifying areas of research in fouling control that would result in the greatest benefit in terms of savings in fuel use during ship operations. Since the effects of biofouling on performance vary between ships, operational profile, and fouling conditions, the prevention of biofouling using underwater monitoring approaches can be expected from any stakeholder who is responsible for the costs, benefits, total ownership cost, and environmental impact of marine shipping.

4.2. Performance of Underwater Cameras

In this study, biological growth was observed on the vessel hull and was an important reason for the increase in fuel use. We tracked biofouling growth before and after hull cleaning, using Chasing Dory and Chasing M2. It was found that there was no visible fouling organism growth one month after cleaning. A large area of attached seagrass was clearly observed on the surface of the hull two months after cleaning.
Moreover, fouling organisms tend to attach to areas with a longer duration of sunlight exposure. It is therefore conjecturable that limiting the exposure of the hull to sunlight can slow down biofouling growth. This may extend the interval between docking and cleaning, and reduce operating costs.
Dry-docking and cleaning schedules are vital to minimizing a ship’s costs and emissions. Based upon the results and experience obtained from this study, we found that image monitoring technology using both Chasing Dory and Chasing M2 is useful for detecting biofouling issues in advance. In addition to identifying the extent of biofouling, both cameras can quickly and effectively assess primarily major issues on ships’ hulls. Although the M2 model is equipped with a more advanced lens set and produces clearer pictures than the Dory model, there are other considerations, e.g., price and weight, which need to be taken into account when selecting a tool for underwater monitoring.
The method is sensitive enough to monitor the state of the surface of ships’ hulls, which changes over time. The other advantages of image-based monitoring are summarized as follows:
  • The imaging measurements are fast and accurate;
  • The image itself is valuable visual data;
  • Multiple measurements can be made with the same image;
  • The imagery can automatically save metadata such as geographic location, date, and time;
  • The images and measurement data can be archived electronically.
Based on the images taken in this study (Figure 9), we found that fouling organisms preferred to attach themselves to the hull area rather than to the bottom area. The bottom area of the vessel remained relatively clean. In addition, we clearly observed the demarcation (red lines on images) of organism attachment. We speculate that the hull, in comparison with the bottom area of the ship, is much more exposed to sunlight, which is beneficial to photosynthesis and the growth of fouling organisms. In addition, other factors, e.g., the paint applied to the hull and the micro-environment, can influence the attachment of fouling organisms.
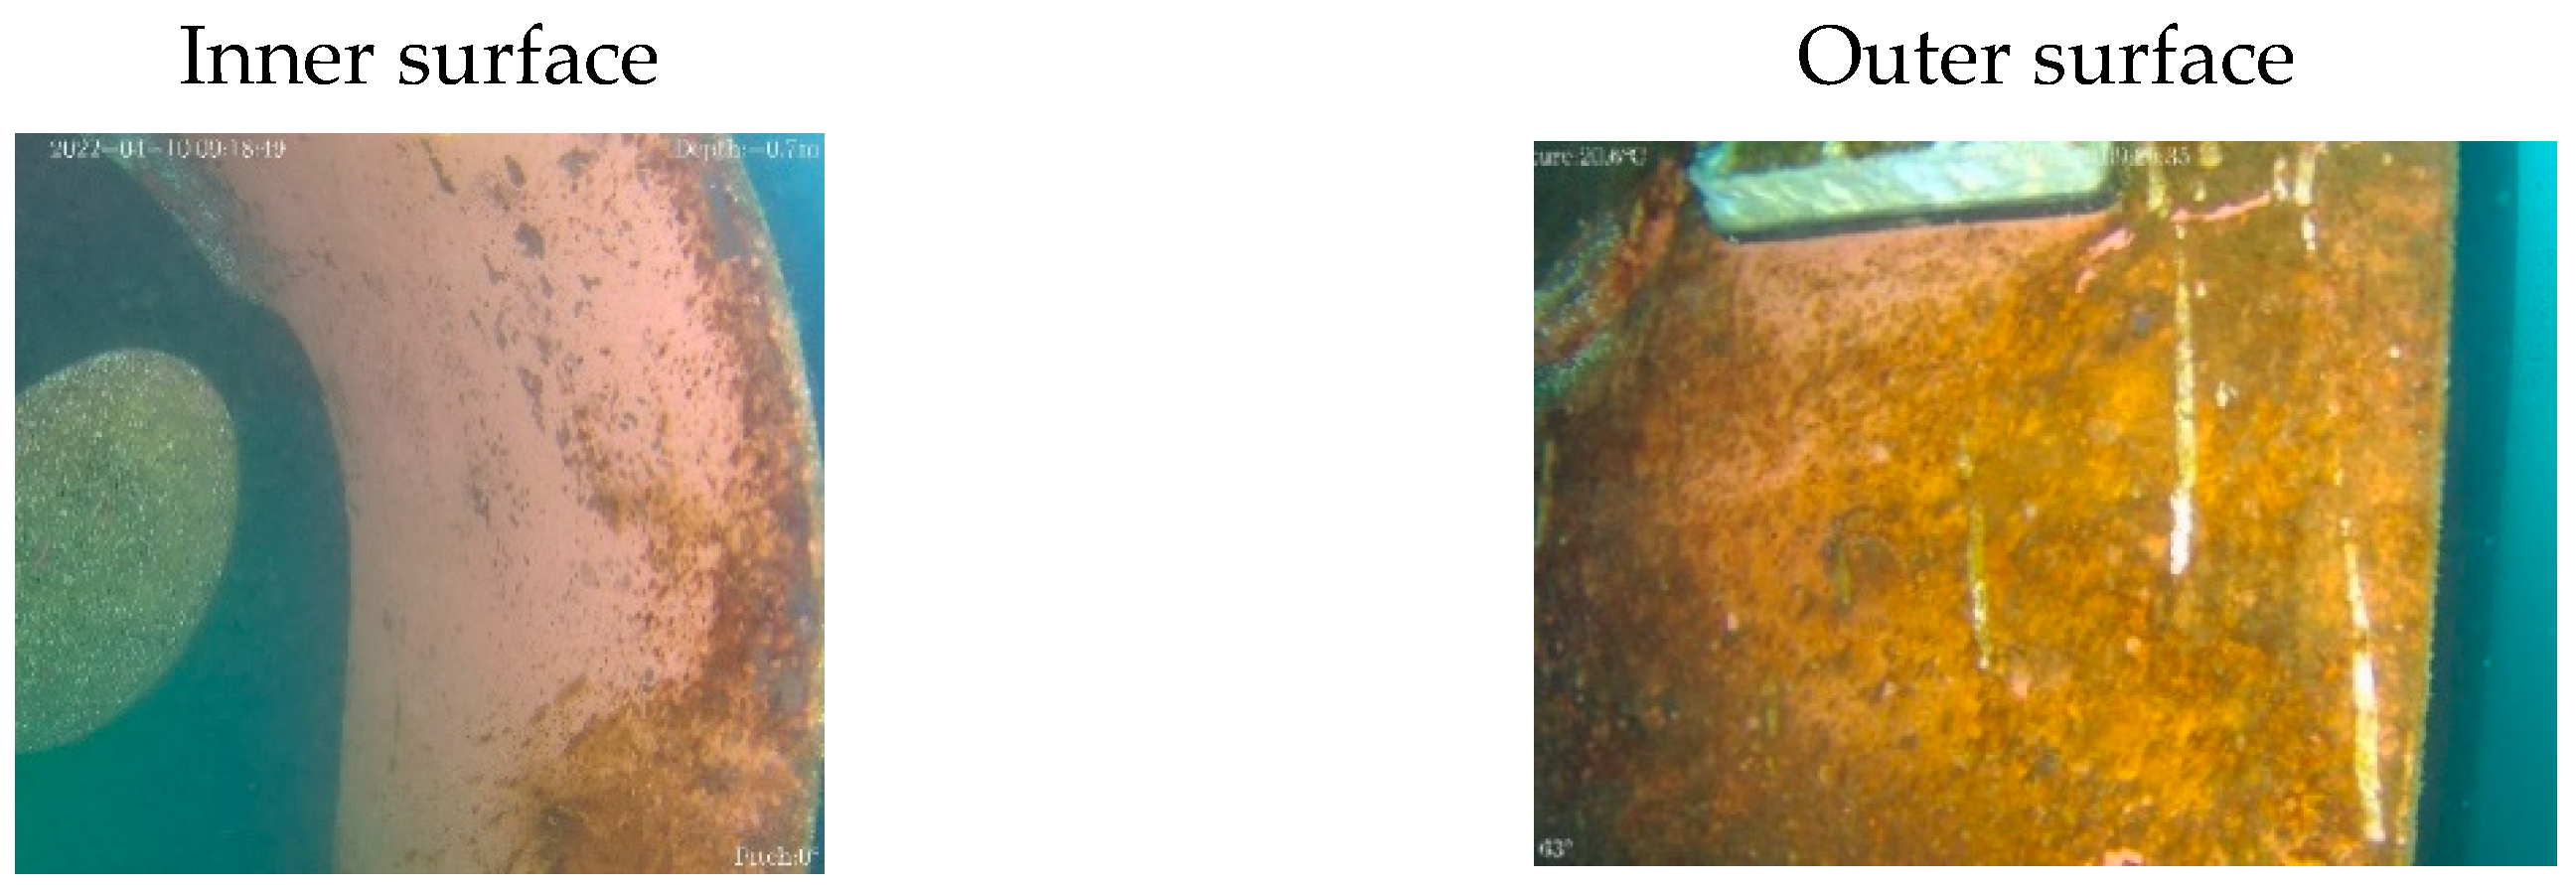
The benefits of solar exposure to the growth of fouling organisms can also be observed on the propeller. Figure 10 shows the images of biofouling development on the propeller surfaces. The inner side of the propeller, which is much less exposed to sunlight, shows little organism attachment, while the outer surface, which is continuously exposed to sunlight, shows heavy organism attachment. This infers that solar exposure plays a significant role in influencing biofouling growth and can be limited to restrain it.
Furthermore, major issues can be prevented using the monitoring system. For instance, the fishing net (as shown in Figure 8) found in this study can lead to rather serious issues, including a loss in the propulsion output and energy efficiency of the vessel. This can cause further deterioration in the propulsion system and can affect the main engine. This study enables early detection and timely elimination of the issue, thereby restoring propulsion efficiency and preventing further damage to the ship.

4.3. Environmental and Economic Benefit of Using Developed System

The main environmental advantages of the monitoring system described in this study include reduced atmospheric emission from vessels and possible lower water pollution levels due to less waste being generated by hull treatment. Furthermore, considering sustainable shipping, it is important to consider environmental costs, including atmospheric emissions [42,43,44]. Ship owners and operators who undertake frequent underwater monitoring may benefit from long-lasting clean hulls [45].
In addition, antifouling paint renewal is related to health issues. They include paint residue, blasting dust, wastewater, and non-indigenous species. Underwater cleaning can result in various types of environmental hazard [23]. The studied ships tend to move slowly around Taiwan in seas with relatively high water temperatures. Additionally, the relatively long harboring period can result in faster fouling growth. More significant fuel savings and a proportionate reduction in atmospheric emissions after hull cleaning can thus be expected [46]. Further reduction in combined operating costs is also achievable using the developed monitoring system [47].
Effective and reliable monitoring tools to address this would allow a timely cleaning procedure able to be traded off against costs, efficiency, and environmental impacts. However, existing monitoring technologies are either too expensive or too cumbersome to be operated by crews. This makes it difficult to implement frequent and effective monitoring, resulting in the best missed opportunities for action.
The results obtained in this study reveal that, with frequent and effective monitoring programs, action can be taken early enough to prevent further development of biofouling [12]. When interim cleaning is used, savings in fuel costs may be even greater and more than capable of offsetting the minimal increase in cost of applying the described monitoring system.

5. Conclusions

This paper presents the experimental laboratory and field results of our study gathering information by applying existing technology for monitoring submerged ships’ hulls. Combining underwater photography technology with periodic cleaning methods can effectively prevent the occurrence of problems including hull biofouling. With moderate sunlight, a shooting distance of 20 cm, and a depth of 1.5 m, we obtained the best images and achieved the purpose of effective monitoring. The monitoring technology established in this study is expected to enable effectively assessment and control of biofouling at an early stage. It is cheap, lightweight, and easy to operate, and can be carried on board and operated by the crew periodically to eliminate various underwater issues including biofouling, which in turn enhances sustainable shipping.

Author Contributions

Conceptualization, D.W. and J.H.; Methodology, J.H. and S.-Y.C.; Software, S.-Y.C.; Investigation, J.H. and J.L.; Resources, D.W.; Data curation, D.W., S.-Y.C. and J.L.; Writing—original draft, J.H.; Writing—review & editing, D.W. and J.H.; Visualization, S.-Y.C. and J.L.; Supervision, D.W.; Project administration, J.H. All authors have read and agreed to the published version of the manuscript.

Funding

This research received no external funding.

Conflicts of Interest

The authors declare no conflict of interest.

References

  1. Townsin, R.L. The Ship Hull Fouling Penalty. J. Bioadhesion Biofilm Res. 2003, 19, 9–15. [Google Scholar] [CrossRef] [PubMed]
  2. Wang, H.; Oguz, E.; Jeong, B.; Zhou, P. Life cycle cost and environmental impact analysis of ship hull maintenance strategies for a short route hybrid ferry. Ocean Eng. 2018, 161, 20–28. [Google Scholar] [CrossRef] [Green Version]
  3. Watanabe, S.; Nagamatsu, N.; Yokoo, K.; Kawakami, Y. The augmentation in frictional resistance due to slime. J. Kansai Soc. Nav. Archit. 1969, 131, 45–51. [Google Scholar] [CrossRef] [PubMed] [Green Version]
  4. The International Maritime Organization. UN Body Adopts Climate Change Strategy for Shipping. Press Briefing, MarineLink. 13 April 2018. Available online: https://www.marinelink.com/news/strategy-shipping-climate436339 (accessed on 1 March 2023).
  5. Wu, Y.; Hua, J.; Wu, D.L. Economic analysis of ship operation using a new antifouling strategy. Ocean Eng. 2022, 266, 13038. [Google Scholar] [CrossRef]
  6. Cheng, C.W.; Hua, J.; Hwang, D. NOx emission calculations for bulk carriers by using engine power probabilities as weighting factors. J. Air Waste Manag. Assoc. 2017, 67, 1146–1157. [Google Scholar] [CrossRef] [Green Version]
  7. Davidson, I.C.; Brown, C.W.; Sytsma, M.D.; Ruiz, G.M. The role of containerships as transfer mechanisms of marine biofouling species. Biofouling 2019, 25, 645–655. [Google Scholar] [CrossRef]
  8. Farkas, A.; Degiuli, N.; Martić, I. Assessment of the effect of biofilm on the ship hydrodynamic performance by performance prediction method. Int. J. Nav. Archit. Ocean Eng. 2021, 13, 102–114. [Google Scholar] [CrossRef]
  9. Krapp, A.; Vranakis, G. A Practical Way to Evaluate the Inservice Performance of Antifouling Coatings. In Proceedings of the SNAME, Athens, Greece, December 2013. [Google Scholar]
  10. Ballegooijen, E.; Muntean, T. Fuel saving potentials via measuring propeller thrust and hull resistance at full scale: Experience with ships in service. In Proceedings of the HULLPIC, Castello di Pavone, Italy, April 2016. [Google Scholar]
  11. Schultz, M.P.; Bendick, J.A.; Holm, E.R.; Hertel, W.M. Economic impact of biofouling on a naval surface ship. Biofouling 2011, 27, 87–98. [Google Scholar] [CrossRef]
  12. Song, S.; Kemal, Y.; Atlar, D.M. An investigation into the effect of biofouling on the ship hydrodynamic characteristics using CFD. Ocean Eng. 2019, 175, 122–137. [Google Scholar] [CrossRef] [Green Version]
  13. Farkas, A.; Song, S.; Degiuli, N.; Martić, I.; Demirel, Y.K. Impact of biofilm on the ship propulsion characteristics and the speed reduction. Ocean Eng. 2020, 199, 107033. [Google Scholar] [CrossRef]
  14. BBC News. Available online: https://www.bbc.com/news/world-australia-64138743 (accessed on 1 March 2023).
  15. Marine Biosecurity Porthole. Biofouling Management of International Vessels. Available online: https://marinebiosecurity.niwa.co.nz/biofouling-management-of-international-vessels/ (accessed on 1 March 2023).
  16. Munk, T.; Yebra, D.M. Advances in Marine Antifouling Coatings and Technologies. Available online: https://www.sciencedirect.com/topics/engineering/marine-biofouling (accessed on 11 March 2021).
  17. ANZECC. Code of Practice for Antifouling and In-Water Cleaning and Maintenance. Prepared by the Australian and New Zealand Environment and Conservation Council (Maritime Accidents and Pollution Implementation Group), Canberra, Australia. 2020. Available online: http://www.environment.gov.au/coasts/pollution/antifouling/code/pubs/code.pdf (accessed on 24 April 2020).
  18. Oliveira, D.; Granhag, L. Matching forces applied in underwater hull cleaning with adhesion strength of marine organisms. J. Mar. Sci. Eng. 2016, 4, 66. [Google Scholar] [CrossRef] [Green Version]
  19. Hopkins, G.; Forrest, B.; Coutts, A. Determining the Efficacy of Incursion Response Tools: Rotating Brush Technology (Coupled with Suction Capability). MAF Biosecurity N. Z. Tech. 2009/39. Available online: https://niwa.co.nz/static/marine-biosecurity/marine-response-tools-rotating-brushes.pdf (accessed on 2 April 2022).
  20. Yebra, D.M.; Kiil, S. Antifouling technology—Past, present and future steps towards efficient and environmentally friendly antifouling coatings. Prog. Org. Coat. 2004, 50, 75–104. [Google Scholar] [CrossRef]
  21. Kinnaman, B. The Future: Autonomous Robotic Hull Grooming. Available online: https://www.marinelink.com/news/future-autonomous-robotic-hull-grooming-464099 (accessed on 11 March 2021).
  22. Song, S.; Demirel, Y.K.; Atlar, M.; Dai, S.; Day, S.; Turan, O. Validation of the CFD approach for modelling roughness effect on ship resistance. Ocean Eng. 2020, 200, 107029. [Google Scholar] [CrossRef] [Green Version]
  23. Hua, J.; Chiu, Y.S.; Tsai, C.Y. En-route operated hydroblasting system for counteracting biofouling on ship hull. Ocean Eng. 2018, 152, 249–256. [Google Scholar] [CrossRef]
  24. Anderson, C.D.; Hunter, J.E. Whither antifoulings after TBT? In Proceedings of the NAV 2000 International Conference on Ship and Shipping Research, 13th Congress Paper 3.7, Venice, Italy, 19–22 September 2000. [Google Scholar]
  25. Edyvean, R. Consequences of fouling on shipping. In Biofouling; Wiley-Blackwell: Oxford, UK, 2010; pp. 217–225. [Google Scholar]
  26. Brooks, S.; Waldock, M. The use of copper as a biocide in marine antifouling paints. In Advances in Marine Antifouling Coatings and Technologies; Woodhead Publishing: Oxford, UK, 2009. [Google Scholar]
  27. Legg, M.; Yücel, M.K.; Garcia de Carellan, I.; Kappatos, V.; Selcuk, C.; Gan, T.H. Acoustic methods for biofouling control: A review. Ocean Eng. 2015, 103, 237–247. [Google Scholar] [CrossRef]
  28. Thomas, K.V.; Brooks, S. The environmental fate and effects of antifouling paint biocides. Biofouling 2010, 26, 73–88. [Google Scholar] [CrossRef]
  29. Davidson, I.C.; McCann, L.D.; Sytsma, M.D.; Ruiz, G.M. Interrupting a multispecies bioinvasion vector: The efficacy of in-water cleaning for removing biofouling on obsolete vessels. Mar. Pollut. Bull. 2008, 56, 1538–1544. [Google Scholar] [CrossRef]
  30. Floerl, O.; Smith, M.; Inglis, G.; Davey, N.; Seaward, K.; Johnston, O.; Fitridge, I.; Rush, N.; Middleton, C.; Coutts, A. Vessel Biofouling as a Vector for the Introduction of Non-Indigenous Marine Species to New Zealand: Recreational Yachts; Research Project ZBS2004-03A; NIWA Client Report prepared for MAF Biosecurity New Zealand, Ministry of Agriculture and Forestry: Wellington, New Zealand, 2010.
  31. Caccia, M.; Veruggio, G. Modeling and identification of open-frame variable configuration unmanned vehicles. IEEE J. Ocean Eng. 2000, 25, 227–240. [Google Scholar] [CrossRef]
  32. Zhao, C.; Thies, P.R.; Johanning, L. Offshore inspection mission modelling for an ASV/ROV system. Ocean Eng. 2022, 259, 111899. [Google Scholar] [CrossRef]
  33. Hover, F.S.; Grosenbaugh, M.A.; Triantafyllou, M.S. Calculation of Dynamic Motions and Tensions in Towed Underwater Cables. IEEE J. Ocean Eng. 1990, 19, 449–457. [Google Scholar] [CrossRef]
  34. Shinsuke, A. Simple Imaging Techniques for Plant Growth Assessment. Available online: https://edis.ifas.ufl.edu/publication/HS1353 (accessed on 17 April 2022).
  35. Adland, R.; Cariou, P.; Jia, H.; Wolff, F.C. The energy efficiency effects of periodic ship hull cleaning. J. Clean. Prod. 2018, 178, 1–13. [Google Scholar] [CrossRef]
  36. Logan, K.P. Using a ship’s propeller for hull condition monitoring. Nav. Eng. J. 2012, 124, 71–87. [Google Scholar]
  37. Pérez, M.C.; Mårtensson, L. Organic alternatives to copper in the control of marine biofouling. In Advances in Marine Antifouling Coatings and Technologies; Woodhead Publishing: Oxford, UK, 2009. [Google Scholar]
  38. Scianni, C.; Georgiades, E. Vessel In-Water Cleaning or Treatment: Identification of Environmental Risks and Science Needs for Evidence-Based Decision Making. Available online: https://www.frontiersin.org/articles/10.3389/fmars.2019.00467/full (accessed on 17 March 2020).
  39. IliyaValchev, I.; Coraddu, A.; Kalikatzarakis, M.; Geertsma, R.; Oneto, L. Numerical methods for monitoring and evaluating the biofouling state and effects on vessels’ hull and propeller performance: A review. Ocean Eng. 2020, 251, 110883. [Google Scholar] [CrossRef]
  40. Eartheasy. Eco-Friendly Boating. Available online: https://learn.eartheasy.com/guides/eco-friendly-boating/ (accessed on 20 November 2021).
  41. Uzun, D.; Demirel, Y.K.; Coraddu, A.; Turan, O. Time-dependent biofouling growth model for predicting the effects of biofouling on ship resistance and powering. Ocean Eng. 2019, 191, 106432. [Google Scholar] [CrossRef]
  42. Abbott, A.; Abel, P.D.; Arnold, D.W.; Milne, A. Cost-benefit analysis of the use of TBT: The case for a treatment approach. Sci. Tot. Environ. 2000, 258, 5–19. [Google Scholar] [CrossRef] [PubMed]
  43. Townsin, R.L.; Byrne, D.; Svensen, T.E.; Milne, A. Estimating the technical and economic penalties of hull and propeller roughness. Trans. SNAME 1981, 89, 295–318. [Google Scholar]
  44. Townsin, R.L.; Spencer, D.S.; Mosaad, M.; Patience, G. Rough propeller penalties. Trans. SNAME 1985, 93, 165–187. [Google Scholar]
  45. UNFCCC. What Is the Kyoto Protocol? Available online: https://unfccc.int/kyoto_protocol (accessed on 17 November 2021).
  46. Balcombe, P.; Brierley, J.; Lewis, C.; Skatvedt, L.; Speirs, J.; Hawkes, A.; Staffell, I. How to decarbonise international shipping: Options for fuels, technologies, and policies. Energy Convers. Manag. 2019, 182, 72–88. [Google Scholar] [CrossRef]
  47. Tamburri, M.N.; Davidson, I.C.; First, M.R.; Newcomer, K.; Inglis, G.J.; Georgiades, E.T.; Barnes, J.M.; Ruiz, G.M. In-water cleaning and capture to remove ship biofouling: An initial evaluation of efficacy and environmental safety. Front. Mar. Sci. 2020, 7. [Google Scholar] [CrossRef]
Figure 1. Chasing Dory.
Sustainability 15 06260 g001
Figure 2. Chasing M2.
Sustainability 15 06260 g002
Figure 3. Experimental system for establishing the relationship between illuminance and water depth.
Sustainability 15 06260 g003
Figure 4. Location of study fishing vessels alongside Port Shenao.
Sustainability 15 06260 g004
Figure 5. Underwater robot along the port side of the ship.
Sustainability 15 06260 g005
Figure 6. Relationship between illumination and water depth.
Sustainability 15 06260 g006
Figure 7. Underwater images of study fishing vessel.
Sustainability 15 06260 g007
Figure 8. Images before and after cleaning.
Sustainability 15 06260 g008
Figure 9. Images of biogrowth demarcation on the ship’s hull and bottom.
Sustainability 15 06260 g009
Figure 10. Images of biofouling development on the propeller.
Sustainability 15 06260 g010
Table 1. Specification of monitoring equipment.
RobotChasing DoryChasing M2
Size, mm247 × 188 × 92380 × 267 × 165
Weight, kg1.14.5
Maximum depth, m15100
Maximum speed, knot1.53
Camera lensF/1.6F/1.8
Camera focus, mm41
ISO range100–3200100–6400
FOV100°152°
Max. resolution2 M12 M
IMU3-axis gyroscope, accelerator, compass3-axis gyroscope, accelerator, compass
Depth transmitter≤±0.5 m≤±0.25 m
Temperature transmitter≤±2 °C≤±2 °C
Table 2. Specifications of the lux meter used in this study.
Size, mm56 × 36 × 195
Weight, g270
Range of measurement, Lux0–200,000
Temperature range of measuring, °C−9.9–49.9
Working temperature, °C0–40
Table 3. Specification of study vessels.
VesselVessel #1Vessel #2
Gross tonnage9.968.29
Net tonnage2.992.49
Length overall, m14.7311.95
Breadth midship, m3.233.12
Depth midship, m1.410.9
Maximum draft, m1.20.5
Fuel capacity, l16001400
Rate speed, knots1110
Table 4. Comparison of optimal measuring distances.
Chasing DoryChasing M2
DistanceDaylight OnlySupplementary LightDaylight OnlySupplementary Light
10 cmSustainability 15 06260 i001Sustainability 15 06260 i002Sustainability 15 06260 i003Sustainability 15 06260 i004
20 cmSustainability 15 06260 i005Sustainability 15 06260 i006Sustainability 15 06260 i007Sustainability 15 06260 i008
30 cmSustainability 15 06260 i009Sustainability 15 06260 i010Sustainability 15 06260 i011Sustainability 15 06260 i012
40 cmSustainability 15 06260 i013Sustainability 15 06260 i014Sustainability 15 06260 i015Sustainability 15 06260 i016
50 cmSustainability 15 06260 i017Sustainability 15 06260 i018Sustainability 15 06260 i019Sustainability 15 06260 i020
Disclaimer/Publisher’s Note: The statements, opinions and data contained in all publications are solely those of the individual author(s) and contributor(s) and not of MDPI and/or the editor(s). MDPI and/or the editor(s) disclaim responsibility for any injury to people or property resulting from any ideas, methods, instructions or products referred to in the content.