Abstract
The accumulation of oil mist in the thrust bearings poses a threat to the safety of the unit, leading to financial and environmental losses. To investigate the generation and influencing factors of oil mist in the oil tank of the thrust bearing in a pumped-storage power station, a novel numerical simulation method is proposed for calculating the oil–oil mist–air multi-phase flow based on the VOF model, RNG turbulence model, and Lee model. The proposed numerical method’s reliability is verified using field operation data. The effects of rotational speed and pad temperature on the formation of oil mist inside the oil tank were examined from two perspectives of internal and external oil leaks. The research revealed two accumulation areas where oil mist is generated and accumulated: between the thrust head and the oil-retaining ring and near the oil slinger. The former causes external oil leaks due to pressure differences, while the latter causes internal oil leaks due to the rotor blast effect. An increase in temperature and rotational speed exacerbates the formation of oil mist. Furthermore, an increase in speed decreases the pressure change rate at the wall of the inner tank (external oil leaks) by 5.95% and at the oil slinger (internal leaks) by 44.64%. Consequently, compared to external oil leaks, internal oil leaks are more likely to occur.
1. Introduction
Hydropower, being a renewable energy source with high exploitable potential and mature technology, is expected to continue to play a significant role in promoting energy production and addressing climate change for a considerable period of time to come, in concert with other complementary sources of renewable energy [1,2,3,4]. However, as a downside, pollutants may be dispersed into the water as a result of the inevitable leakage of turbine oil and mist emanating from the rotating components, such as the thrust and shaft bearings [5]. The reason for this phenomenon is that turbine oil, an indispensable lubricant derived from petroleum, aerosolizes with air at a specific temperature [6]. In recent decades, numerous efforts have been made to comprehend and mitigate this predicament. Jung K et al. [7] acknowledged the correlation between the centrifugal force and oil leakage in the bearings, as well as between the deposition of oil mist and the elevated temperature caused by a viscous shear strain of the oil film due to tremendous pressure [8]. The potential hazard caused by oil mist leakage in hydropower stations is grave, as evidenced by several incidents. For example, in the Cataract power station, the leakage of lubricating oil increased the temperature of the bearing, resulting in unit shutdown [9]. During the operation of the Caijiazhou Hydropower Station, the water-lubricated guide bearing emitted a screeching sound due to the collapse of the oil slinger ring, discharging oil mist on the bearing cover [10]. In the Yantan Hydropower Station, brake dust mixed with oil mist leaked and contaminated the generator’s interior, consequently raising the temperature of the stator [11]. The Tianwanhe Dafa hydropower station suffered a severe failure in the cover seal, causing the oil level of the thrust bearing tank to decrease by 10 mm/day, forcing personnel to monitor and replenish the oil [12]. The Xiaolangdi Hydropower Station discharged nearly 100 L of lubricating oil during manual operation [13]. Since restricting the release of oil mist in the thrust bearing reduces safety hazards, water pollution, and biodiversity loss [14], investigating its causes and consequences remains an ongoing concern among scientists and engineers.
Solutions to the issue of oil and oil mist leakage in hydropower stations exist within engineering practices, but they are specific to the actual operation of the units. Furthermore, the methodology is limited in information and requires substantial human and economic resources. Therefore, it is crucial to comprehend the actual flow pattern inside the bearing oil tank and the causes of oil mist leakage in the system to develop appropriate and reasonable solutions [15,16]. However, this analytical solution is highly complex and, therefore, may be approximated numerically using methods such as the finite difference method (FDM), finite element method (FEM), finite volume method (FVM), and spectral method [17]. Presently, many studies assessing oil leaks and circulation patterns in bearings utilize industrial software [17], such as ANSYS Fluent and CFX [18,19].
In recent years, the development of numerical simulation technology has led to the proposal of many high-performing bearing covers and structures through the study of flow paths and possible occurrences of oil and oil mist leaks [20,21,22]. Numerous scholars have primarily focused on the oil tank pressure and the level of oil mist accumulation. For instance, Pang et al. [23] examined the oil mist leakage in the bearing by studying the flow field and temperature using the FDM and the distribution of the oil using the VOF two-phase flow and SST turbulence model. Chen et al. [24] used a two-dimensional model to compute the pressure distribution in the rotating oil basin of cylindrical guide bearings. An analysis was performed between the lubricating oil viscosity and the generated oil level and pressure distribution. Deng et al. [25] dealt with the oil mist leakage of the hydro-generator bearing by optimizing the structure of the oil tank cover based on flow theory analysis. In this case, the optimized scheme of the impeller generated an oil-recovering pressure drop, reducing the oil mist rate from 4.9 to 0.36 m3/h.
However, the aforementioned research primarily focused on the oil–air two-phase flow in the tank, thereby overlooking the presence of oil mist. As the mass transfer of lubricating oil due to temperature and speed changes is integral in leakage generation, this study employs a three-dimensional geometric multi-phase model, using the Volume of Fluid (VOF), RNG turbulence model, and Lee model to solve the air–oil–oil mist multi-phase flow based on ANSYS Fluent 2020 R1 code. The evaporation and condensation model is used to simulate the mass transfer between the oil and oil mist. The objective of this paper is to devise anti-oil mist leakage measures for thrust bearings through two investigations: (a) analyzing the oil flow pattern and oil mist discharge in the oil-bearing tank, and (b) examining the effect of unit speed and pad temperature on the external and internal oil leakage.
2. Physical Model and Flow Path of the Oil Tank
2.1. Physical Model
The three-dimensional model of the thrust-bearing oil tank in a pumped-storage power system is presented herein. The thrust bearing is situated at the top center of the upper frame and is responsible for bearing the weight of the rotating parts and the axial thrust of the hydraulic unit. The thrust head and mirror plate are combined and mounted on the shaft, with the axial load transmitted to the thrust bearing pad through the thrust head and mirror plate. Each of the 12 pads is crafted from babbitt metal and is supported by 18 elastic rubber pads, which allow for dynamic adjustment of the force point in response to varying working conditions. Furthermore, the high flexibility of the elastic rubber pads enables them to compensate for any uneven stress resulting from assembly errors. Elastic rubber pads also have the added benefit of absorbing vibrations, thus promoting the stable operation of the thrust bearing. The assembly diagram of the thrust-bearing is illustrated in Figure 1, which shows the main components, including the thrust head and mirror plate, the thrust-bearing pad, the oil tank and cover, the elastic rubber and detachable pad, the upper frame, the oil slinger, and the oil-retaining ring. The main dimensions are presented in Table 1.
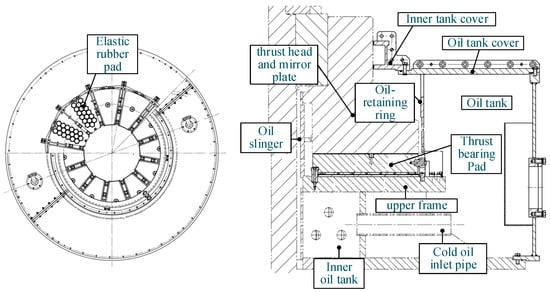
Figure 1.
Assembly diagram of thrust bearing.

Table 1.
Main parameters of thrust bearings.
To facilitate mesh division and calculation, certain components of the thrust bearing, deemed unimportant for the three-dimensional model, were disregarded. The complete and partial views of the model are illustrated in Figure 2.
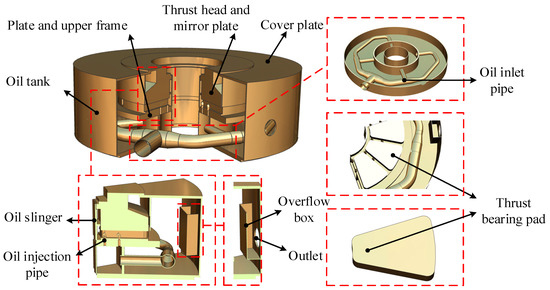
Figure 2.
Simplified model of the thrust-bearing oil tank.
2.2. The Circulating Path of the Lubricating Oil in the Oil Tank
A circulating cooling system is utilized to supply cooling oil, as depicted in Figure 3. The circulation loop mainly comprises a pump and inlet and outlet pipelines, which are connected to the oil tank [26]. The operation of the system is described as follows. Initially, cold oil is pumped through the inlet pipe into the inner oil tank and is then sprayed through the oil injection pipe into the bearing pad zone. The pressure generated by the wedge-shaped fluid film, which is formed between the bearing pad and mirror plate, supports the gravity and axial force of the rotating parts. If the pump is not operated continuously, the pressure of the dynamic oil film may become disturbed, causing the bearing temperature to increase rapidly and posing a threat to the safety of the unit [27]. During operation, the oil heats up due to viscous shear strain and is ejected to the overflow box under the influence of the centrifugal force before being discharged from the outlet pipe. The ejected oil is cooled outside the oil tank before re-entering the inlet pipe, thus repeating the aforementioned process. The cooling efficiency of the system is high and not restricted by the size of the thrust bearing.
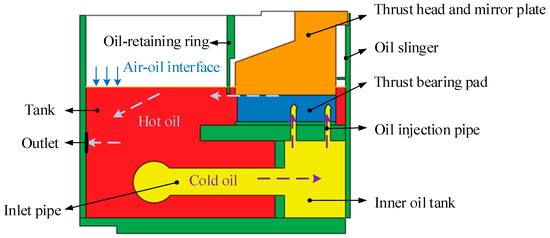
Figure 3.
The circulating path of lubricating oil in the oil tank.
3. Numerical Methods
3.1. Numerical Calculation Model and the Governing Equation
This paper utilizes the VOF model in ANSYS Fluent 2020 R1 code to conduct multi-phase flow calculations that track and capture the interface of different phases. The model assumes constant physical parameters for the gas and liquid phases, and neglects the relative velocity between the oil mist and air. Each phase is assumed to have its own set of momentum and energy equations, and the phases do not permeate each other. The continuity equation is presented as follows [28]:
where , , are the volume fractions of air, oil, and oil mist, respectively; , , and are the density of air, oil, and oil mist; is velocity; and and are mass source terms for oil and oil mist to calculate mass transfer during evaporation and condensation. Furthermore, the sum of , , and can be expressed as
As the velocity field and energy field are shared by all three phases during the calculation process, the momentum equation and energy equation both employ mixed density and velocity, as indicated by Equations (5) to (6).
The momentum equation is [29]
where is pressure; is the interphase force; is dynamic viscosity; and is the acceleration of gravity. The results are along the negative direction of the Z-axis.
The energy equation is [29]
where is energy; is thermal conductivity coefficient; is the temperature; is the energy transfer during phase transition.
To close the RANS equations, the turbulence model is adopted. It should be noted that the modeling process did not take into account the presence of the oil film, which is on the micron scale [30]. Consequently, the flow scale span in the entire oil tank is of significant importance. While the standard model is commonly utilized for the multi-phase flow in the oil tank, the RNG model was chosen in this study due to its ability to capture fluid rotation, as indicated by previous research [31,32]. This model is particularly well suited to handling the swirling flow caused by the spinning shaft, and can accurately reflect streamline bending [33]. The transport equation for turbulent kinetic energy is expressed as follows:
where is the turbulent kinetic energy generated by the laminar flow velocity gradient, calculated by Equation (12):
Here, the is the surface tension coefficient; is the average tension; is the coefficient of thermal expansion; and the coefficient and .
In Equation (10), the denotes the turbulence generated by buoyancy, calculated by Equation (13):
Whilst the dissipation rate () equation is expressed as follows:
The parameters , , and are constants, whereas and are the turbulent Prandtl numbers of and equations, . is an additional term to the equation, calculated by Equation (14):
Oil vapor is formed during the oil heat-up process, and the involved mass and energy transfer are simulated with the evaporation and condensation model. It is integrated with the popular Lee phase transformation model. The formula is as follows [34]:
where is the mass source term of oil; is the mass transfer coefficient of phase transition; is the oil temperature; and is the oil vapor saturation temperature.
3.2. Computational Domain
As the inlet and outlet structure of the thrust-bearing oil tank comprises four pipes, a 1/4 symmetry condition is applied to reduce the number of meshes by setting periodic boundary surfaces. The calculation model is divided into two domains: the oil tank and the pipe domains, as depicted in Figure 4a,b.
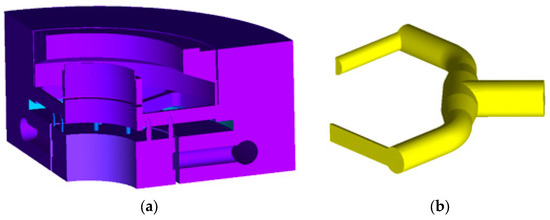
Figure 4.
Calculation domain. (a) Oil tank domain; (b) oil pipe domain.
3.3. Meshing
The computational domain is discretized using an unstructured mesh with good adaptability. The mesh is refined in the oil slinger, injection pipe, and other small parts to ensure accuracy. The mesh division diagram is depicted in Figure 5.
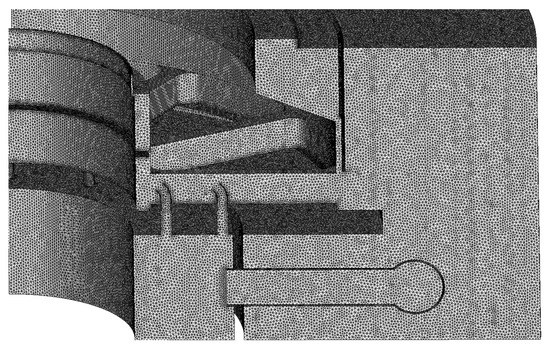
Figure 5.
Diagram of computational domain mesh division.
3.4. Grid Independence Verification
A total of five sets of meshes are set for grid independence verification, as shown in Table 2. Mesh 1–5 represents various discretization schemes for fluid elements, with a range of grid numbers spanning from 1.79 to 8.28 million. In order to assess the impact of grid numbers on computational results, identical boundary conditions were applied to all schemes. A comparison is subsequently made using the steady point temperature and velocity near the thrust head above the oil tank (see Table 3).

Table 2.
Mesh cases.

Table 3.
The changes in pressure, temperature, and velocity at a point in the domain.
By analyzing the data presented in Table 3 and Figure 6a, it becomes apparent that the temperature, pressure, and velocity values exhibit an initial increase followed by an asymptotic behavior with respect to the number of cells. A desirable level of accuracy, i.e., an error of less than 1%, is achieved when using 6 million cells (M4 case). The interface between air and oil is accurately and stably represented in the M4 case, which contrasts with the results obtained when using less than 3 million cells (M2 case), as depicted in Figure 6b. Considering the balance between computational cost and accuracy, we use the M4 case to perform subsequent analyses.
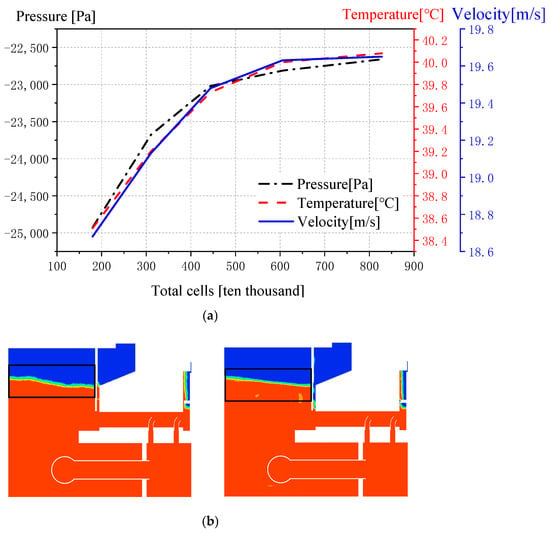
Figure 6.
Grid independence verification. (a) The curve of temperature, pressure, and flow velocity at a certain point in the oil tank with the number of cells; (b) diagrams of air–oil interfaces for M2 and M4.
3.5. Condition
To establish the numerical calculation conditions in this paper, temperature data of bearing pads from the thrust bearings at Hongping pumped-storage power station in Jiangxi, China, were collected, as presented in Figure 7. This figure displays the monthly average temperatures of 12 thrust-bearing pads between January and May 2021. The data indicate that the bearing pad temperatures ranged from a minimum of 54.2 °C to a maximum of 62.6 °C.
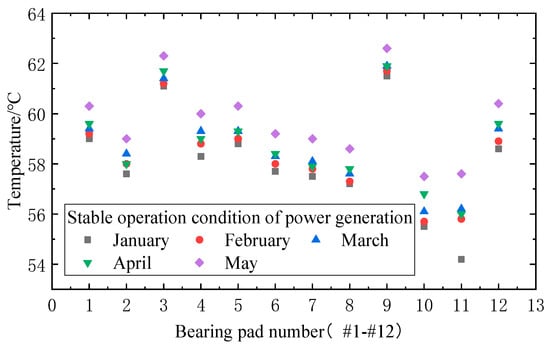
Figure 7.
Monthly average temperature diagram of bearing pads #1 to #12 under the stable operation of power generation.
Table 4 displays seven test cases. Cases 1–3 maintain a constant rotational speed while varying the bearing pad temperature between 56 and 62 °C. The purpose of these cases is to investigate the effects of different bearing temperatures on the internal flow field of the thrust-bearing oil tank under rated speed conditions. Cases 4–7 maintain a constant bearing temperature while varying the rotational speed from 100 to 500 rpm. The purpose of these cases is to study the influence of changes in rotational speed on the internal flow field of the thrust-bearing oil tank at an average bearing pad temperature.

Table 4.
Calculation parameters of stable operating conditions.
3.6. Numerical Solution Method and Boundary Conditions
The pressure-based solver is chosen to perform the calculations, with the VOF model being employed to compute the three-phase flow of air–oil–oil vapor and to track the interface between the different phases. The momentum equation is balanced by the implicit algorithm, which takes into account the pressure gradient and the volume force. The implicit volume force helps to improve the convergence of the solution, while the Lee model is used to calculate the process of evaporation and mass transfer between the oil and oil vapor. The rotating wall is set as the mirror plate and thrust head, with the rotational speed being fixed at unit speed for the current case, while the other walls are set as static walls. The RANS equations are closed using the RNG model. The pressure–velocity coupling is solved by the coupled algorithm, which employs a second-order precise discrete scheme and a pseudo-transient flow. This paper utilized 64 cores and conducted 5000 iteration steps during the steady-state calculation.
Regarding operation, the thrust-bearing oil discharge rate is approximately 3500 L/min, with the outlet pressure of the oil pump at 0.4 MPa and the inlet pressure of the oil tank ranging from 0.25 to 0.3 MPa. The hot oil is discharged through the overflow box at atmospheric pressure. The oil temperature inside the tank is around 40 °C, and it vaporizes at 45 °C, producing oil mist [35]. Figure 7 illustrates slightly varying temperatures of the thrust-bearing pads. For this study, all pad temperatures under the same condition are assumed to be equal, and the effect of wedge clearance and thrust oil film is disregarded in the computation process. The specific boundary and initialization conditions are as follows:
- (a)
- Inlet: The mass flow rate at the inlet is 12.54 kg/s. The inlet pipe has a hydraulic diameter of 219 mm, turbulent intensity of 5%, and the oil temperature is maintained at a cold temperature of 35 °C.
- (b)
- Outlet: The hot oil flows into the overflow box initially and then to the outlet pipe, with zero relative pressure.
- (c)
- Walls: The thrust head and mirror plate are set as rotating walls. Based on Table 4, the rotational speed varies between 100 and 500 r/min. The remaining walls are considered to be static without slip.
- (d)
- Temperature: The initial oil temperature in the oil tank is 40 °C. The temperature at the inlet pipe is maintained at 35 °C, whereas the bearing pad temperature ranges from 56 °C to 62 °C, depending on the case.
- (e)
- Oil level: The oil level is initially maintained at 720 mm, which is 20 mm higher than the overflow box.
- (f)
- Calculation: The reference point is at the mid-inlet section, where the pressure is set to 0.3 MPa.
The boundary conditions are illustrated in Figure 8.
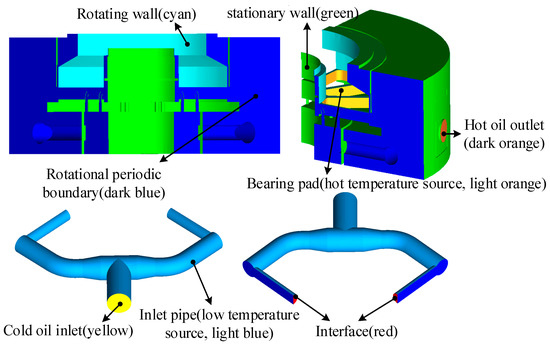
Figure 8.
Boundary condition.
3.7. Model Validation
Although grid independence verification was performed in Section 3.4, it is still necessary to compare the numerical model established in this paper with experimental data to further confirm its reliability and accuracy. A specific point’s pressure value in the oil tank of the thrust bearing is selected as the reference for this comparison. Figure 9 illustrates the comparison of experimental and numerical simulation results. For thrust bearings, the pressure value after achieving calculation stability is −438.58 Pa, while the average pressure obtained from the experiment is −449.7 Pa, resulting in an error of only 2.47%. Thus, the numerical calculation method proposed in this paper can accurately reflect the flow field distribution in the oil tank.
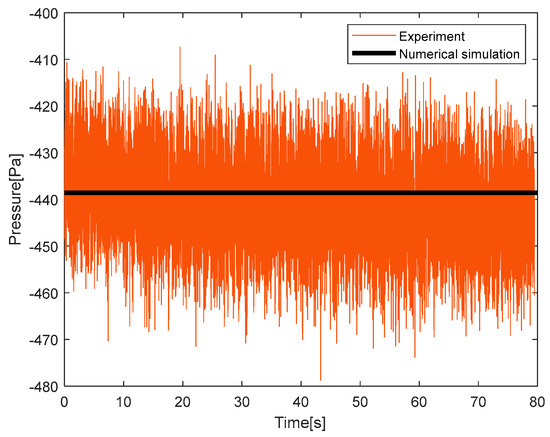
Figure 9.
Comparison of experimental and numerical simulation results.
4. Results and Discussion
4.1. Influence of Temperature Change on Flow Characteristics in the Oil Tank
The change in temperature of the bearing pad under rated speed has a significant implication on the amount of oil evaporation, which, in turn, affects the oil level and mist formation. These two aspects are further elaborated in Section 4.1.1 and Section 4.1.2.
4.1.1. Influence of Temperature Change on the Oil Level
The impact of temperature on the air–oil interface produced on the periodic boundary surface, known as region A in Figure 10b, is thoroughly analyzed. It is observed that the oil level on the periodic boundary surface decreases in a parabolic shape from the outer wall to the oil-retaining ring due to the increase in temperature and evaporation. This shape of the oil level is due to the influence of the centrifugal force generated by the thrust head and mirror plate. The curve depicting the highest pad temperature with transverse distance reveals a larger oil drop, compared to the other two, at Y > −1.45. However, the rate of transverse oil level decline with pad temperature is indistinct near the outer wall and comparable for Y > −1.2 and temperatures lower than 62 °C. Hence, the trend is specific to the position: 0.79 for 62 °C and 0.785 for 60 °C near the outer wall, and 0.767 for 60 °C and 0.751 for 62 °C near the oil-retaining ring. This observation is demonstrated in Figure 10a.
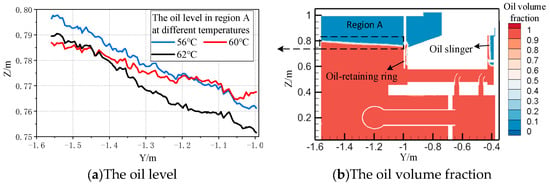
Figure 10.
Curve of oil level change in region A at different pad temperatures.
4.1.2. Influence of Temperature Change on Oil Mist Formation
The impact of temperature extends beyond the oil level, affecting the generation and distribution of oil mist. According to the findings in Figure 11, the volume fraction distribution of oil mist rises with an increase in pad temperature and is concentrated in two areas. The first region is between the thrust head and oil-retaining ring, while the second is within the oil slinger, as a result of the oil’s rotation and deflection from the seal leading to atomization. At the top of the first zone lies the oil cover seal, where oil mist accumulates and expands, causing an external leak owing to the pressure differential. Conversely, the top of the second zone is connected to the atmosphere. Once the oil mist bypasses the deflection due to the oil slinger, it can escape, resulting in an internal oil leak due to the low pressure caused by rotor rotation.

Figure 11.
Diagrams of volume fraction distribution of oil mist in oil tank at different pad temperatures. (a) T = 56 °C; (b) T = 60 °C; and (c) T = 62 °C.
Regarding the distribution, the oil mist rises along the thrust head slope and aggregates between the thrust head and the oil-retaining ring. Moreover, the oil mist amasses considerably beneath the propelled oil zone with the pad temperature, as shown in Figure 11.
Although the current temperature range (54.2–62.6 °C) manages to contain the oil mist, continued operation results in increased accumulation and pressure differential between the inside and outside of the oil tank. As a result of the dynamic and static clearance, there will inevitably be a small gap in the sealing tooth, leading to oil leakage.
4.2. Influence of Speed Change on Flow Characteristics in the Oil Tank
According to Jung K et al. [7], in addition to temperature, the leakage of oil and mist is also related to the unit speed. The impact of unit speed variation (at a temperature of 60 °C) on the lubricating oil level, mist generation, as well as the temperature and velocity of the oil tank, will be discussed below.
4.2.1. Influence of Speed Change on the Oil Level
Figure 12 depicts an enlarged cloud diagram indicating the oil volume fraction at different speeds observed at the periodic boundary surfaces, specifically around the oil slinger (region B) and the oil-retaining ring.
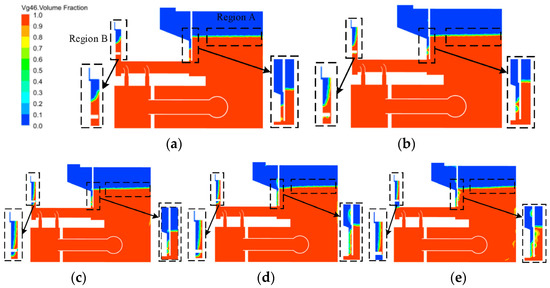
Figure 12.
Cloud diagram of oil volume fraction distribution on periodic boundary surface at different speeds. (a) 100 rpm; (b) 200 rpm; (c) 300 rpm; (d) 400 rpm; (e) 500 rpm.
It can be observed from Figure 12 that the lubricating oil has a tendency to move upwards along the wall of the oil slinger with an increase in unit speed. However, the mist formation around the oil-retaining ring is not significantly affected by the unit speed, although some differences can be seen below the outer tank. Figure 13 provides the oil level with transverse distance for the regions around the oil slinger, and it can be noted that the slope of the oil level around the oil slinger increases with speed, as observed for mist. The oil level curves in this region tend to converge at Y = −0.42, regardless of the speed. The quadratic fitted function appropriately describes the inclination and level difference of these curves (R2 > 0.99), with the quadratic coefficient providing a measure of the opening size of the parabola. This coefficient increases from 25.9 to 1104.2 with the unit speed.
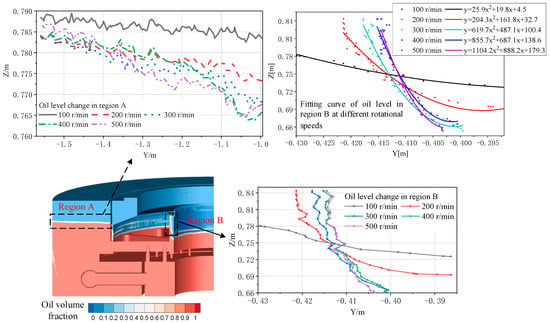
Figure 13.
Oil level curves of region A and region B at different speeds.
For region A, the oil level decreases to some extent with an increase in speed from the outer wall to the oil-retaining ring. The case with the lowest speed exhibits an almost constant highest level with transverse distance. However, the oil level curves with remaining speeds are interconnected, particularly near the outer wall. Figure 14 summarizes the statistics of the oil level to capture the complexities of the phenomenon. It can be noted that the overall fluctuation and level drop around the oil-retaining ring increase with speed augmentation, while the highest level near the outer wall remains almost unchanged.
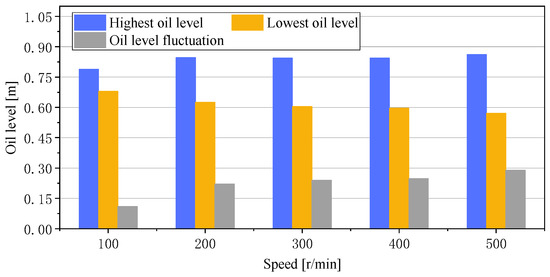
Figure 14.
Bar chart of oil variation in region A at different rotation speeds.
This interesting result can be explained by the increase in the Reynolds number in region B, . Where is the density, is the velocity, is the hydraulic diameter, and is the viscosity. As values exceed 2300, turbulence emerges, agitating the oil and causing its surface to rise, which results in a greater contact area between the oil and air. This, in turn, exacerbates the atomization of the lubricating oil, a conclusion that is in line with the findings of Feng et al. [36]. Furthermore, Liu et al. [37] proposed that the eccentricity between the thrust head and the oil slinger contributes to an uneven oil ring, which generates an eccentric effect on the pump’s performance. This exacerbates oil channeling and increases the likelihood of an internal oil leak.
4.2.2. Effect of Rotational Speed Change on Oil Mist Formation
The impact of unit speed on oil mist is investigated by analyzing the oil vapor volume fraction at three periodic boundary surfaces, namely Region A (around the oil slinger), Region B (between the thrust head and oil-retaining ring), and Region C (below the outer oil tank cover), as depicted in Figure 15. Notably, for Region A, the accumulation of oil mist underneath the deflected zone increases when the speed exceeds 300 rpm. Upon closer inspection of the local diagrams in Figure 15, it is apparent that the oil adheres to the oil slinger, which effectively reduces the tendency for oil to be thrown from the seal.
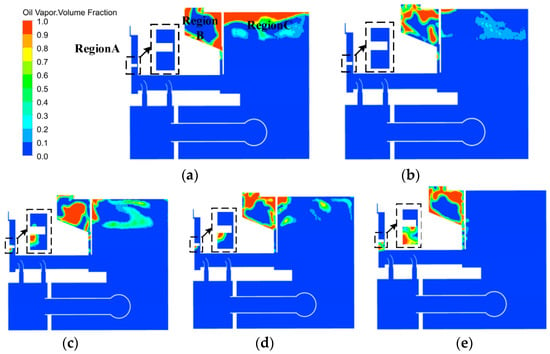
Figure 15.
Cloud diagram of oil mist volume fraction of the periodic boundary surface at different speeds. (a) 100 rpm; (b) 200 rpm; (c) 300 rpm; (d) 400 rpm; (e) 500 rpm.
In contrast to region A, the behavior of oil mist in region C is different. It rises towards the oil tank near the oil-retaining ring and then descends, disappearing towards region B with increasing speed. In region B, the oil mist climbs and tends to adhere homogeneously to the walls of the inner tank for speeds of 100, 400, and 500 rpm, but not for 200 rpm, which is due to the presence of small remnants in region C. However, for a speed of 300 rpm, the oil mist accumulates in the middle of the inner tank cover due to significant remnants in region C. It should be noted that the static seal parts in region C always prevent leakage and are ignored in our analysis.
4.2.3. Influence of Rotating Speed Change on Oil Tank Pressure
Due to the non-sequential nature of oil mist accumulation and leakage, researchers have focused on examining the sealing effectiveness of the seal teeth and thrust head (both static and dynamic components) by analyzing the pressure distribution in the top tank. This pressure distribution is known to have a specific influence on the distribution of oil mist.
Figure 16 illustrates the mixed-phase pressure distribution at different speeds for the periodic boundary surfaces. Specifically, the highest pressure zone is located around the cold oil inlet pipe, followed by the inner oil tank. As the cold oil enters the thrust bearing pad, the pressure of the system tends to decrease, with the lowest pressure zone situated above the oil tank. The pressure around the oil slinger decreases with increasing speed, thereby exacerbating oil mist accumulation. To further investigate the occurrence of leakage, the pressure distributions on the walls near the inner tank cover (curve A) and oil slinger (curve B) are plotted in Figure 17.
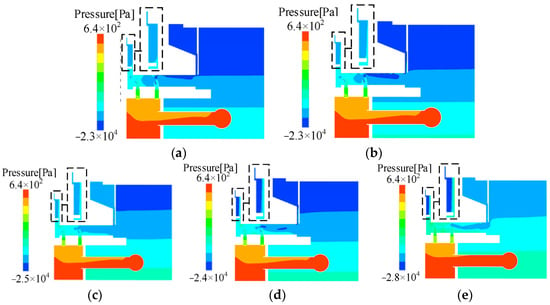
Figure 16.
Pressure distribution cloud diagram on the rotating periodic boundary surface at different speeds. (a) 100 rpm; (b) 200 rpm; (c) 300 rpm; (d) 400 rpm; (e) 500 rpm.
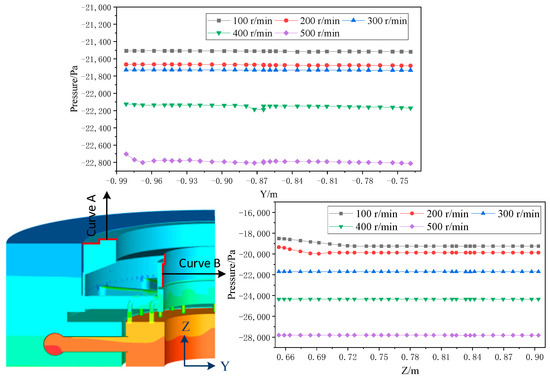
Figure 17.
Pressure distribution diagrams on curves A and B at different speeds.
In summary, the pressure curves in each region exhibit almost constant behavior and decrease with increasing speed, albeit at different rates: 5.95% for curve A and 44.64% for curve B. Notably, when combined with the low−pressure zone around the oil slinger (curve B), an increase in speed results in reduced pressure at the oil mist aggregation region, thus exacerbating the likelihood of leakage. Consequently, augmenting speed promotes more internal leaks rather than external ones.
4.2.4. Effect of Speed Change on Tank Temperature
During the operation of the pump, the heat produced around the thrust-bearing pad has a tendency to rise and spread towards the outer tank cover and subsequently extend to the inner tank and oil slinger regions. This phenomenon is clearly demonstrated in Figure 18 and is more pronounced at higher rotational speeds.
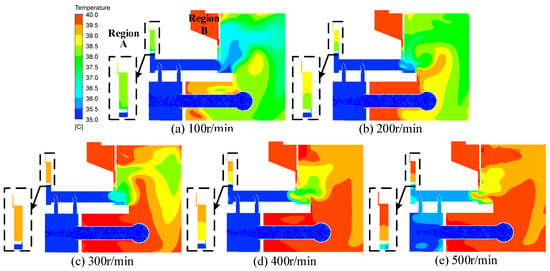
Figure 18.
Temperature cloud diagram on rotating periodic boundary surface at different speeds.
Figure 19 presents temperature profiles of the upper and lower regions of the deflected (oil) zone at different rotational speeds to provide insights into the behavior of the oil slinger. The temperature curve for the lower region remains relatively constant and increases slightly with speed, ranging from 35 to 36.5 °C. Similarly, the upper region also shows a slight increase in temperature with speed, but at higher initial temperature values. The difference between the maximum and minimum temperatures with the maximum speed case is 1.3 °C. Raising the temperature in region A would increase thermal movement and exacerbate oil turbulence. With the added effect of the significant centrifugal force generated by the increase in rotational speed, the likelihood of oil leakage is further increased.
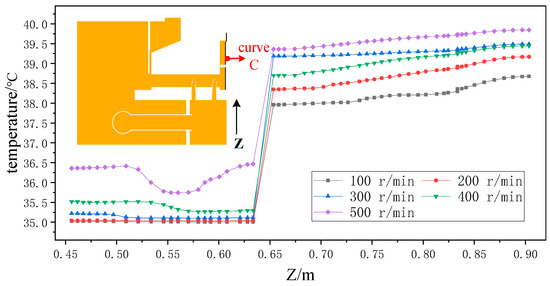
Figure 19.
Temperature change on curve C.
4.2.5. Effect of Rotational Speed on the Flow Velocity of the Oil Tank
The impact of rotational speed on the oil tank’s velocity field in regions A and B is analyzed (refer to Figure 20). Evidently, the velocity is induced from the cold pipe to the injection section, and then to the oil slinger and inner tank regions. With an increase in rotational speed, some of the velocity field from the inner tank, and all of the injection and cold pipes, converge towards the oil slinger.
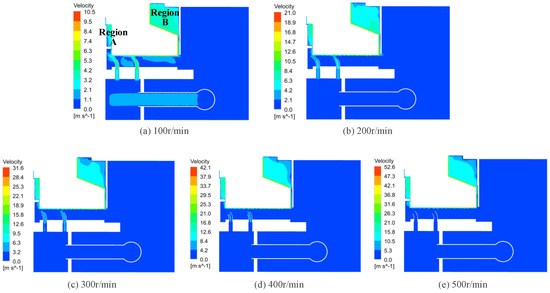
Figure 20.
Velocity distribution diagram of the periodic boundary surface at different speeds.
It is noteworthy that an escalation in rotational speed results in a corresponding increase in the kinetic energy of the oil mist, which collides with rotating parts. This collision leads to the formation of splashing oil droplets, thereby promoting oil mist leaks. Figure 21 presents the velocity around the circumference of the rotating parts, namely, the thrust head and mirror plate. As evidenced, the circumference velocity difference of rotating parts increases with an increase in rotational speed. At 100 r/min, the maximum circumferential velocity difference is 5 m/s, whereas at 500 r/min, it can reach up to 30 m/s. This exacerbates the stirring of lubricating oil in the oil tank’s flow field, the splashing of oil, and the production of oil foam.
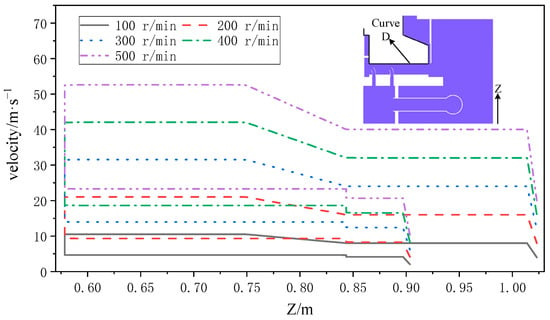
Figure 21.
Velocity change diagram on the circumference of the rotating part.
5. Conclusions
The primary objective of this paper was to investigate the correlation between oil mist leakage in thrust bearings and unit rotational speed in relation to bearing pad temperature. To evaluate the lubrication oil path, a real case numerical approach was employed, which is a valuable step towards effective management of anti-oil-throwing practices. The findings suggest that oil mist formation and accumulations increase with temperature, regardless of the pump rotational speed, and occur in two zones: between the thrust head and the oil-retaining ring, leading to external leaks, and the oil slinger, leading to internal leaks.
In summary, the increase in velocity and temperature will aggravate oil mist formation. Firstly, regarding the influence of temperature, it can be observed that the higher the temperature, the greater the production of oil mist, leading to a greater pressure difference between inside and outside the tank, which increases the likelihood of oil mist leakage. It is equally important to consider the influence of internal and external oil dumping. Secondly, the influence of rotational speed can also be analyzed. While an increase in speed may lead to an increase in the leakage of oil mist, it is more likely to cause the occurrence of internal oil dumping, with a relatively small impact on external oil dumping. Additionally, an increase in speed may also increase the heat production in the tank, leading to an increase in the appearance of oil foam.
This article presents a numerical simulation method for studying the flow field inside a thrust-bearing tank, which not only simulates the distribution of lubricating oil and air, but also determines the generation and pattern of oil mist. However, this study only considers the variation of the flow field inside the thrust-bearing tank under steady-state conditions and does not take into account the transient conditions. In the future, the calculation should consider more factors that affect the generation of oil mist and the transient transition process.
Author Contributions
Writing—original draft preparation, J.S.; writing—review and editing, Y.Z. (Yuquan Zhang); investigation, X.P. and Y.H.; supervision, Y.Z. (Yuan Zheng), X.G. and E.F.-R. All authors have read and agreed to the published version of the manuscript.
Funding
This research was funded by the State Grid Xinyuan Holding Co., Ltd. Technology Project (SGXYKJ-2021-037).
Institutional Review Board Statement
Not applicable.
Informed Consent Statement
Not applicable.
Data Availability Statement
Not applicable.
Acknowledgments
We would like to thank the Hongping pumped-storage power station for providing the thrust-bearing model data.
Conflicts of Interest
The authors declare no conflict of interest.
References
- Li, X.-Z.; Chen, Z.-J.; Fan, X.-C.; Cheng, Z.-J. Hydropower development situation and prospects in China. Renew. Sustain. Energy Rev. 2018, 82, 232–239. [Google Scholar] [CrossRef]
- Wagner, B.; Hauer, C.; Habersack, H. Current hydropower developments in Europe. Curr. Opin. Environ. Sustain. 2019, 37, 41–49. [Google Scholar] [CrossRef]
- Tang, S.; Chen, J.; Sun, P.; Li, Y.; Yu, P.; Chen, E. Current and future hydropower development in Southeast Asia countries (Malaysia, Indonesia, Thailand and Myanmar). Energy Policy 2019, 129, 239–249. [Google Scholar] [CrossRef]
- Hoang, L.P.; van Vliet, M.T.H.; Kummu, M.; Lauri, H.; Koponen, J.; Supit, I.; Leemans, R.; Kabat, P.; Ludwig, F. The Mekong’s future flows under multiple drivers: How climate change, hydropower developments and irrigation expansions drive hydrological changes. Sci. Total Environ. 2019, 649, 601–609. [Google Scholar] [CrossRef]
- Nijssen, J.P.A.; Faludi, J.; van Ostayen, R.A.J. An eco-impact design metric for water lubricated bearings based on anticipatory Life Cycle Assessment. J. Clean. Prod. 2021, 321, 128874. [Google Scholar] [CrossRef]
- Yuan, B.; Zhang, L.; Wang, W. Oil Vapor Treatment of Vertical Hydro-generator Bearing. Hydropower Autom. Dam Monit. 2015, 1, 43–48. [Google Scholar]
- Jung, K.; Jang, G.; Kim, J. Behavior of fluid lubricant and air–oil interface of operating FDBs due to operating condition and seal design. Microsyst. Technol. 2012, 18, 1373–1381. [Google Scholar] [CrossRef]
- Ashour, N.M. An Investigation on Large Thrust Bearings; Military Technical College Kobry Elkobbah: Cairo, Egypt, 2009. [Google Scholar]
- Plante, P.; Soule, E.D.; Energy, F.P.L.; Dupuis, M. Thrust Bearing Retrofit: A Case Study of the Cataract Generating Station; HydroTech: Quebec City, QC, Canada; pp. 1–9. Available online: https://www.electrisa.com.br/fornecedores/hydrotech/mancais-de-escora-informacoes-tecnicas-ingles.pdf (accessed on 15 February 2023).
- Yu, F. Fault analysis of oil-throwing ring of hydraulic guide bearing in Caijiazhou Hydropower Station. Mech. Electr. Inf. 2021, 4, 27–28. [Google Scholar]
- Lan, R.; Wei, H.; Wu, F. Causes and Control Measures of Dust and Oil Mist from Generators in Yantan Hydropower Station. Hongshui River 2016, 35, 96–97+102. [Google Scholar]
- Liu, J.; Deng, G. Oil Splashing Treatment for Thrust Bearing of The No. 2 Unit at Dafa Hydropower Station on Tianwanhe River. Sichuan Water Power 2010, 29, 120–122. [Google Scholar]
- Luo, Y. Remedial Treatment of Oil Leak from Thrust Bearing Oil Retaining Tube in Xiaolangdi Hydroelectric Power Station. Des. Hydroelectr. Power Stn. 2003, 4, 86–89+96. [Google Scholar]
- Sahoo, S.; Mahesh, A.; Panigrahi, A. Impact of contamination by bamboo decomposition and lubricant oil leak and deterioration of Balimela reservoir water standard at Malkangiri of Odisha. Nat. J. Life Sci. 2014, 11, 1–6. [Google Scholar]
- Zhai, L.; Luo, Y.; Wang, Z.; Liu, X. 3D Two-way coupled TEHD analysis on the lubricating characteristics of thrust bearings in pump-turbine units by combining CFD and FEA. Chin. J. Mech. Eng. 2016, 29, 112–123. [Google Scholar] [CrossRef]
- Mo, J.; Gu, C.; Pan, X.; Zheng, S.; Ying, G. A thermohydrodynamic analysis of the self-lubricating bearings applied in gear pumps using computational fluid dynamics method. J. Tribol. 2018, 140, 011102. [Google Scholar] [CrossRef]
- Novotný, P.; Hrabovský, J.; Juračka, J.; Klíma, J.; Hort, V. Effective thrust bearing model for simulations of transient rotor dynamics. Int. J. Mech. Sci. 2019, 157, 374–383. [Google Scholar] [CrossRef]
- Wasilczuk, M.; Rotta, G. On the possibilities of decreasing power loss in large tilting pad thrust bearings. Int. Sch. Res. Not. 2013, 2013, 1–9. [Google Scholar] [CrossRef]
- Zhang, X.; Yin, Z.; Jiang, D.; Gao, G. The design of hydrodynamic water-lubricated step thrust bearings using CFD method. Mech. Ind. 2014, 15, 197–206. [Google Scholar] [CrossRef]
- Untaroiu, A.; Fu, G. An optimum design approach for textured thrust bearing with elliptical-shape dimples using computational fluid dynamics and design of experiments including cavitation. J. Eng. Gas Turbines Power 2017, 139, 092502. [Google Scholar]
- Zhang, S.; Jiang, S.; Lin, X. Static and dynamic characteristics of high-speed water-lubricated spiral-groove thrust bearing considering cavitating and centrifugal effects. Tribol. Int. 2020, 145, 106159. [Google Scholar] [CrossRef]
- Hargreaves, D.J.J.; De Pellegrin, D.V. An isoviscous, isothermal model investigating the influence of hydrostatic recesses on a spring-supported tilting pad thrust bearing. Tribol. Int. 2012, 51, 25–35. [Google Scholar]
- Pang, J.; Liu, H.; Liu, X.; Ren, M.; Zhang, P.; Yu, Z. Analysis on the Causes of Oil Mist in the Lower Guide Bearings of Hydrogenerator Units. J. Eng. Themal Energy Power 2021, 36, 13–19. [Google Scholar]
- Chen, Z.; Yu, B.; Zhang, H. Pressure Distribution of Hydraulic Turbine Guide Bearing Rotating Sump. Large Electr. Mach. Hydraul. Turbine 2010, 2, 57–60. [Google Scholar]
- Deng, Y.; Xu, J.; Yang, L.; Fneg, G. Numerical simulation and experimental research on oil mist overflowing for a giant hydropower generator. Energy Sources Part A Recovery Util. Environ. Eff. 2019, 41, 2346–2355. [Google Scholar] [CrossRef]
- Lu, D. Flow-Field Analysis and Structure Optimization of Oil Sump in Thrust Bearing of Large-Scale Water Turbine Generator; Harbin Institute of Technology: Harbin, China, 2010. [Google Scholar]
- Zou, L.; Tang, C.; Gu, X.; Chen, C. Comparative analysis of external circulation cooling methods of thrust bearing in a large hydropower plant. Mech. Electr. Tech. Hydropower Stn. 2020, 43, 4–6. [Google Scholar]
- Fadhl, B.; Wrobel, L.C.; Jouhara, H. Numerical modelling of the temperature distribution in a two-phase closed thermosyphon. Appl. Therm. Eng. 2013, 60, 122–131. [Google Scholar] [CrossRef]
- Shi, X.; Wang, Y.; Chen, G.; Zhang, X.; Mei, X. Numerical Simulation of Flow and Heat Transfer of Heat Pipe Used for Stator Cooling of Motorized Spindle. J. Xi’an Jiaotong Univ. 2021, 55, 60–67. [Google Scholar]
- Zhang, C. Size Optimization of Thrust Bearing Oil Groove of Hydro-Generator Unit Based on CFD; Changchun Institute of Technology: Changchu, China, 2020. [Google Scholar]
- Zhang, Y. CFD Analysis on Evaporation during Refueling; Jiangsu University: Zhenjiang, China, 2017. [Google Scholar]
- Hu, Z. Research on Two-Phase Flow Characteristics of Oil-Gas in Aero-Engine Bearing Chamber; Shenyang Aerospace University: Shenyang, China, 2020. [Google Scholar]
- Sun, B. Numerical Simulation of Splash Lubrication Oil Quantity Imbalance between Two Columns of Cylinder in a V-Type Diesel Engine; Dalian University of Technology: Dalian, China, 2018. [Google Scholar]
- Lee, W.H. A Pressure Iteration Scheme for Two-Phase Flow Modeling; Hemisphere Publishing: Washington, DC, USA, 1980. [Google Scholar]
- Zhao, Y. Research on Anti-Oil Mist Escape Device of Thrust Bearing of Mianhuatan Hydropower Station; Changchun Institute of Technology: Changchun, China, 2020. [Google Scholar]
- Ou, S.; Feng, J. Analysis and Solution of Bearing Oil Dumping in Chongqing Jiangkou Hydropower Station No.3 Unit. Mech. Eng. 2020, 4, 122–123+127. [Google Scholar]
- Liu, Q. Failure and treatment of generator oil dump. Heilongjiang Sci. 2014, 5, 187. [Google Scholar]
Disclaimer/Publisher’s Note: The statements, opinions and data contained in all publications are solely those of the individual author(s) and contributor(s) and not of MDPI and/or the editor(s). MDPI and/or the editor(s) disclaim responsibility for any injury to people or property resulting from any ideas, methods, instructions or products referred to in the content. |
© 2023 by the authors. Licensee MDPI, Basel, Switzerland. This article is an open access article distributed under the terms and conditions of the Creative Commons Attribution (CC BY) license (https://creativecommons.org/licenses/by/4.0/).