
Testing Food Waste Reduction Targets: Integrating Transition Scenarios with Macro-Valuation in an Urban Living Lab


 ,
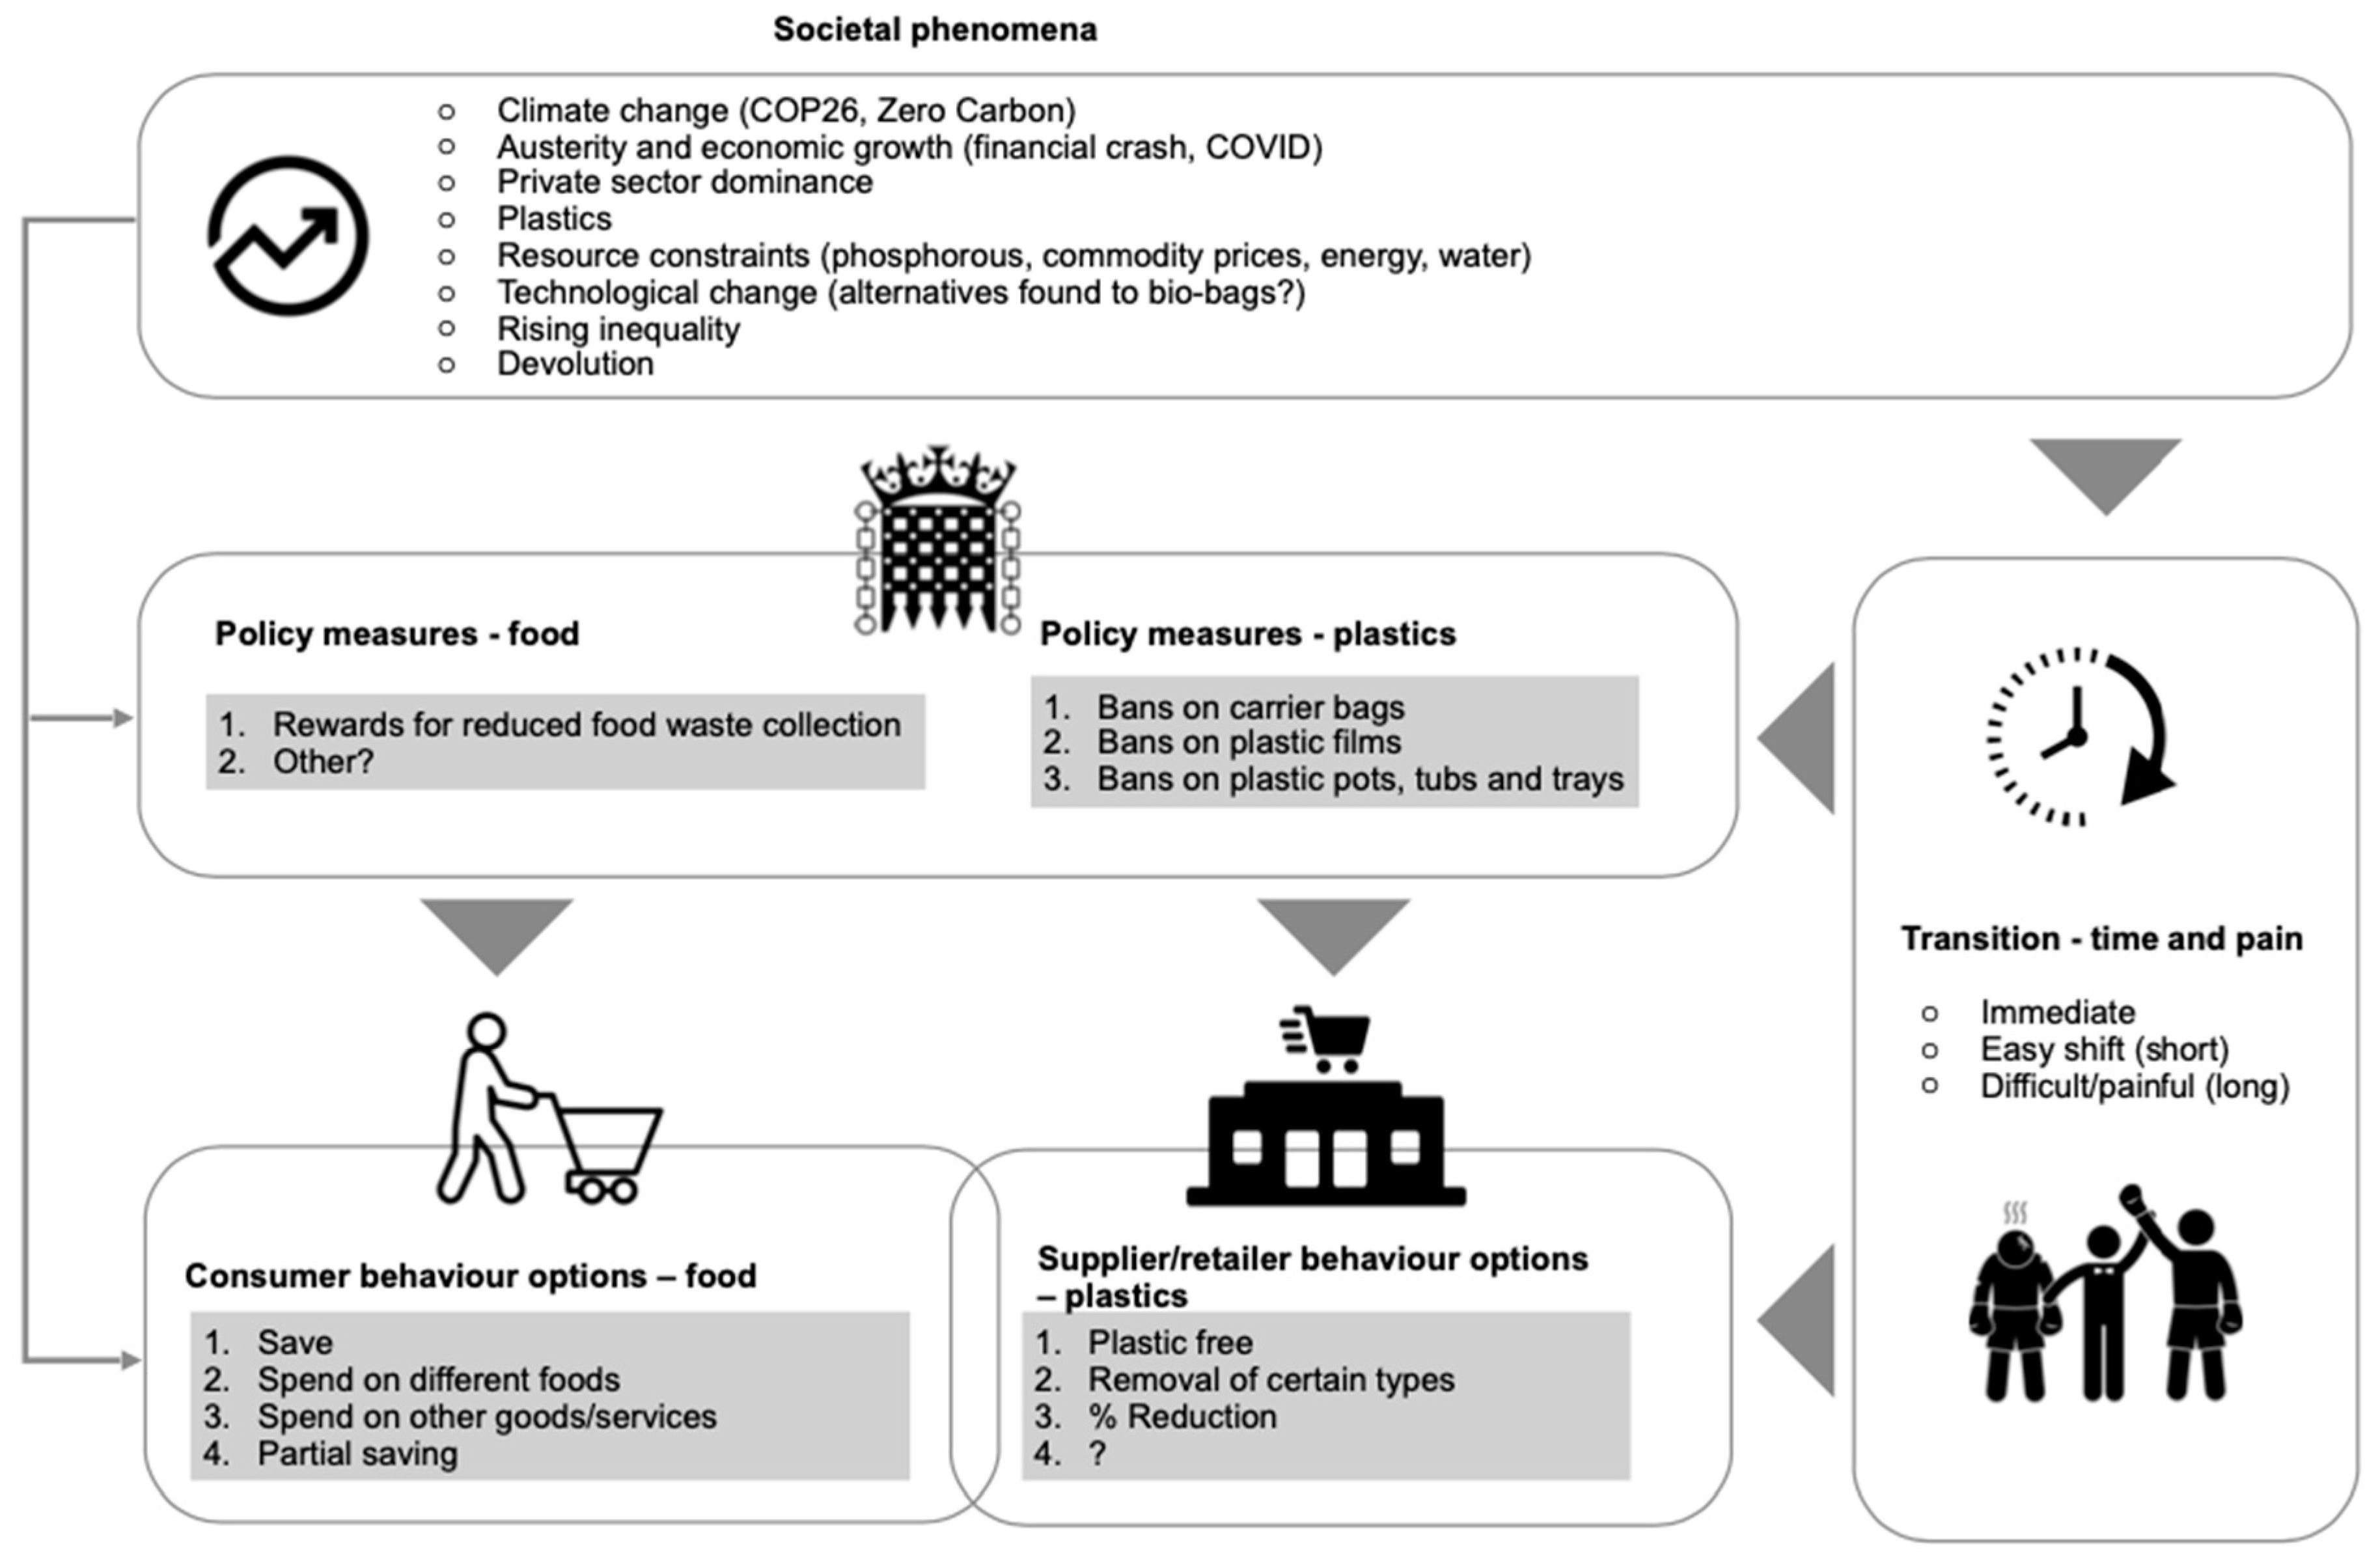
,  ,
,
Abstract
1. Introduction
- What are the consequences to different sectors and the city’s climate targets, both intended and unintended, of achieving the One City Plan targets?
- Who are the likely winners and losers (and barriers to change)?
- Might we acquire a sense of the scale of those impacts?
- What are the carbon implications of these changes, and how are wider socioenvironmental implications robustly accounted for?
- What does this mean for policy, both locally at the city level, and nationally?
- Is this valuation approach useful and robust? What more is needed?
2. Materials and Methods
2.1. Problem Identification through Participatory Action Research
- The amount of unnecessary food waste (i.e., the need to reduce “avoidable” food waste);
- The need to improve rates of recycling (i.e., minimising the food waste that goes into the “residual” waste bins);
- Deteriorating soil quality (locally, nationally, and internationally) and lack of quality compost (which links to the nutrients in sewage, environmental impacts from overuse and geopolitical concerns regarding long-term phosphorous supply) [45];
- Waste of precious resources, whether finite, made unavailable, or transferred to the “wrong place” (i.e., energy used unnecessarily and carbon emissions from the production and transport of wasted food; unhealthy concentrations of resources leading to pollution; resources flowing in to the sea where they cannot be recaptured; resources bound chemically to improve water quality unavailable for food growing; resources contaminated with plastics being unusable) [46];
- Plastic in the food waste (e.g., wet wipes and other plastics in sewage; food caddy liners, though biodegradable, being harder to remove from food waste).
2.2. Data: Household and Commercial Food Waste (HFW/CFW)
2.3. Developing Scenarios
3. Results
- Tax revenue: Here we consider only the changes in the taxes levied during production (e.g., not consumer taxes paid by households and import tariffs). In all four scenarios, tax revenue collected from the production activities in a year is reduced to some extent, except the clothing and tourism sectors, which pay more taxes in both re-spending scenarios (R20 and R15). The largest loss of £0.1 million is found in the N20 scenario where the WRAP 2025 target is achieved, and re-spending is not considered. Even in this scenario, the total loss of tax revenue is trivial compared to the reduced demand for goods of £2 million. If regions other than Bristol copy the same pattern in the coming decades, then the loss at the national amounts to £270 million (0.1 × 30 × 90) from 2020 to 2050 in this worst scenario (N20). Although taxes from only two sectors increase, the increase overweighs and makes the total taxes increase slightly in both re-spending scenarios (R20 and R15);
- Labour income: Labour income reduces overall—represented by “compensation of employees”—in all four scenarios except the Clothing and Tourism sectors in the two re-spending scenarios (R20 and R15). When households re-spend their savings (from reduced food spending), the labour income increases in those other sectors due to increased production activities; in particular, the relative labour intensity of the tourism service industries means that the increase in labour income in the sector benefitting from the re-spending is strong enough to cancel out the decrease in the food sector;
- Income of capital owners: We assume an operating surplus from production activities is obtained by capital owners. As indicated by the gross operating surplus in Table 6, capital owners also receive losses when no re-spending is considered (N20 and N15). This is natural as less production activities reduce the utility of already equipped capital assets within the food and other sectors. On the contrary, when re-spending is considered as well (R20 and R15), capital owners receive more income as a whole, mainly due to more operating surplus from tourism and other sectors we are not focused on.
4. Discussion
- If there is a reduction in overall food consumption (either no or reduced re-spending), this would lead to an equivalent and relatively significant decrease in economic activity, which would inevitably impact the food sectors and associated employees the most, given the relatively higher employment rates in the food sector (retail, logistics) compared to the other sectors;
- If the savings are fully re-spent on alcohol, clothing, and tourism services (for example)—which logic would suggest is far more likely than a no re-spend scenario—it would lead to an overall increase in economic activity, with associated benefits to those sectors’ employees and capital owners in addition to tax revenues (albeit a comparatively more modest uplift compared to the reduction).
- Firstly, and perhaps most importantly, the current macro-economic landscape appears to be promoting clear and harmful resource inefficiencies, suggesting government policy and market failure;
- Secondly, central government intervention would likely be necessary to prepare for potential income losses in the food and plastic production sectors caused by the reduction in food waste, including those employees who may need improved employment opportunities or support (e.g., entrepreneurship in high value food production), even if gradual over a given period;
- Thirdly, given the potential benefits to other sectors and overall potential increase in domestic economic activity (with full re-spending), support for better food, aiming for zero waste, may be sought from those who substantially benefit outside the food sector.
5. Conclusions
Supplementary Materials
Author Contributions
Funding
Institutional Review Board Statement
Informed Consent Statement
Data Availability Statement
Acknowledgments
Conflicts of Interest
References
- Bristol City Council. One City Plan 2021; Bristol City Council: Bristol, UK, 2021.
- Bristol Green Capital Partnership. European Green Capital Award 2015. Bristol City Council. Bristol. Available online: https://bristolgreencapital.org/who-we-are/european-green-capital-award/ (accessed on 21 February 2023).
- Bristol City Council. Climate Change. Bristol City Council. Bristol. Available online: https://www.bristolonecity.com/climate/#:~:text=The%20city%20established%20an%20independent,climate%20resilient%20city%20by%202030 (accessed on 21 February 2023).
- Bristol City Council. Bristol’s Ecological Emergency. Bristol City Council. Bristol. Available online: https://www.bristol.gov.uk/council-and-mayor/policies-plans-and-strategies/energy-and-environment/bristol-ecological-emergency (accessed on 21 February 2023).
- Bristol City Council. Corporate Strategy. Bristol City Council. Bristol. Available online: https://www.bristol.gov.uk/council-and-mayor/policies-plans-and-strategies/corporate-strategy (accessed on 21 February 2023).
- Dasgupta, S. Cutting Global Carbon Emissions: Where Do Cities Stand? World Bank: Washington, DC, USA, 2022. [Google Scholar]
- World Bank Group. World Bank Group Climate Change Action Plan 2021–2025; World Bank: Washington, DC, USA, 2021. [Google Scholar]
- UN Environment Programme. Cities and Climate Change; 2023; Available online: https://www.unep.org/explore-topics/resource-efficiency/what-we-do/cities/cities-and-climate-change (accessed on 18 March 2023).
- International Resource Panel. The Weight of Cities: Resource Requirements of Future Urbanization; United Nations Environment Programme: Nairobi, Kenya, 2018. [Google Scholar]
- IHME. Global Burden of Disease (GBD); Institute for Health Metrics and Evaluation, University of Washington: Seattle, WA, USA, 2023. [Google Scholar]
- Black, D.; Pilkington, P.; Williams, B.; Ige, J.; Prestwood, E.; Hunt, A.; Eaton, E.; Scally, G. Overcoming Systemic Barriers Preventing Healthy Urban Development in the UK: Main Findings from Interviewing Senior Decision-Makers during a 3-Year Planetary Health Pilot. J. Urban Health 2021, 98, 415–427. [Google Scholar] [CrossRef] [PubMed]
- Eaton, E.; Hunt, A.; Black, D. Developing and testing an environmental economics approach to the valuation and application of urban health externalities. Front. Public Health 2023, 11, 1070200. [Google Scholar] [CrossRef]
- Marmot, M. The Health Gap: The Challenge of an Unequal World; Bloomsbury: London, UK, 2015. [Google Scholar]
- Woodruff, R.C.; Haardörfer, R.; Raskind, I.G.; Hermstad, A.; Kegler, M.C. Comparing food desert residents with non-food desert residents on grocery shopping behaviours, diet and BMI: Results from a propensity score analysis. Public Health Nutr. 2020, 23, 806–811. [Google Scholar] [CrossRef] [PubMed]
- Morris, A.A.; McAllister, P.; Grant, A.; Geng, S.; Kelli, H.M.; Kalogeropoulos, A.; Quyyumi, A.; Butler, J. Relation of Living in a “Food Desert” to Recurrent Hospitalizations in Patients with Heart Failure. Am. J. Cardiol. 2019, 123, 291–296. [Google Scholar] [CrossRef]
- Morris, A.L.; Guégan, J.-F.; Andreou, D.; Marsollier, L.; Carolan, K.; Le Croller, M.; Sanhueza, D.; Gozlan, R.E. Deforestation-driven food-web collapse linked to emerging tropical infectious disease, Mycobacterium ulcerans. Sci. Adv. 2016, 2, e1600387. [Google Scholar] [CrossRef] [PubMed]
- Pacheco, A.; Meyer, C. Land tenure drives Brazil’s deforestation rates across socio-environmental contexts. Nat. Commun. 2022, 13, 5759. [Google Scholar] [CrossRef] [PubMed]
- Adams, E.L.; Raynor, H.A.; Thornton, L.M.; Mazzeo, S.E.; Bean, M.K. Nutrient Intake during School Lunch in Title I Elementary Schools with Universal Free Meals. Health Educ. Behav. 2021, 49, 118–127. [Google Scholar] [CrossRef]
- Taylor, A. England’s free school meals scheme should be expanded to help more children living in poverty. BMJ 2022, 379, o2640. [Google Scholar] [CrossRef]
- Natural Capital Committee. Final Response to the 25 Year Environment Plan Progress Report; Office for Environmental Protection: London, UK, 2020.
- Ragusa, A.; Lelli, V.; Fanelli, G.; Svelato, A.; D’Avino, S.; Gevi, F.; Santacroce, C.; Catalano, P.; Rongioletti, M.C.A.; De Luca, C.; et al. Plastic and Placenta: Identification of Polyethylene Glycol (PEG) Compounds in the Human Placenta by HPLC-MS/MS System. Int. J. Mol. Sci. 2022, 23, 12743. [Google Scholar] [CrossRef]
- Aspray, T.J.; Dimambro, M.E.; Steiner, H.J. Investigation into Plastic in Food Waste Derived Digestate and Soil. Available online: https://www.sepa.org.uk/media/327640/investigation-into-plastic-in-food-waste-derived-digestate-and-soil.pdf (accessed on 17 March 2023).
- Stern, N. Building on Success and Learning from Experience. An Independent Review of the Research Excellence Framework; Department for Business, Energy & Industrial Strategy: London, UK, 2016; p. 56. [Google Scholar]
- Black, D.; Charlesworth, S.; Poz, M.E.D.; Francisco, E.C.; Paytan, A.; Roderick, I.; von Wirth, T.; Winter, K. Comparing Societal Impact Planning and Evaluation Approaches across Four Urban Living Labs (in Food-Energy-Water Systems). Sustainability 2023, 15, 5387. [Google Scholar] [CrossRef]
- ZWIA. Zero Waste Definition. Available online: https://zwia.org/zero-waste-definition/ (accessed on 18 March 2023).
- Ellen Macarthur Foundation. The Circular Economy in Detail: Deep Dive. Available online: https://ellenmacarthurfoundation.org/the-circular-economy-in-detail-deep-dive#:~:text=A%20circular%20economy%20is%20a,the%20consumption%20of%20finite%20resources (accessed on 18 March 2023).
- Bammer, G. Disciplining Interdisciplinarity: Integration and Implementation Sciences for Researching Complex Real-World Problems; ANU Press: Canberra, Australia, 2013. [Google Scholar] [CrossRef]
- British Academy. Crossing Paths: Interdisciplinary Institutions, Careers, Education and Applications; British Academy: London, UK, 2016. [Google Scholar]
- Black, D.B.G.; Ayres, S.; Bondy, K.; Callway, R.; Carhart, N.; Coggon, J.; Gibson, A.; Hunt, A.; Rosenberg, G. Operationalising a large research programme tackling complex urban and planetary health problems: A case study approach to critical reflection. Sustain. Sci. 2023. [Google Scholar]
- Black, D.; Scally, G.; Orme, J.; Hunt, A.; Pilkington, P.; Lawrence, R.; Ebi, K. Moving Health Upstream in Urban Development: Reflections on the Operationalization of a Transdisciplinary Case Study. Glob. Chall. 2018, 3, 1700103. [Google Scholar] [CrossRef] [PubMed]
- JPI Urban Europe. Sustainable Urbanisation Global Initiative (SUGI)/Food-Water-Energy Nexus. Available online: https://jpi-urbaneurope.eu/calls/sugi/ (accessed on 17 March 2023).
- UKPRP. The UK Prevention Research Partnership (UKPRP): Vision, Objectives and Rationale. 2018. Swindon, UK. Available online: https://ukprp.org/wp-content/uploads/2019/08/UKPRP-Background-and-Rationale.pdf (accessed on 20 March 2023).
- Urban Europe. Urban Living Labs in JPI Urban Europe. Available online: https://jpi-urbaneurope.eu/urbanlivinglabs/ (accessed on 18 March 2023).
- Waste Few Ull. Waste Few Ull Urban Living Labs. Available online: https://wastefewull.weebly.com/urban-living-labs.html (accessed on 21 February 2023).
- Eaton, E.; Hunt, A.; Di Leo, A.; Black, D.; Frost, G.; Hargreaves, S. What Are the Environmental Benefits and Costs of Reducing Food Waste? Bristol as a Case Study in the WASTE FEW Urban Living Lab Project. Sustainability 2022, 14, 5573. [Google Scholar] [CrossRef]
- Loorbach, D.; Frantzeskaki, N.; Avelino, F. Sustainability Transitions Research: Transforming Science and Practice for Societal Change. Annu. Rev. Environ. Resour. 2017, 42, 599–626. [Google Scholar] [CrossRef]
- Shell. New Lens Scenarios: A Shift in Perspective for a World in Transition; 2013. Shell International BV. Available online: https://www.shell.com/energy-and-innovation/the-energy-future/scenarios/what-are-the-previous-shell-scenarios/new-lenses-on-the-future.html#vanity-aHR0cHM6Ly93d3cuc2hlbGwuY29tL2VuZXJneS1hbmQtaW5ub3ZhdGlvbi90aGUtZW5lcmd5LWZ1dHVyZS9zY2VuYXJpb3MvbmV3LWxlbnNlcy1vbi10aGUtZnV0dXJlLmh0bWw (accessed on 20 March 2023).
- Hoolohan, C.; McLachlan, C.; Larkin, A. ‘Aha’ moments in the water-energy-food nexus: A new morphological scenario method to accelerate sustainable transformation. Technol. Forecast. Soc. Chang. 2019, 148, 119712. [Google Scholar] [CrossRef]
- Castellani, B.; Hafferty, F.W. Sociology and Complexity Science: A New Field of Enquiry; Springer: Berlin/Heidelberg, Germany, 2009. [Google Scholar]
- GENeco. Sustainable Solutions for Your Waste. Available online: https://www.geneco.uk.com/ (accessed on 21 February 2023).
- Bristol Waste. About Bristol Waste. Available online: https://bristolwastecompany.co.uk/household/about-bristol-waste/ (accessed on 18 March 2023).
- Resource Futures. Creating a Sustainable World. Available online: https://www.resourcefutures.co.uk/ (accessed on 18 March 2023).
- Bristol Food Network. Bristol Food Network. Available online: https://www.bristolfoodnetwork.org/ (accessed on 18 March 2023).
- CSE. About Us. Available online: https://www.cse.org.uk/about-us (accessed on 18 March 2023).
- Approaching peak phosphorus. Nat. Plants 2022, 8, 979. [CrossRef]
- Beck, M.B.; Das, D.K.; Thompson, M.; Chirisa, I.; Eromobor, S.; Kubanza, S.; Rewal, T.; Burger, E. Cities as Forces for Good in the Environment: A Systems Approach. In Systems Analysis Approach for Complex Global Challenges; Springer: Cham, Switzerland, 2018. [Google Scholar] [CrossRef]
- WRAP. Estimates of Food Surplus and Waste Arisings in the UK. 2017. Available online: https://wrap.org.uk/resources/report/estimates-food-surplus-and-waste-arisings-uk-2017 (accessed on 21 February 2023).
- WRAP. Methods Used for Household Food and Drink Waste in the UK 2012; WRAP: London, UK, 2012. [Google Scholar]
- WRAP. Household Food and Drink Waste in the United Kingdom 2012; WRAP: London, UK, 2012. [Google Scholar]
- WRAP. Comparing the Costs of Alternative Waste Treatment Options; Gate Fees 2021/22 Report; WRAP: London, UK, 2022. [Google Scholar]
- Bell, S.; Morse, S. How People Use Rich Pictures to Help Them Think and Act. Syst. Pract. Action Res. 2012, 26, 331–348. [Google Scholar] [CrossRef]
- Bristol Waste. Campaigns. Available online: https://bristolwastecompany.co.uk/household/campaigns/ (accessed on 18 March 2023).
- BIT. Reducing Food Waste. Available online: https://www.bi.team/blogs/reducing-food-waste/ (accessed on 18 March 2023).
- Kallbekken, S.; Sælen, H. ‘Nudging’ hotel guests to reduce food waste as a win–win environmental measure. Econ. Lett. 2013, 119, 325–327. [Google Scholar] [CrossRef]
- Government Office for Science. Food Waste: A Response to the Policy Challenge; Government Office for Science: London, UK, 2017.
- Sustain. Unpicking Food Prices: Where Does Your Food Pound Go, and Why Do Farmers Get so Little? Sustain: London UK, 2022. [Google Scholar]
- Leontief, W.W. Quantitative Input and Output Relations in the Economic Systems of the United States. Rev. Econ. Stat. 1936, 18, 105. [Google Scholar] [CrossRef]
- Albizzati, P.F.; Rocchi, P.; Cai, M.; Tonini, D.; Astrup, T.F. Rebound effects of food waste prevention: Environmental impacts. Waste Manag. 2022, 153, 138–146. [Google Scholar] [CrossRef]
- Wei, T.; Wang, X. Rebound Effect from Income Savings Due to an Energy Efficiency Improvement by Households: An Input–Output Approach. Energies 2020, 13, 4044. [Google Scholar] [CrossRef]
- Ruiz-Peñalver, S.M.; Rodríguez, M.; Camacho, J.A. A waste generation input output analysis: The case of Spain. J. Clean. Prod. 2019, 210, 1475–1482. [Google Scholar] [CrossRef]
- ONS. Dataset: UK Input-Output Analytical Tables—Product by Product. Available online: https://www.ons.gov.uk/economy/nationalaccounts/supplyandusetables/datasets/ukinputoutputanalyticaltablesdetailed (accessed on 16 March 2023).
- ONS. Atmospheric Emissions: Greenhouse Gases by Industry and Gas; Office for National Statistics: London, UK, 2022.
- Meadows, D.H.; Club of Rome. The Limits to Growth: A Report for the Club of Rome’s Project on the Predicament of Mankind; Universe Books: New York, NY, USA, 1972; 205p. [Google Scholar]
- Daly, H.E. Steady-State Economics: The Economics of Biophysical Equilibrium and Moral Growth; W. H. Freeman: San Francisco, CA, USA, 1977; 185p. [Google Scholar]
- Jackson, T. Prosperity without Growth: Economics for a Finite Planet, Pbk. ed.; Earthscan: London, UK; Washington, DC, USA,, 2011; 276p. [Google Scholar]
- Jackson, T. Prosperity without Growth: Foundations for the Economy of Tomorrow, 2nd ed.; Routledge, Taylor & Francis Group: London, UK; New York, NY, USA, 2017; 310p. [Google Scholar]
- Nordhaus, W.D. The Climate Casino: Risk, Uncertainty, and Economics for a Warming World; Yale University Press: New Haven, CT, USA, 2013; 378p. [Google Scholar]
- Raworth, K. Donut Economics: How to Think like a 21st-Century Economist; Cornerstone Digitial: Sevenoaks, UK, 2017. [Google Scholar]
- Carney, M. Values: An Economist’s Guide to Everything that Matters; HarperCollins Publishers: London, UK, 2021; ISBN 9780008421199. [Google Scholar]
- Gardner, G. The City: A System of Systems. In State of the World; Island Press: Washington, DC, USA, 2016. [Google Scholar] [CrossRef]
- Mensah, P.; Katerere, D.; Hachigonta, S.; Roodt, A. Systems Analysis Approach for Complex Global Challenges; Springer: Cham: Switzerland, 2018. [Google Scholar] [CrossRef]
- Carey, G.; Malbon, E.; Carey, N.; Joyce, A.; Crammond, B.; Carey, A. Systems science and systems thinking for public health: A systematic review of the field. BMJ Open 2015, 5, e009002. [Google Scholar] [CrossRef] [PubMed]
- Kay, J.A.; King, M.A. Radical Uncertainty: Decision-Making beyond the Numbers, 1st ed.; W. W. Norton & Company: New York, NY, USA, 2020; 528p. [Google Scholar]
- Cairney, P. Understanding Public Policy; Bloomsbury Publication: London, UK, 2012. [Google Scholar] [CrossRef]
- Kickbusch, I.; Allen, L.; Franz, C. The commercial determinants of health. Lancet Glob. Health 2016, 4, e895–e896. [Google Scholar] [CrossRef] [PubMed]
- Power Knot. Six Reasons Anaerobic Digesters Aren’t as Environmentally Friendly as You Think. Available online: https://powerknot.com/2021/03/01/6-reasons-anaerobic-digesters-arent-as-environmentally-friendly-as-you-think/ (accessed on 18 March 2023).
- Helm, D. Going Backwards—The Retreat from Environmental Commitments. Available online: http://www.dieterhelm.co.uk/natural-capital/environment/going-backwards-the-retreat-from-environmental-commitments/ (accessed on 18 March 2023).
- Resource Futures. Food Waste Collaboration Helps Secure Bristol’s Gold Sustainable Food City Award. Available online: https://www.resourcefutures.co.uk/food-waste-collaboration-helps-secure-bristols-gold-sustainable-food-cities-award/ (accessed on 18 March 2023).


| Tonnes per Year | |
|---|---|
| Recycled via caddy—avoidable | 7868 |
| Recycled via caddy—non-avoidable | 5792 |
| Food waste in residual—avoidable | 16,194 |
| Food waste in residual—non avoidable | 3247 |
| Sewer—avoidable | 7773 |
| Sewer—non avoidable | 3331 |
| Composting—avoidable | 2487 |
| Composting—non avoidable | 1066 |
| Other—avoidable | 149 |
| Other—non avoidable | 64 |
| Total | 47,972 |
| Waste Types | Tonnes | Total Value (£ million) | Treatment Costs (£1000) |
|---|---|---|---|
| Total residential waste | 77,761 | ||
| Of which: food waste | 47,972 | ||
| - Avoidable | 33,580 | 99.2 | |
| - Recycled (AD) | 13,660 | 478 | |
| - Residual (EfW) | 19,440 | 1808 | |
| - Home composted | 3553 | ||
| - Sewer | 11,105 | ||
| - Other | 213 |
| Commercial Food Waste Stream | Financial (p.a.) | Million Tonnes (p.a.) | Financial per Tonne | Financial (p.a.) | Tonnes |
|---|---|---|---|---|---|
| £ bn | Mt | £/t | £ million | t | |
| Region | UK | Bristol | |||
| Manufacture | 1.2 | 1.7 | 706 | 13.562 | 19,212 |
| Retail & wholesale | 0.8 | 0.3 | 2667 | 9.041 | 3390 |
| Hospitality and food service | 2.5 | 0.92 | 2717 | 28.253 | 10,397 |
| Total | 4.5 | 2.92 | 6090 | 50.856 | 33,000 |
| Scenario Name | N20 | R20 | N15 | R15 |
|---|---|---|---|---|
| Food waste reduction (Bristol 2015–2025) | Food waste reduced by 20% during 2015–2025 (or 2.2% yearly) (WRAP 2025 target) | as N20 | Food waste is reduced by 15% during 2015–2025 (or 1.6% yearly) (Following 2007–2015 trend) | as N15 |
| Re-spending on other goods | No re-spending on alcohol, clothing, and tourism | Savings are re-spent on alcohol, clothing, and tourism | No re-spending on alcohol, clothing, and tourism | Savings are re-spent on alcohol, clothing, and tourism |
| Scenario | N20 (20%, No Re-Spending) | R20 (20%, with Re-Spending) | N15 (15%, No Re-Spending) | R15 (15%, with Re-Spending) |
|---|---|---|---|---|
| Food | −1746.7 | −1739.1 | −1270.3 | −1264.8 |
| Alcohol | −24.0 | −15.1 | −17.5 | −11.0 |
| Clothing | −0.6 | 10.3 | −0.4 | 7.5 |
| Plastic | −4.7 | −4.7 | −3.4 | −3.4 |
| Energy | −18.7 | −18.7 | −13.6 | −13.6 |
| Water | −0.4 | −0.4 | −0.3 | −0.3 |
| Waste | −1.7 | −1.7 | −1.3 | −1.3 |
| Tourism (e.g., transport, hotel) | −84.6 | 2116.7 | −61.5 | 1539.4 |
| Others | −151.8 | −151.8 | −110.4 | −110.4 |
| Total | −2033.3 | 195.2 | −1478.8 | 142.0 |
| Scenario | N20 (20%, No Re-Spending) | R20 (20%, with Re-Spending) | N15 (15%, No Re-Spending) | R15 (15%, with Re-Spending) |
|---|---|---|---|---|
| Food | −955.2 | −921.5 | −694.7 | −670.2 |
| Alcohol | −29.3 | −21.1 | −21.3 | −15.4 |
| Clothing | −1.4 | 5.5 | −1.0 | 4.0 |
| Plastic | −11.7 | −5.8 | −8.5 | −4.2 |
| Energy | −46.8 | −20.9 | −34.0 | −15.2 |
| Water | −2.5 | −1.6 | −1.8 | −1.2 |
| Waste | −4.3 | −1.7 | −3.1 | −1.2 |
| Tourism | −175.0 | 1186.5 | −127.2 | 862.9 |
| Others | −430.7 | 40.2 | −313.2 | 29.3 |
| Total | −1656.8 | 259.6 | −1204.9 | 188.8 |
| Scenario | N20 (20%, No Re-Spending) | R20 (20%, with Re-Spending) | N15 (15%, No Re-Spending) | R15 (15%, with Re-Spending) |
|---|---|---|---|---|
| Taxes | −105.8 | 27.6 | −77.0 | 20.1 |
| - Food | −70.5 | −69.8 | −51.3 | −50.8 |
| - Alcohol | −1.3 | −0.9 | −0.9 | −0.7 |
| - Clothing | −0.0 | 0.1 | −0.0 | 0.1 |
| - Plastic | −0.4 | −0.2 | −0.3 | −0.1 |
| - Energy | −5.3 | −2.1 | −3.9 | −1.5 |
| - Water | −0.3 | −0.2 | −0.2 | −0.2 |
| - Waste | −0.4 | −0.1 | −0.3 | −0.1 |
| - Tourism | −8.7 | 99.2 | −6.3 | 72.1 |
| - Others | −19.0 | 1.7 | −13.8 | 1.2 |
| Compensation of employees | −986.8 | 138.6 | −717.6 | 100.8 |
| - Food | −595.7 | −573.5 | −433.2 | −417.1 |
| - Alcohol | −12.1 | −8.7 | −8.8 | −6.3 |
| - Clothing | −1.0 | 3.7 | −0.7 | 2.7 |
| - Plastic | −8.1 | −4.0 | −5.9 | −2.9 |
| - Energy | −14.4 | −6.4 | −10.4 | −4.7 |
| - Water | −0.7 | −0.5 | −0.5 | −0.3 |
| - Waste | −1.9 | −0.8 | −1.4 | −0.6 |
| - Tourism | −111.3 | 718.1 | -81.0 | 522.3 |
| - Others | −241.6 | 10.6 | −175.7 | 7.7 |
| Gross operating surplus | −564.2 | 93.4 | −410.3 | 67.9 |
| - Food | −289.0 | −278.2 | −210.2 | −202.3 |
| - Alcohol | −15.9 | −11.5 | −11.6 | −8.3 |
| - Clothing | −0.4 | 1.7 | −0.3 | 1.3 |
| - Plastic | −3.2 | −1.6 | −2.3 | −1.2 |
| - Energy | −27.1 | −12.4 | −19.7 | −9.0 |
| - Water | −1.5 | −1.0 | −1.1 | −0.7 |
| - Waste | −2.0 | −0.8 | −1.5 | −0.6 |
| - Tourism | −55.0 | 369.1 | −40.0 | 268.5 |
| - Others | −170.1 | 27.9 | −123.7 | 20.3 |
| Total | −1656.8 | 259.6 | −1204.9 | 188.8 |
| Scenario | N20 (20%, No Re-Spending) | R20 (20%, with Re-Spending) | N15 (15%, No Re-Spending) | R15 (15%, with Re-Spending) |
|---|---|---|---|---|
| Food | −168.6 | −158.0 | −122.6 | −114.9 |
| Alcohol | −9.1 | −6.5 | −6.6 | −4.7 |
| Clothing | −0.6 | 1.8 | −0.4 | 1.3 |
| Plastic | −4.3 | −2.1 | −3.1 | −1.5 |
| Energy | −179.4 | −68.5 | −130.5 | −49.8 |
| Water | −0.4 | −0.3 | −0.3 | −0.2 |
| Waste | −1.1 | −0.4 | −0.8 | −0.3 |
| Tourism | −41.4 | 436.0 | −30.1 | 317.1 |
| Others | −38.9 | −4.6 | −28.3 | −3.4 |
| Total | −443.8 | 197.3 | −322.8 | 143.5 |
| Strengths/Opportunities | Weaknesses/Threats |
|---|---|
|
|
Disclaimer/Publisher’s Note: The statements, opinions and data contained in all publications are solely those of the individual author(s) and contributor(s) and not of MDPI and/or the editor(s). MDPI and/or the editor(s) disclaim responsibility for any injury to people or property resulting from any ideas, methods, instructions or products referred to in the content. |
© 2023 by the authors. Licensee MDPI, Basel, Switzerland. This article is an open access article distributed under the terms and conditions of the Creative Commons Attribution (CC BY) license (https://creativecommons.org/licenses/by/4.0/).
Share and Cite
Black, D.; Wei, T.; Eaton, E.; Hunt, A.; Carey, J.; Schmutz, U.; He, B.; Roderick, I. Testing Food Waste Reduction Targets: Integrating Transition Scenarios with Macro-Valuation in an Urban Living Lab. Sustainability 2023, 15, 6004. https://doi.org/10.3390/su15076004
Black D, Wei T, Eaton E, Hunt A, Carey J, Schmutz U, He B, Roderick I. Testing Food Waste Reduction Targets: Integrating Transition Scenarios with Macro-Valuation in an Urban Living Lab. Sustainability. 2023; 15(7):6004. https://doi.org/10.3390/su15076004
Chicago/Turabian StyleBlack, Daniel, Taoyuan Wei, Eleanor Eaton, Alistair Hunt, Joy Carey, Ulrich Schmutz, Bingzi He, and Ian Roderick. 2023. "Testing Food Waste Reduction Targets: Integrating Transition Scenarios with Macro-Valuation in an Urban Living Lab" Sustainability 15, no. 7: 6004. https://doi.org/10.3390/su15076004
APA StyleBlack, D., Wei, T., Eaton, E., Hunt, A., Carey, J., Schmutz, U., He, B., & Roderick, I. (2023). Testing Food Waste Reduction Targets: Integrating Transition Scenarios with Macro-Valuation in an Urban Living Lab. Sustainability, 15(7), 6004. https://doi.org/10.3390/su15076004