Article

Bearing Characteristics of Composite Foundation Reinforced by Geosynthetic-Encased Stone Column: Field Tests and Numerical Analyses

1
CSCEC Road and Bridge Group Co., Ltd., Shijiazhuang 050001, China
2
School of Civil Engineering, Southwest Jiaotong University, Chengdu 610031, China
3
Ningxia Institute of Water Resources Research, Yinchuan 750021, China
4
Jinan Machinery Industry Design and Research Institute, Jinan 250300, China
*
Author to whom correspondence should be addressed.
Sustainability 2023, 15(7), 5965; https://doi.org/10.3390/su15075965
Submission received: 3 March 2023 / Revised: 26 March 2023 / Accepted: 28 March 2023 / Published: 29 March 2023

Abstract

:
In order to study the bearing characteristic of the geosynthetic-encased stone column (GESC) on the composite foundation, a series of field tests and numerical simulation were carried out on the composite foundations reinforced by the traditional stone column and the GESC. The pile–soil stress ratio, excess pore water pressure and lateral displacement of two kinds of composite foundations were monitored. The effects of geotextile stiffness, geotextile wrapping length and gravel internal friction angle on the composite foundation with the GESC were analyzed by establishing different numerical models. The results show that the GESC can bear larger loading compared with the traditional stone column. The pile–soil stress ratio of the composite foundation with the traditional stone column gradually increases from 1.1 to 1.5 with the increasing of the embankment height. However, the pile–soil stress ratio of the composite foundation with the GESC reaches 1.5 at the initial filling stage and increases to 1.7 with the filling construction. The drainage effect of the GESC is better than that of the traditional stone column, and the GESC can effectively improve the overall stiffness of stone column, so as to reduce the lateral displacement of soil mass. The increases of geotextile stiffness, geotextile wrapping length and gravel internal friction angle can improve the bearing performance of the composite foundation with the GESC. However, after geotextile stiffness and wrapping length reach a certain value, the influence of its lifting amount on the composite foundation will be reduced.

1. Introduction

As an effective means of composite foundation treatment, a stone column has the advantages of replacement, drainage consolidation, vibration compaction and liquefaction reduction. Moreover, it has the advantages of low cost, simple construction and easy access to materials and has been widely used in soil foundation treatment. However, when the foundation soil is very soft, the stone column is prone to bulge and damage, resulting in insufficient bearing capacity, uneven settlement, foundation collapse and other problems. To solve the above problems, Van Impe [1,2] proposed the concept of a geosynthetic-encased stone column (GESC). He wrapped a layer of geosynthetic material around the traditional stone column. The higher tensile strength of geosynthetic materials can tightly bind loose gravel materials together, which can effectively reduce the bulging deformation of stone column and increase the bearing capacity of composite foundation [3,4]. In addition, the geotextile can filter soil particles to keep good drainage performance of pile body. The general shape of the GESC is shown in Figure 1.
The GESC has been widely used in foundation treatment due to its good working performance [5,6]. The general shapes of the composite foundation reinforced by the GESCs are shown in Figure 2. The force process and deformation process of the composite foundation reinforced by the GESC can be described as follows: the stress at the top of the pile is transmitted downward through the pile body; part of the force is transferred to the soil mass through the lateral frictional resistance; and the remaining force is transferred to the soil layer at the bottom of the pile. The pile will produce certain bulging deformation under the action of force. Through the interaction of pile, soil, cushion layer and foundation, the deformation of pile body and soil mass is coordinated. The reinforcement effect of the GESC on the foundation is similar to that of stone column method, which has replacement, drainage, reinforcement, compacting and strengthening effects on soft clay or loose sandy soil. A new technology must be validated through a large number of on-site and indoor tests. Currently, there are relatively few field test studies on the GESC in silty clay foundation, and there is a lack of field test data. In addition, the bearing characteristic and load transfer law of the composite foundation reinforced by the GESC are not clear [7,8], which greatly limits its use and promotion.
At present, many scholars have studied the bearing capacity and load transfer law of the GESC by means of laboratory model tests and field tests. Murugesan and Rajagopal [9] carried out single pile and group piles model tests on the soft clay foundation reinforced by the GESC. The results show that the GESC can effectively improve the bearing capacity of stone column. The ultimate bearing capacity of the GESC is about four times more than that of the stone column, and the pile–soil stress ratio can be increased by more than 1.7 times. Ghazavi and Afshar [10] found that the single pile composite foundation model was mainly damaged by bulging deformation, and the damage location was at the depth of 1~2 times the pile diameter. In addition to bulging deformation, there is also lateral shear deformation of the pile body in the group pile composite foundation. Tandel et al. [11] investigated the influence of different pile diameters, wrapping lengths and area replacement ratios on the bearing capacity of the composite foundation reinforced by the GESC through laboratory tests. Fattah et al. [12] established soft clay foundation models reinforced by the traditional stone columns and the GESCs, respectively. The influence of the two types of piles on the pile–soil stress ratio, settlement and bearing capacity of the foundation was studied. Mohapatra et al. [13] used a large direct shear apparatus to apply a horizontal load to the traditional stone column and the GESC. The results show that the GESC has bending failure while the traditional stone column has shear failure due to insufficient stiffness. Li et al. [14] carried out the model test of the GESC supported embankment; they found that the GESCs reduced the settlement difference between the pile and the soil between the pile. Yoo and Lee [15] conducted field full-scale load tests on composite foundation reinforced by the GESC and found that increasing the stiffness of wrapping material can improve the rigidity of piles. Almeida et al. [16] investigated the pile bulging deformation, pile–soil stress ratio and excess pore water pressure of the composite foundation reinforced by the GESC by conducting field tests and found that the pile–soil stress ratio increases with soil consolidation. The existing research on the GESC mainly focuses on laboratory model tests and numerical simulation [17,18,19], and the field test and engineering experience are relatively few. However, the laboratory model test and numerical simulation cannot completely simulate the site situation [20,21,22], so it is necessary to carry out the field test of the silty clay foundation reinforced by the GESC to obtain the measured data. In addition, due to the lack of field test data, it is difficult to verify the correctness of numerical simulation for a specific area. The numerical simulation results need to be calibrated with field test data so that the numerical simulation can be used for expansion analysis [23,24,25]. The bearing characteristics and load transfer law of the traditional stone column and the GESC are changing with time during the process of embankment filling. The innovation of this research is that the long-term field monitoring might be a great reference for the related study on soft soil foundation reinforcement, because there are a few similar examples in the literature on this topic, especially for the results obtained from a large number of field tests and numerical simulation. In addition, the field comparison test between the traditional stone column and the GESC also lacks actual engineering data, which restricts the development of numerical simulation and theoretical analysis of the GESC in the silty clay area.
Aiming at the problem that the bearing capacities of the composite foundations reinforced by the traditional stone column and the GESC lack the support of actual engineering data, during the construction of the embankment filling, the bearing characteristics and load transfer laws of the silty clay foundations reinforced by the traditional stone column and the GESC are comparatively studied by means of field monitoring. Combined with the field test data, a series of numerical calculation models are established to analyze the influencing factors of silty clay foundation reinforced by the GESC. The research results can provide reference for the subsequent design of silty clay foundation reinforced by the GESC.

2. Experimental Design for Field Monitoring

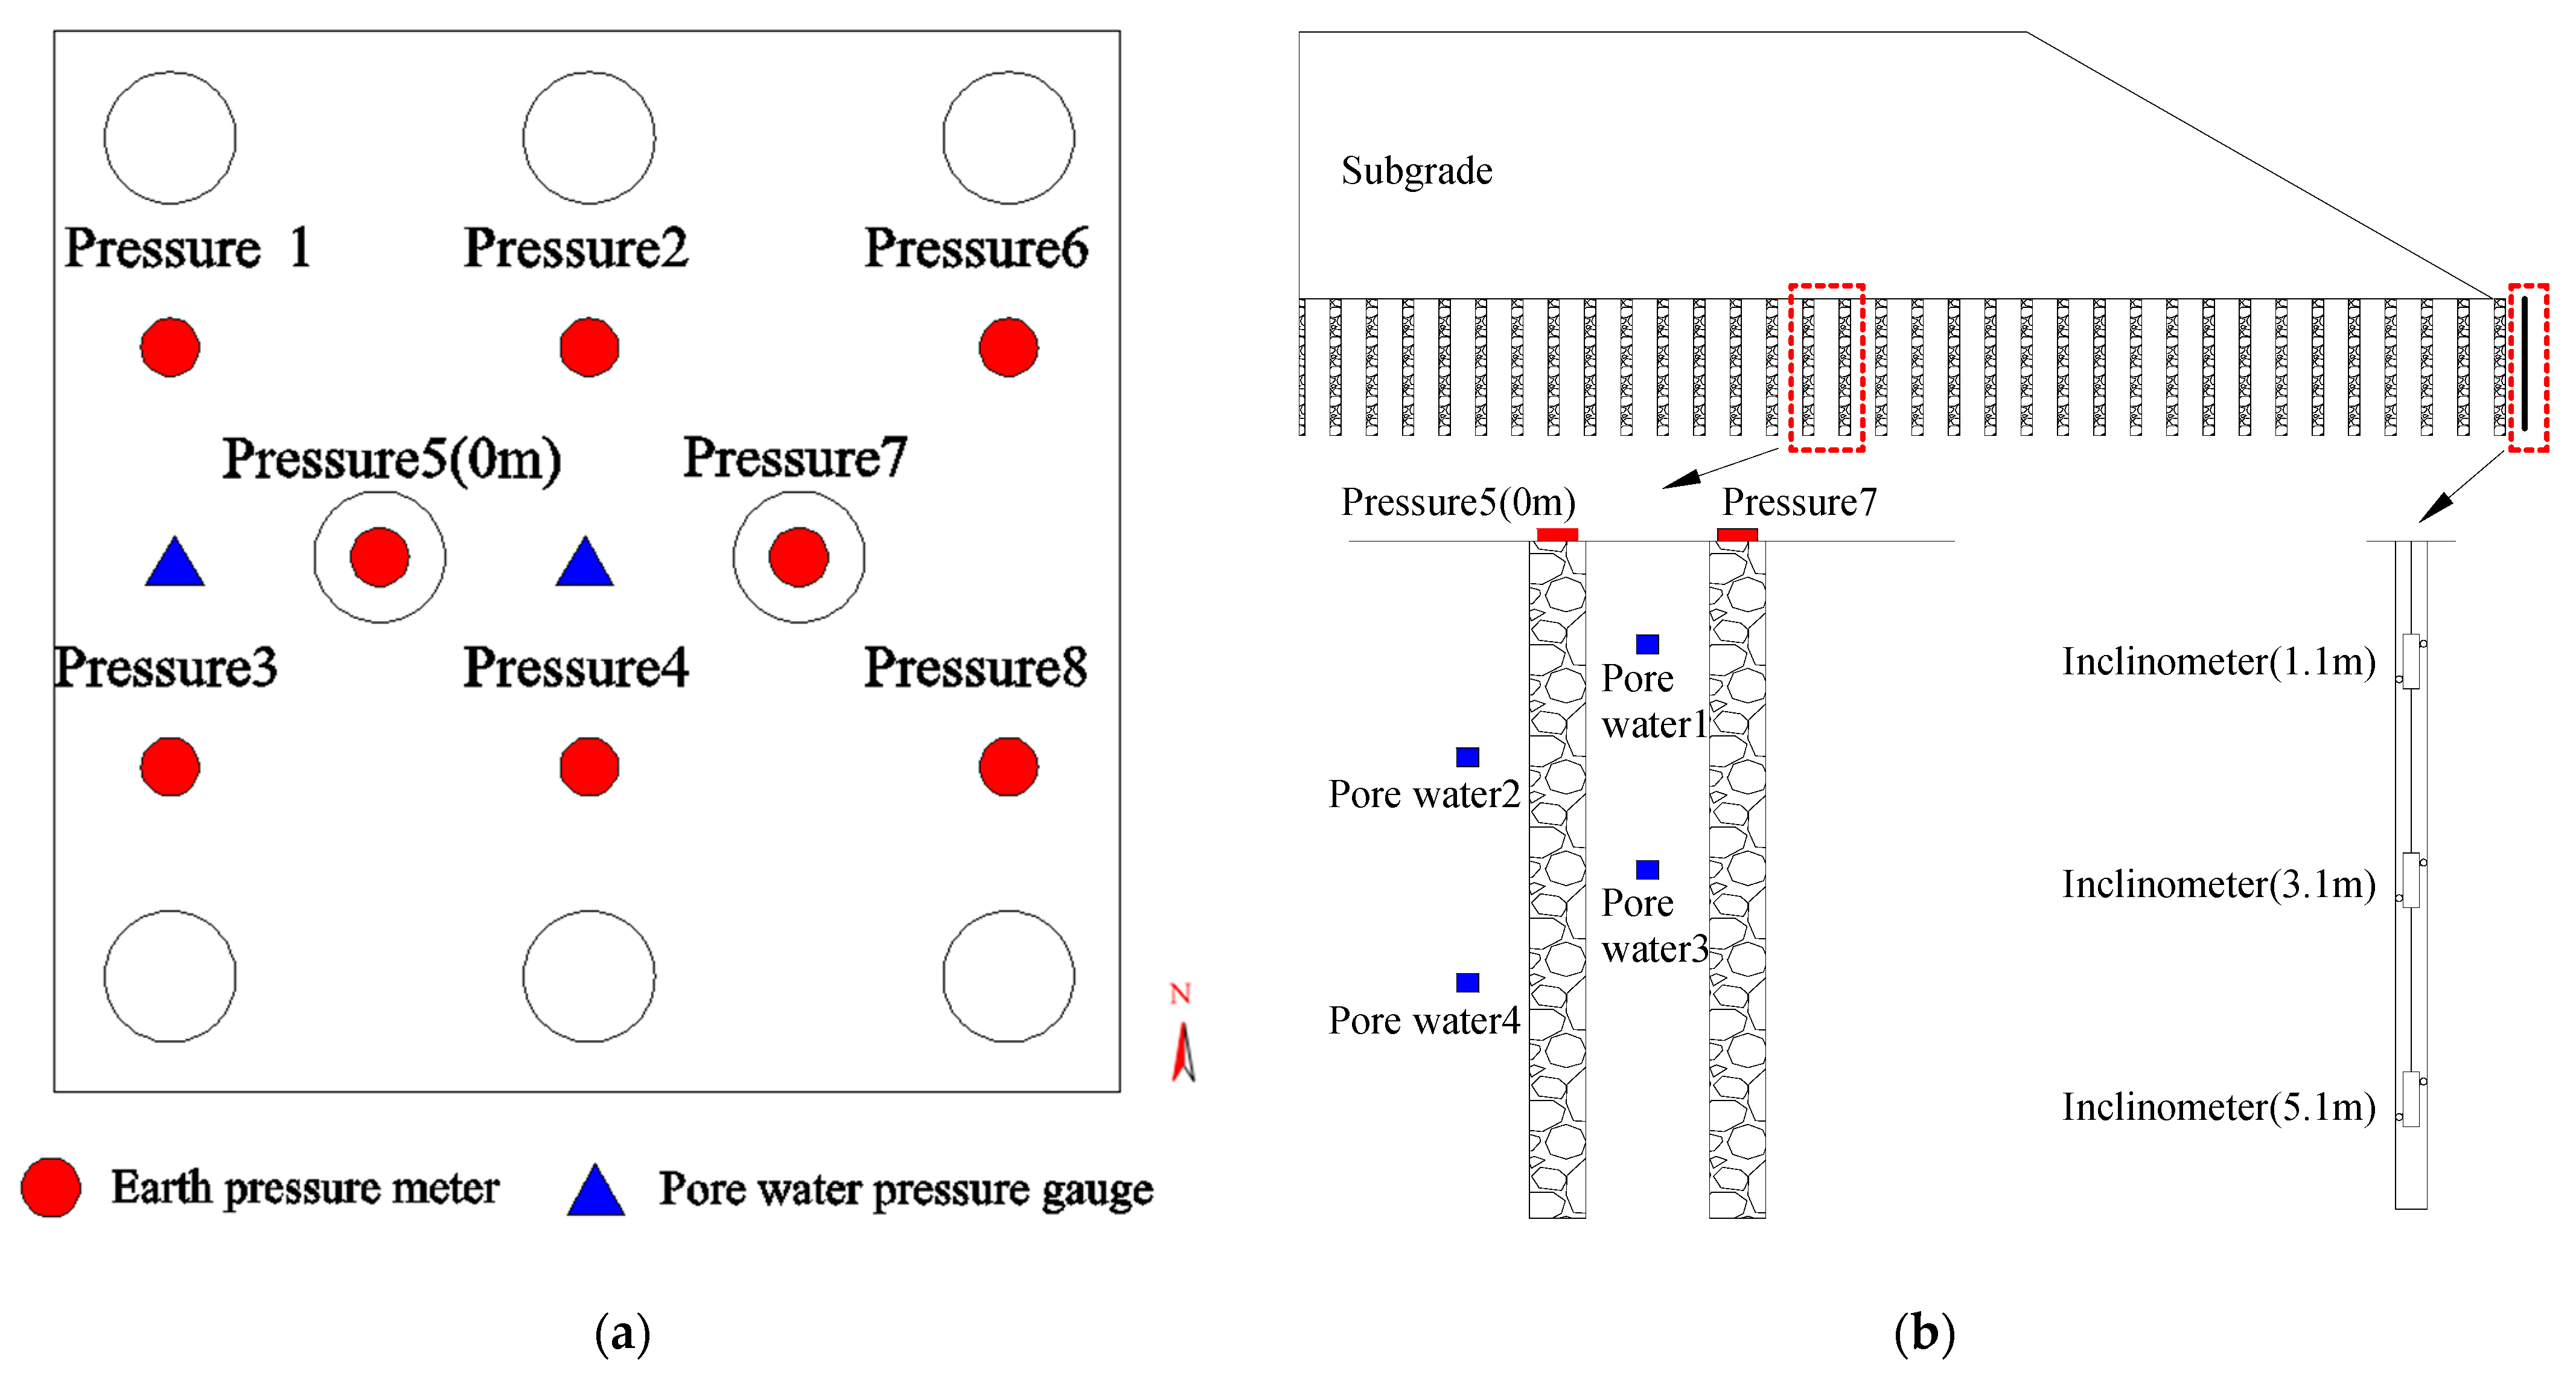
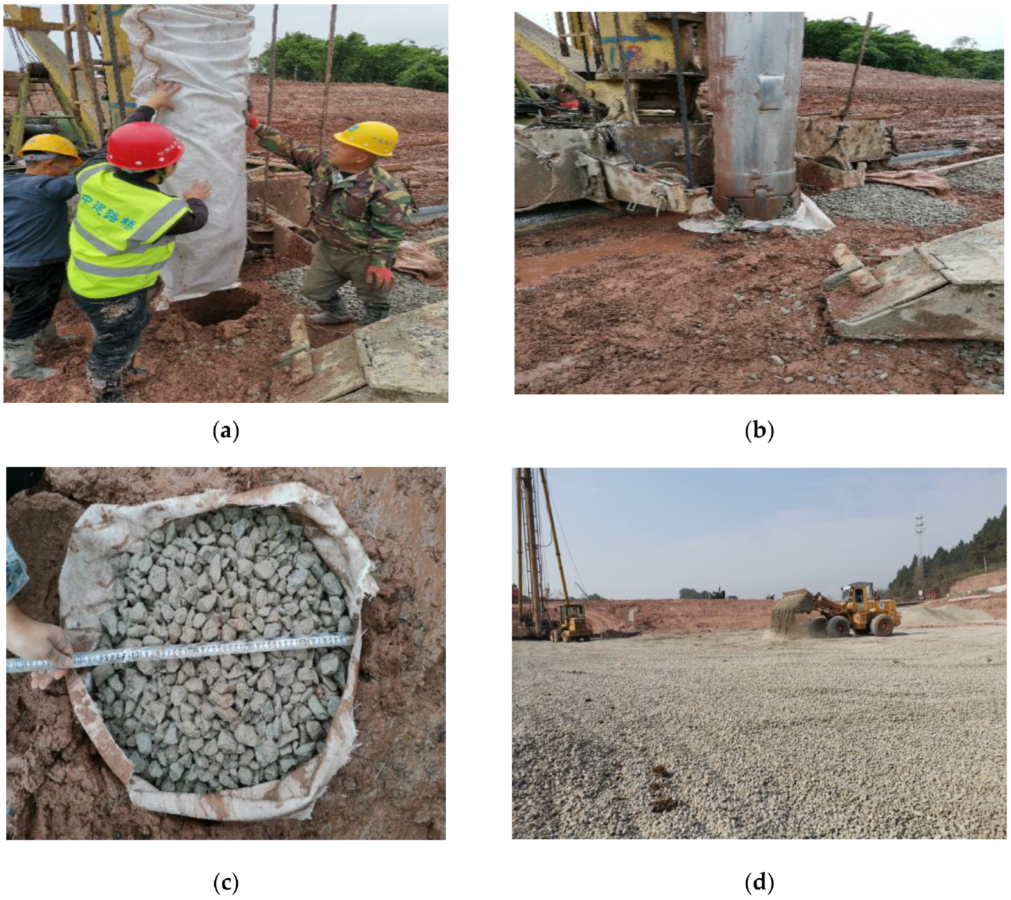
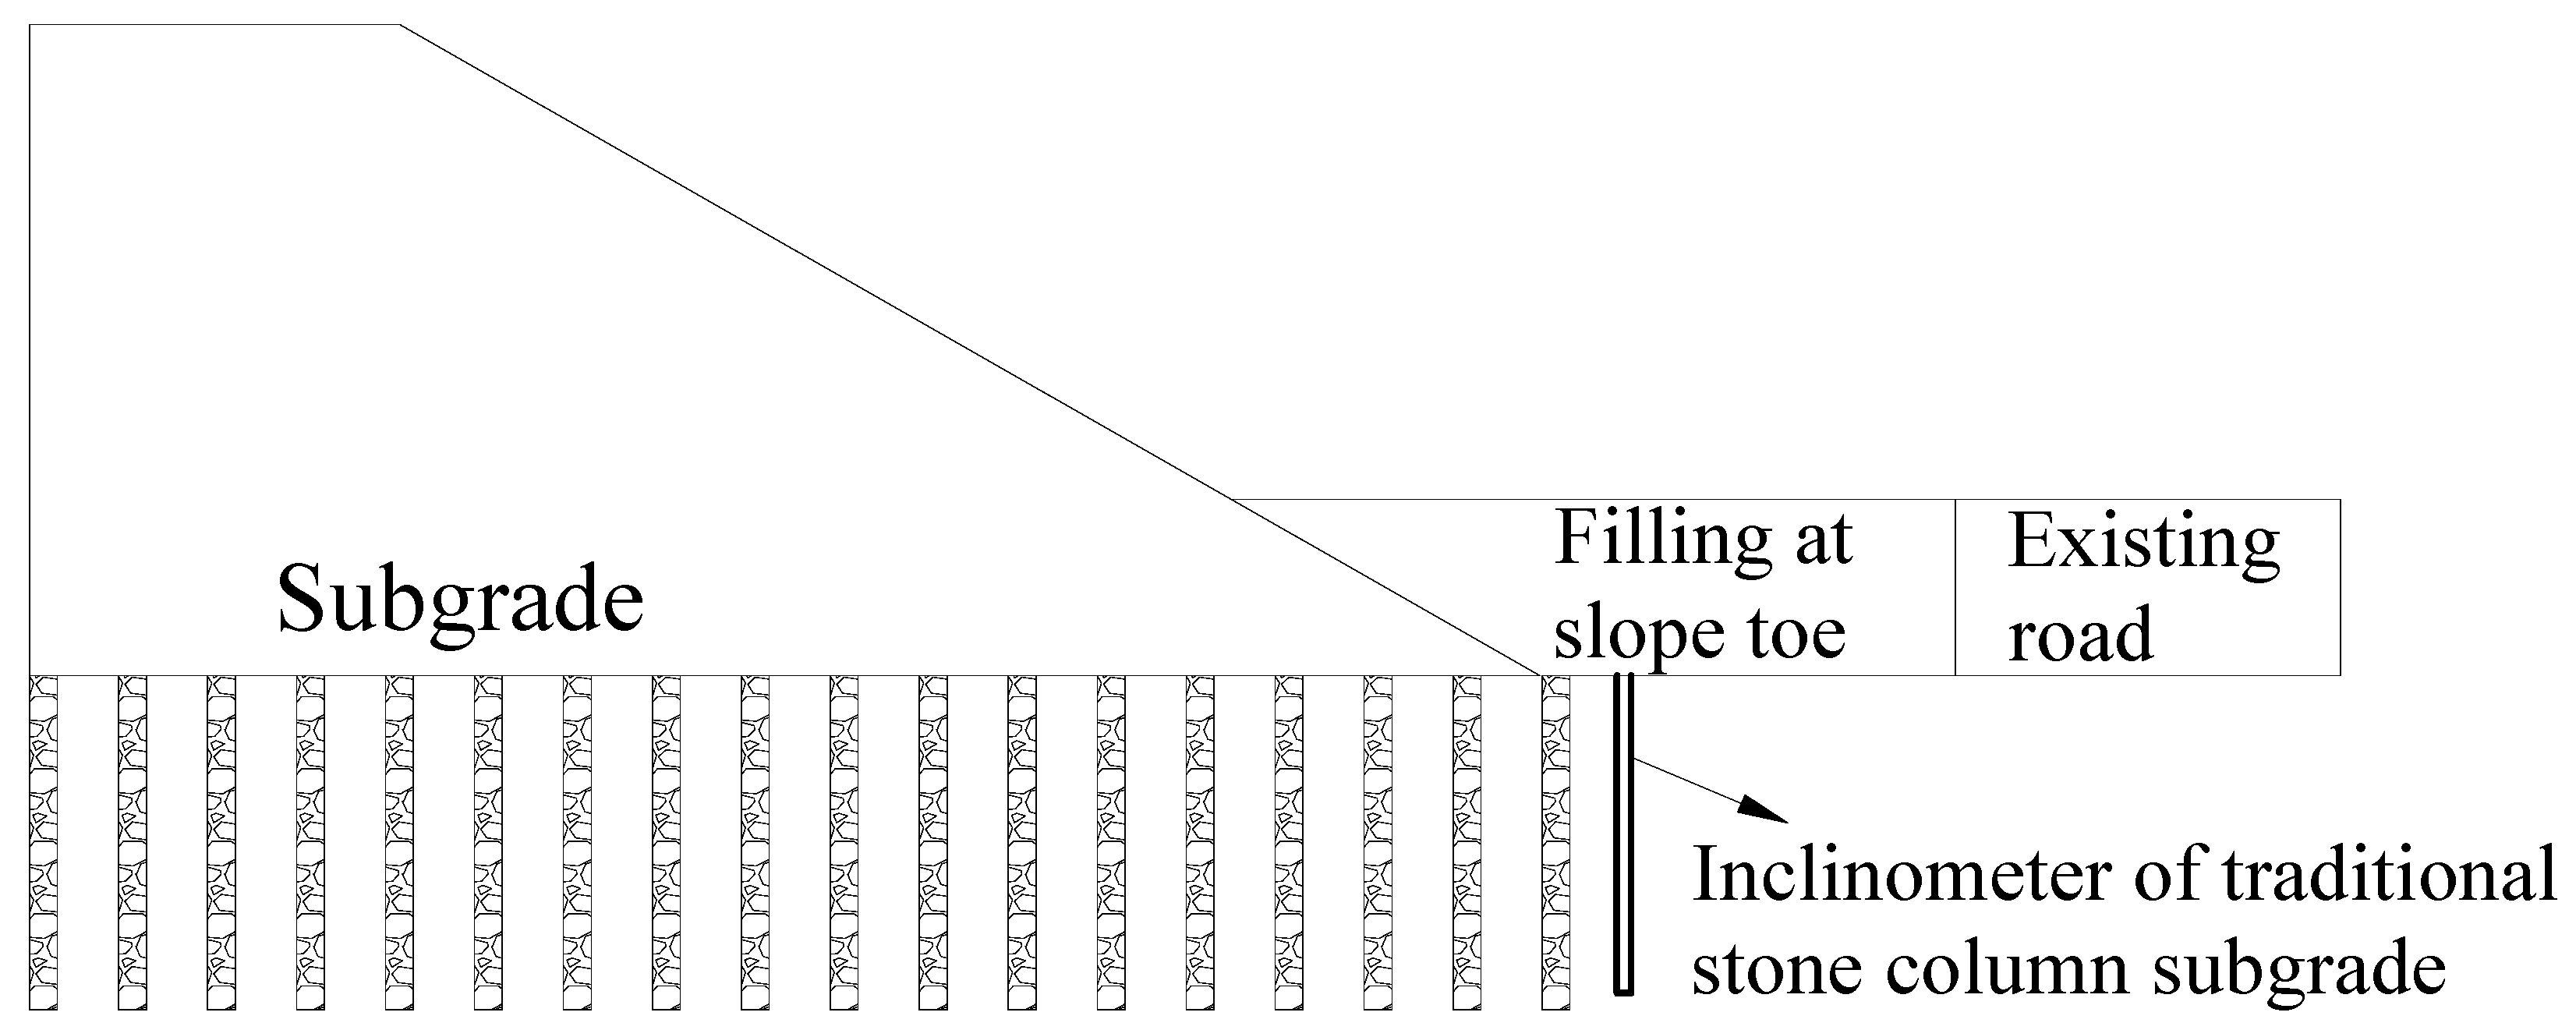
2.1. Test Site and Pile Arrangement

The test is carried out in the K50 + 250~K50 + 325 section of Jinjianren Expressway, Chengdu, China. The reinforcement area of gravel pile in this section is about 75 m long and 100 m wide. The average height of subgrade is 11.7 m; the width of subgrade surface is 64 m; and the slope ratio is 1:1.5. The site is covered by a fill layer within 0~1 m; a silty clay layer is within 1~6 m; and a strongly weathered mudstone is below 6 m, as shown in Figure 3. According to the site geological survey report, the basic allowable values of bearing capacity of fill and silty clay in the construction site are lower, which are 180 kPa and 100 kPa, respectively. Moreover, due to the higher groundwater level (about 1 m), the foundation can be reinforced with GESCs. In order to compare the performance of the traditional stone column and the GESC and reduce the influence of boundary, two rectangular areas with dimensions of 40 m × 10 m are delineated, and the subgrades are reinforced with the traditional stone column and the GESC, respectively. Triangular arrangement is adopted for both reinforcement conditions, with a pile diameter of 0.5 m, pile spacing of 1.6 m and pile length of 6 m. The existing research shows that the bulging deformation of stone column mainly occurs within the range of 2~4 times of the pile diameter from the top of the pile, so this range is the minimum wrapping range of geotextile. In this paper, for the sake of conservativeness, the geotextile is used to wrap stone column within six times the pile diameter from the top of the pile. That is, the wrapping length of geotextile is 3 m, which is a half-length wrapping stone column. The following methods are adopted to realize the construction of half-length wrapping stone column: (1) the hole is formed by vibrating casing pipe and filled with gravel to a depth of 3 m below the surface; (2) put the geotextile bag on the casing pipe and squeeze the bottom of the geotextile bag to a depth of 3 m by the casing pipe; (3) fill the geotextile bag with gravel and vibrate it into a pile. At the same time, pull out the casing pipe slowly. The traditional stone columns are formed at once by means of vibrating casing pipe. After the pile filling is completed, start to bury the sensors. The profiles of the two types of gravel piles are shown in Figure 4.

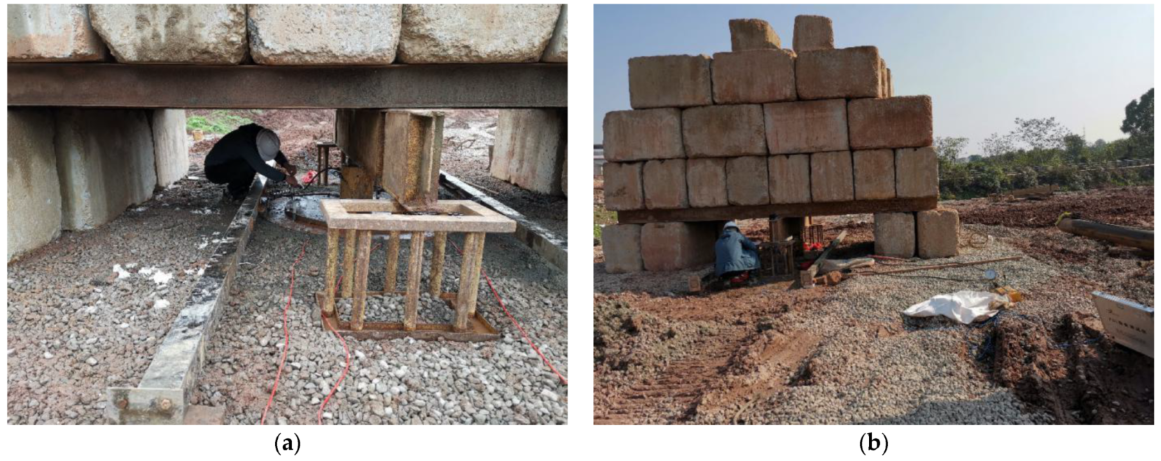
2.2. Sensor Layout and Installation

In order to demonstrate the effects of the two kinds of stone columns in strengthening foundation, earth pressure meters (soil mass between piles, pile top surface) and pore water pressure meters are buried along both sides of the subgrade centerline. In order to measure the lateral displacement of the soil mass of the foundation caused by the subgrade filling construction, an inclinometer pipe with a depth of 6.1 m is buried at the slope toe on each side of the monitoring section. Three fixed inclinometers are placed in a single inclinometer pipe. The placement depths of inclinometer are 1.1 m, 3.1 m and 5.1 m, respectively. The pulley plane of the inclinometer is parallel to the displacement direction of the soil mass after subgrade filling, so it can measure more accurate lateral displacement of the soil mass. The installation process of inclinometer is shown in Figure 5a,b. In order to obtain verifiable data, two target piles are set up, and one earth pressure meter is placed on the top of each target pile. Six earth pressure meters are placed on the perimeter soils around the two target piles. In order to ensure the test accuracy of earth pressure meter, 5 cm thick medium coarse sand is placed under each earth pressure meter. The installation process of earth pressure meter is shown in Figure 5c,d. Only one pile is taken as the target pile when monitoring the excess pore water pressure. Therefore, two pore water pressure test holes are arranged to monitor the change of pore water pressure in the subgrade under the filling load. Two pore water pressure meters are buried in each hole, as shown in Figure 5e,f. The buried depths of the four pore water pressure meters in the two holes are, respectively, 1 m, 2 m, 3 m and 4 m from the ground. The spacing in single hole is 2 m.
The specific sensor arrangement is shown in Figure 6. Because it is necessary to obtain long-term foundation response data during subgrade filling, automatic data acquisition devices are used for data monitoring and collection. All sensors are calibrated and zeroed before acquisition. During the monitoring process, it is no longer necessary to calibrate and reset the sensors. The filling height of subgrade in this test section is 11.7 m, of which the thickness of gravel cushion layer is about 0.3 m; the thickness of subgrade filling layer is 11.4 m. The gravel cushion layer can adjust the deformation of GESC and soil mass and can help the GESC and soil mass to bear the force together. The filling construction time is 45 days in total. The variation of filling height with time is shown in Figure 7. The monitoring data are acquired once a day during the construction of subgrade filling stage and once every 10 days within one month after the completion of construction. On the 50th day after the completion of the monitoring in the previous stage, the monitoring data are acquired again. The construction processes of the GESC and subgrade filling is shown in Figure 8.

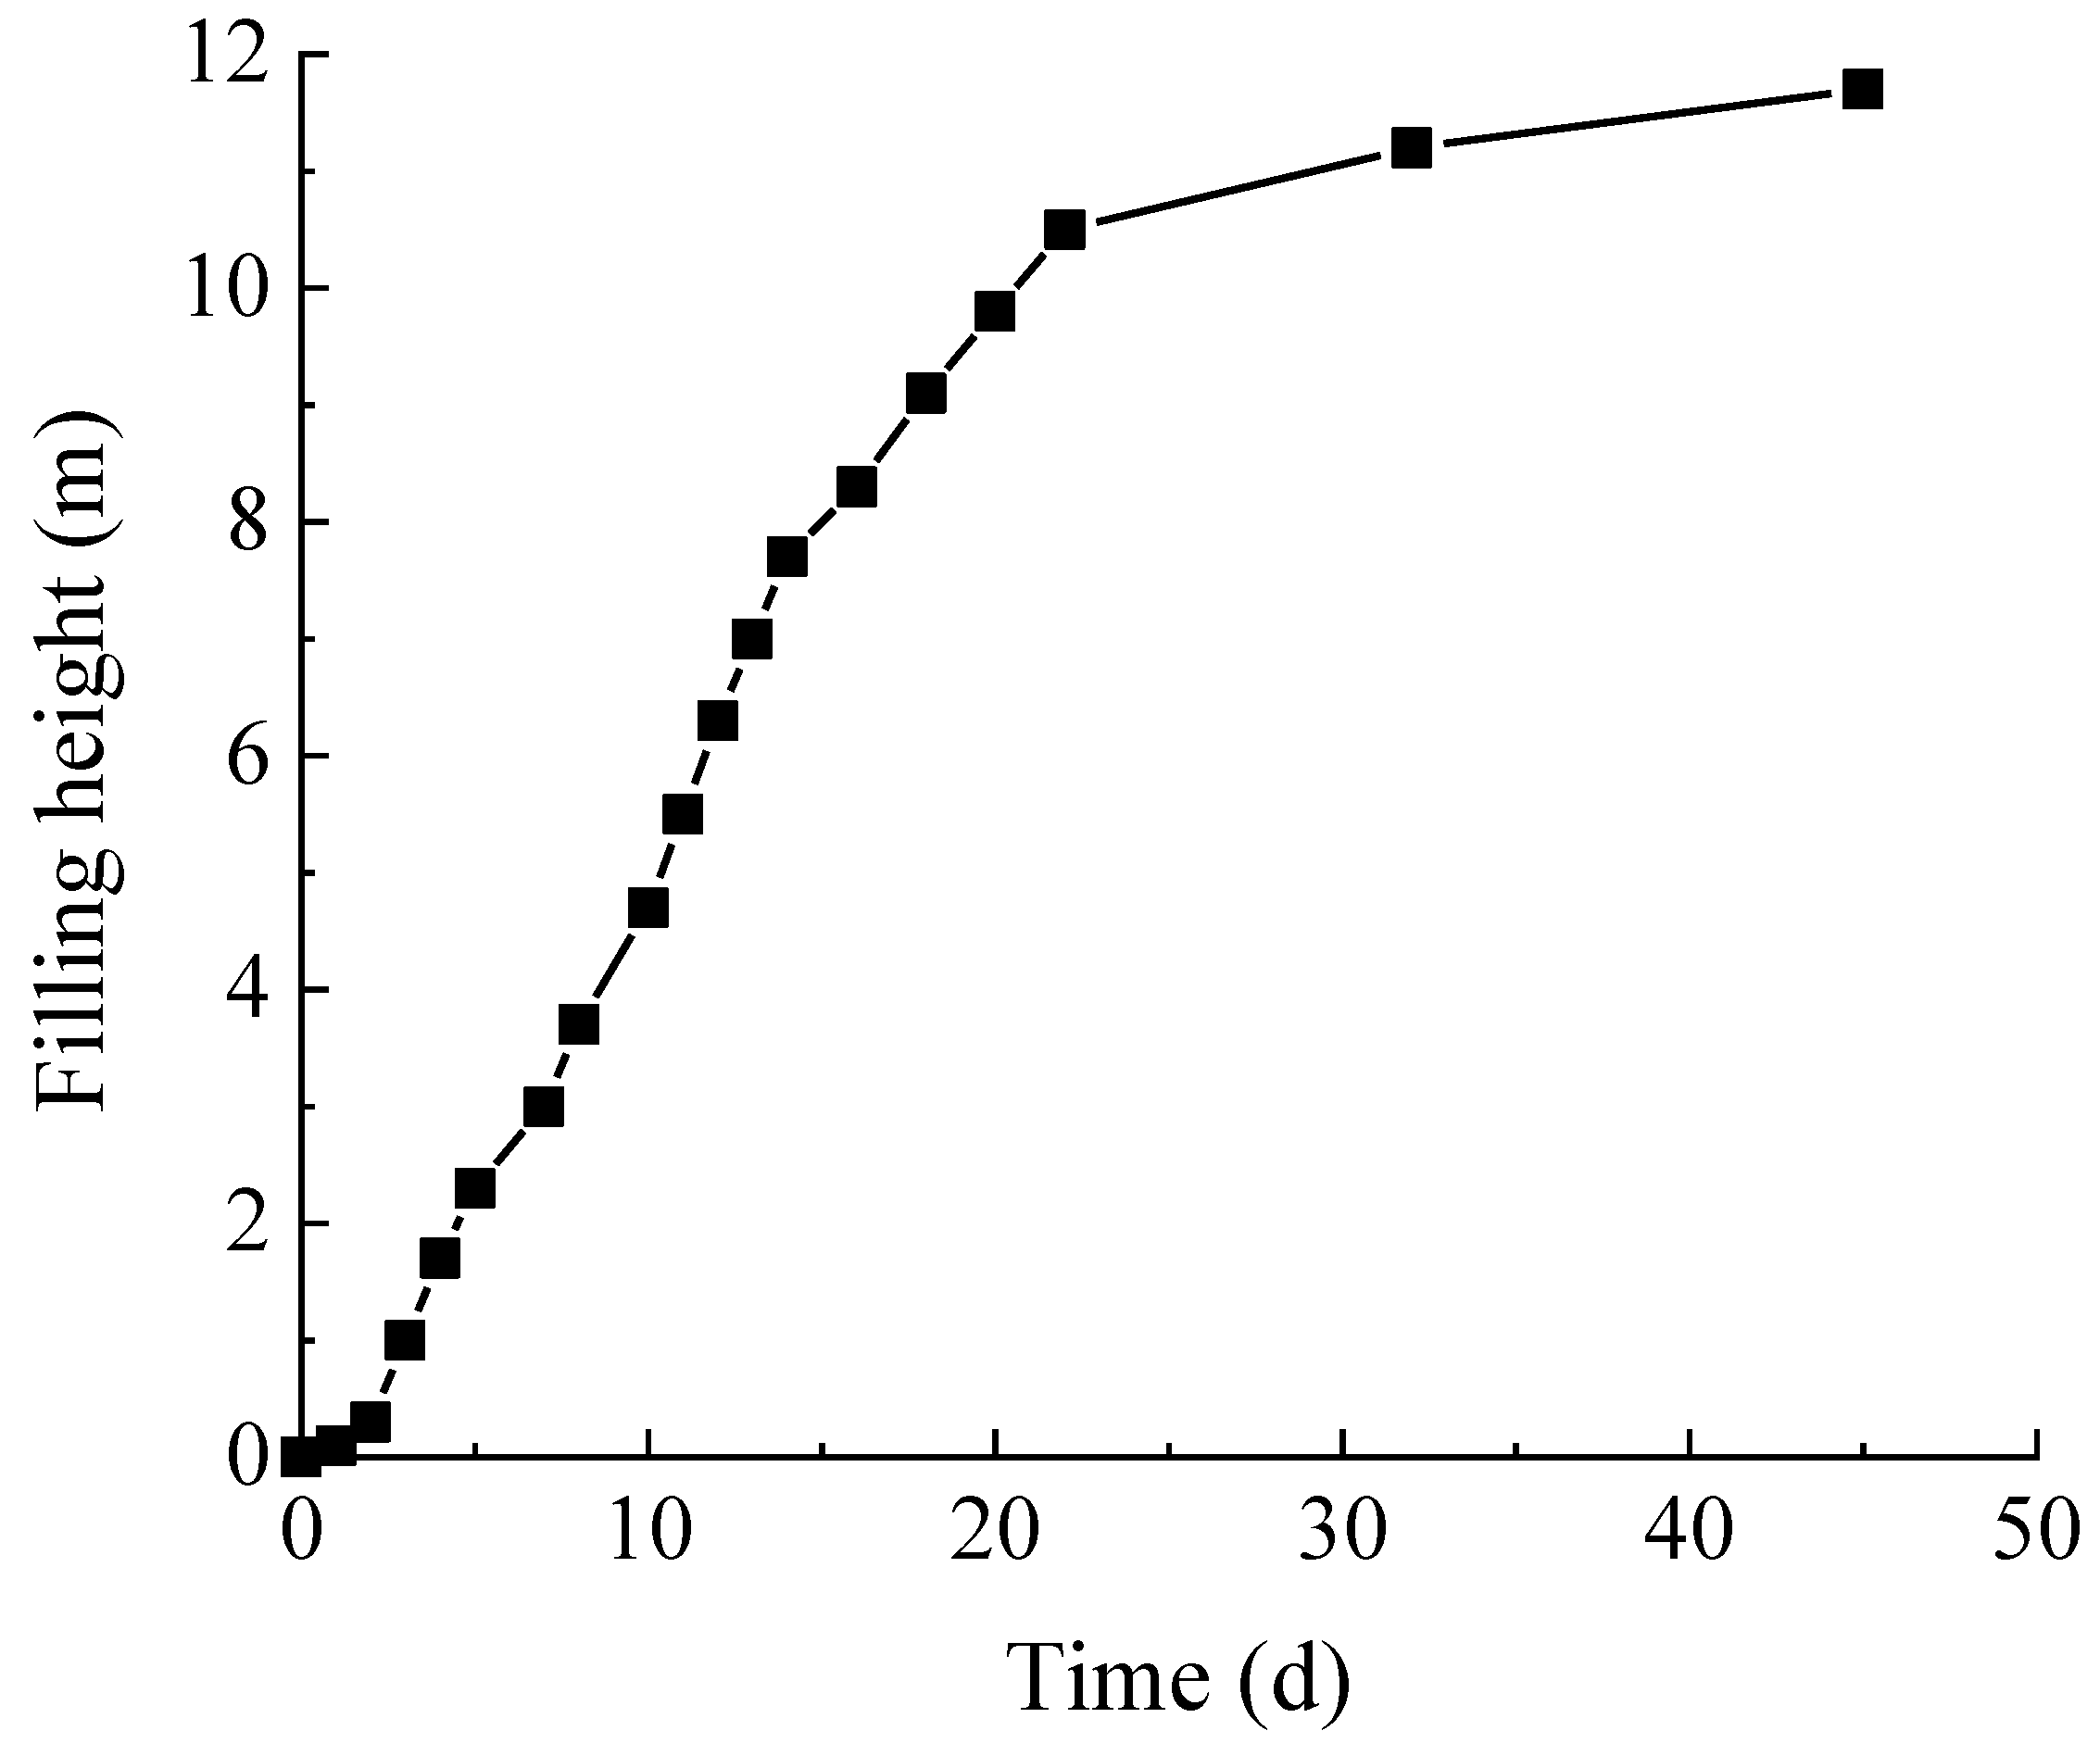
3. Results and Analysis of Field Monitoring

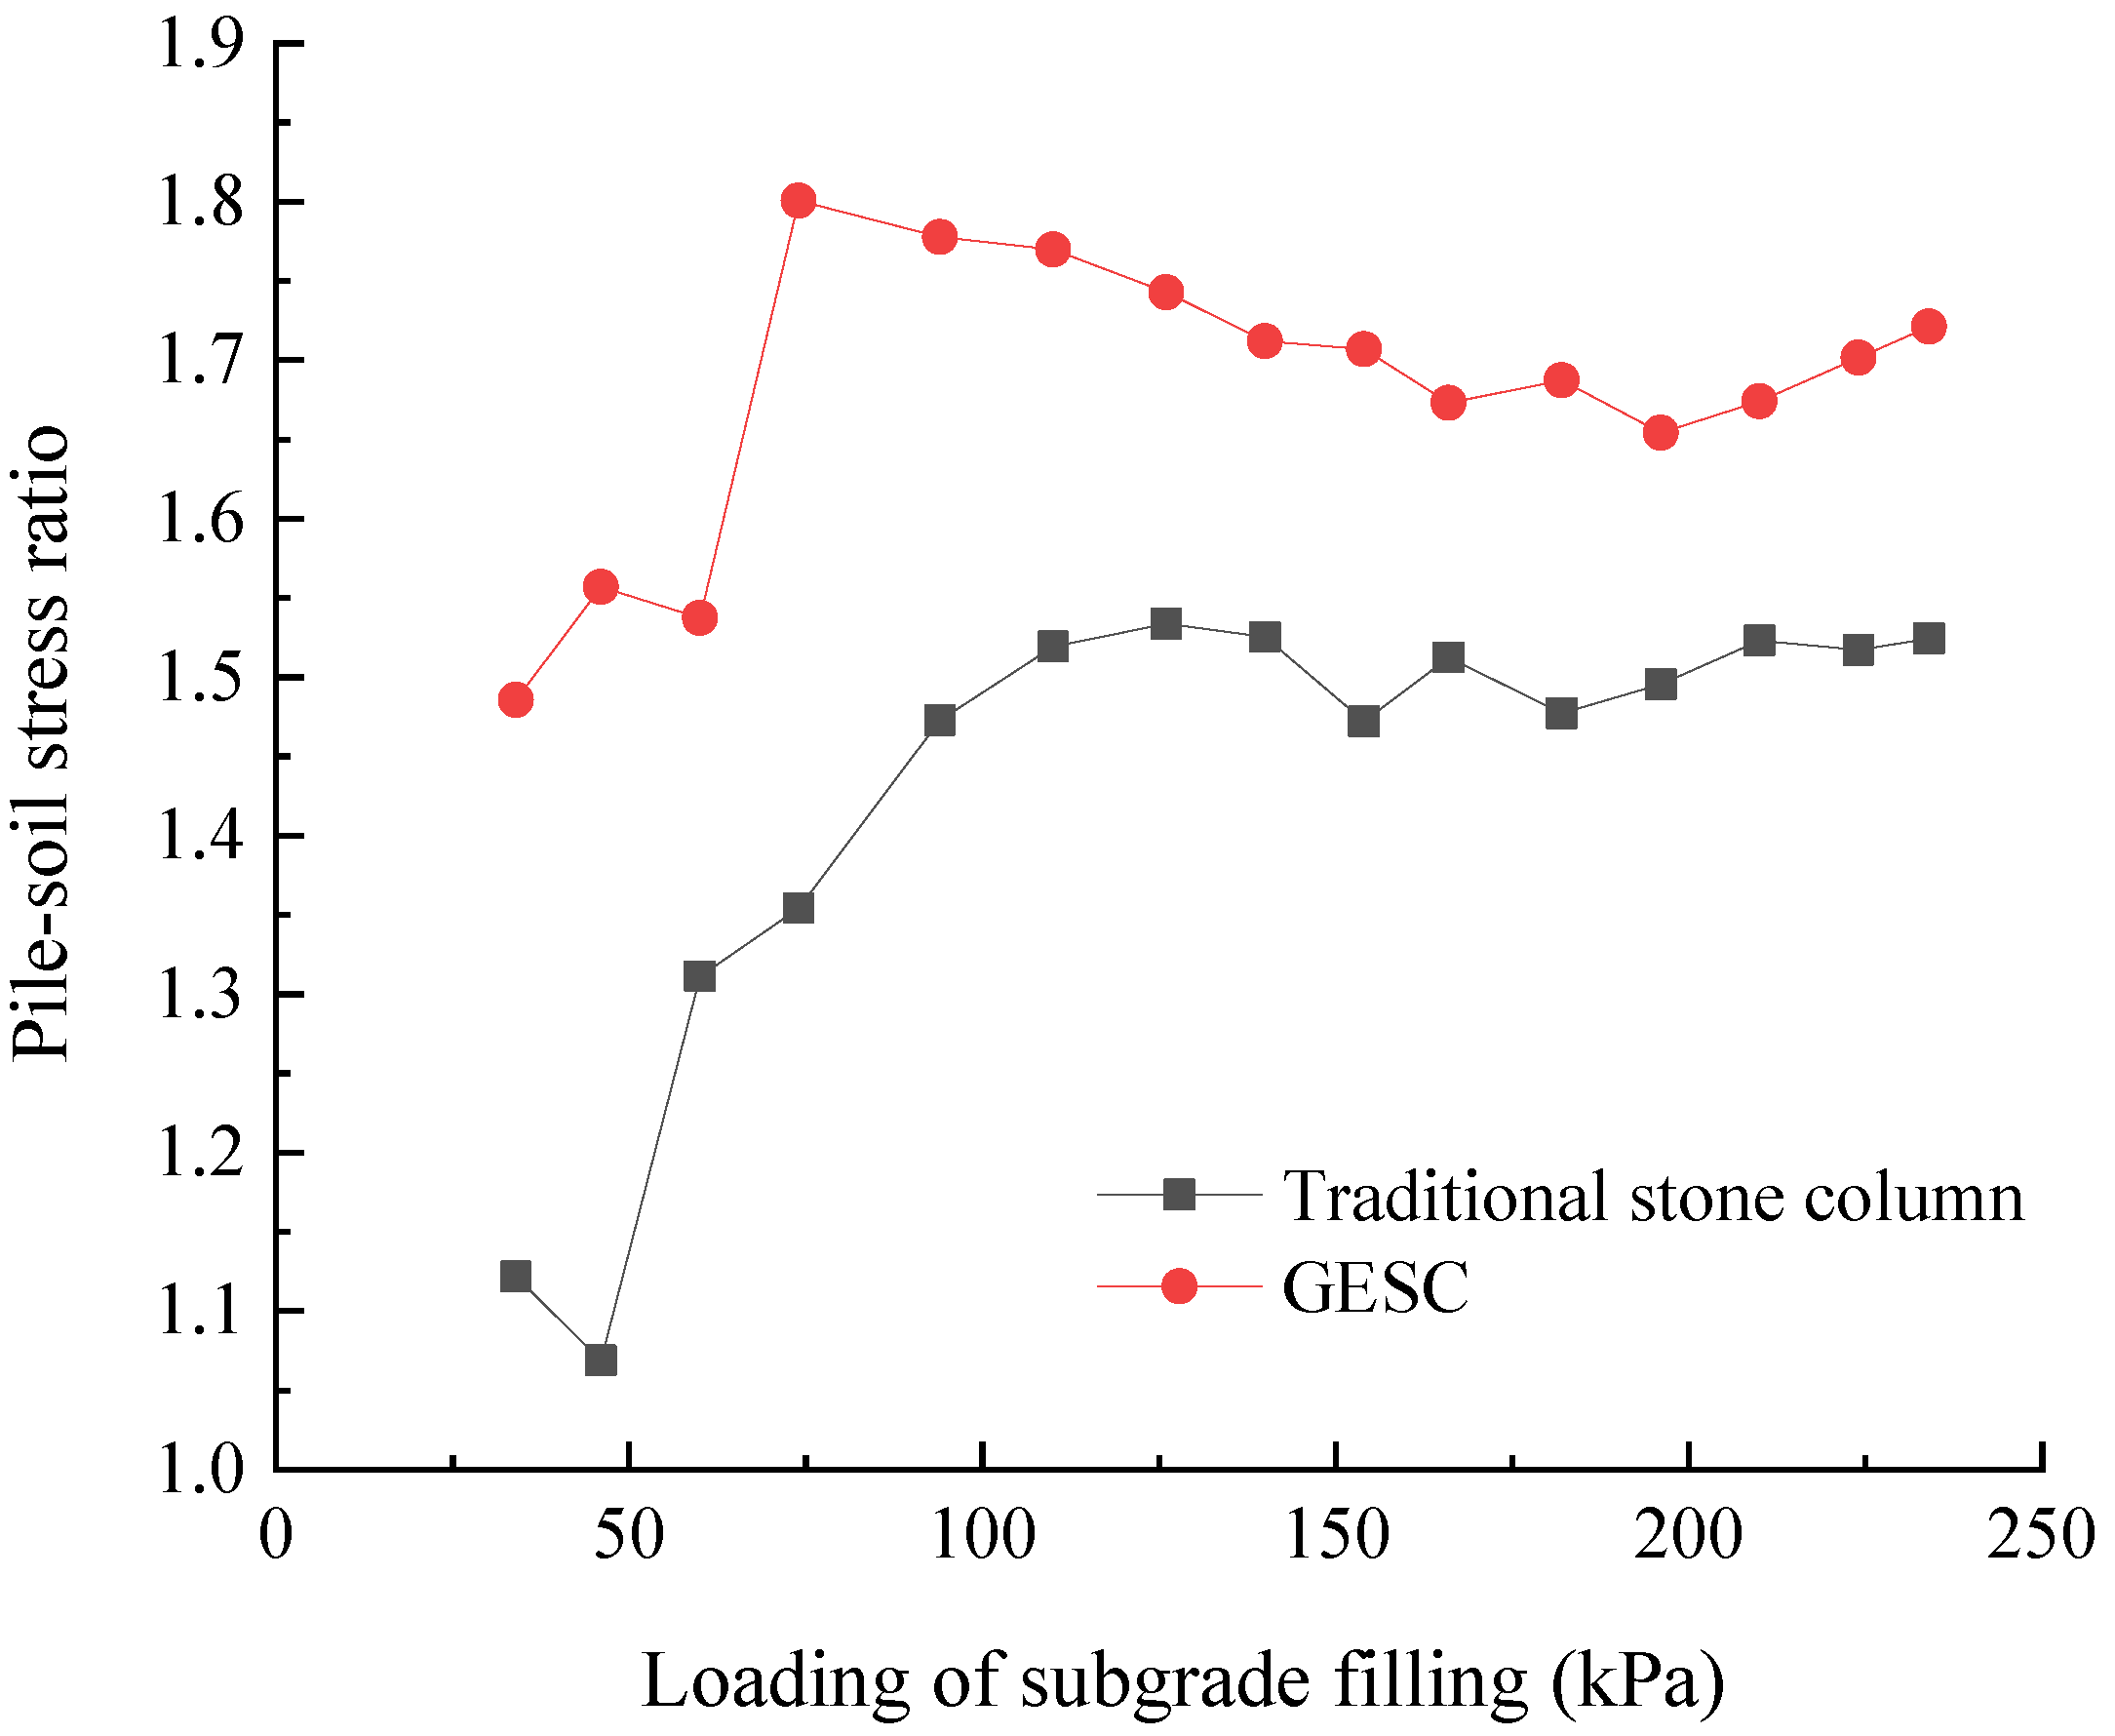
3.1. Pile–Soil Stress Ratio

The pile–soil stress ratio is defined as the ratio of the pile top stress to the soil stress between piles at a certain time. The pile–soil stress ratio reflects the load sharing between the pile and the surrounding soil and is an important index for evaluating composite foundation. The pile top stress is taken as the average of the measured values of two earth pressure meters placed on the pile top. The soil stress between the piles is taken as the average of the measured values of the six earth pressure meters placed between the piles. According to the measured data, the change curve of pile–soil stress ratio with the filling load can be drawn, as shown in Figure 9. At the initial stage of subgrade filling, the pile–soil stress ratio of the traditional stone column is about 1.1, which fails to reflect the stress concentration effect of pile body. This indicates that the compactness and rigidity of the gravel in the traditional stone column are not enough. The stone column swells and deforms, and the pile body transfers the stress to the surrounding soil, which causes that the pile body cannot bear more stress for the surrounding soil at the initial stage. As the filling height of the subgrade gradually increases, the gravel in the traditional stone column is gradually dense and has a certain bulging deformation. The rigidity of the pile body increases which can bear more stress for the surrounding soil. The pile–soil stress ratio gradually rises and tends to be stable at about 1.5. At the initial stage of subgrade filling, the pile–soil stress ratio of the GESC reaches about 1.5. The pile–soil stress ratio gradually increases to 1.7 and remains stable in the later stage with the increase of subgrade filling load. It indicates that the rigidity of the GESC is relatively high due to the lateral restraint provided by the geotextile bag. At the stage of small loading value, the pile body bulges less and can bear greater stress for the surrounding soil. The lateral restraint of the geotextile bag makes the vertical stiffness of the stone column greater. Compared with the traditional stone column, it can bear more loads for the surrounding soil in the same level of loading. This phenomenon is more obvious at the initial stage of loading, so the use of geotextile bag wrapping stone column can improve its pile–soil stress ratio.

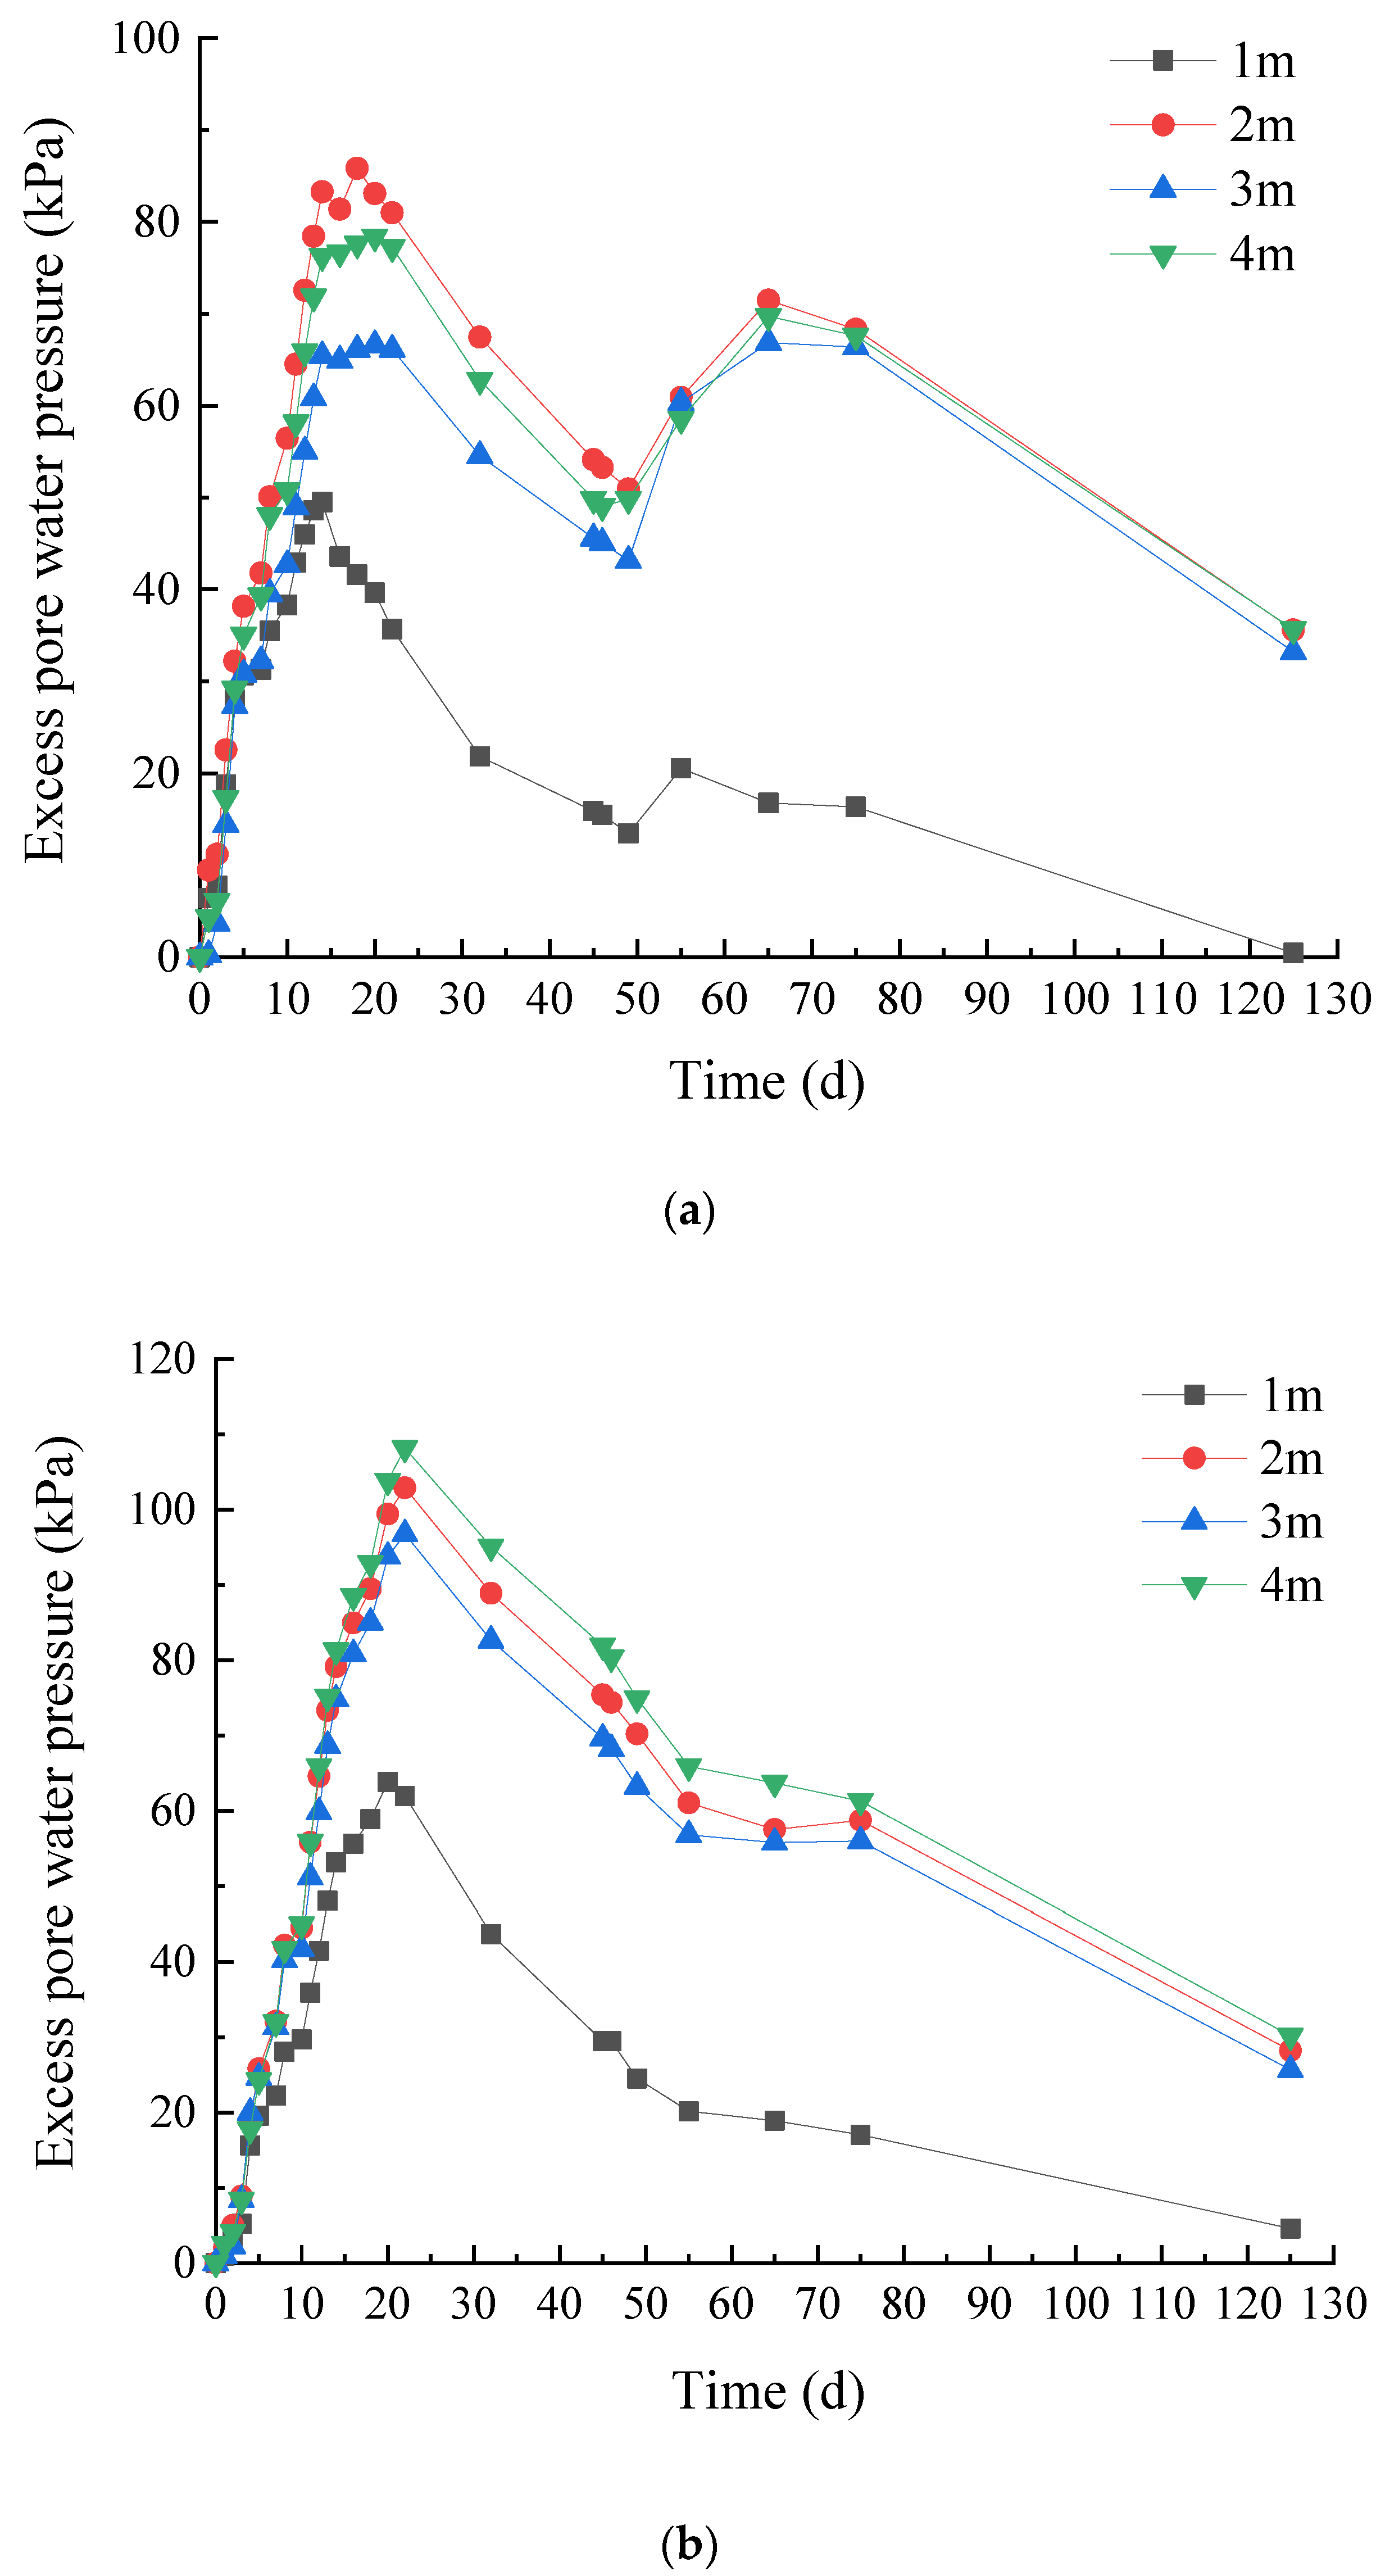
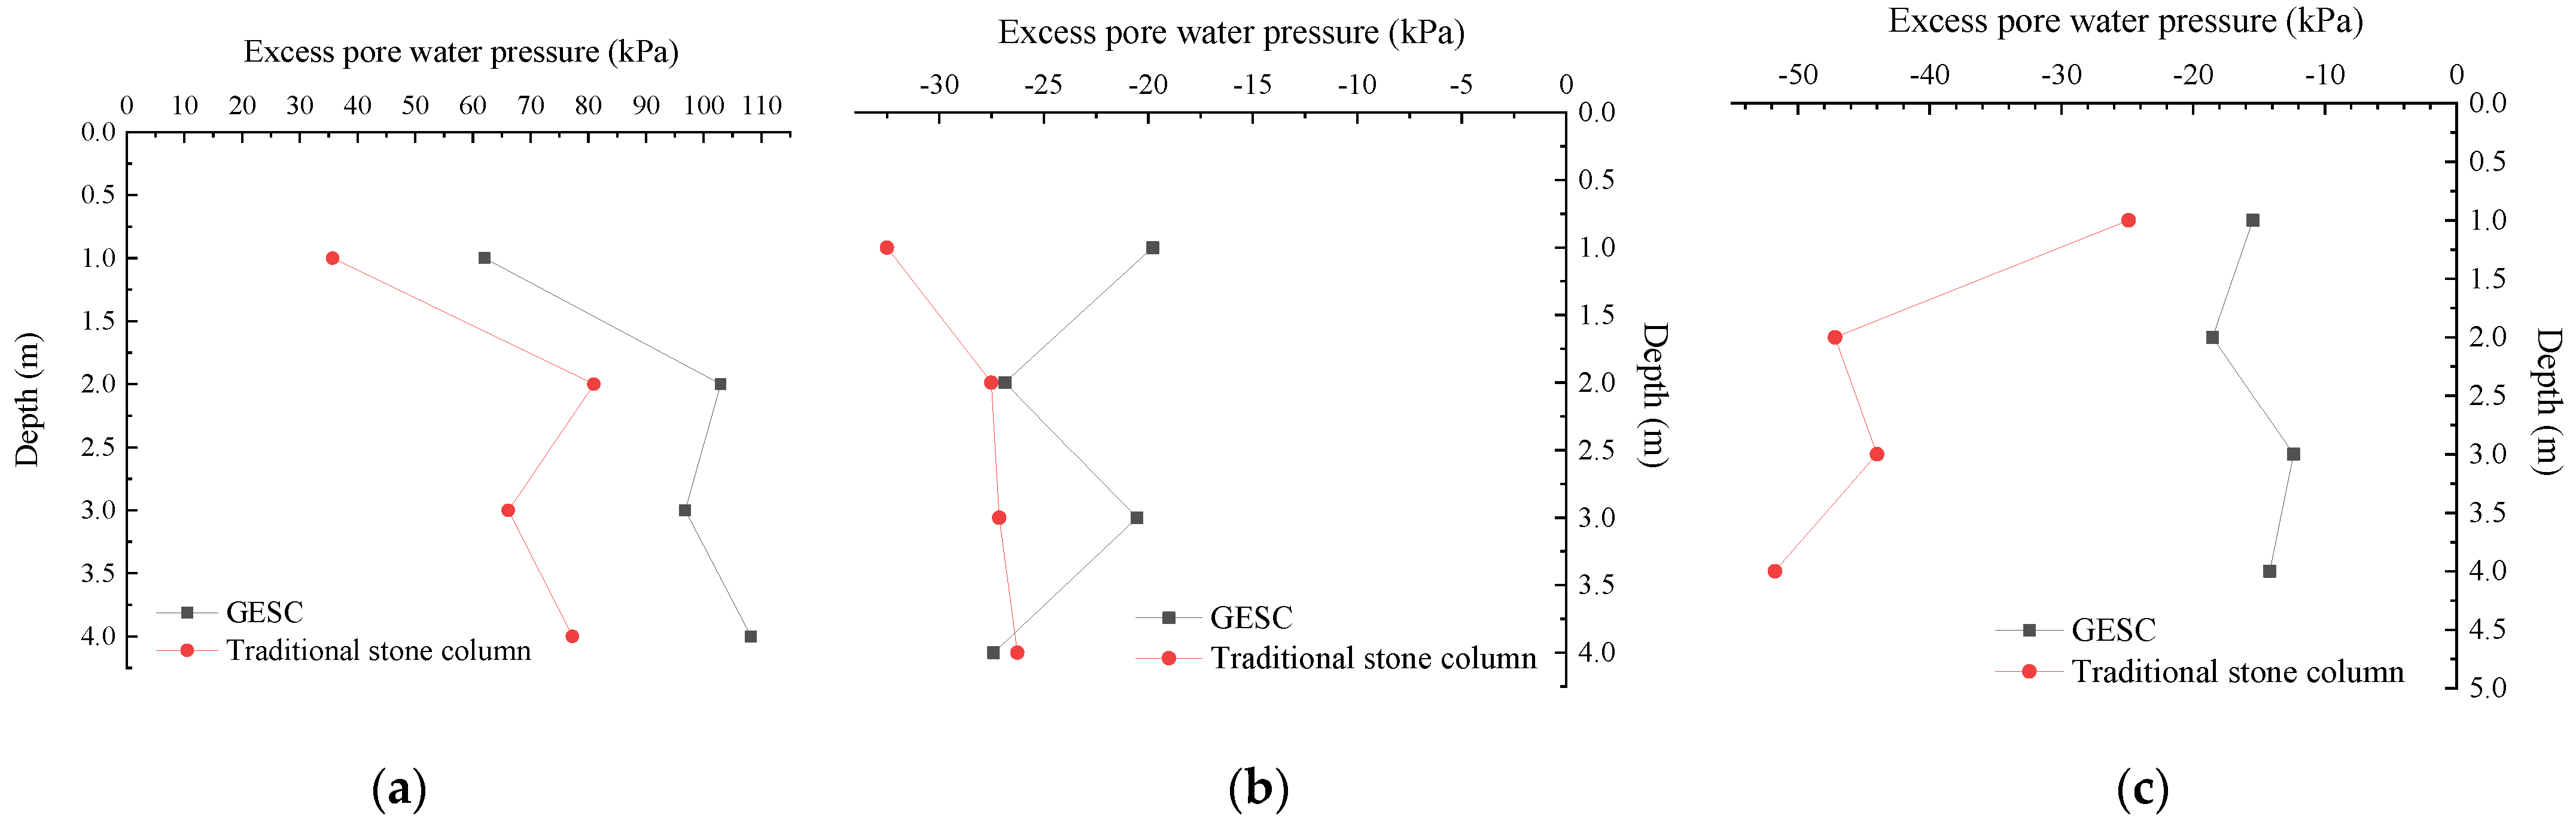
3.2. Excess Pore Water Pressure

The change of excess pore water pressure of the traditional stone column and the GESC with time is shown in Figure 10. The embankment filling is relatively frequent in 1~22 days. Basically, one layer is filled every day, and a total of 10.5 m is filled. The excess pore water pressures at each depth of the traditional stone column and the GESC show a sharp increase in this stage. The maximum excess pore water pressure of the GESC is larger than the traditional stone column. The reason may be that there is a certain difference in the soil permeability of the two subgrade sections. In addition, in the early stage of filling construction, since the traditional stone column is not wrapped with geotextile and its drainage path is not blocked, the cumulative value of excess pore water pressure of traditional stone column is smaller than that of the GESC. The last two layers of filling are completed on the 32nd and 45th days. Because of the long construction interval, the excess pore water pressures of two pile types decrease significantly. In the 46th to 75th days, because the construction site rains frequently and the slope surface of subgrade is filled and reinforced, the excess pore water pressure of the traditional stone column rises. However, due to the good drainage performance of the GESC, the excess pore water pressure at each depth in this stage changes little or even decreases. On the 125th day, the excess pore water pressure at the depth of 2~4 m of the traditional stone column decreases to about 35 kPa. However, the excess pore water pressure of the GESC at the depth of 2~4 m drops to about 28 kPa. At any time, the excess pore water pressure of the two pile types at the depth of 1 m; that is, the junction of the fill layer and silty clay layer is significantly less than that at the depth of 2~4 m. This is because the burial depth at 1 m depth is shallow, the drainage path is short, and the excess pore water pressure dissipates quickly.
The change of excess pore water pressure at the two monitoring sections of subgrade can be divided into three stages: intensive filling stage (1–22 days), interval filling stage (23–45 days) and monitoring stage after construction (46–125 days). The change of excess pore water pressure at different depths of two monitoring sections in different time periods is shown in Figure 11. The interval of filling construction in the first 22 days is very short. On the 22nd day, the peak values of excess pore water pressure at the depth of 1~4 m of the GESC are 62 kPa, 103 kPa, 97 kPa and 108 kPa, respectively. The peak values of excess pore water pressure at the depth of 1~4 m of the traditional stone column are 36 kPa, 81 kPa, 66 kPa and 77 kPa, respectively, and the values are less than those of the GESC. The reason may be that there is a certain difference in the soil permeability of the two subgrade sections. In the early stage of filling construction, the blocking effect of the drainage path of the traditional stone column is not obvious, while the existence of geotextile slows down the dissipation rate of the excess pore water pressure in the wrapping section of stone column. The construction interval of the last two layers of soil filling within the 23–45 days is relatively long, and the excess pore water pressure in the two monitoring sections of subgrade has decreased significantly. The reduction value of excess pore water pressure of the GESC at the depth of 1~3 m is greater than that of the traditional stone column. The reason may be that in the middle and late stage of subgrade filling, the drainage path of the traditional stone column appears blocking effect. The filtering effect of geotextile bag makes the blocking effect of the GESC smaller, so it enhances the dissipation rate of excess pore water pressure of the GESC. In the 46th to 125th days, the reduction value of the excess pore water pressure at each depth of the GESC is greater than that of the traditional stone column. The reason is also that the GESC has better drainage performance than the traditional stone column in the later stage of subgrade filling and the monitoring stage after construction. This is more conducive to the dissipation of excess pore water pressure in composite foundation.

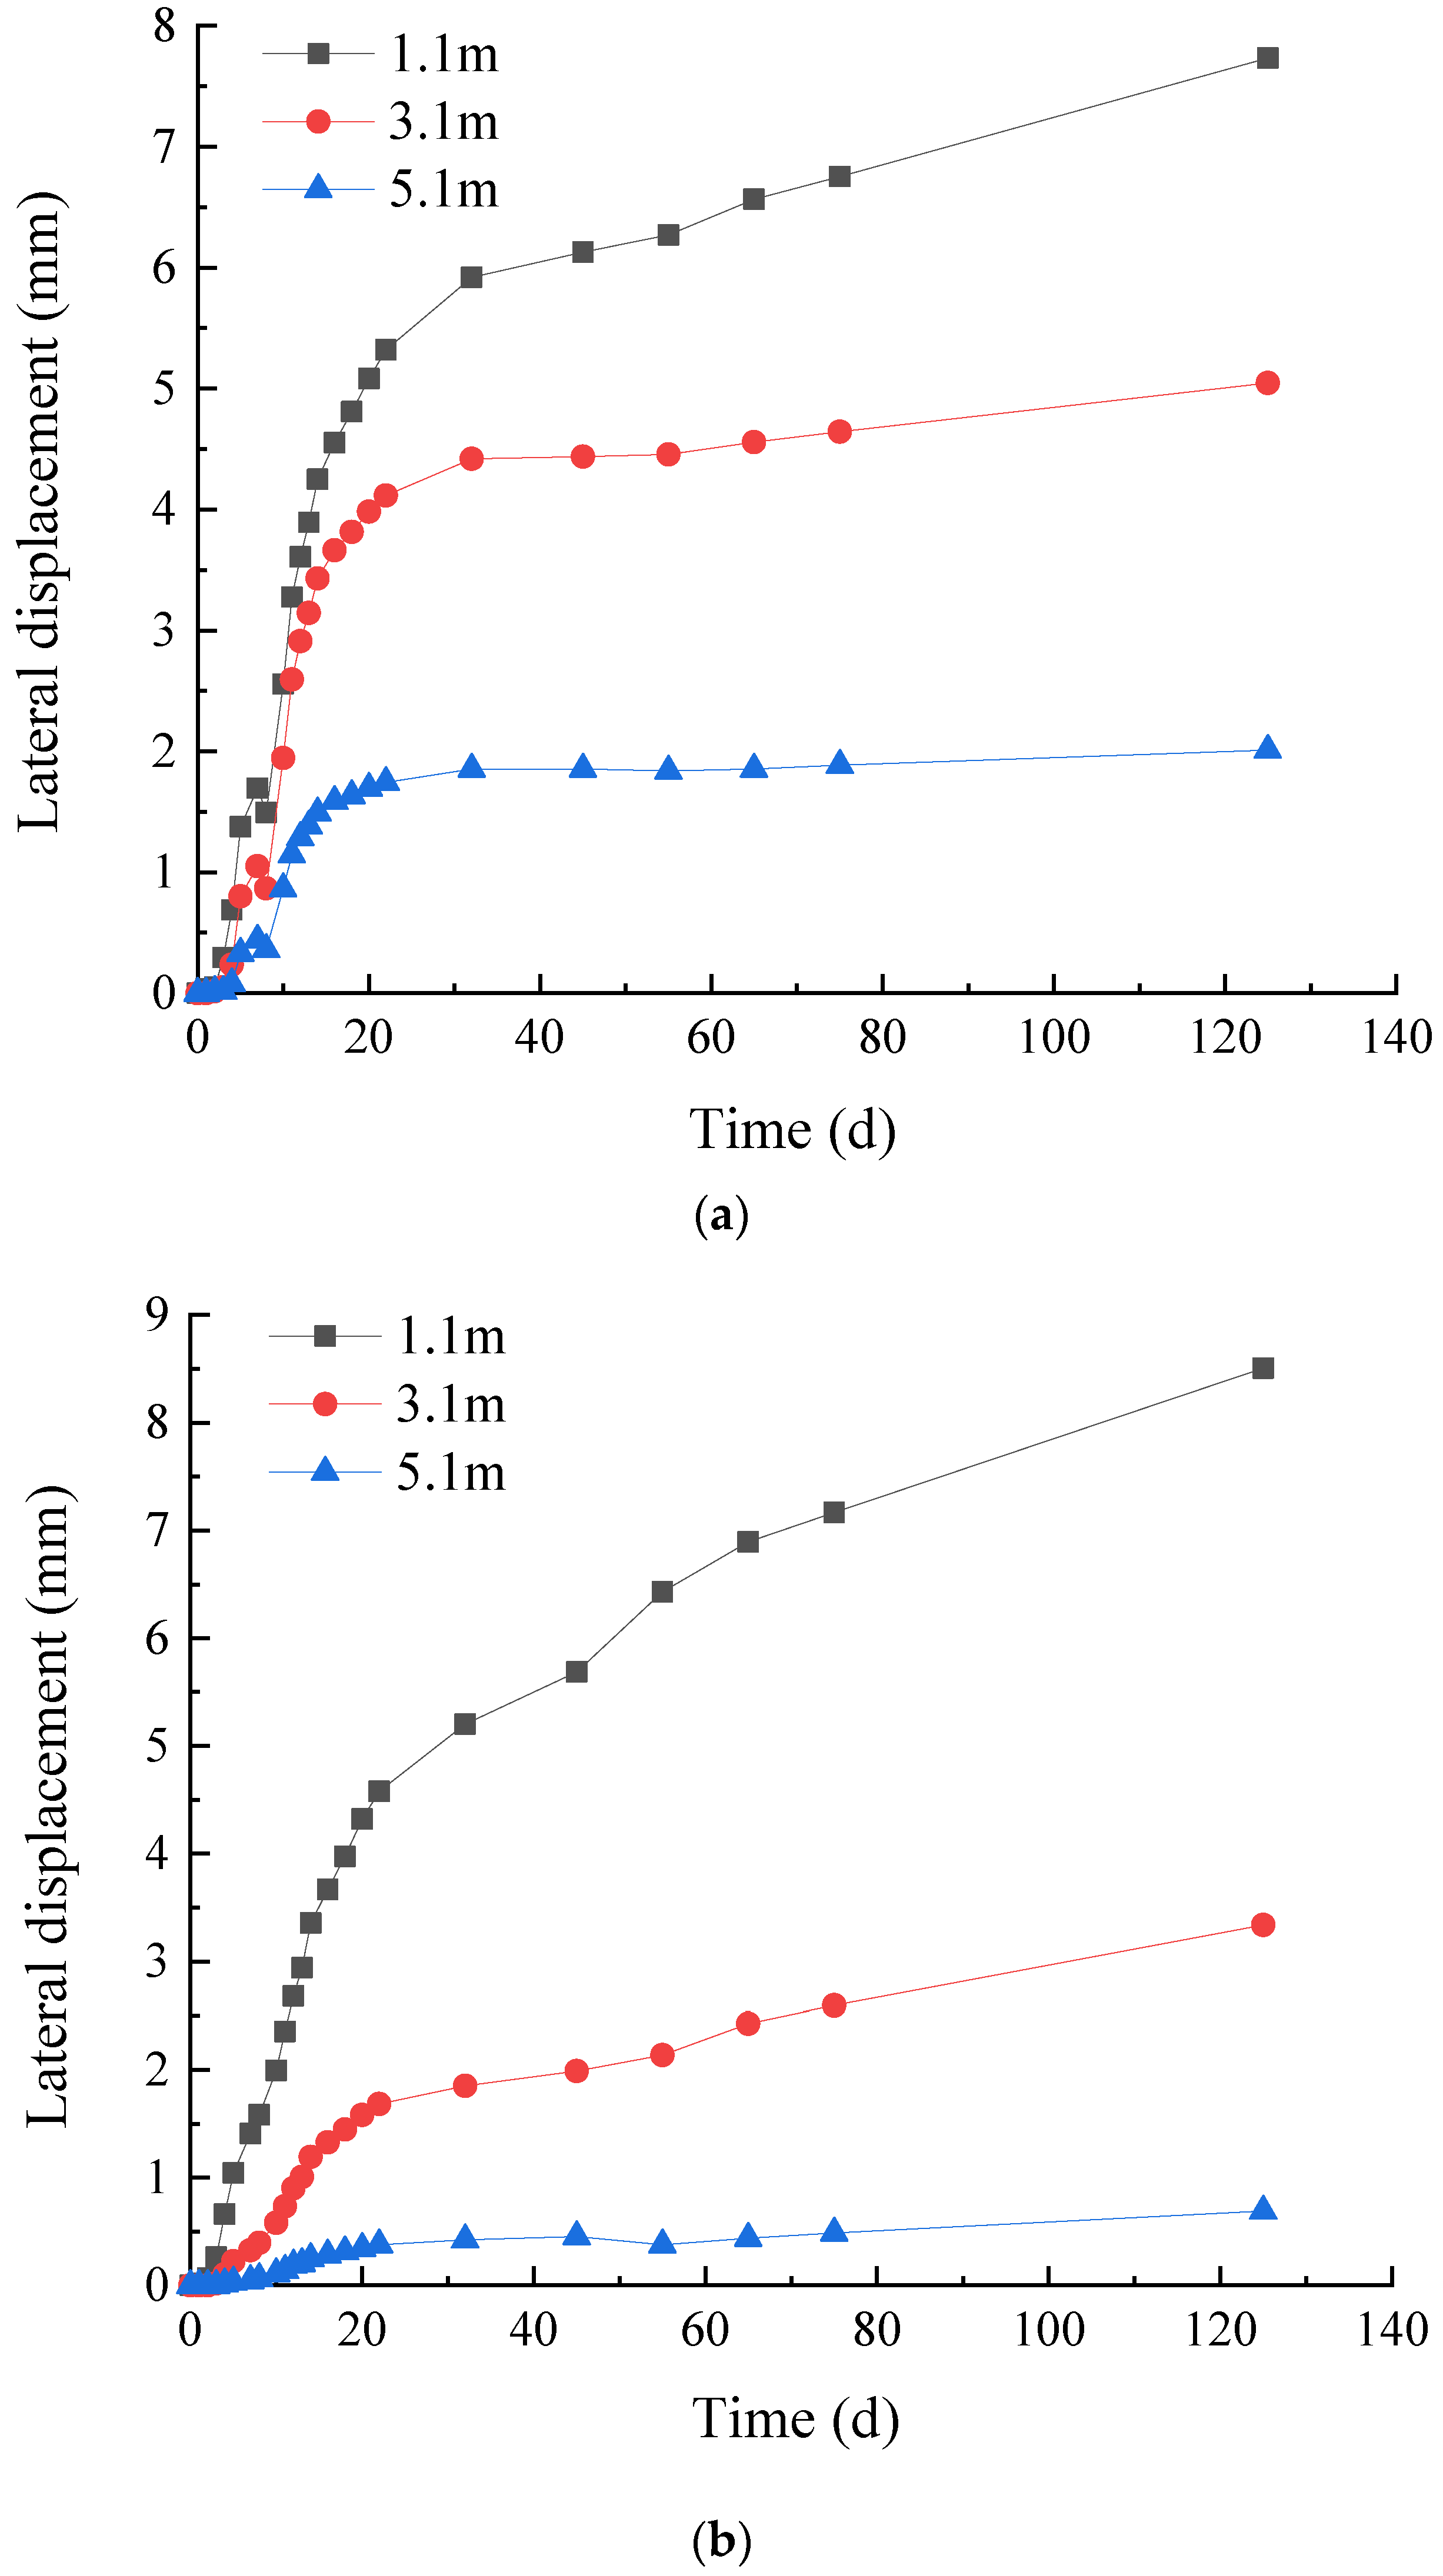
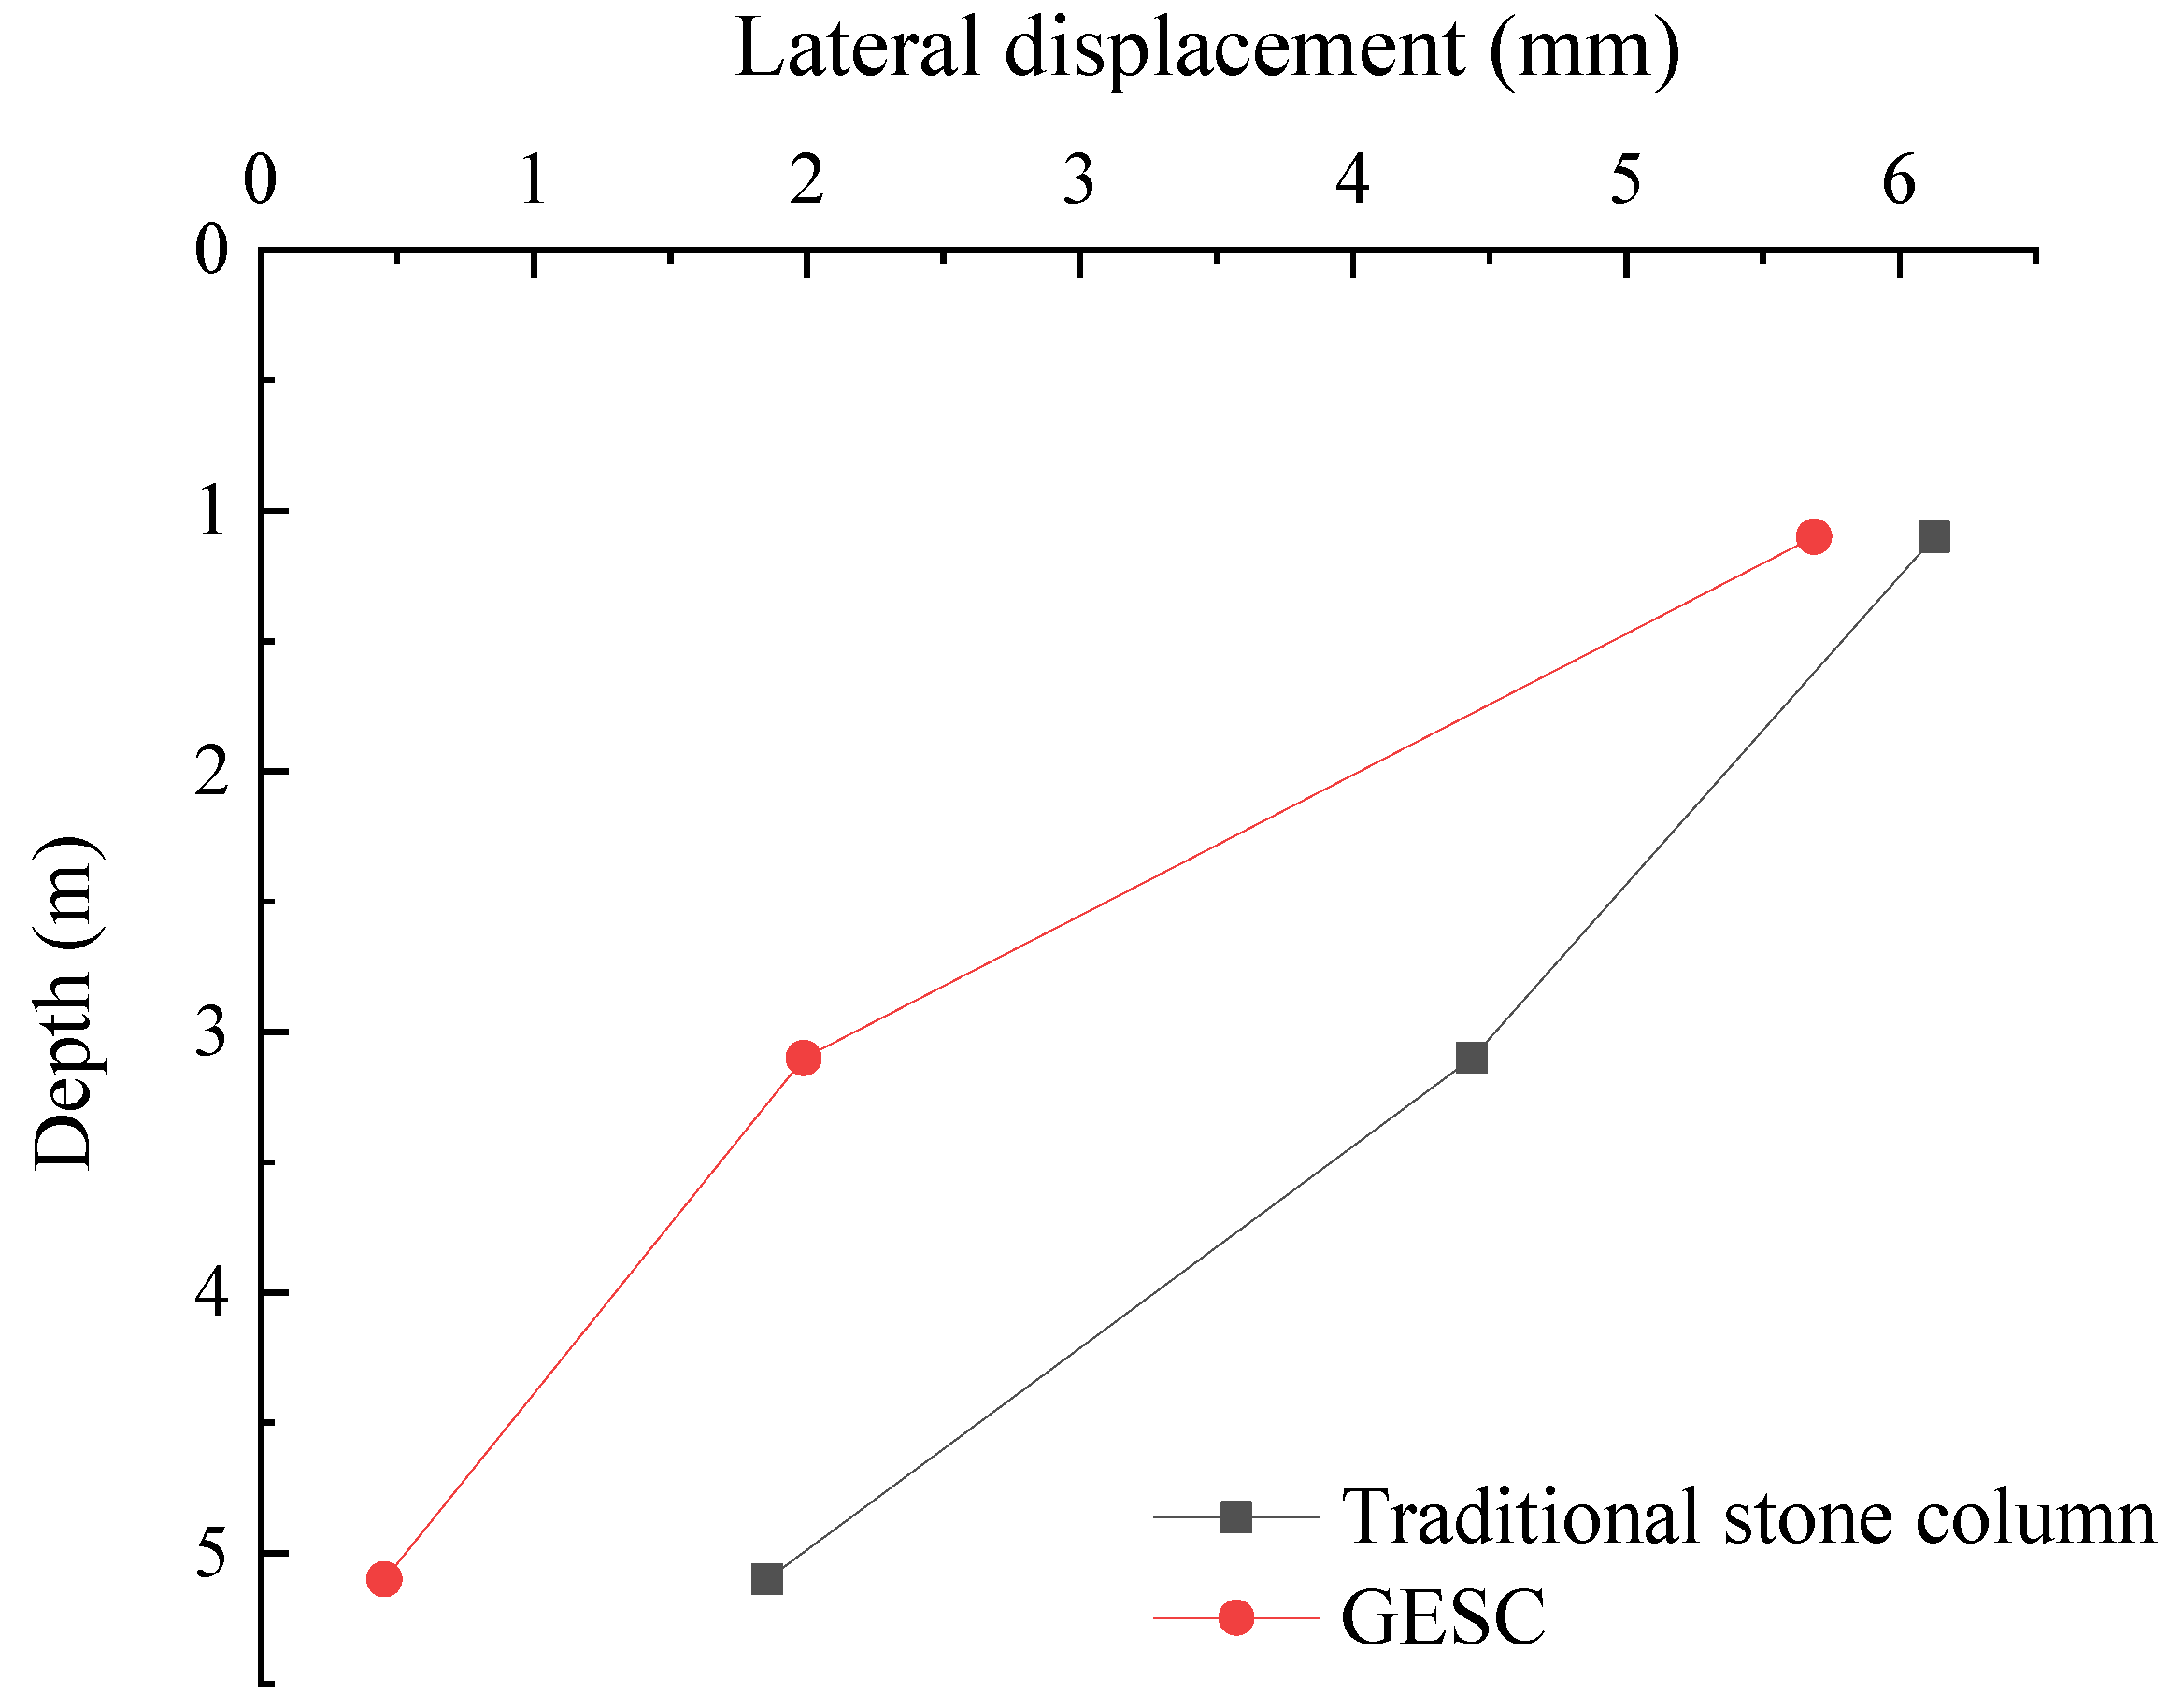
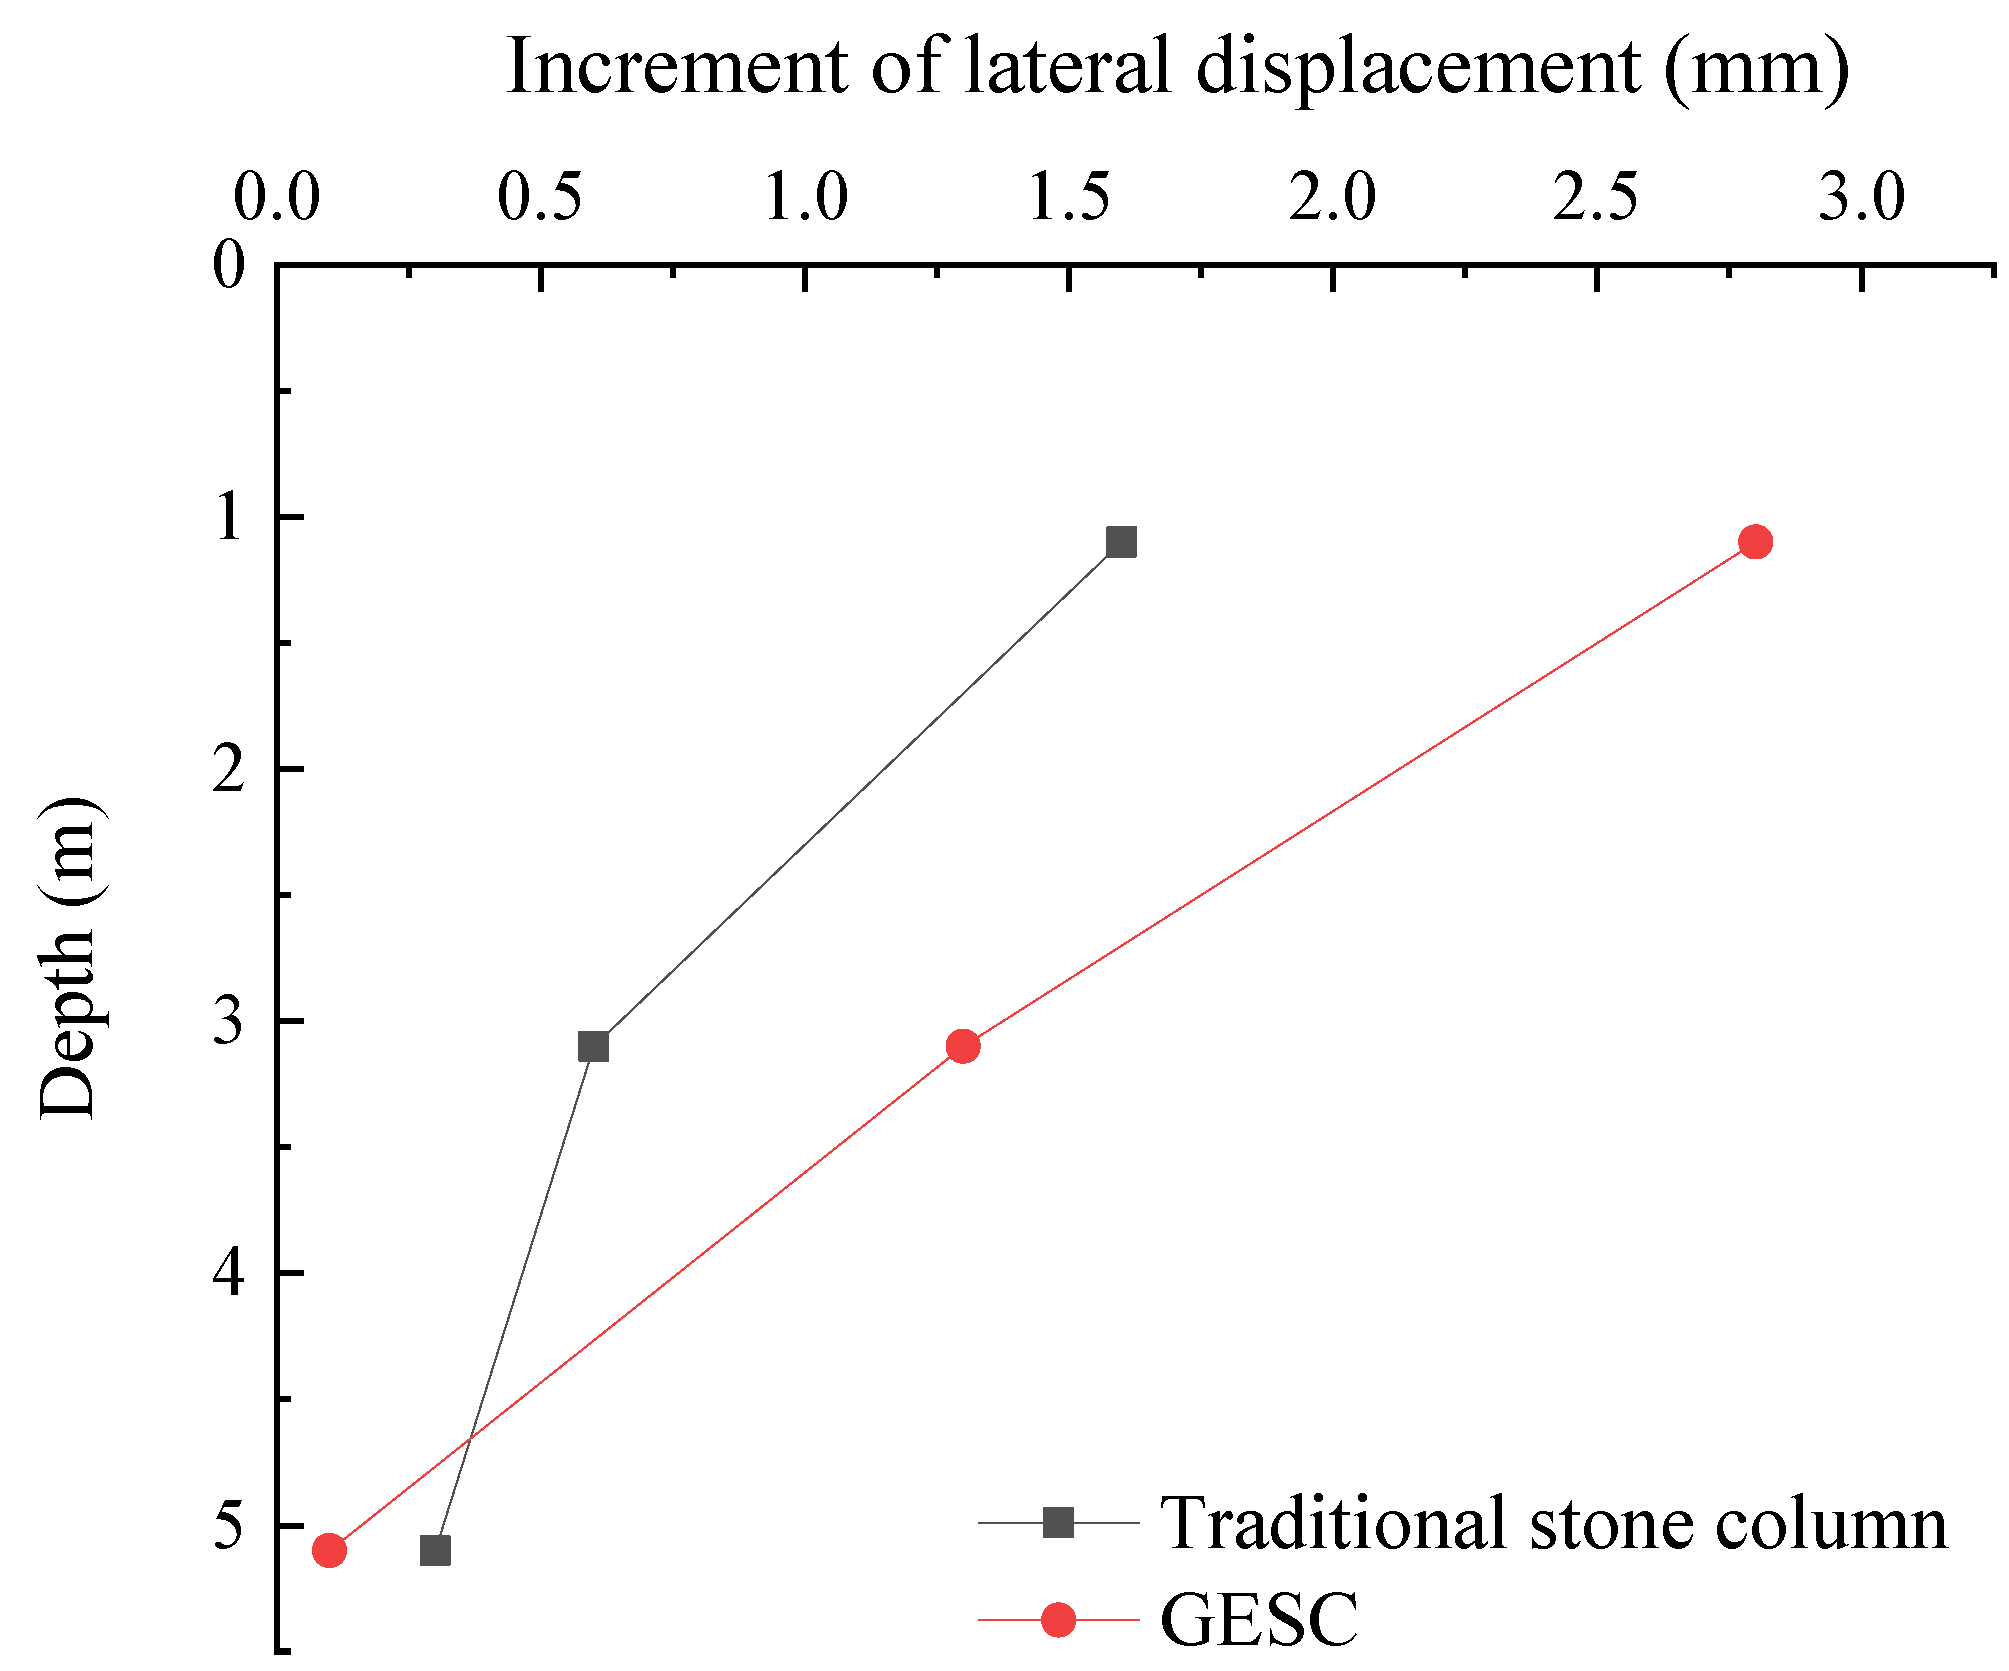
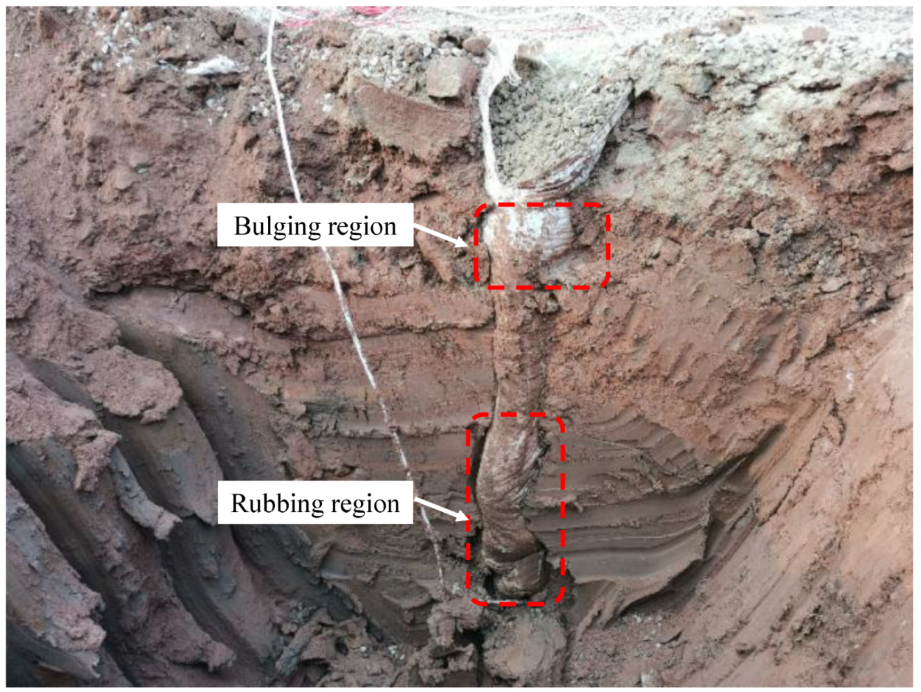
3.3. Lateral Displacement of Soil Mass

The lateral displacement of soil mass at each depth of the GESC and the traditional stone column is shown in Figure 12. In the intensive filling stag, the lateral displacement of soil mass at different depths of the two pile types increases rapidly. In the interval filling stage, compared with the previous stage, the lateral displacement of soil at each depth of the two pile types increases slightly. Compared with the traditional stone column, the increase rate of lateral displacement of the GESC is smaller. In the monitoring stage after construction, the lateral displacement of soil mass at each depth of two pile types continues to increase with time. Their lateral displacement curves tend to be gentle, which indicates that the consolidation of foundation soil has not been completed.
On the 45th day after the completion of subgrade filling, the lateral displacement of soil mass at each depth of subgrade monitoring sections of the GESC, and the traditional stone column is shown in Figure 13. The lateral displacement of soil mass at each depth of the GESC subgrade is smaller than that of the traditional stone column subgrade. Compared with the traditional stone column subgrade, the lateral displacement of soil mass the GESC subgrade at the depth of 1.1 m decreases by 7.2%; at the depth of 3.1 m it decreases by 55.2%; and at the depth of 5.1 m it decreases by 75.5%. This indicates that the strength of composite foundation can be increased, and the settlement of foundation can be reduced by using the GESC. This phenomenon can be explained from the perspective of particle movement. Under the same conditions, geosynthetics restricts the lateral movement of particles and reduces the lateral displacement of soil. The lateral pressure coefficient of the GESC at the boundary wrapped by geotextile is greater than that of traditional gravel pile at the same location [26]. Therefore, the horizontal stress distribution of the GESC is different from that of traditional stone column. The squeezing effect of the GESC on deep soil mass is weakened, which reduces the lateral displacement of deep soil in subgrade filling stage (1–45 days). The geosynthetic material enhances the tensile and shear strength of composite foundation soil mass through reinforcement effect [27,28]. However, the reduction ratio of soil lateral displacement at 1.1 m depth is obviously smaller than that at deeper depth. This may be caused by the inconsistent surcharge at the slope toe of the two subgrade monitoring sections during the subgrade filling stage. The soil mass at the slope toe of the monitoring section of the traditional stone column subgrade is filled to flush with the existing road on the east side (about 2.3 m), as shown in Figure 14. However, the slope toe of the monitoring section of the GESC subgrade is not filled. As a result, the lateral displacement of soil mass at the depth of 1.1 m of the monitoring section of the traditional stone column subgrade is smaller than the actual value (no filling at the slope toe).
On the 125th day after the completion of subgrade filling, the increment of lateral displacement of soil mass at each depth of subgrade monitoring sections of the GESC and the traditional stone column is shown in Figure 15. At the depths of 1.1 m and 3.1 m, the increment of lateral displacement of soil mass of the GESC subgrade is larger than that of the traditional stone column subgrade. It may be that the soil mass filled at the slope toe of the subgrade monitoring section of the traditional stone column reduces the lateral displacement of the soil mass in the monitoring period. At the depth of 5.1 m, the increment of lateral displacement of soil mass of the GESC subgrade is smaller than that of the traditional stone column subgrade. In summary, the method of wrapping stone column with geotextile bag can effectively improve the overall strength of the composite foundation and reduce the lateral displacement of the deep soil mass of the composite foundation in the subgrade filling stage.

4. Numerical Simulation of the Composite Foundation Reinforced by the GESC

The field test can directly reflect the actual reinforcement effect of the GESC. However, due to the long time and high cost of field test, it is difficult to set up many control group tests to analyze the different parameters of the GESC one by one. The field test is difficult to accurately control variables for comparison test because of the large dispersion of geological conditions. Therefore, many researchers use numerical simulation to simulate and analyze various variables that are difficult to consider in field tests. In this section, the MIDAS GTS NX [29] finite element software is used to study the influence of geotextile wrapping length, geotextile stiffness and internal friction angle of stone column on the bearing characteristics of composite foundation. The bearing characteristics of the foundation are analyzed mainly from the perspectives of foundation settlement and bulging deformation of the pile body.

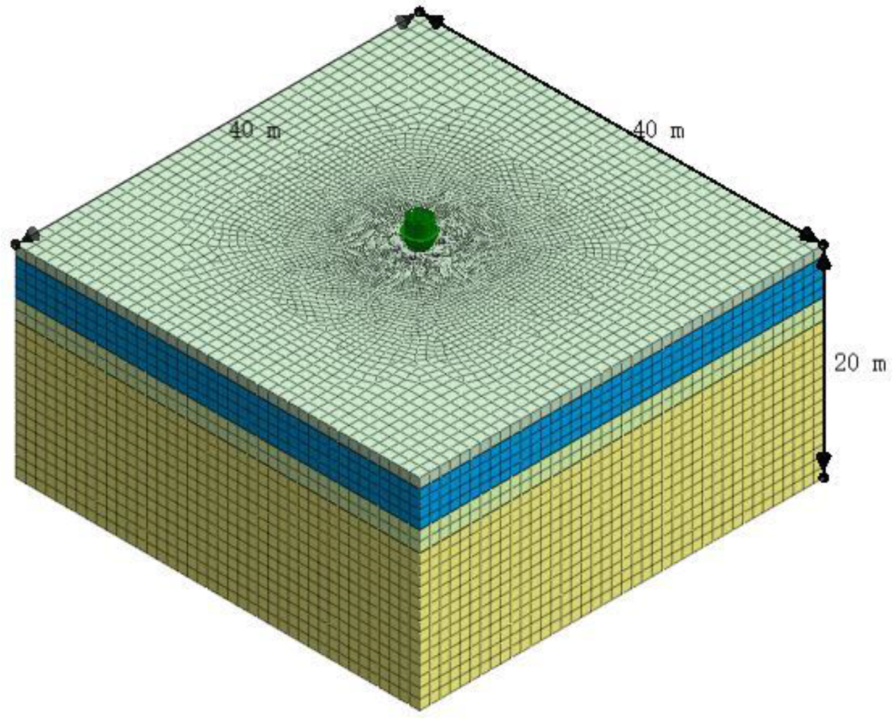
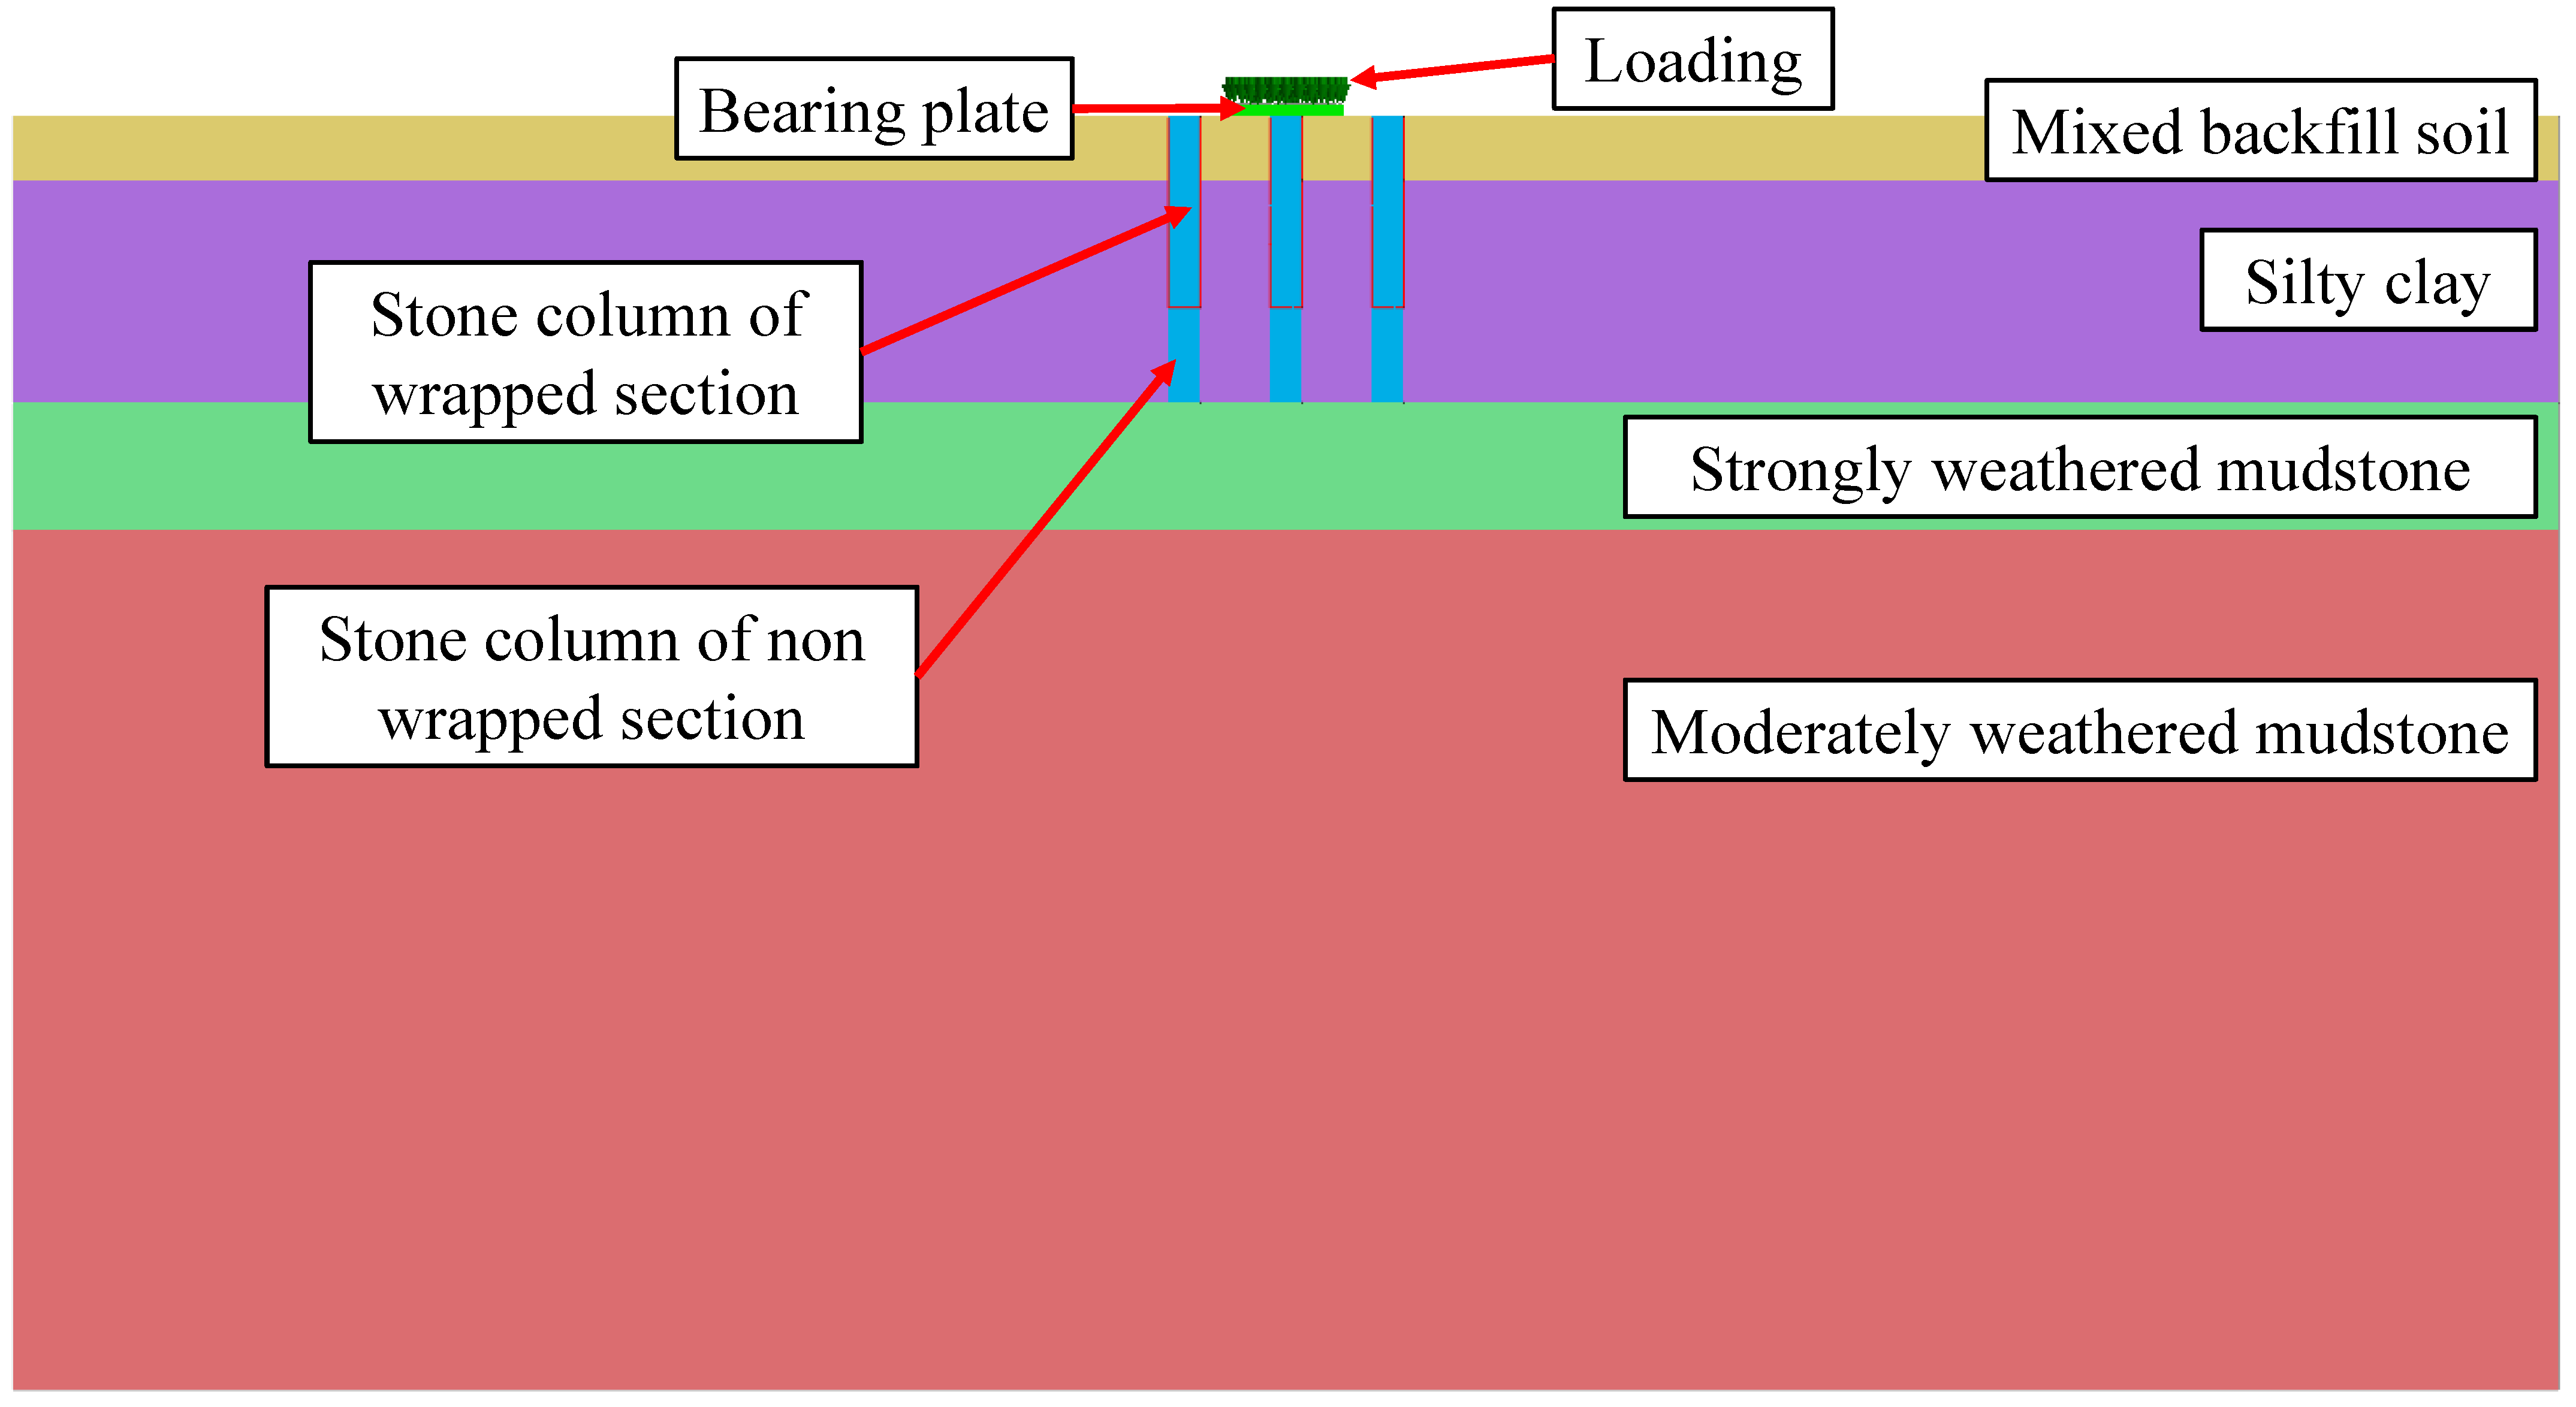
4.1. Establishment of Finite Element Model

According to the geological conditions and loading mode of the static load field test of single GESC, a 3D numerical calculation model is established, as shown in Figure 16. Static load field test of single GESC is shown in Figure 17. Static load test of single pile composite foundation is carried out based on the specification in “Technical code for ground treatment of buildings” (JGJ79-2012) in China. In order to reduce the influence of boundary effects on the calculation results, the horizontal and vertical boundaries of the model are at a distance of more than three times the pile length, and the model is 40 m long, 40 m wide and 20 m high. The distance from the lateral boundary of the model and the distance between the lower bound of the model from the top should be taken sufficient so that the effects of the boundaries in the numerical model on the results were minimized. The displacement and the stress contours in the finite element software indicate that this distance is sufficient [30,31]. Set horizontal fixed constraints around the model, and set vertical and horizontal fixed constraints at the bottom of the model. The self-weight stress is set in the model as a whole to simulate the self-weight of each soil layer and the initial stress of the site. The profile diagram of the GESC composite foundation model is shown in Figure 18. Six similarly GESCs are set up around the central pile. The pile spacing and row spacing are 1.6 m. The pile length is 4.5 m, and the wrapping length is 3 m. From top to bottom, they are respectively the filling layer (1 m), silty clay layer (3.5 m), strongly weathered mudstone (2 m) and moderately weathered mudstone (13.5 m). The stone column in the wrapping section is wrapped with the geogrid element, and the interface contact element is established on the inside and outside of the geogrid element. Because the pile diameter is 0.5 m, we control the grid size near the pile body to be 0.1 m. To improve the computational efficiency, we control the grid size at the boundary to be 1 m. The middle part of the grid is automatically divided by the software according to the linear gradient. The model has a total of 208,727 elements and 38,965 nodes.
Based on the site geological investigation results and the description of the parameters of rock and soil and bearing plate in the previous literature [32,33], the parameters of rock and soil mass and bearing plate used in this numerical simulation are shown in Table 1. The large strain problem in geotechnical engineering needs to be simulated using an elastic-plastic constitutive model. Because the Mohr–Coulomb model in the elastic-plastic constitutive model is used more frequently and the parameters are easy to obtain, the Mohr–Coulomb model is used to simulate the rock and soil mass in this simulation. This model can better reflect various mechanical properties of rock and soil mass. It is suitable for yielding under shear stress; the calculation formula for shear stress can be expressed as
f s = σ 1 σ 3 1 + sin φ 1 sin φ 2 c 1 + sin φ 1 sin φ
where fs is the shear stress, σ1 and σ3 are the maximum and minimum principal stresses, respectively. The shear stress only depends on the σ1 and σ3. The second principal stress has no effect on the yield of the material.
The expression form of yield surface function of the Mohr–Coulomb elastic-plastic model can be expressed as
F = R c q p tan φ c = 0 R c = 1 3 cos φ sin θ + π / 3 cos 3 θ = r 3 / q 3 + 1 3 cos θ + π / 3 tan φ
where F is the shear type strength criterion; Rc is the shape parameter that controls the yield surface in the π-plane; q is the equivalent shear stress; p is the average principal stress; φ is the internal friction angle; c is the cohesion; r is the third deviator stress invariant; θ is the polar deflection angle.
After the completion of the static load test of single pile composite foundation, the pile body of the wrapped section is excavated, as shown in Figure 19. In the excavated part, it can be seen that the pile body has obvious bulging deformation at about 1 m (2 D, D is the pile diameter) from the ground. There is no obvious bulging deformation in the pile body of the deeper wrapped section. The obvious lateral displacement at the bottom of the pile body is caused by the friction and collision of the excavator during excavation construction. The overall deformation of the GESC after excavation on site is smaller, and the pile integrity of the wrapped section is better. There are no obvious geotextile bag rupture or stacking phenomenon, which indicates that the strength of the geotextile bag also basically meets the site construction requirements. The geogrid element in MIDAS GTS NX software is used to simulate geotextile. The geogrid element has no flexural stiffness, only axial stiffness, and stiffness only in tension. In general, the secant stiffness corresponding to 5% strain in the process of geotextile spline tensile test is the stiffness of geotextile in the numerical model [34]. Therefore, the stiffness of geotextile in the model is 500 kN/m. The thickness of geotextile is about 1 mm, and the elastic modulus of geotextile is 500 MPa. The interface contact element in MIDAS GTS NX software to simulate the interaction of the geotextile element with the surrounding gravel pile and soil mass. The interface contact element can simulate the behavior of tangential sliding and normal compression non penetration between different materials. The interface virtual thickness coefficient and strength reduction coefficient are input into the interface parameters. The normal stiffness modulus, tangential modulus, interfacial friction angle and interfacial cohesion at the interface can be calculated using empirical formulas. The greater the strength difference between soil mass and adjacent structural members, the smaller the value of the virtual thickness coefficient is taken to be. The strength difference between geotextile and surrounding soil is large, so the virtual thickness coefficient is 0.01. The strength reduction coefficient of interface contact element is 0.8. MIDAS GTS NX uses the iterative solution method to solve the systems of equations for nonlinear analysis. The iterative solution method obtains a convergent solution by minimizing the error through repeated calculations. MIDAS GTS NX uses the direct solution method to solve the systems of equations for structural analysis.

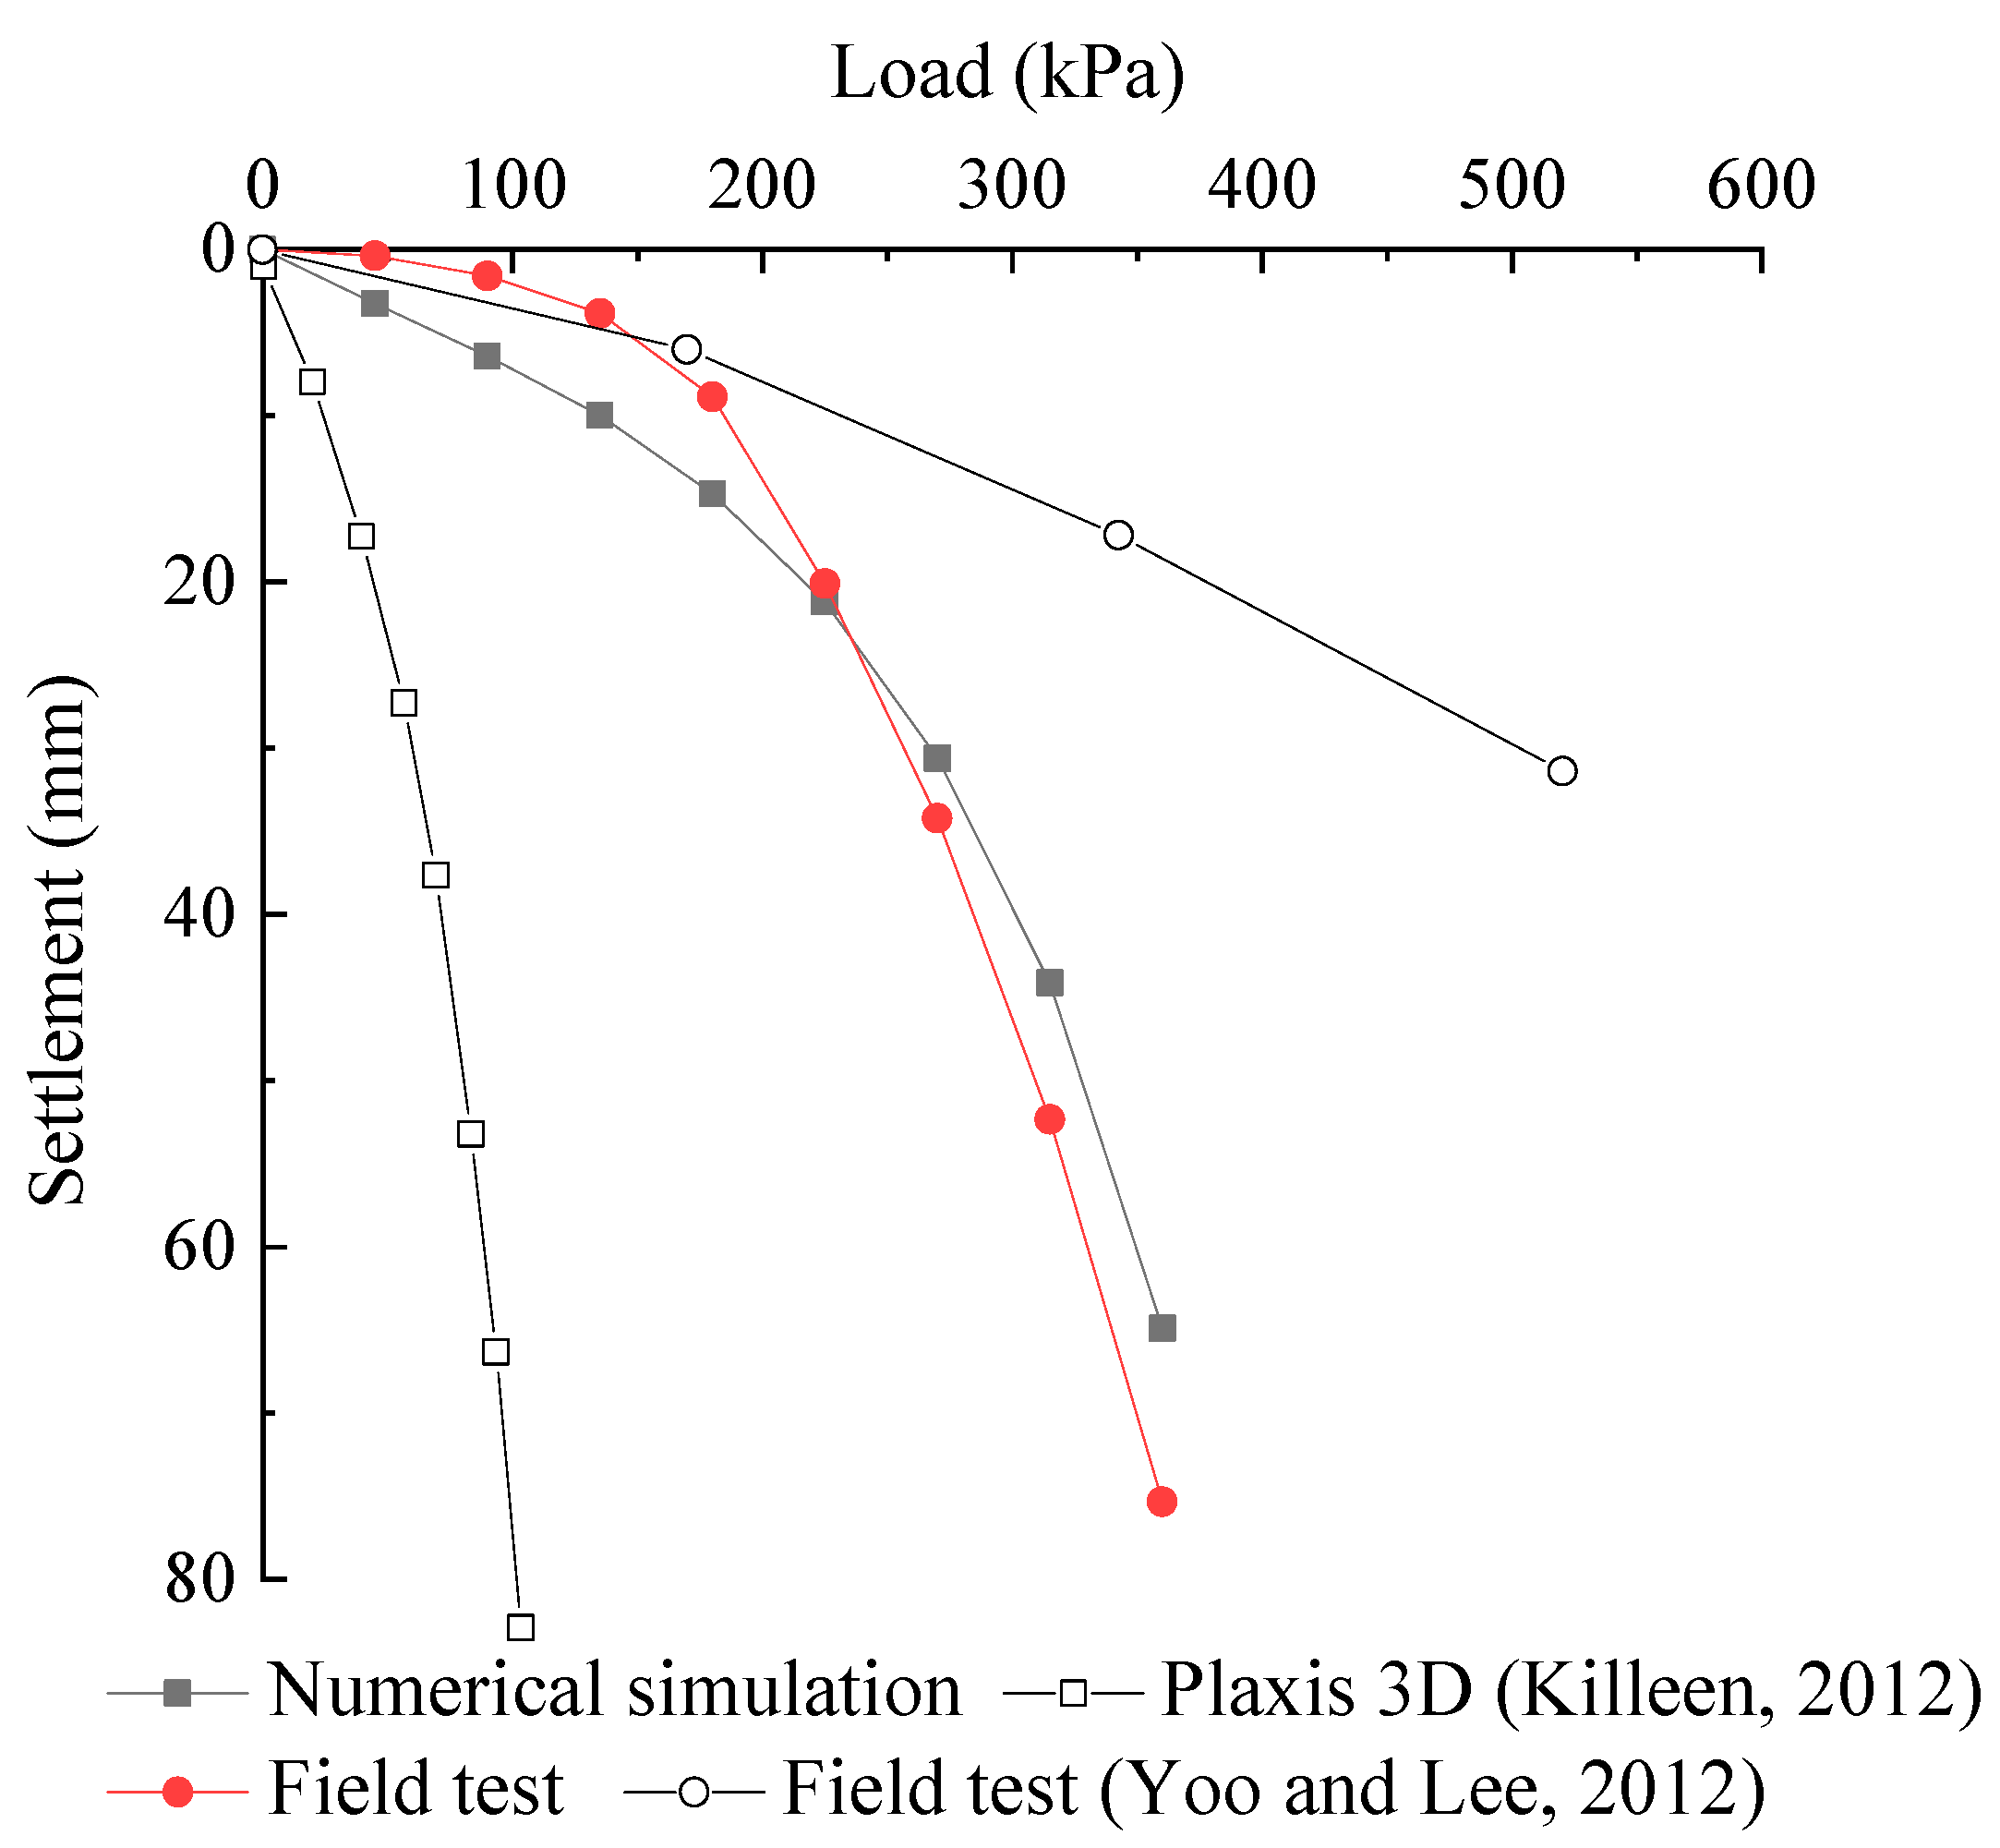
4.2. Verification of Numerical Model Results

In order to verify the rationality and accuracy of the 3D finite element calculation model, the static load test model of single GESC composite foundation is established according to the field test situation. The numerical simulation results are compared with the field test measured values for verification, and the verification results are shown in Figure 20. By comparing the numerical simulation results with the measured values of the field test, it can be known that when the field test is loaded to the eighth level load (360 kPa); the settlement is 75 mm, while the maximum settlement calculated by numerical simulation is 65 mm, with an error of 13.3%. The characteristic value of bearing capacity of single pile composite foundation corresponding to 0.01 de (Equivalent circle diameter) settlement in field test is 216.6 kPa. The characteristic value of bearing capacity of single pile composite foundation simulated by numerical method is 202.9 kPa, with an error of 6.3%. It can be seen from the above error analysis that the numerical calculation model used in this paper is reasonable and reliable, and further analysis of the GESC composite foundation can be carried out on the basis of this numerical model. In Figure 20, we also compare the results of this study with existing research results. Killeen [24] conducted a static load test of stone column composite foundation. It can be seen that the characteristic value of bearing capacity of stone column composite foundation is significantly smaller than that of GESC composite foundation. Yoo and Lee [15] conducted a static load test of geogrid-encased stone column composite foundation. Their geogrid-encased stone column has larger pile diameter, pile length and wrapping length, so the bearing capacity characteristic value of the geogrid-encased stone column composite foundation are greater.

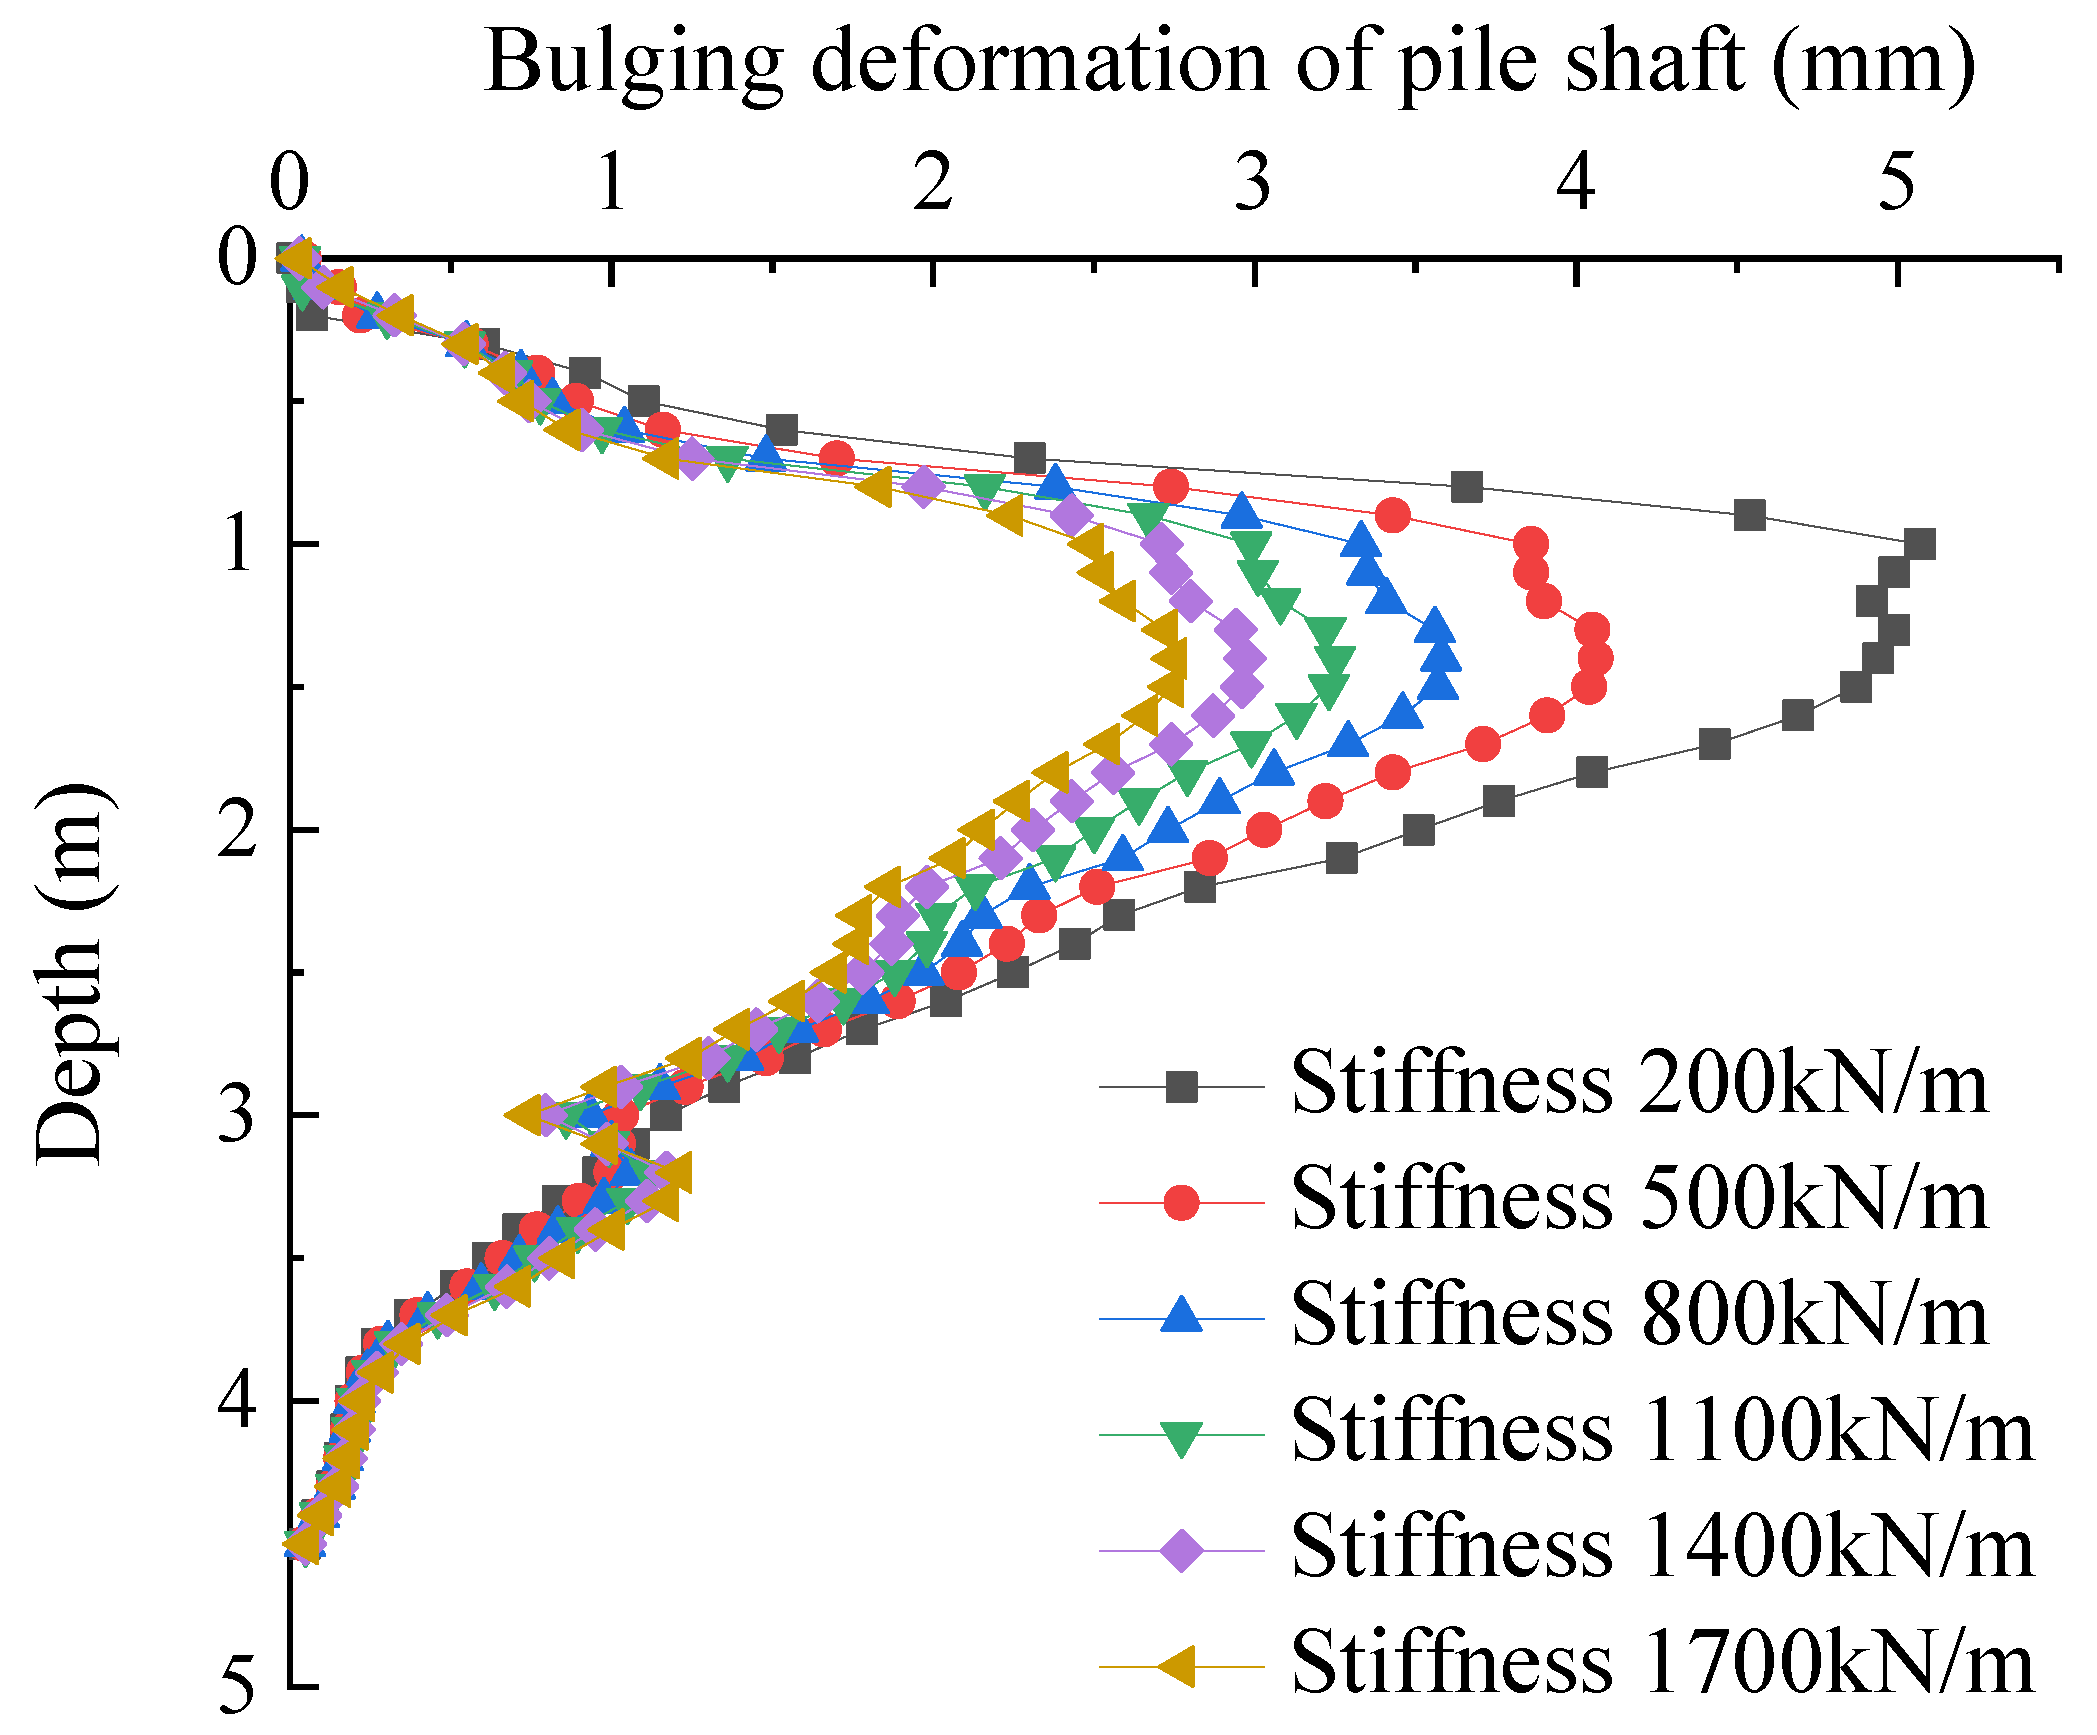
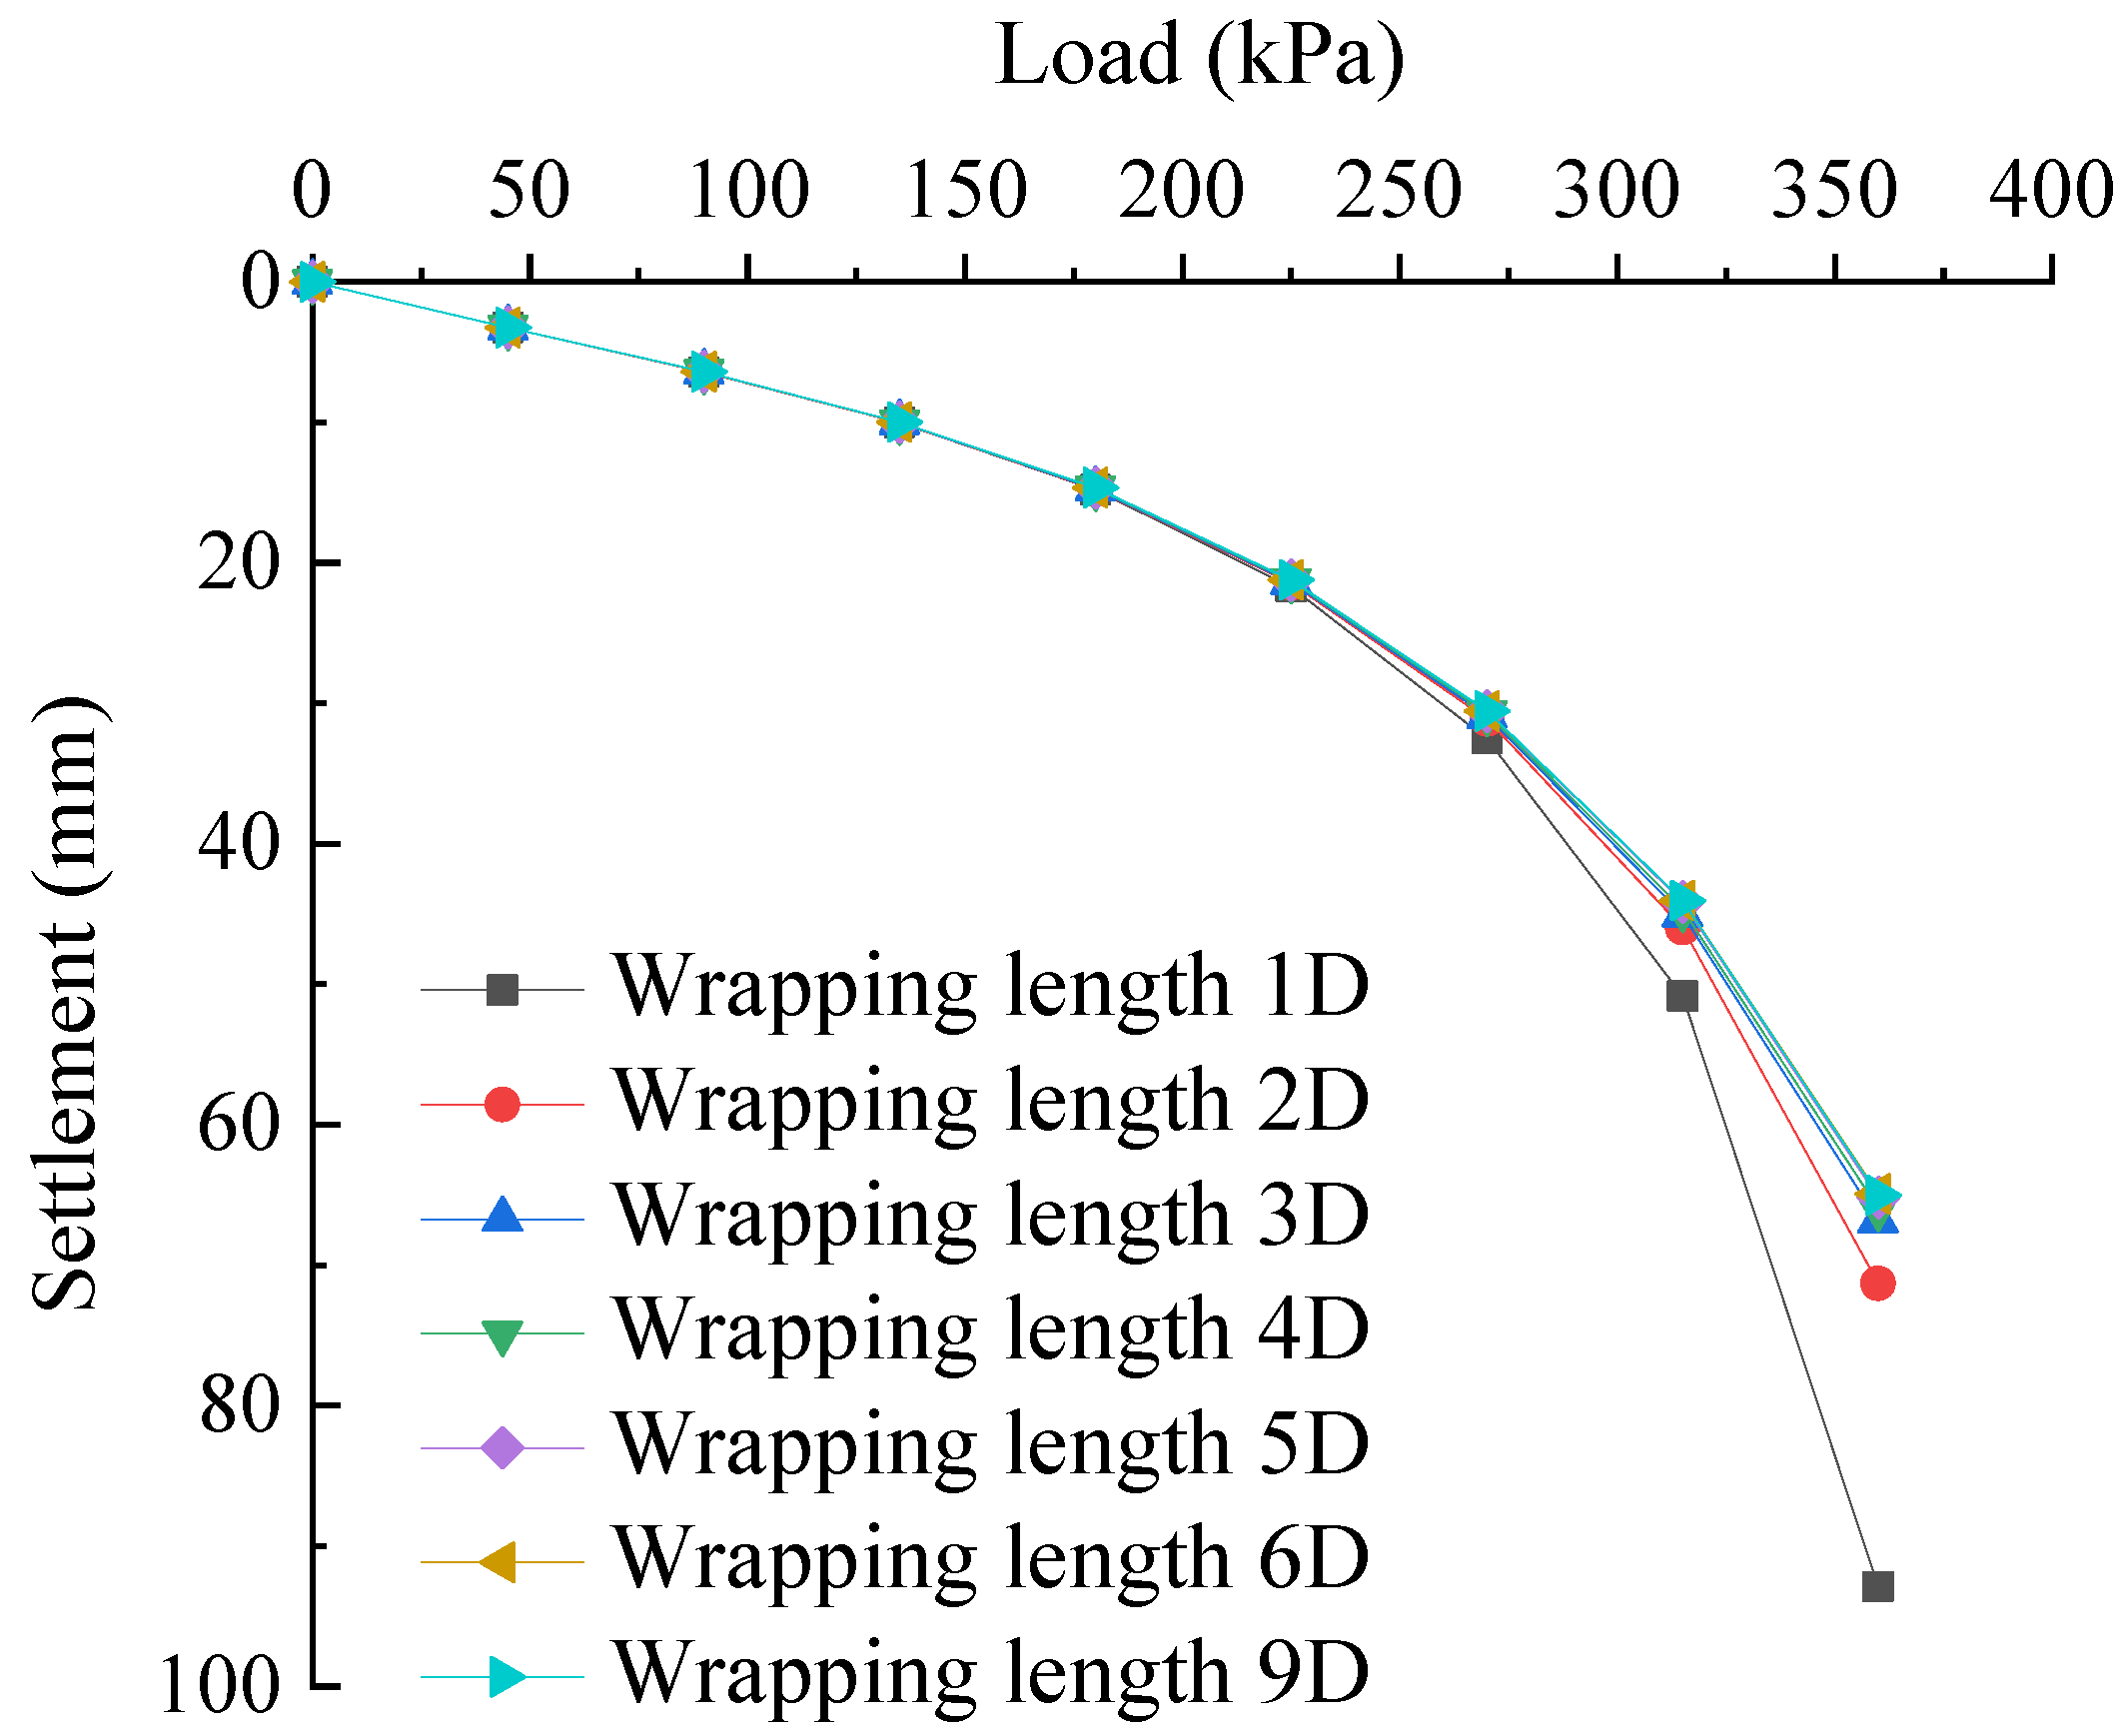
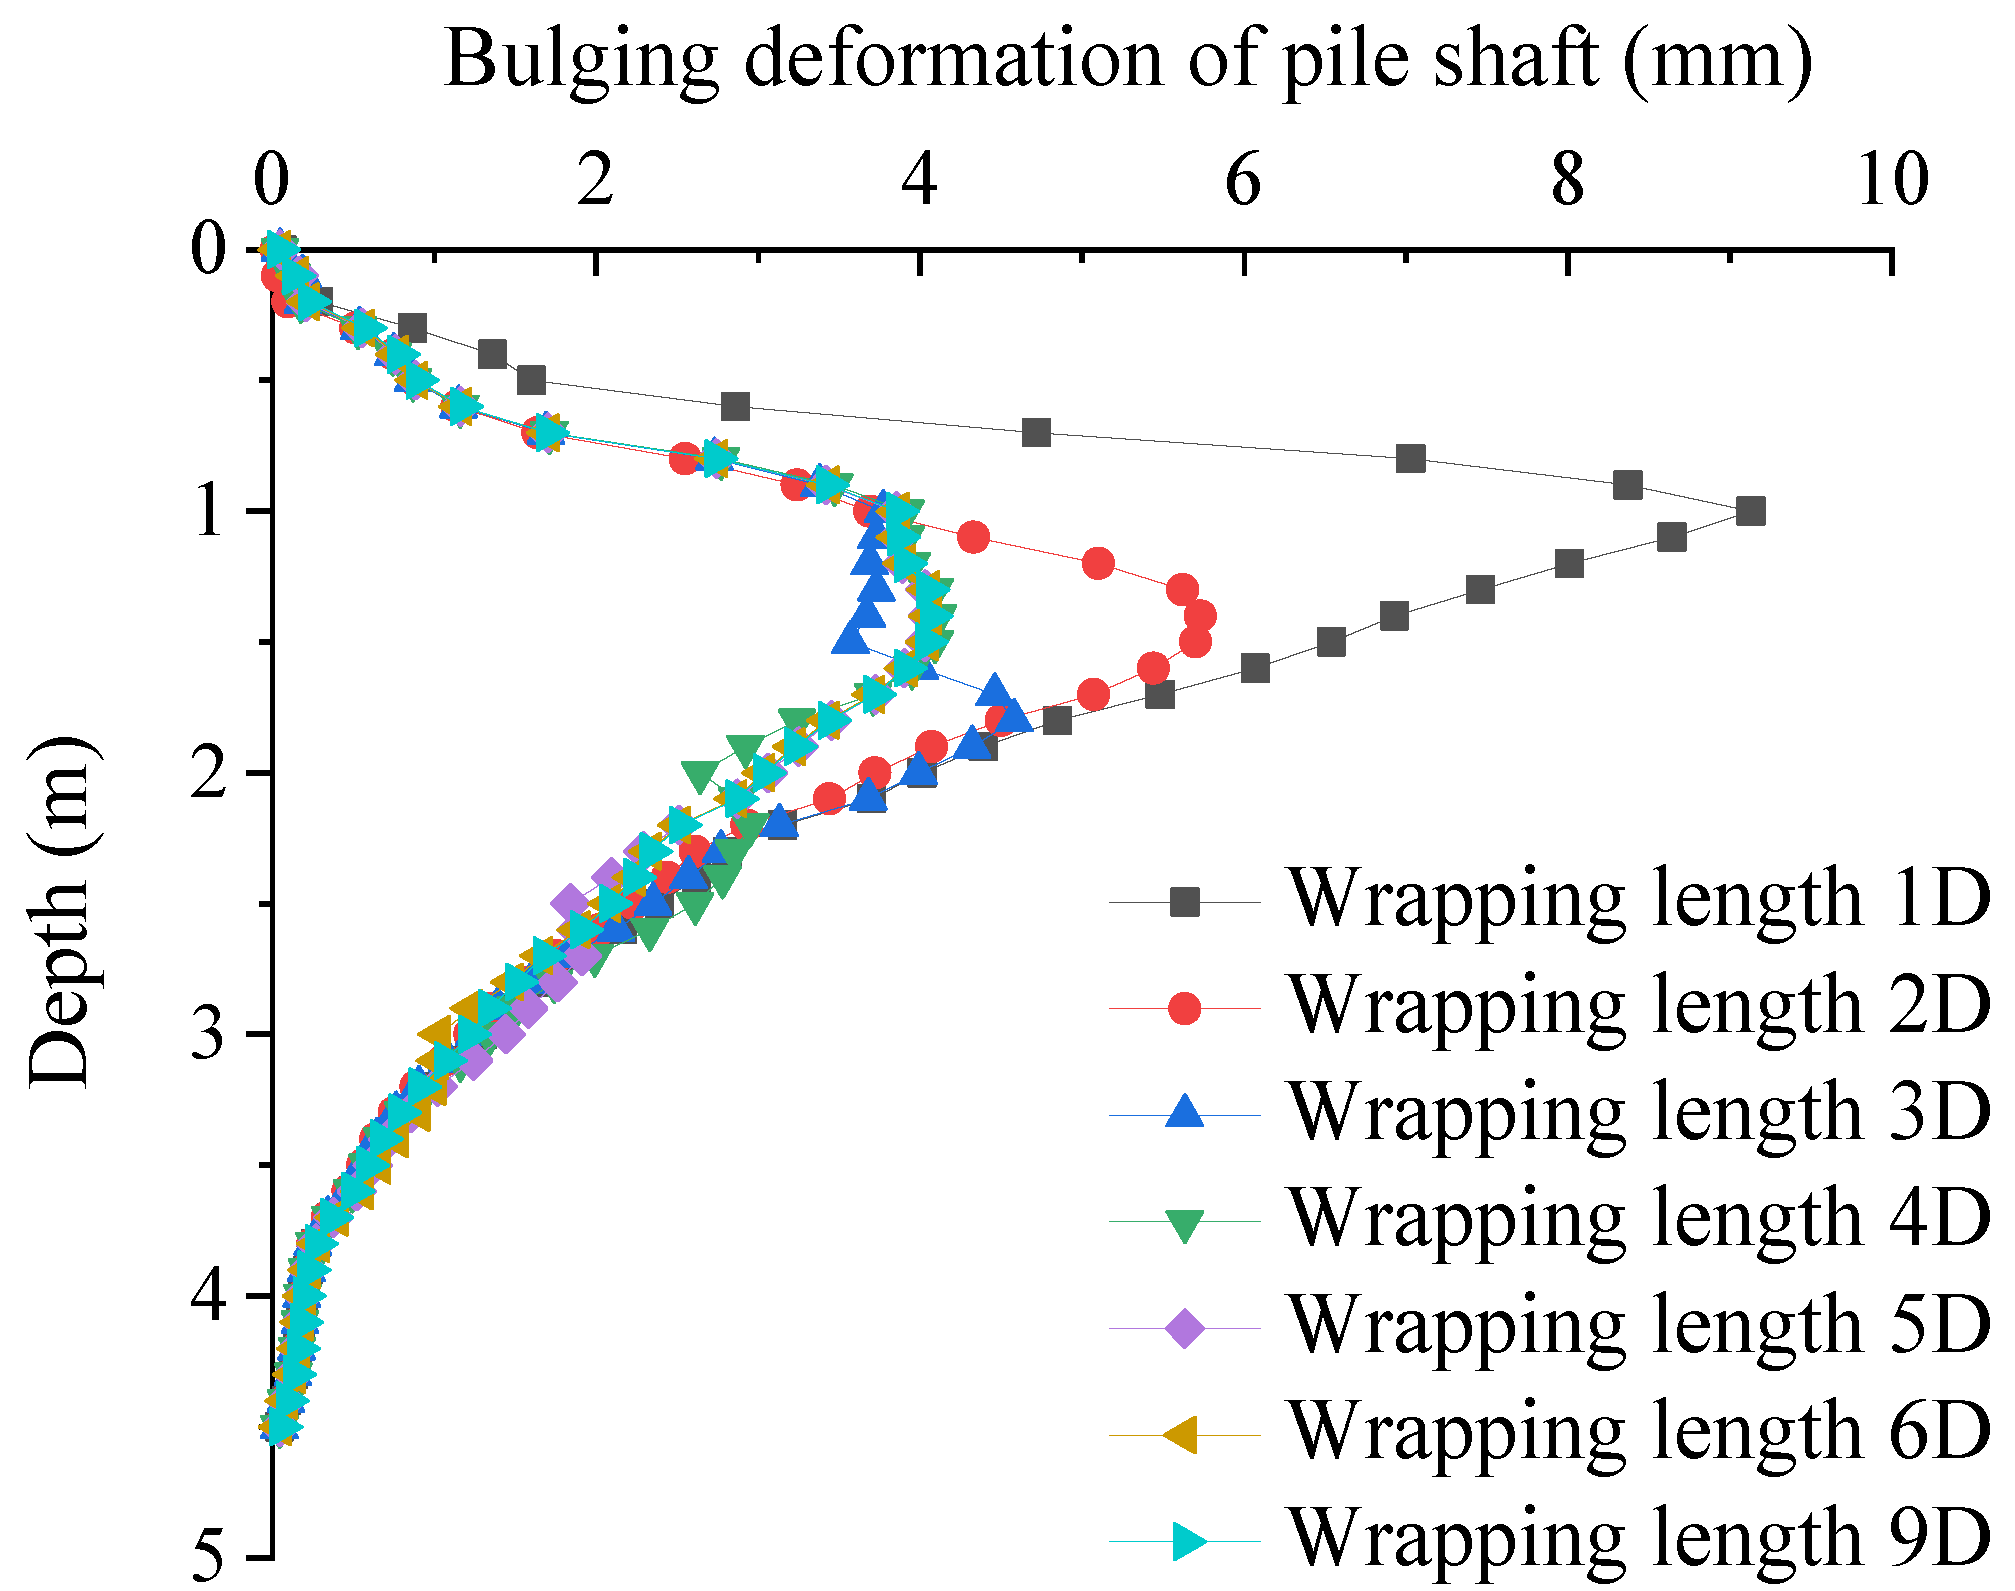
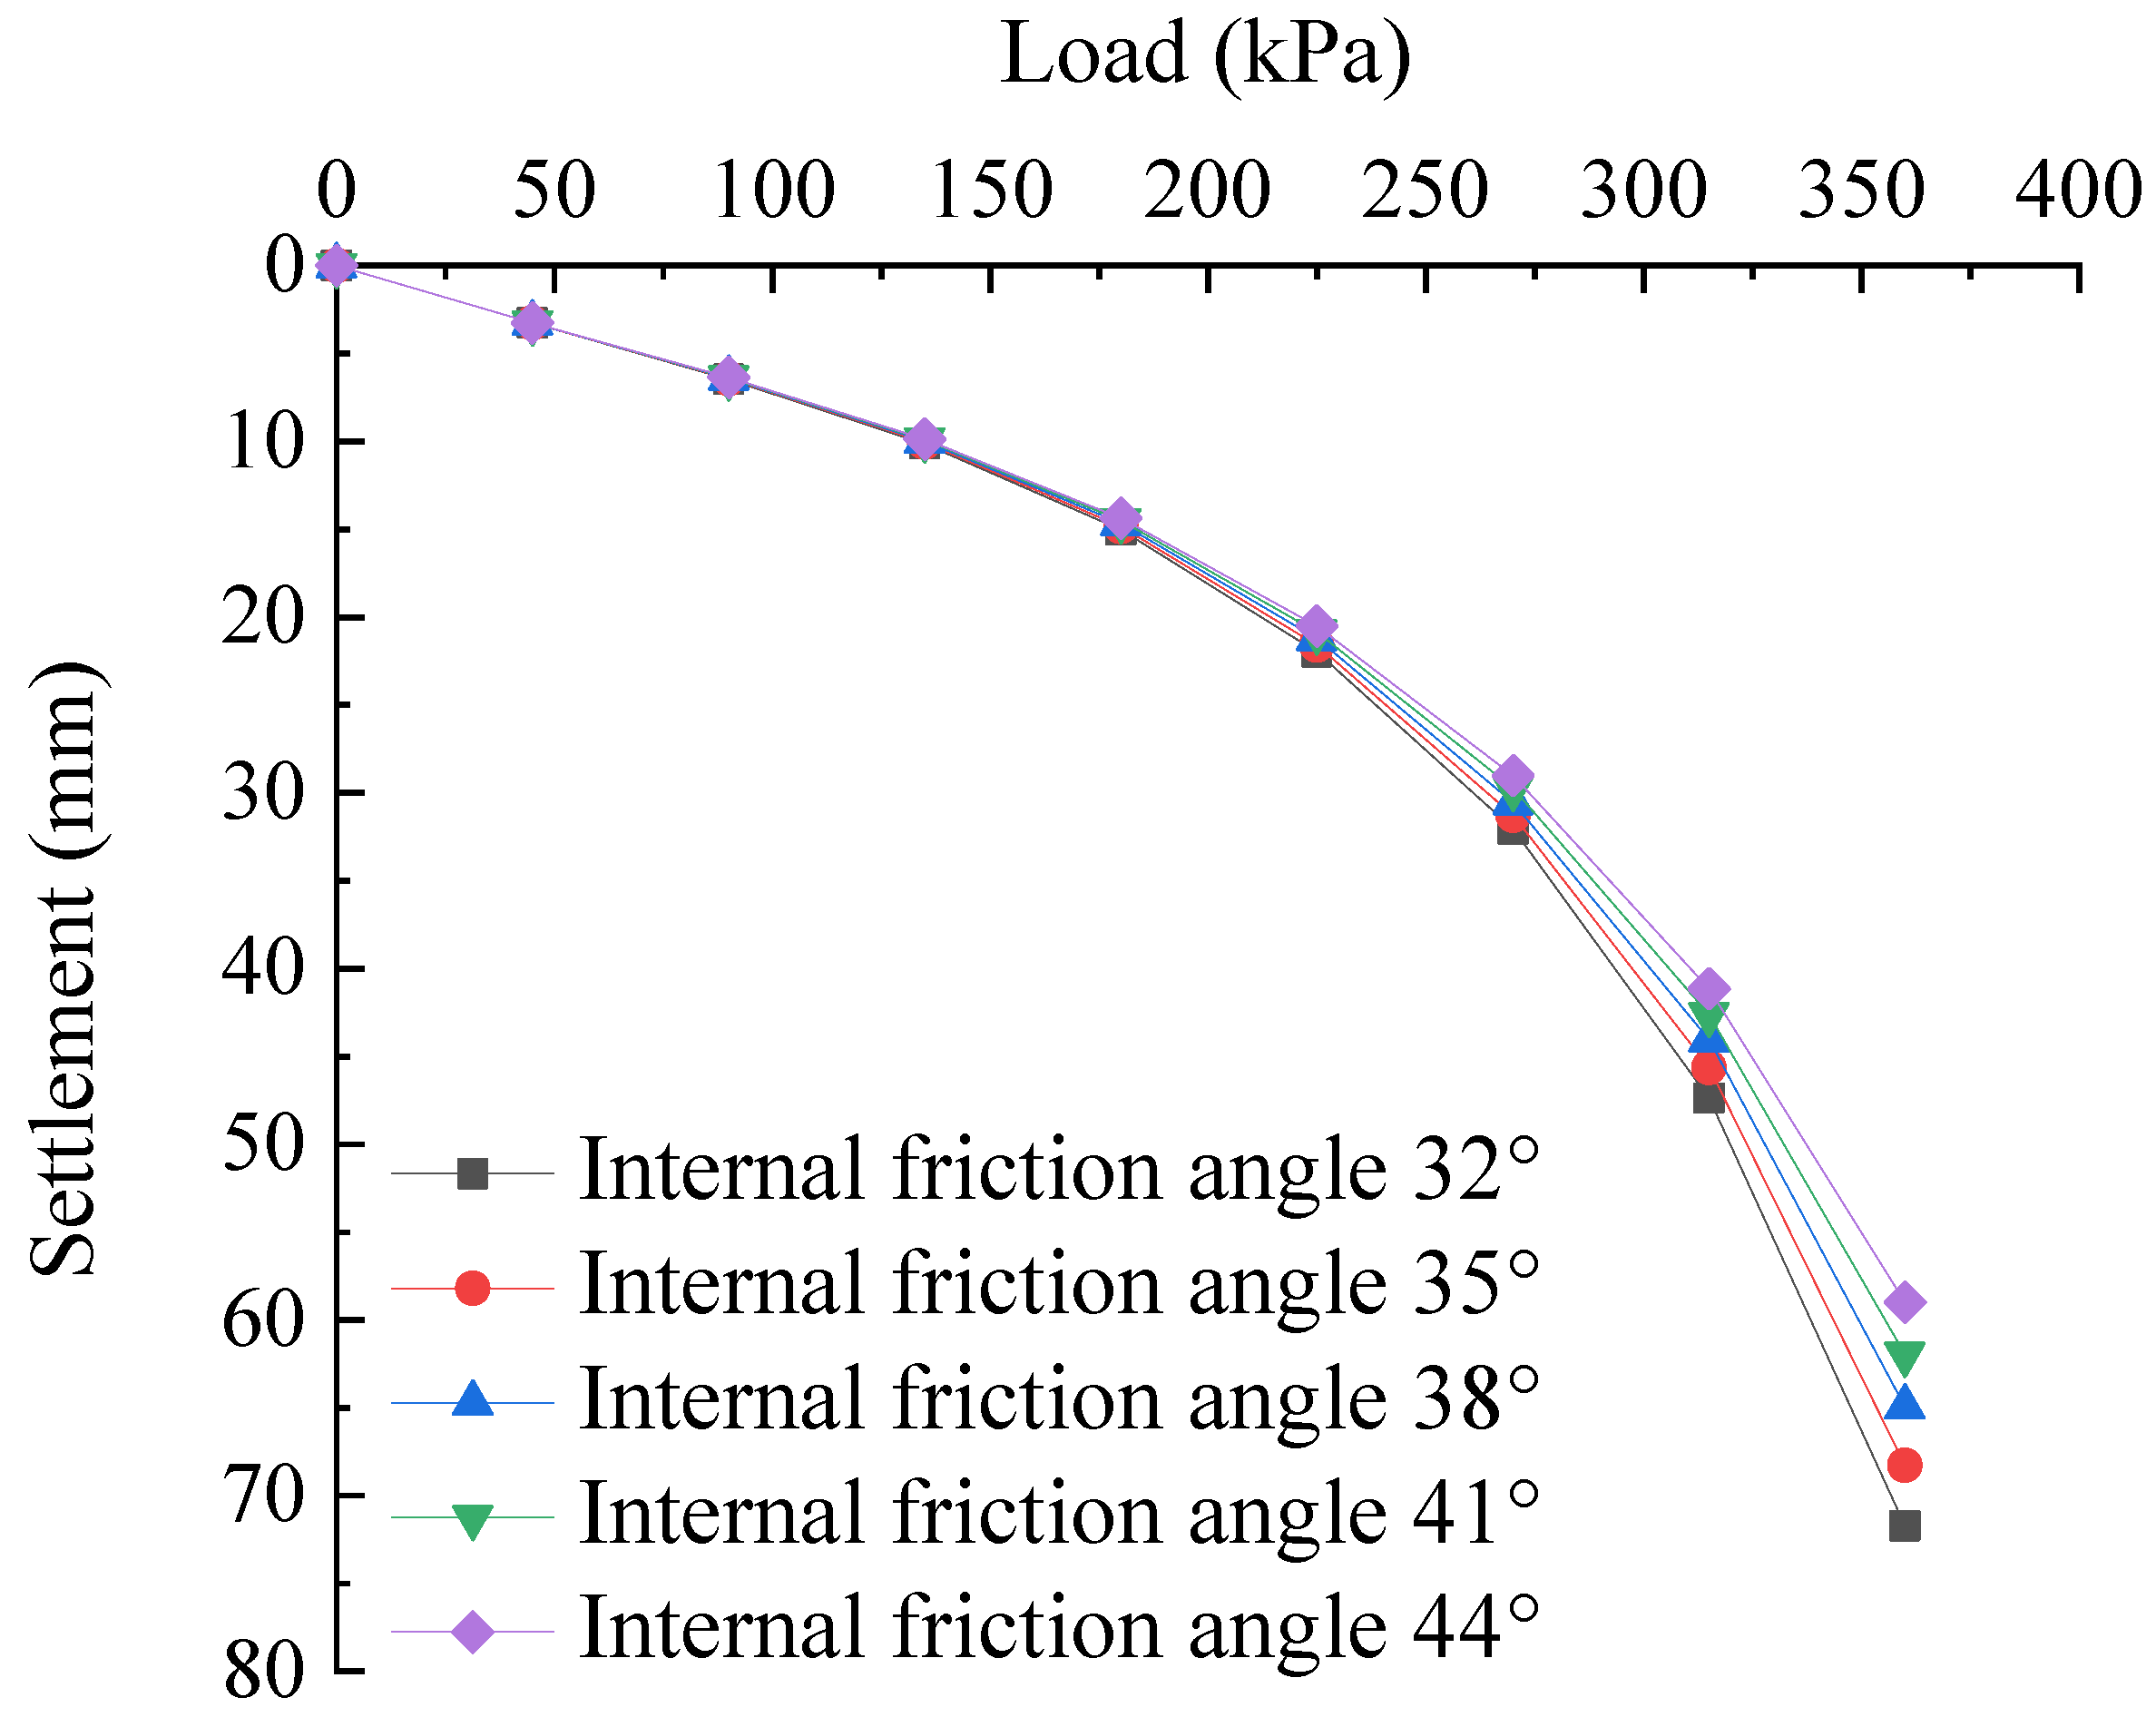
4.3. Analysis of Influencing Factors

The lateral restraint force provided by geotextile can reduce the bulging deformation of stone column and the settlement of composite foundation. The stiffness of the geotextile can directly affect the size of the radial restraint force when the pile is deformed by bulging, so the stiffness of the geotextile is the key parameter to measure the strength of the GESC composite foundation [35]. Under the condition that other parameters are the same, different numerical models are established by changing the geotextile stiffness to study the influence of geotextile stiffness on the strength of composite foundation. The specific parameters of the numerical model are shown in Table 2.
The load-settlement curves of numerical models with different stiffness are shown in Figure 21. With the increase of geotextile stiffness, the maximum settlement value of the GESC composite foundation decreases gradually, and the influence of geotextile stiffness on the maximum settlement of composite foundation becomes smaller. Therefore, the settlement of composite foundation cannot be reduced blindly by increasing the geotextile stiffness. Under the condition of soil mass strength on site, when the geotextile stiffness is 200~500 kN/m, the settlement of composite foundation can be significantly reduced by increasing the geotextile strength. The bulging deformation of the pile body in the numerical models with different stiffness is shown in Figure 22. The maximum bulging deformation of the pile body occurs at the depth of 1~1.5 m (2~3 D). With the increase of geotextile stiffness, the maximum bulging deformation of the piles located in the wrapping section gradually decreases, while the bulging deformation of the piles below the wrapping section is gradually increases. The influence of changing the stiffness on the maximum bulging deformation of the pile body decreases with the increase of geotextile stiffness. When the geotextile stiffness is 200~500 kN/m, the maximum bulging deformation of the GESC can be effectively reduced by increasing the geotextile stiffness. When the geotextile stiffness exceeds 500 kN/m, the effect of continuing to increase the geotextile stiffness on the settlement of the composite foundation and the maximum bulging deformation of the pile body gradually decreases. The reason may be that when the geotextile stiffness reaches a certain value, the deformation between the gravels is controlled, and greater lateral deformation cannot be generated. The overall stiffness of the pile body increases, and the yield stress increment of the composite foundation decreases. Therefore, in the actual project, we can not blindly enhance the GESC composite foundation by improving the geotextile stiffness, it is necessary to determine the most suitable geotextile stiffness through field test.
The use of geotextile can effectively enhance the strength of the pile body, and the transmission effect of axial stress in pile body is better. Different wrapping lengths have different strengthening effects on stone column. Seven numerical models with different wrapping lengths are established to analyze the influence of wrapping lengths on composite foundation while keeping other parameters unchanged. The specific parameters of the numerical model are shown in Table 3.
The load-settlement curves of numerical models with different wrapping lengths are shown in Figure 23. Under the condition of soil mass strength on site, when the stone column is wrapped with geotextile with a stiffness of 500 kN/m and the wrapping length is within the range of 1~2 D (D is the diameter of the stone column), increasing the wrapping length has a greater impact on the settlement of the composite foundation. The bulging deformation of the pile body in the numerical models with different wrapping lengths is shown in Figure 24. When the wrapping length is within the range of 1~3 D, increasing the wrapping length can reduce the maximum bulging deformation, and the maximum bulging deformation occurs below the wrapping section. After the wrapping length is greater than 3 D, when continuing to increase the wrapping length, only the pile bulging deformation within the new wrapping length are greatly affected. The maximum bulging deformation is within the range of 2~3 D depth within the wrapping section. The pile bulging deformation at the bottom depth of the geotextile bag is significantly reduced; the reason is that the geotextile at the bottom provides a greater lateral restraint. After increasing the wrapping length, the bulging deformation at the depth below the wrapping section increases. This is because the geotextile bag increases the stiffness of the wrapping section of the pile body, which in turn increases the stress transfer coefficient and increases the axial stress of the pile body below the wrapping section. In conclusion, increasing the wrapping length of geotextile can improve the strength of composite foundation. However, when the wrapping length of geotextile exceeds 2 D, further increase of the wrapping length has little impact on the settlement of composite foundation and the bulging deformation of pile body. Therefore, it is not recommended to increase the wrapping length blindly. Considering that the maximum bulging deformation of the GESC often occurs in the range of 2~3 D depth, the more reasonable wrapping length should be between 2~3 D. In this range, the strength of composite foundation can be greatly improved by increasing the wrapping length.
The shear strength of the stone column can be expressed by the internal friction angle when the gravel in the pile is extruded and deformed by mutual bite friction. By establishing numerical models of different internal friction angles of gravel, the influence of internal friction angles of gravel on the GESC composite foundation is analyzed. Under the condition of keeping other parameters unchanged, five models are established according to different internal friction angles of gravel. The specific parameters of the numerical model are shown in Table 4.
The load-settlement curves of numerical models with different internal friction angles of gravel are shown in Figure 25. Compared to the internal friction angle of 32°, the maximum settlement is reduced by 4.8% for an internal friction angle of 35°. Compared to the internal friction angle of 35°, the maximum settlement is reduced by 4.9% for an internal friction angle of 38°. Compared to the internal friction angle of 38°, the maximum settlement is reduced by 4.6% for an internal friction angle of 41°. Compared to the internal friction angle of 41°, the maximum settlement is reduced by 4.8% for an internal friction angle of 44°. Therefore, under the condition of soil mass strength on site, when the internal friction angle of gravel is within the range of 32°~44°, increasing the internal friction angle of gravel has little effect on the settlement of composite foundation. The bulging deformation of the pile body in the numerical models with different internal friction angles of gravel is shown in Figure 26. When the internal friction angle of gravel in the GESC is between 32°~44°, the maximum bulging deformation is within the range of 1~1.5 m (2~3 D) depth, and the maximum bulging deformation decreases with the increase of the internal friction angle of gravel. Compared to the internal friction angle of 32°, the maximum bulging deformation is reduced by 12.8% for an internal friction angle of 35°. Compared to the internal friction angle of 35°, the maximum bulging deformation is reduced by 14.2% for an internal friction angle of 38°. Compared to the internal friction angle of 38°, the maximum bulging deformation is reduced by 13.1% for an internal friction angle of 41°. Compared to the internal friction angle of 41°, the maximum bulging deformation is reduced by 15.9% for an internal friction angle of 44°. When the internal friction angle of gravel is in the range of 32°~44°, increasing the internal friction angle of gravel can increase the strength of composite foundation but has little influence on the bulging deformation of pile body. The particle size and confining pressure change with the increase of internal friction angle of gravel, which are important factors that influence the shear characteristics of stone column [36]. The increase of friction angle indicates that there is a strong occlusion effect between the gravels in the GESC. The yield stress of the GESC increases, and the bulging deformation of the GESC decreases. Therefore, the foundation reinforced by the GESC with larger internal friction angle has good engineering characteristics under the same load. Therefore, the particle size and gradation of gravel should be determined in combination with the specific conditions of on-site construction, and the internal friction angle of gravel should be adjusted according to the design value of the composite foundation bearing capacity.

5. Conclusions

In this paper, the pile–soil stress ratio, the excess pore water pressure and the lateral displacement of the soil mass at the slope toe were monitored by conducting long term field tests on the composite foundations reinforced by the traditional stone columns and the GESCs. A comparative analysis of the influencing factors of the composite foundation reinforced by the GESC was conducted by numerical simulations. The main conclusions are as follows:
(1)
With the increase of subgrade filling height, the pile–soil stress ratio of the composite foundation with the traditional stone column gradually increases from 1.1 to 1.5 and then tends to be stable. The pile–soil stress ratio of the composite foundation with the GESC reaches 1.5 at the initial filling stage and gradually increases and stabilizes at about 1.7 with the filling construction. This indicates that the restraint effect of geotextile bags can improve the bearing capacity of the pile body so that the GESC can bear more load, which is more obvious at the initial filling stage.
(2)
At the intensive filling stage, due to the difference in soil permeability and mechanical loading, the peak value of excess pore water pressure of the composite foundation with the traditional stone column is lower than that of the composite foundation with the GESC. At the interval filling stage and monitoring stage after construction, the dissipation rate of the excess pore water pressure of the composite foundation with the GESC is obviously superior to that of the composite foundation with the traditional stone column.
(3)
The lateral displacement of the soil mass at the depths of 3.1 m and 5.1 m of the composite foundation with the GESC is obviously smaller than that of the composite foundation with the traditional stone column. However, due to the impact of surcharge at the slope toe, the lateral displacement of the soil mass at the depth of 1.1 m of the composite foundation with the GESC is greater than that of the composite foundation with the traditional stone column.
(4)
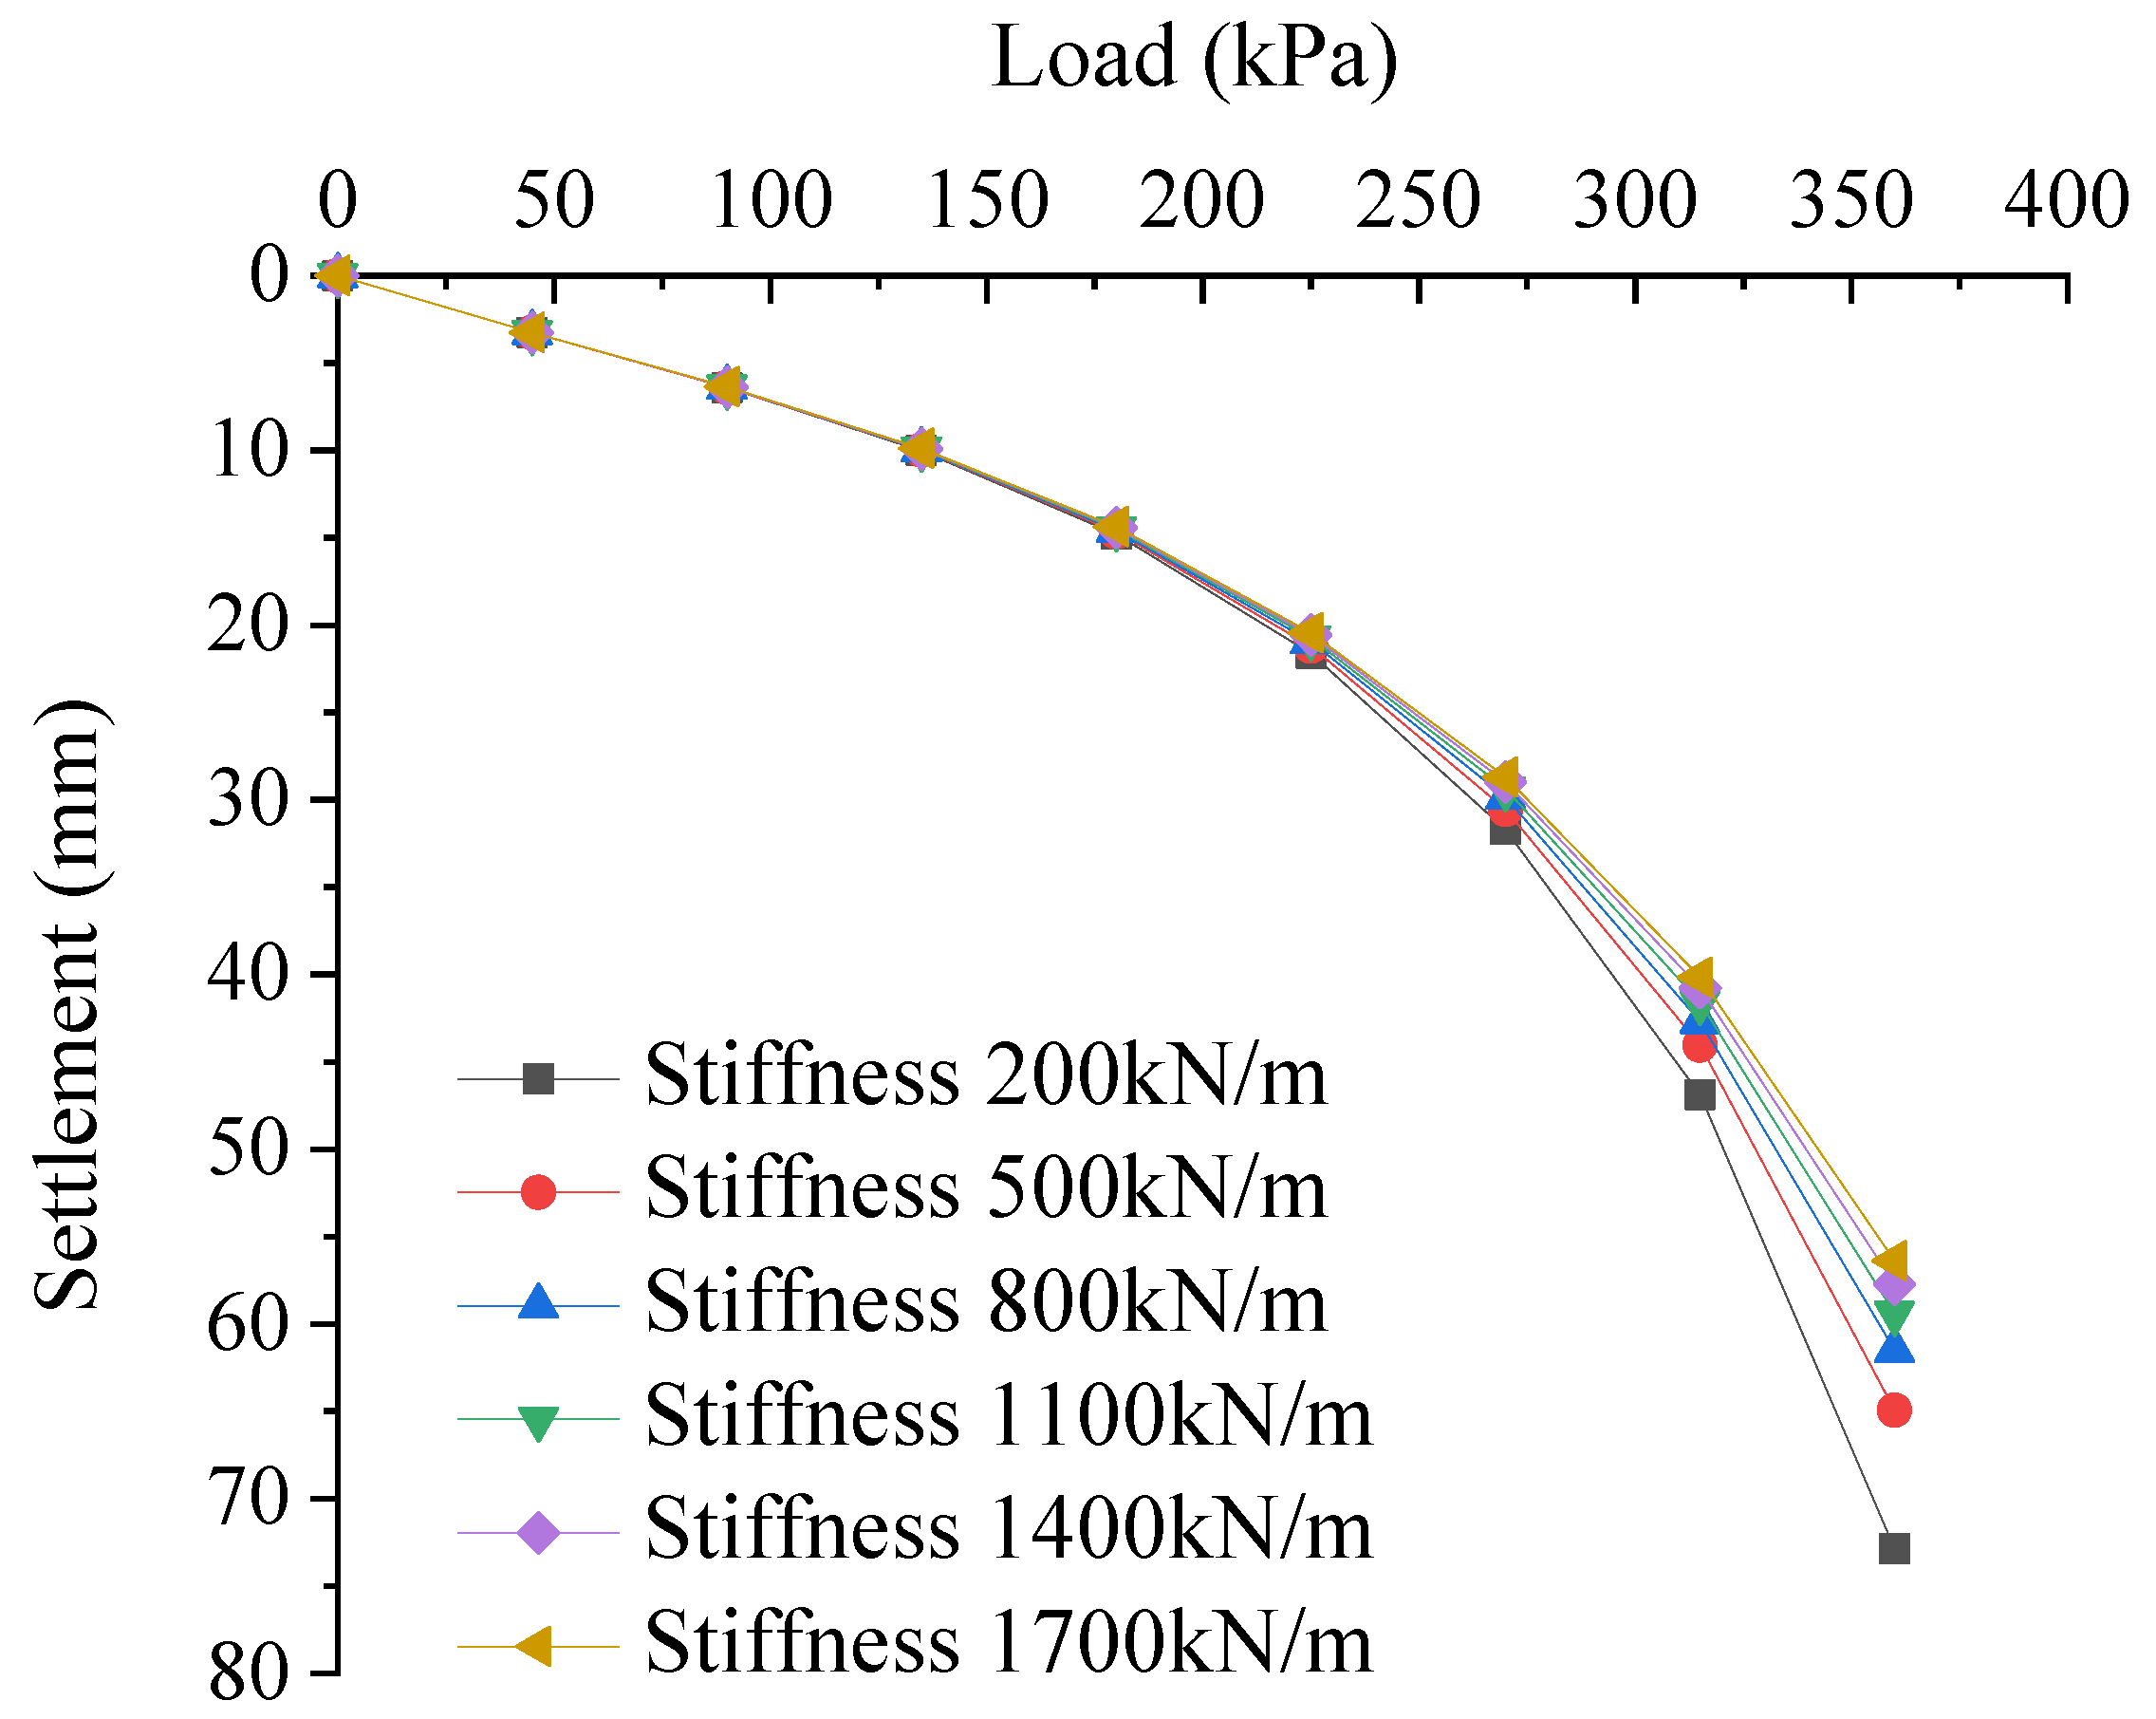
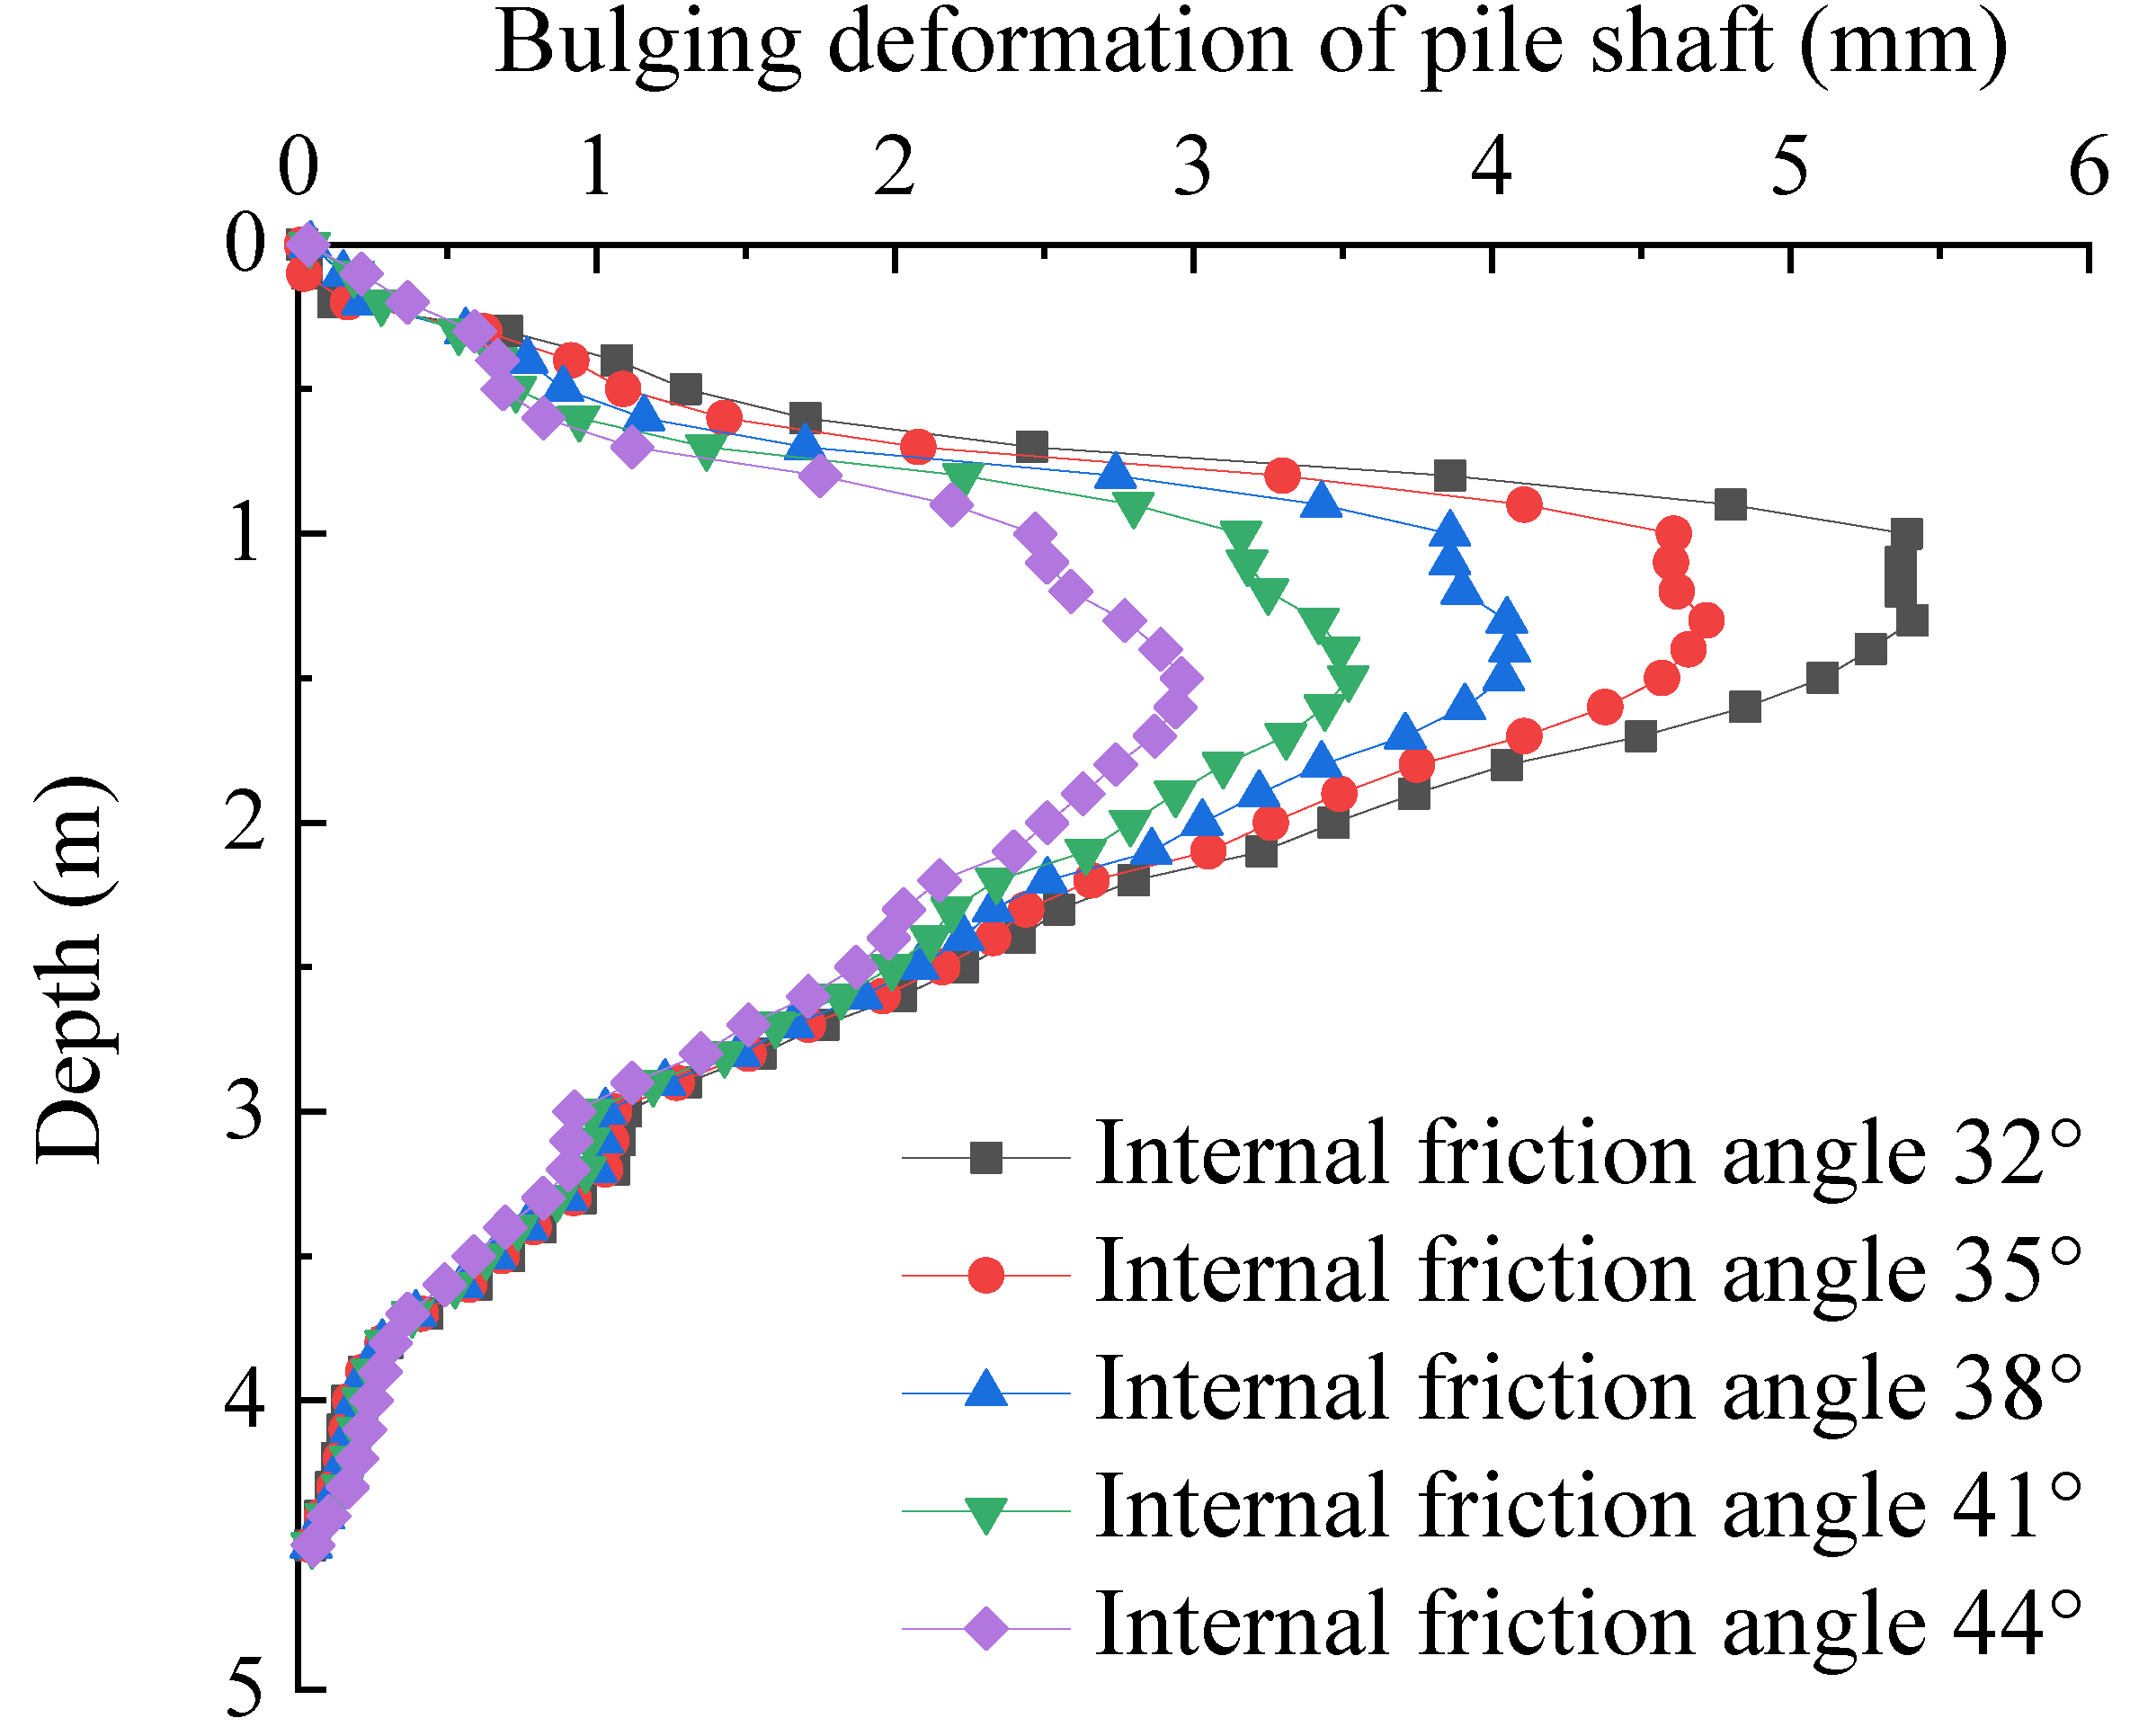
The numerical simulations show that increasing the geotextile stiffness, the wrapping length and the internal friction angle of gravel can all improve the bearing performance of the composite foundation with the GESC. However, after the geotextile stiffness and the wrapping length reach a certain value, the influence of its lifting amount on the composite foundation will be reduced. Therefore, it is necessary to determine the different parameters of the GESC based on the site conditions.
(5)
Due to the regional characteristics of the test site and the diversities of the construction process and test conditions, more practical applications of the GESC are needed to supplement and improve the existing engineering data. In the future, long-term monitoring of the bearing characteristics of the GESC can be conducted for different construction processes and construction techniques.

Author Contributions

Conceptualization, K.W. and M.L.; methodology, J.C. and J.N.; data curation, K.W. and J.C.; writing—original draft preparation, J.N.; writing—review and editing, M.L. and Y.Z.; visualization, J.N. and Y.Z.; supervision, K.W. and J.C. All authors have read and agreed to the published version of the manuscript.

Funding

This research was funded by the Research Project of CSCEC Road and Bridge Group Co., Ltd. (Grant no. ZJLQ—XNKJ-001).

Institutional Review Board Statement

Not applicable.

Informed Consent Statement

Not applicable.

Data Availability Statement

Not applicable.

Conflicts of Interest

The authors declare no conflict of interest.

References

  1. Van Impe, W.F. Soil Improvement Techniques and Their Evolution; Balkema: Rotterdam, The Netherlands, 1989. [Google Scholar]
  2. Van Impe, W.; De Beer, E. Improvement of settlement behaviour of soft layers by means of stone columns. In Proceedings of the 8th European Conference on Soil Mechanics and Foundation Engineering, Helsinki, Finland, 23–26 May 1983; Volume 1, pp. 309–312. [Google Scholar]
  3. Kempfert, H.G.; Gebreselassie, B. Excavations and Foundations in Soft Soils; Springer: Berlin/Heidelberg, Germany, 2010. [Google Scholar]
  4. Grizi, A.; Al-Ani, W.; Wanatowski, D. Numerical analysis of the settlement behavior of soft soil improved with stone columns. Appl. Sci. 2022, 12, 5293. [Google Scholar] [CrossRef]
  5. Chen, P.; Lyu, W.; Liang, X.; Deng, J.; Li, C.; Yuan, Y. Multi-Factor Influence analysis on the liquefaction mitigation of stone columns composite foundation. Appl. Sci. 2022, 12, 7308. [Google Scholar] [CrossRef]
  6. Hosseinpour, I.; Riccio, M.; Almeida, M.S.S. Numerical evaluation of a granular column reinforced by geosynthetics using encasement and laminated disks. Geotext. Geomembr. 2014, 42, 363–373. [Google Scholar] [CrossRef]
  7. Yoo, C. Performance of geosynthetic-encased stone columns in embankment construction: Numerical investigation. J. Geotech. Geoenviron. Eng. ASCE 2010, 136, 1148–1160. [Google Scholar] [CrossRef]
  8. Ali, K.; Shahu, J.T.; Sharma, K.G. Model tests on geosynthetic-reinforced stone columns: A comparative study. Geosynth. Int. 2012, 19, 433–451. [Google Scholar] [CrossRef]
  9. Murugesan, S.; Rajagopal, K. Studies on the behavior of single and group of geosynthetic encased stone columns. J. Geotech. Geoenviron. Eng. 2010, 136, 129–139. [Google Scholar] [CrossRef]
  10. Ghazavi, M.; Afshar, J.N. Bearing capacity of geosynthetic encased stone columns. Geotext. Geomembr. 2013, 38, 26–36. [Google Scholar] [CrossRef]
  11. Tandel, Y.; Jamal, M.; Solanki, C.; Desai, A.; Patel, J. Performance of small group of geosynthetic-reinforced granular piles. Mar. Georesour. Geotec. 2017, 35, 504–511. [Google Scholar] [CrossRef]
  12. Fattah, M.Y.; Zabar, B.S.; Hassan, H.A. Experimental analysis of embankment on ordinary and encased stone columns. Int. J. Geomech. 2016, 16, 04015102. [Google Scholar] [CrossRef]
  13. Mohapatra, S.R.; Rajagopal, K.; Sharma, J. Direct shear tests on geosynthetic-encased granular columns. Geotext. Geomembr. 2016, 44, 396–405. [Google Scholar] [CrossRef]
  14. Li, L.Y.; Rajesh, S.; Chen, J.F. Centrifuge model tests on the deformation behavior of geosynthetic-encased stone column supported embankment under undrained condition. Geotext. Geomembr. 2020, 49, 550–563. [Google Scholar] [CrossRef]
  15. Yoo, C.; Lee, D. Performance of geogrid-encased stone columns in soft ground: Full-scale load tests. Geosynth. Int. 2012, 19, 480–490. [Google Scholar] [CrossRef]
  16. Almeida, M.S.S.; Hosseinpour, I.; Riccio, M.; Alexiew, D. Behavior of geotextile-encased granular columns supporting test embankment on soft deposit. J. Geotech. Geoenviron. Eng. 2015, 141, 04014116. [Google Scholar] [CrossRef]
  17. Lo, S.R.; Zhang, R.; Mak, J. Geosynthetic-encased stone columns in soft clay: A numerical study. Geotext. Geomembr. 2010, 28, 292–302. [Google Scholar] [CrossRef]
  18. McCabe, B.A.; Killeen, M.M. Small stone-column groups: Mechanisms of deformation at serviceability limit state. Int. J. Geomech. 2017, 17, 04016114. [Google Scholar] [CrossRef]
  19. Castro, J. Modeling stone columns. Materials 2017, 10, 782. [Google Scholar] [CrossRef] [Green Version]
  20. Miranda, M.; Da Costa, A. Laboratory analysis of encased stone columns. Geotext. Geomembr. 2016, 44, 269–277. [Google Scholar] [CrossRef]
  21. Zhang, J.J.; Niu, J.Y.; Fu, X.; Cao, L.C.; Xie, Q. Shaking table test of seismic responses of anchor cable and lattice beam reinforced slope. J. Mt. Sci. 2020, 17, 1251–1268. [Google Scholar] [CrossRef]
  22. Zhang, J.J.; Niu, J.Y.; Fu, X.; Cao, L.C.; Yan, S.J. Failure modes of slope stabilized by frame beam with prestressed anchors. Eur. J. Environ. Civ. Eng. 2022, 26, 2120–2142. [Google Scholar] [CrossRef]
  23. Han, J.; Gabr, M.A. Numerical analysis of geosynthetic-reinforced and pile-supported earth platforms over soft soil. J. Geotech. Geoenviron. Eng. 2002, 128, 44–53. [Google Scholar] [CrossRef]
  24. Killeen, M. Numerical Modelling of Small Groups of Stone Columns. Ph.D. Thesis, National University of Ireland, Galway, Ireland, 2012. [Google Scholar]
  25. Al-Ani, W. Numerical Analysis of Ground Improvement Using Column-Like Elements. Ph.D. Thesis, University of Nottingham, Nottingham, UK, 2020. [Google Scholar]
  26. Wang, X.; Zhu, C.Q.; Wang, X.Z. Experimental study on the coefficient of lateral pressure at rest for calcareous soils. Mar. Georesour. Geotec. 2020, 38, 989–1001. [Google Scholar] [CrossRef]
  27. Niu, J.Y.; Zhou, Y.Y.; Zhang, J.J.; Duan, D.; Chen, K.P. Tensile strength of root and soil composite based on new tensile apparatus. J. Southwest JiaoTong Univ. 2022, 57, 191–199. [Google Scholar]
  28. Lu, Y.; Abuel-Naga, H.; Shaia, H.A.; Shang, Z. Preliminary study on the behaviour of fibre-reinforced polymer piles in sandy soils. Buildings 2022, 12, 1144. [Google Scholar] [CrossRef]
  29. Gao, X.; Tian, W.-p.; Zhang, Z. Analysis of deformation characteristics of foundation-pit excavation and circular wall. Sustainability 2020, 12, 3164. [Google Scholar] [CrossRef] [Green Version]
  30. Maleki, M.; Khezri, A.; Nosrati, M.; Mir Mohammad Hosseini, S.M. Seismic amplification factor and dynamic response of soil-nailed walls. Model. Earth Syst. Environ 2023, 9, 1181–1198. [Google Scholar] [CrossRef]
  31. Maleki, M.; Mir Mohammad Hosseini, S.M. Assessment of the pseudo-static seismic behavior in the soil nail walls using numerical analysis. Innov. Infrastruct. Solut. 2022, 7, 262. [Google Scholar] [CrossRef]
  32. Ou Yang, F.; Zhang, J.J.; Liao, W.M.; Han, J.W.; Tang, Y.L.; Bi, J.B. Characteristics of the stress and deformation of geosynthetic-encased stone column composite ground based on large-scale model tests. Geosynth. Int. 2017, 24, 242–254. [Google Scholar] [CrossRef]
  33. Ou Yang, F.; Fan, G.; Wang, K.F.; Yang, C.; Lyu, W.Q.; Zhang, J.J. A large-scale shaking table model test for acceleration and deformation response of geosynthetic encased stone column composite ground. Geotext. Geomembr. 2021, 49, 1407–1418. [Google Scholar] [CrossRef]
  34. Almeida, M.S.S.; Hosseinpour, I.; Riccio, M. Performance of a geosynthetic-encased column (GEC) in soft ground: Numerical and analytical studies. Geosynth. Int. 2013, 20, 252–262. [Google Scholar] [CrossRef]
  35. Liu, M.; Wang, K.; Niu, J.; Ouyang, F. Static and dynamic load transfer behaviors of the composite foundation reinforced by the geosynthetic-encased stone column. Sustainability 2023, 15, 1108. [Google Scholar] [CrossRef]
  36. Wang, X.; Wang, X.Z.; Shen, J.H.; Zhu, C.Q. Particle size and confining-pressure effects of shear characteristics of coral sand: An experimental study. Bull. Eng. Geol. Environ. 2022, 81, 97. [Google Scholar] [CrossRef]
Figure 1. Shape of geosynthetic-encased stone column.
Sustainability 15 05965 g001
Figure 2. Shapes of composite foundation reinforced by the GESC.
Sustainability 15 05965 g002
Figure 3. Schematic diagram of subgrade section monitoring area.
Sustainability 15 05965 g003
Figure 4. Stratigraphic map of the test site.
Sustainability 15 05965 g004
Figure 5. Installation process of test instrument: (a) Inclinometer; (b) Installation of inclinometer; (c) Earth pressure meter; (d) Installation of earth pressure meter; (e) Pore water pressure meter; (f) Installation of pore water pressure meter.
Sustainability 15 05965 g005
Figure 6. Buried sensors in the test area: (a) Plan layout of sensors; (b) Profile layout of sensors.
Sustainability 15 05965 g006
Figure 7. Relationship between subgrade filling height and time.
Sustainability 15 05965 g007
Figure 8. The construction processes of GESC and subgrade filling: (a) Cover the steel pipe with geotextile bags; (b) Pull out the steel pipe to the hole; (c) Calibration of the GESC; (d) Subgrade filling.
Sustainability 15 05965 g008
Figure 9. Pile–soil stress ratio of composite foundation.
Sustainability 15 05965 g009
Figure 10. Time-history curves of excess pore water pressure: (a) Traditional stone column; (b) GESC.
Sustainability 15 05965 g010
Figure 11. The variation of excess pore water pressure at different depths in the different stages: (a) Intensive filling stage; (b) Interval filling stage; (c) Monitoring stage after construction.
Sustainability 15 05965 g011
Figure 12. Time-history curves of lateral displacement: (a) Traditional stone column; (b) GESC.
Sustainability 15 05965 g012
Figure 13. The variation of lateral displacement at different depths on the 45th day after the completion of subgrade filling.
Sustainability 15 05965 g013
Figure 14. Schematic diagram of filling at the slope toe of the monitoring section of the traditional stone column.
Sustainability 15 05965 g014
Figure 15. The variation of increment of lateral displacement at different depths on the 125th day after the completion of subgrade filling.
Sustainability 15 05965 g015
Figure 16. Overall model diagram.
Sustainability 15 05965 g016
Figure 17. Field static load test of single GESC composite foundation: (a) Reference beam and displacement sensor; (b) Field static load test.
Sustainability 15 05965 g017
Figure 18. Profile diagram of the GESC composite foundation model.
Sustainability 15 05965 g018
Figure 19. Deformation of the GESC after mechanical excavation.
Sustainability 15 05965 g019
Figure 20. Comparison of load settlement curves between numerical simulation and field test [15,24].
Sustainability 15 05965 g020
Figure 21. Load-settlement curves of geotextile models with different stiffness.
Sustainability 15 05965 g021
Figure 22. Bulging deformation of the pile body in the geotextile model with different stiffness.
Sustainability 15 05965 g022
Figure 23. Load-settlement curves of geotextile models with different wrapping lengths.
Sustainability 15 05965 g023
Figure 24. Bulging deformation of the pile body in the geotextile model with different wrapping lengths.
Sustainability 15 05965 g024
Figure 25. Load-settlement curves of geotextile models with different internal friction angles of gravel.
Sustainability 15 05965 g025
Figure 26. Bulging deformation of the pile body in the geotextile model with different internal friction angles of gravel.
Sustainability 15 05965 g026
Table 1. Parameters of rock and soil mass and bearing plate.
Material TypePoisson’s Ratio, μUnit Weight, γ (kN/m3)Elastic Modulus, E (MPa)Cohesion, c (kPa)Internal Friction Angle, φ (°)Dilatancy
Angle, ψ (°)
Banket0.318.5255220
Silty clay0.3518.21532.712.50
Strongly weathered mudstone0.323.5100450280
Moderately weathered mudstone0.323.81870100042.512.5
Gravel0.3519501388
Bearing plate0.3782 × 105
Table 2. Calculation conditions of numerical model for different geotextile stiffness.
Working ConditionPile Length (m)Pile Diameter (m)Wrapping Length (m)Geotextile Stiffness (kN/m)Internal Friction Angle of Gravel (°)
Model 14.50.5320038
Model 24.50.5350038
Model 34.50.5380038
Model 44.50.53110038
Model 54.50.53140038
Model 64.50.53170038
Table 3. Calculation conditions of numerical model for different wrapping lengths.
Working ConditionPile Length (m)Pile Diameter (m)Wrapping Length (m)Geotextile Stiffness (kN/m)Internal Friction Angle of Gravel (°)
Model 14.50.50.550038
Model 24.50.5150038
Model 34.50.51.550038
Model 44.50.5250038
Model 54.50.52.550038
Model 64.50.5350038
Model 74.50.54.550038
Table 4. Calculation conditions of numerical model for different internal friction angles.
Working ConditionPile Length (m)Pile Diameter (m)Wrapping Length (m)Geotextile Stiffness (kN/m)Internal Friction Angle of Gravel (°)
Model 14.50.5350032
Model 24.50.5350035
Model 34.50.5350038
Model 44.50.5350041
Model 54.50.54.550044
Disclaimer/Publisher’s Note: The statements, opinions and data contained in all publications are solely those of the individual author(s) and contributor(s) and not of MDPI and/or the editor(s). MDPI and/or the editor(s) disclaim responsibility for any injury to people or property resulting from any ideas, methods, instructions or products referred to in the content.

