Article

Transforming Challenges into Opportunities for Qatar’s Food Industry: Self-Sufficiency, Sustainability, and Global Food Trade Diversification

1
Engineering Management, College of Engineering, Qatar University, Doha P.O. Box 2713, Qatar
2
Industrial and Systems Engineering, College of Engineering, Qatar University, Doha P.O. Box 2713, Qatar
3
Qatar Transportation and Traffic Safety Center, Qatar University, Doha P.O. Box 2713, Qatar
4
Department of Industrial Engineering, Uskudar University, Istanbul 34662, Turkey
5
School of Management, Cranfield University, College Road, Cranfield MK43 0AL, UK
6
Department of Industrial Engineering, Yasar University, Izmir 35100, Turkey
7
Department of Logistics Management, Yasar University, Izmir 35100, Turkey
*
Author to whom correspondence should be addressed.
Sustainability 2023, 15(7), 5755; https://doi.org/10.3390/su15075755
Submission received: 31 December 2022 / Revised: 23 February 2023 / Accepted: 21 March 2023 / Published: 25 March 2023
(This article belongs to the Special Issue Smart and Sustainable Food Supply Chain Management)

Abstract

:
Food trade restrictions pose a serious risk for countries that are heavily reliant on food imports, potentially leading to food crises, inequality, and geopolitical conflicts on a global scale. However, such restrictions may also have transformative effects in promoting food supply chain resilience, security, and self-sufficiency. In this study, a novel econometric analysis is presented, utilizing a data-driven analytical model to investigate the impact of a food embargo on the industry, using Qatar as a case study. A structured and automated food trade database is created using Microsoft Management Server Studio and data visualization software is integrated for automated data discovery. By using a global, trade-based sustainability assessment model, which combines the multi-region input-output (MRIO) analysis with transportation mode-based (sea, road, and air) emissions, the carbon footprint of the dairy food production sector could be estimated. The study shows that the trade embargo on Qatar’s food industry can lead to significant reductions in the annual import of food products, promoting self-sufficiency, and reducing the net carbon emissions of the dairy food sector by nearly 40%. This reduction is not only achieved through food supply chain changes, such as transportation modes, but also by restrictions pushing the country to increase domestic production. Overall, the study demonstrates that a trade embargo, with the support of a well-designed national food security strategy, trade/import diversification, and the use of different modes of transportation for food products, can improve the resilience of global supply chains, self-sufficiency, and environmental sustainability.

1. Introduction

Food security refers to a system’s ability to meet the dietary needs of a population, even under conditions of escalating threats [1,2]. In the face of rapid global change, unforeseen risks can have severe consequences, particularly for developing countries [3]. Central to these challenges is the food system, highlighting the importance of food security, and resilience in ensuring access to food for people worldwide [3]. Achieving sustainability in food requires providing sufficient food for everyone on the planet. A range of strategies can be employed to achieve sustainable food production and consumption. To achieve sustainable agriculture, appropriate strategies must be developed. A variety of techniques, including technical and policy-based approaches, can be employed to mitigate the excessive use of chemical fertilizers. Technical techniques, such as soil testing and fertilizer application, controlled-release fertilizers, crop rotation or intercropping, organic-inorganic compound fertilizers, organic fertilizers, and recycled agriculture, can help to reduce the consumption of chemical fertilizers [4]. Fertilizer use is a critical strategy for promoting sustainability and productivity in food production. When farmers do not apply fertilizer, crop yields are likely to be reduced [5]. Encouraging the use of fertilizer is essential for enhancing production and achieving sustainability in food production. Fertilizer application leads to increased crop yields and faster crop maturation, ensuring that everyone has access to food, provided that sustainable production practices are followed.
The food supply chain comprises the processes and companies involved in sourcing food from producers and delivering it to end consumers [6]. A major challenge with food supply chains is the long lead time, which results in extended travel times for food products, increasing the risk of spoilage and waste [7]. To achieve food security, it is crucial to establish a dependable food supply network that can meet the demands of the population. There are three primary types of food supply chains: direct, extended, and final supply chains [8]. The direct supply chain is the simplest distribution method, involving three parties: the supplier, the core business, and the customer [9,10]. As such, the quality of perishable goods improves with a shorter supply chain. This underscores the critical role that reliable supply chains play in ensuring the timely delivery of perishable goods. Without a dependable supply chain, most producers or suppliers would struggle to meet consumer expectations.
It should be noted that the Gulf Cooperation Council (GCC) countries, especially those in the Middle East, face significant challenges in producing agricultural products due to limited water and arable land. As a result, they are some of the world’s largest food importers. The GCC’s external food insecurity is shaped by market and technology-driven changes, climate change, and security issues at the state level. For example, the blockade imposed on Qatar in June 2017 highlighted the vulnerability of Qatar’s internal food supply. However, the crisis has had some positive economic impacts for Qatar, such as an increased level of self-sufficiency and food production, as well as a heightened awareness of the importance of achieving food security [8].
It is important to note that Qatar’s food security threats are rooted in its difficult geoclimatic conditions. Most of the country’s food and other supplies are imported and must pass through numerous chokepoints [11]. Policymakers are working to understand the complexities of food supply chains and their relationship to sustainable development, particularly in the context of limited water, energy, and land resources [12]. Achieving food security and supply chain resilience are critical to meeting sustainable development goals [13]. These two topics are key components of a sustainable food system that can provide adequate and essential levels of food for citizens [14]. However, food supply chain resilience should not come at the cost of sustainability. Therefore, it is essential to consider the impact of food supply chain resilience on the environment and the pressure imposed on natural resources. Approaches such as Life Cycle Assessment (LCA) and multi-region input-output (MRIO) analysis have been developed to assess food supply chain sustainability, both regionally and globally [15].
LCA models are frequently utilized to assess the potential environmental impact of food production activities and resource use. Among the most widely used LCA methods are environmental LCA and Economic Input-Output LCA (EIO-LCA), which have significant roles in decision-making regarding material procurement, production, and end-of-life phases. These methods also help to determine the overall energy and carbon footprint of the food production industry sector [16]. Thus, they provide a practical tool for evaluating the potential environmental effects of products and practices and call for the implementation of policies that reduce the negative effects of the supply chain. On the other hand, Multi Region Input-Output (MRIO) models use global trade data, as well as environmental and socioeconomic factors such as emission levels, energy use, material consumption, and economic value-added, to assess global environmental impacts. This differs from Single Region Input-Output (SRIO) models which mainly focus on regional environmental impacts.
As a result, the main objectives of this research can be summarized as follows. Firstly, we build a structured database management system and visualization approach to analyze Qatar’s imported food between 2013 and 2018. Secondly, we investigate the impact of the blockade on Qatar on the food supply chain from both a trade and carbon footprint perspective. Thirdly, we applied data visualization techniques for analyzing the carbon footprints of dairy products transported via different modes between 2015 and 2018. Fourth, we examine the carbon emissions of dairy products using the MRIO data and carbon emissions from freight transport activities. Lastly, we discuss the blockade’s impact on the food supply chain’s diversification and sustainability, specifically regarding its contribution to climate change.

2. Materials and Methods

The scope of this study is primarily determined by the available data from the General Authority of Customs and the Ministry of Development Planning and Statistics. Based on data availability, the focus of the study is to include all food imports from 2013 to 2018 by their value and port type. Comprehensive data analysis and visualization methods are utilized to achieve this. The supply chain modeling encompasses all phases, starting from raw materials to the distribution of dairy products. The carbon footprint analysis has been calculated through MRIO analysis, using a global system boundary rather than a regional one. This includes transportation-related emissions from all means of transportation, including air, land, and sea. Since the model analysis only considers dairy products, transportation and storage-related carbon emissions are not included as their internal impact on Qatar is identical. The study aims to investigate the effect of the blockade on Qatar on the supply chain of food from trade and carbon footprint perspectives. Additionally, the study intends to discuss the resilience and sustainability of the food supply chain concerning the blockade’s impact on contributing to global climate change.
The MRIO model is utilized to analyze the production of raw milk and dairy products, taking into account their unique effects on different nations such as carbon and energy emissions. The analysis begins with the consideration of emissions related to raw milk production. The process involves the transportation of raw milk to a factory where dairy products are produced, with these two industries being the focus of the MRIO analysis. The finished products are then transported to Qatar using a combination of land, sea, and air modes until they reach Qatar’s external border. As illustrated in Figure 1, the model excludes the regional supply chain taking place in Qatar, as the purpose is to examine the differences in global production and transportation-related impacts based on the country of origin of production.
After the creation of the database, interactive dashboards are generated in the Power BI program to view the data. The next step is to create the MRIO model and calculate the carbon emissions, which are then imported into an Excel file and integrated into Power BI. DAX coding is used to create algorithms and codes for the model, which includes various transportation modes and focuses on fresh milk and dairy products to determine the global carbon emissions for each country. The conclusion of the study discusses the impact of the blockade on Qatar’s food industry and supply chain, as well as the opportunities that arose as a result of the blockade. The overall research process is illustrated in Figure 2.
Greenhouse gases such as carbon dioxide (CO2), methane (CH4), and nitrogen oxide (N2O) have a significant impact on climate change. The calculation of each emission is based on its global warming potential (GWP), which is presented in Table 1. The GWP values are expressed in metric tons of CO2-equivalent (mt CO2-eq) and are calculated relative to CO2 over a 100-year time horizon [17].

2.1. General Formulation

The calculation of CO2 emissions from freight transportation can be approached through two methods. The first method involves measuring emissions based on the level of transportation activity, while the second method focuses on energy consumption.
In this paper, an activity-based approach is utilized to determine CO2 emissions. The formula used for this method is as follows:
CO2 emission = w × d × c/1,000,000
The formula to calculate CO2 emissions per ton-km includes three variables: w, the transported volume in tons by the transportation mode; d, the average transportation distance in km; and c, the CO2-emission factor per ton-km measured in grams of CO2 per ton-km.
However, the emission factors for chemical transport operations can be influenced by numerous factors, such as the type of greenhouse gases to consider, the transportation mode, the energy supply chain, the product characteristics, the logistics activities throughout the supply chain, and geographic location. As a result, it can be challenging to apply the activity-based approach [18]. To measure CO2 emissions per ton-km, certain assumptions are made.
Average CO2 emission air mode
if d < 1000 k, c = 1752.5 gCO2/ton-km
if d > 1000 k, c = 602 gCO2/ton-km
if d > 1000 and d < 4000 k, c = 780 gCO2/ton-km
Average CO2 emission sea mode
c = 16 gCO2/ton-km
Average CO2 emission land mode
c = 62 gCO2/ton-km

2.2. Calculating the Carbon Footprint

To calculate the carbon footprint, we use the Formulations (2)–(4), in order.
M = Total money per million euros
MRIODiary = M × [∑ N2O + ∑ CH4 + ∑ CO2]
MRIORaw Milk = M × [∑ N2O + ∑ CH4 + ∑ CO2]
The emissions of various greenhouse gases have been calculated using (4) as follows:
CO2 equivalence = CO2 emission air mode + CO2 emission land mode + CO2 emission sea mode + MRIODiary + MRIORawMilk

2.3. MRIO Analysis

The EXIOBASE 3.4 database is used to obtain a symmetric industry-by-industry input–output table and corresponding economic transactions for global economies, including the Middle East as a region. This dataset covers 43 nations, 5 globe regions, and 163 industrial sectors, providing comprehensive information on the global economy. The MRIO datasets for EXIOBASE’s national and global IO tables are derived from the Supply and Use Tables at Current Prices with a Fixed Product Sales Assumption. Raw data from the United Nations’ National Accounts, Comtrade, and Eurostat databases are also utilized [10]. Carbon footprint multipliers are calculated by dividing the output of each sector by the effect category assessed by economic performance.
The global upstream carbon footprint from long-term milk production is calculated by using the MRIO model. MRIO analysis provides several advantages, such as improving regional specificity, reducing aggregation bias, analyzing the connection of various regions, and evaluating their effects on other regions [18,19]. The Leontief inverse is used to represent the input–output monetary flows within an economy between industries.

3. Results and Discussion

As a result, this study aims to
  • Create a database management system and visualization method to analyze imported food in Qatar between 2013 and 2018.
  • Identify the economic, geographical, and social impacts of the blockade on Qatar’s food supply chain.
  • Utilize data analytics and visualization techniques to measure and manage the carbon footprint of freight transport operations for dairy products across various transport scenarios.
We have answered all the above topics within this paper. We analyze the effect of the embargo on Qatar import in the following section.

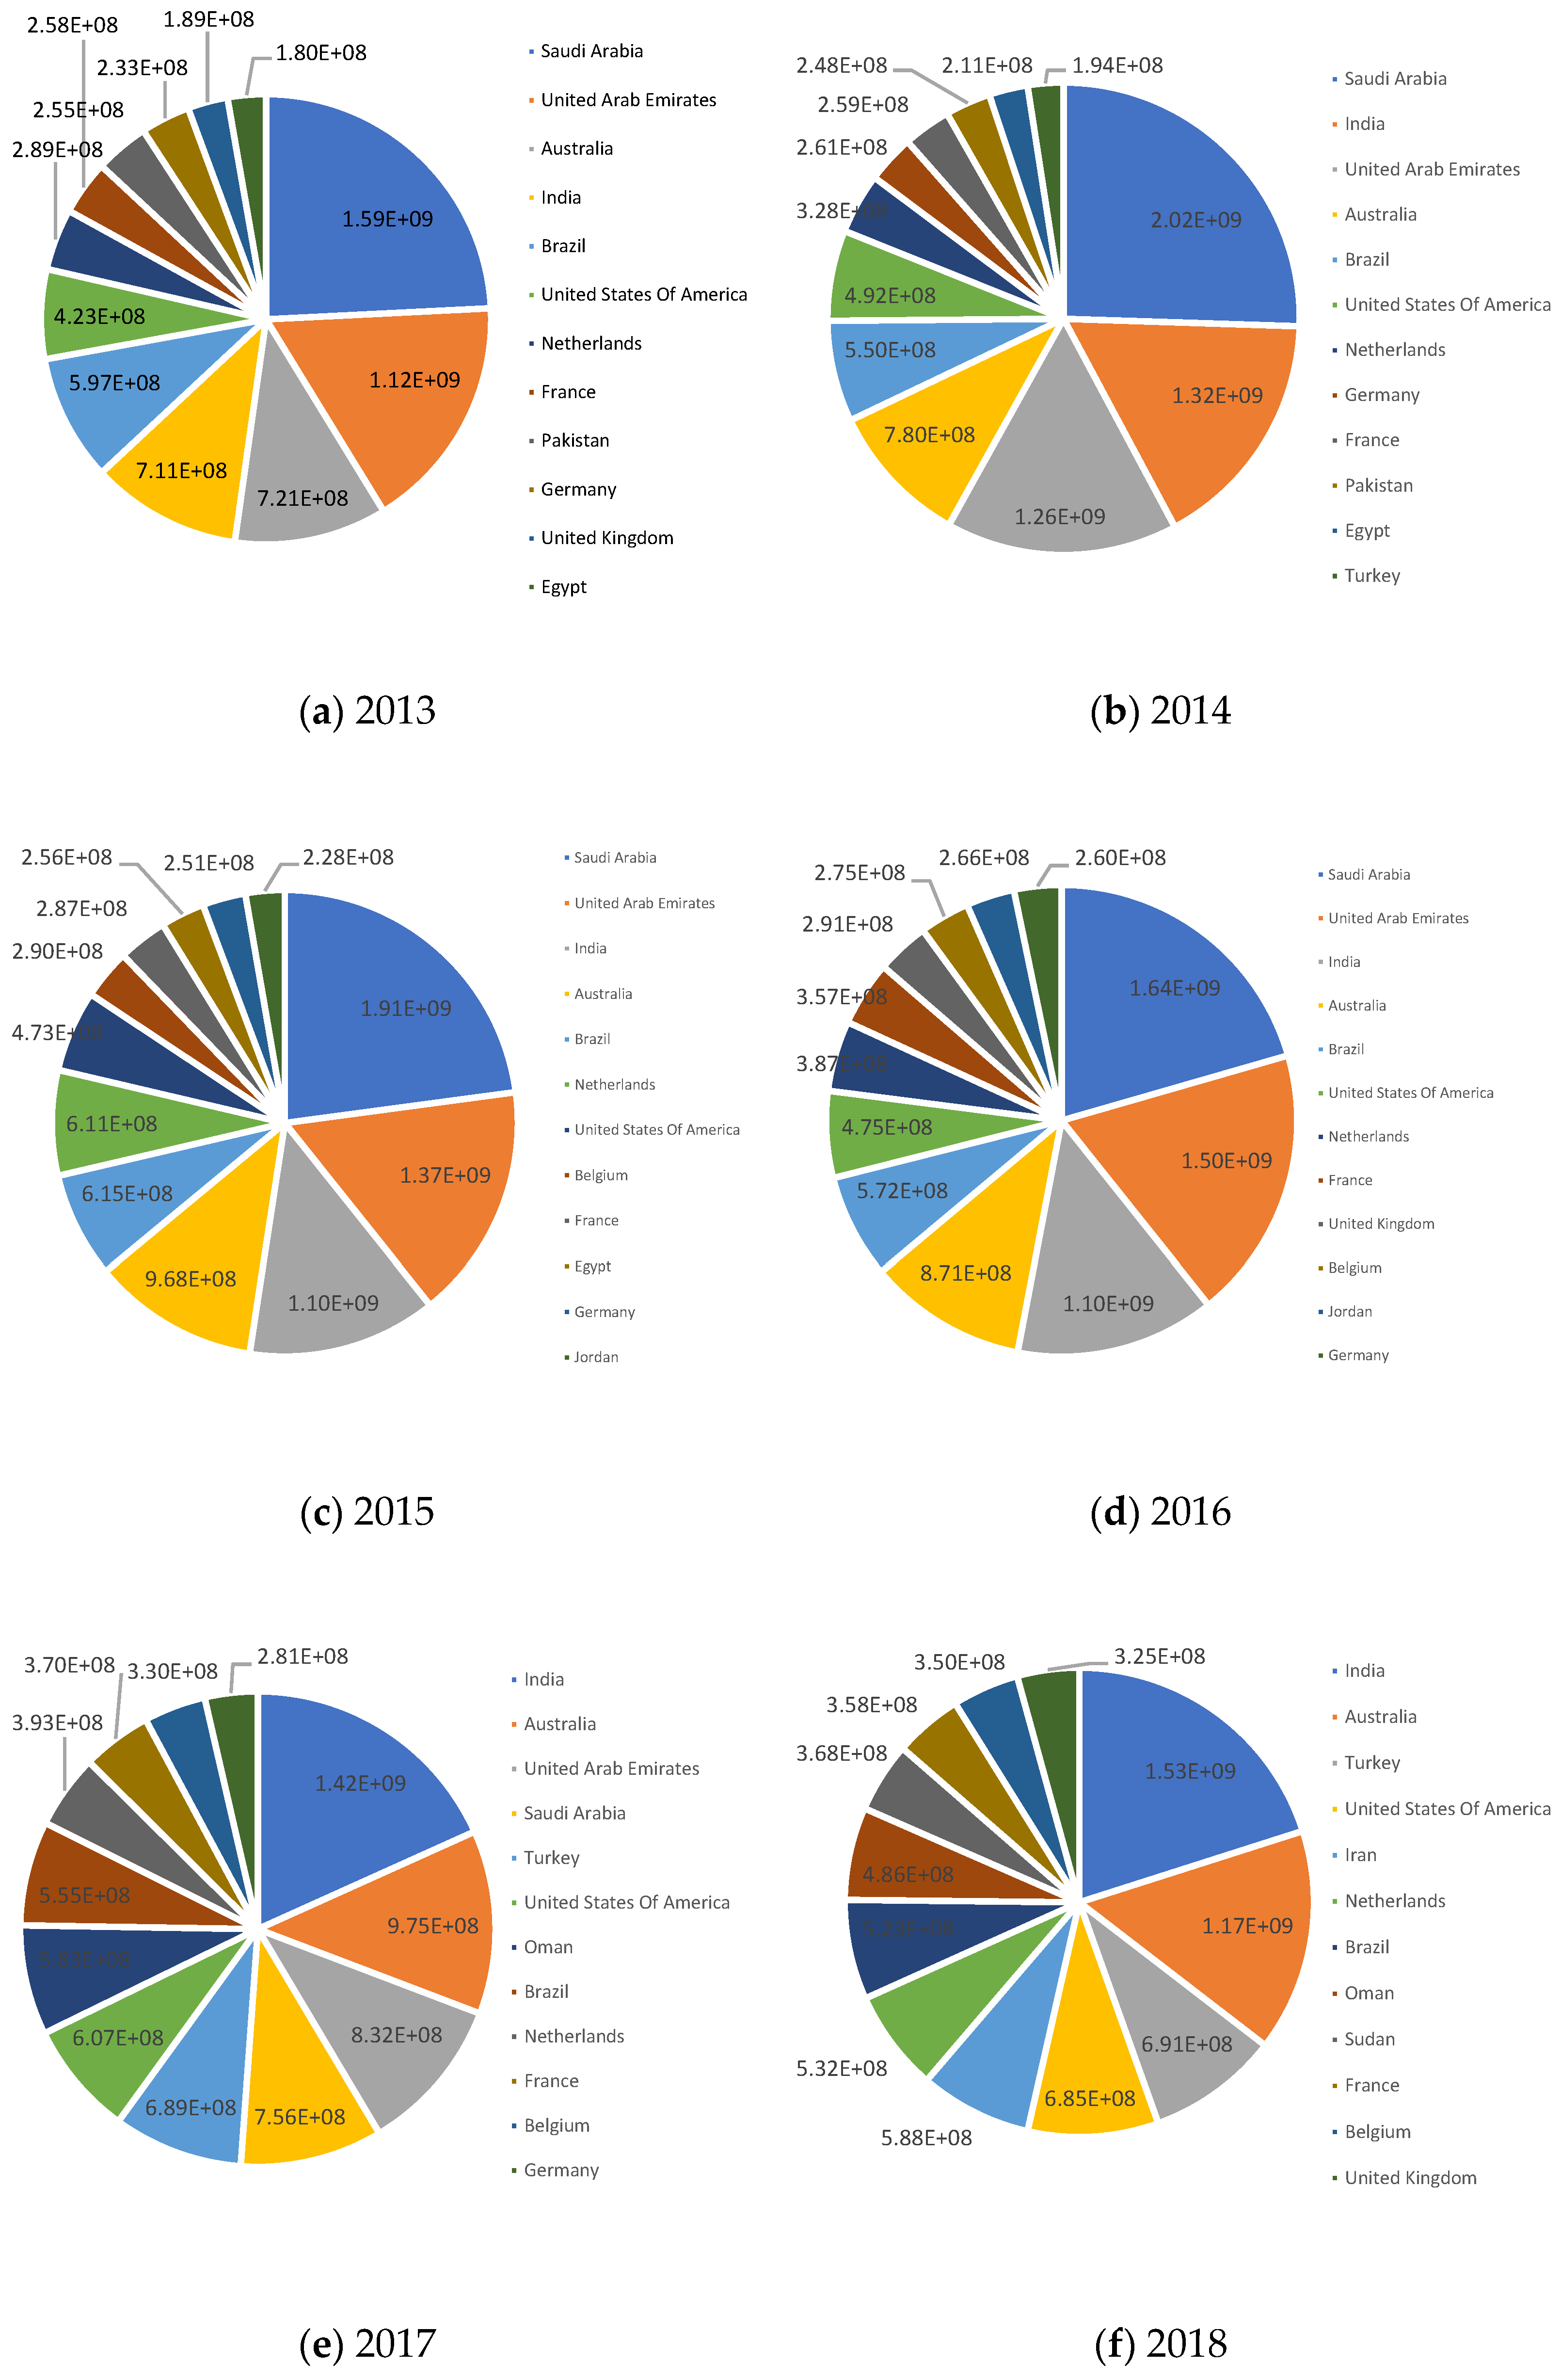
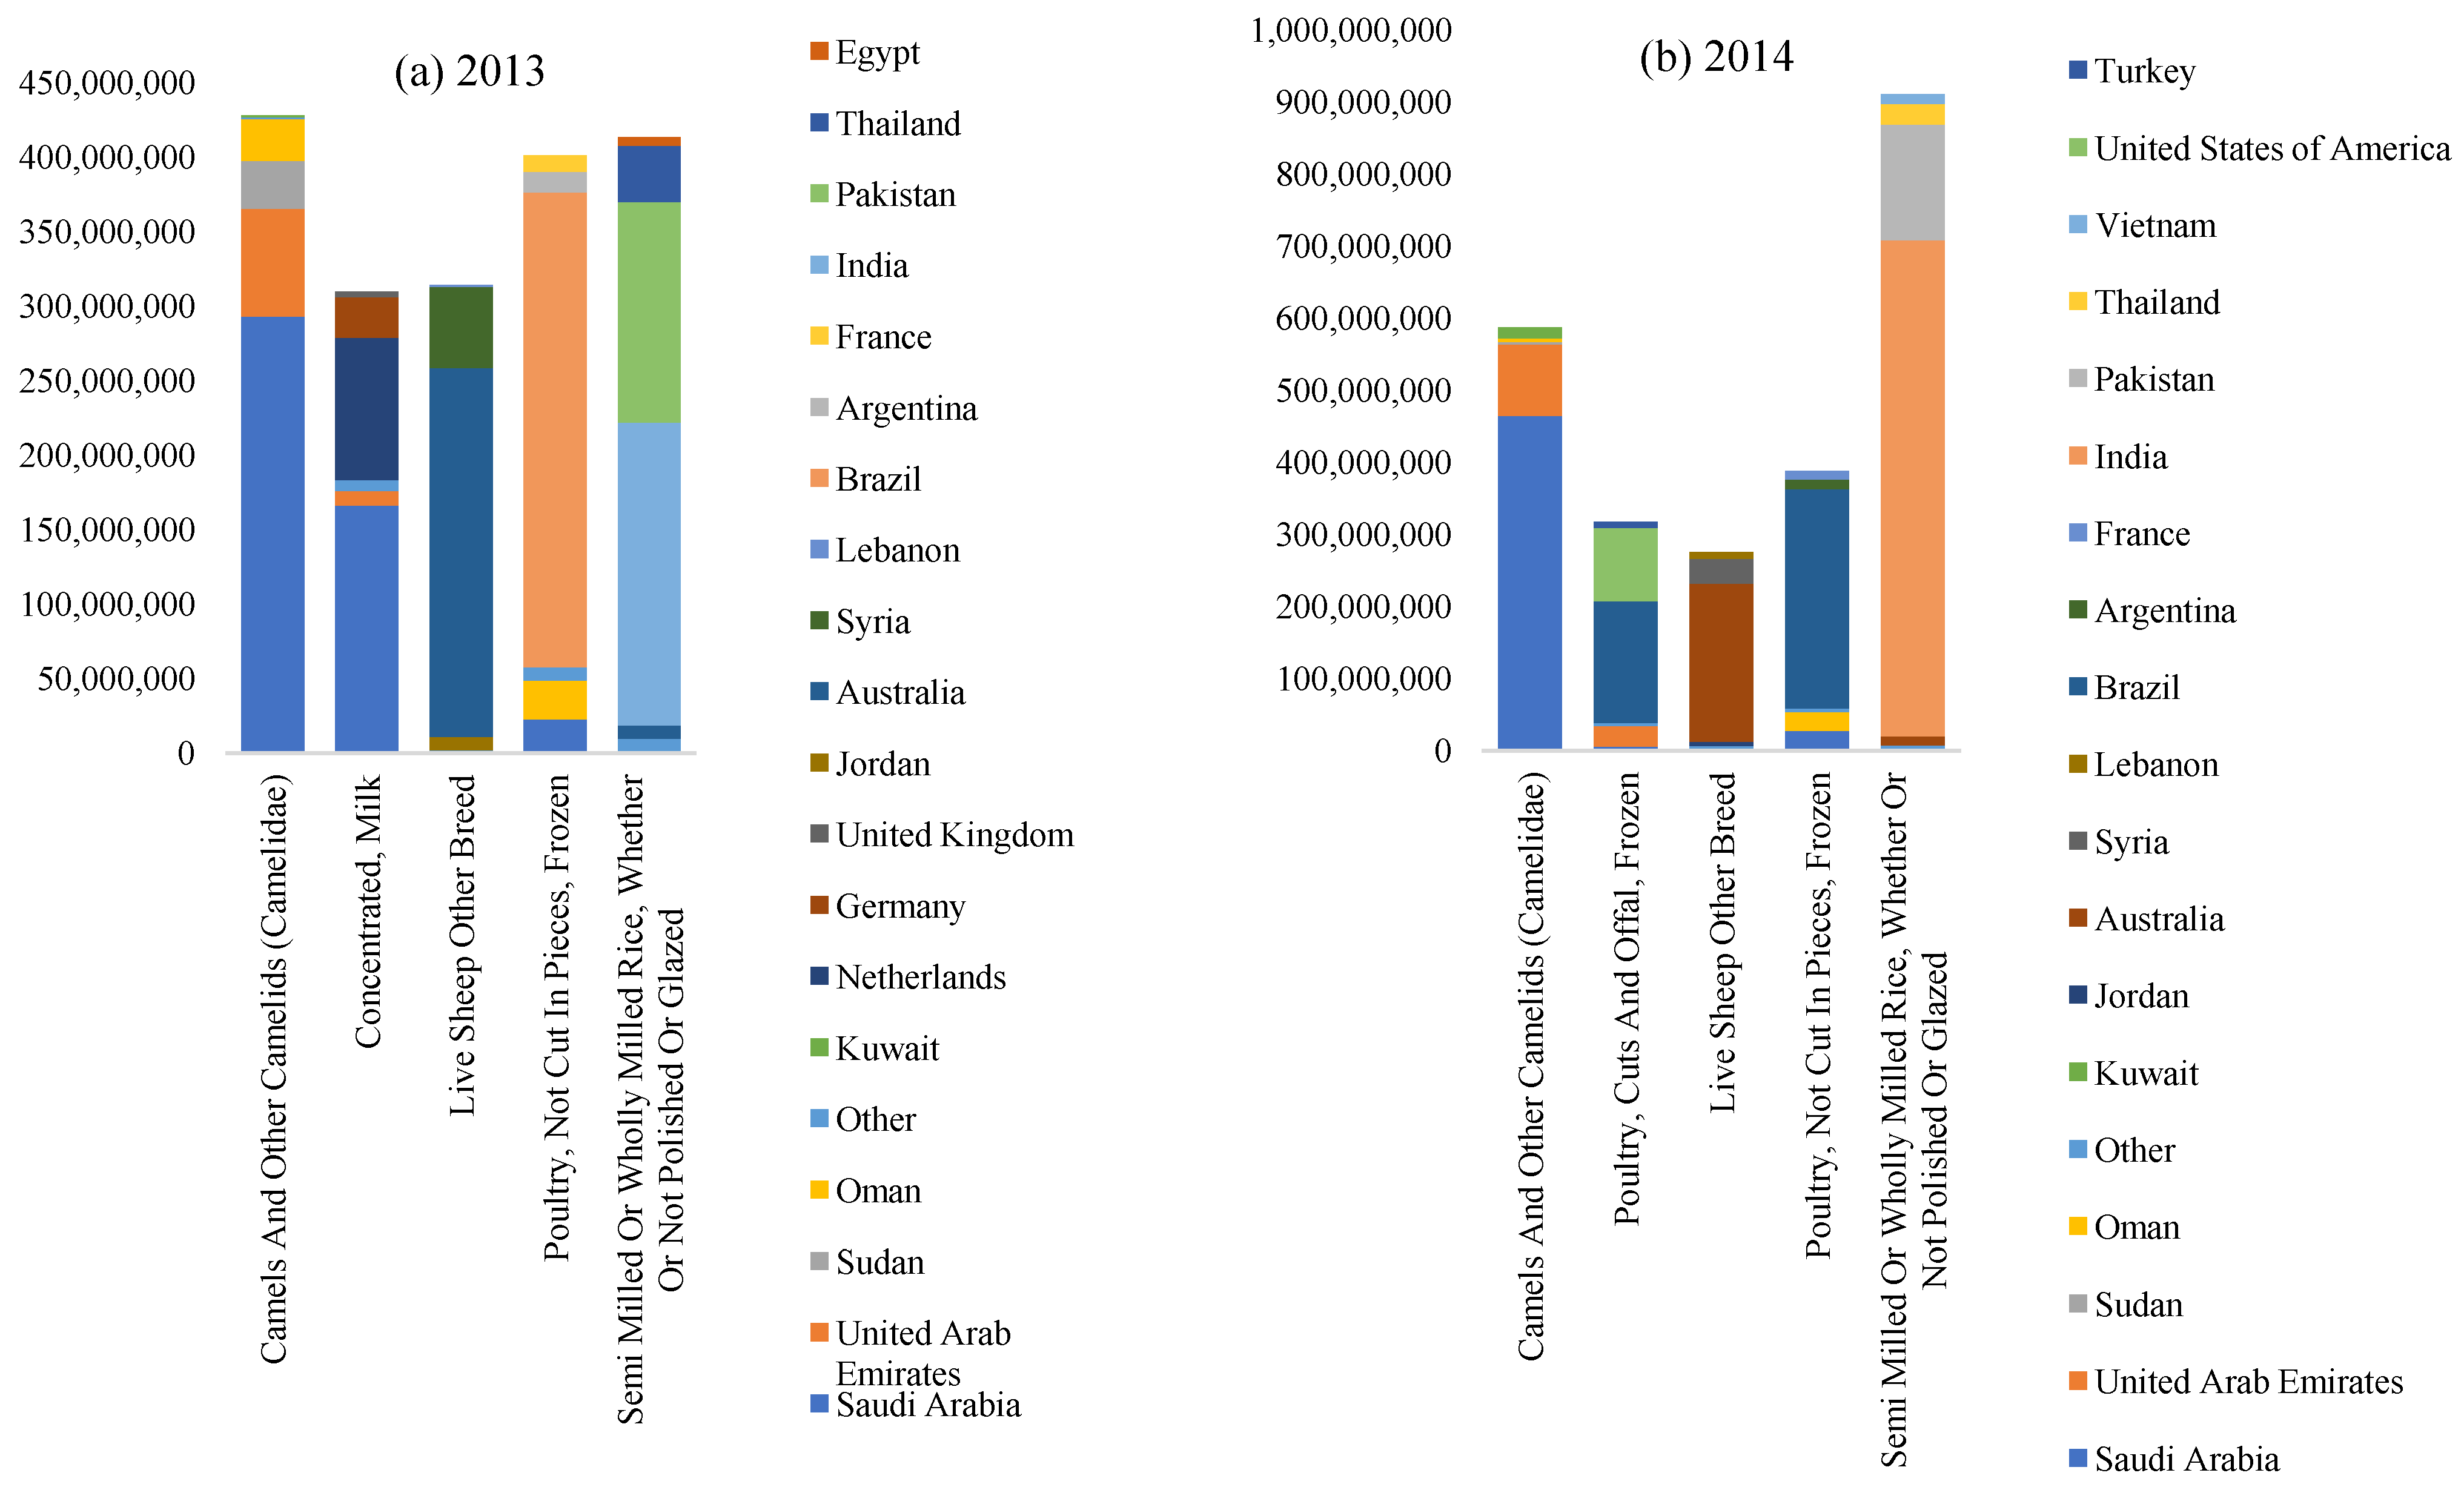
3.1. Embargo Effect on Qatar Import Structure

The impact of the trade embargo on Qatar’s food supply is depicted in Figure 3. In 2013, as presented in Figure 3a, Qatar’s food imports were dominated by Saudi Arabia and the United Arab Emirates (UAE), accounting for 24% and 17%, respectively. In 2014, Saudi Arabia remained at the top position (Figure 3b), while India and the UAE followed with 17% and 16%, respectively. Other countries, such as Germany, France, Jordan, Egypt, and Belgium, made smaller contributions to Qatar’s total food imports in 2014. Furthermore, the data indicate that in 2014, Saudi Arabia exported food to Qatar worth 2.02 billion Qatari Riyals (QR), and with India and the UAE ranking second and third, respectively, with 1.32 and 1.26 billion QR. The distribution of food imports in 2015 is shown in Figure 3c, with no significant changes from previous years. Qatar spent the largest amounts on Saudi Arabia, the UAE, and India, accounting for 1.9, 1.37, and 1.1 billion QR, respectively. The overall amount of food imported by Qatar from other countries, including Germany, France, Pakistan, Egypt, and Turkey, was lower in 2015 than in 2014.
In 2016, the largest imports came from Saudi Arabia and the UAE, which were 1.64 and 1.50 billion QR, respectively. Compared to the previous year, Saudi Arabia experienced a minor decline of about 0.26 billion QR, the UAE slightly increased by approximately 0.13 billion QR, and India remained constant. Other countries such as Germany, France, Jordan, the United Kingdom, and Belgium contributed less to Qatar’s net food imports in 2016. The data also revealed that in the same year, Saudi Arabia’s food export accounted for 21% of Qatar’s food imports. In 2017, due to the embargo, UAE’s and Saudi Arabia’s food export to Qatar dropped to 11% and 10%, respectively (Figure 3e). India and Australia became the largest contributors with 18% and 13%, respectively. Turkey and United States of America followed with 9% and 8%, respectively. In 2017, Germany, Belgium, France, the Netherlands, and Brazil had the lowest contributions to Qatar’s total food imports. India exported food products worth 1.42 billion QR, while UAE and Australia ranked second and third with 0.98 billion QR and 0.83 billion QR, respectively.
In 2018, the highest percentages were recorded in India and Australia of the overall value of imported food, accounting for 20% and 15%, respectively (see Figure 3f). Furthermore, Turkey shows substantial growth with a share of 9% when compared to the previous years, whilst the food import share of the countries who have imposed an embargo on Qatar falls significantly from the previous year by a very modest proportion. However, it was discovered that other nations with lower contributions to Qatar’s overall food imports in 2018 are the United Kingdom, Belgium, France, Sudan, and Oman. According to the findings, India’s food exports to Qatar were 1.53 billion QR in 2018. Turkey and Australia are on second and third rank, with 1.17 billion and 0.69 billion QR, respectively.
Figure 4 displays the top five food import categories from 2013 to 2018, as determined by the amount of money Qatar spent on imports from the top five exporting nations. The legend uses the word “other” to represent the remaining nations. All values are in QR. Figure 4a represents the imported food items in 2013, with camel/camelids being the most commonly imported category, accounting for 68.40% of all imports from Saudi Arabia. Semi-milled or fully milled rice is the second category, with India leading at 49.19%, followed by Pakistan at 35.82%. In the poultry category, Brazil is the top contributor, with 79.33%, while Australia leads in the live sheep category with 78.85%. Concentrated milk is primarily imported from Saudi Arabia and Australia, with corresponding contributions of 53.59% and 30.77%, respectively. In 2014, the top five imported products remained the same as in Figure 3a, with the exception of condensed milk, which was replaced by frozen poultry parts and offal. Brazil was the largest contributor to this category at 53%, while the United States of America and the United Arab Emirates followed with 33.17% and 8.82%, respectively. There was a noticeable change in the contributions made by countries compared to the previous year. For example, in the semi-milled and wholly-milled rice category, India took the lead in 2014 with 75.65%, Pakistan came in second with 17.6%, and Thailand made the smallest contribution at 3.15% (see Figure 4b).
Figure 4c depicts the imported goods in 2015. According to that, the earliest imported varieties are fully and partially milled rice. The contributions of countries remain the same as the previous year, with slight adjustments. Live forces for sport become the second imported area, with significant transformations since 2014. The Netherlands and Belgium contribute 43.25% and 42.25%, respectively. The third category is frozen poultry, which comes from Brazil at a rate of 78.76%, Saudi Arabia at 6.71%, and other countries, such as Argentina and France, at the remaining rate. Offal poultry replaces leeks and other alliaceous vegetables and is mostly imported from India, with 37.9%, and 29.21% imported from other countries. The UAE increases its contribution to the camels and Camelidae category by about 10% compared to the previous year, while Saudi Arabia contributes 67.12%.
Figure 4d shows the imported products in 2016. According to this figure, yogurt and carcasses are the two new categories. Yogurt, whether concentrated, with added sugar or other flavorings, or with additional fruit, was imported from Saudi Arabia at a rate of 91.98%, followed by the United Arab Emirates at a rate of 6.9%. The second new category was cold lamb carcasses and half carcasses and was dominated by Australia at a rate of 97.74%. Sport horses were imported from Belgium at a rate of 50.46%, followed by the United Kingdom at a rate of 33.48%, surpassing the Netherlands, which was the second-largest importer the previous year. The majority of frozen poultry continued to be imported from Brazil at 79.89%. Additionally, semi- or fully-milled rice was still mostly imported from India and Pakistan, with 73.85% and 14.1%, respectively.
In 2017, a new category of cigarettes containing tobacco emerges, as shown in Figure 4e. In comparison to recent years, Saudi Arabia and the UAE make significantly lower contributions. Cigarettes are imported from Germany, Turkey, Switzerland, and other countries, comprising 42.93%, 23.77%, 15.19%, and 8.10%, respectively. The majority of frozen poultry is imported from Brazil (72.58%), followed by France (9.93%). Similarly, in 2018, Australia imports corpses, with the majority (95.37%) being lamb or cold carcasses, reflecting a slight reduction from the previous year. Semi- or fully-milled rice is imported from India (80.05%), showing an increase from the previous year, while 9.73% of the same category is imported from Pakistan.
As demonstrated in Figure 4f, due to the embargo, there is a significant difference between 2018 and 2017 in terms of the nations importing food to Qatar. The first imported category is fresh or chilled lamb carcasses and halves, dominated by Australia, accounting for 97.96% of the total. The second group consists of semi-milled or fully-milled rice, with the majority coming from India (80.97%). It is noteworthy that 65.44% and 21.28% of imported live sheep come from Iran and Australia, respectively. In that year, a new category emerges in comparison to prior years, consisting of bran, sharps, and other wheat leftovers. Sudan contributes 64.95% to this category, followed by Tanzania (22.73%) and Uganda (4.85%).
The top ten countries’ contribution to the economic value of food trade from 2013 to 2018 is depicted in Figure 5. There are no significant changes in country contributions between 2013 and 2016. However, in 2017, Oman and Turkey show considerable growth. In contrast, Saudi Arabia’s contribution drops by almost 10%, and the UAE’s contribution decreased from 22.88% to 14.18%. Iran and Brazil are replaced by other countries in 2018. Australia and India, in contrast, display more consistent total trade contributions. The United States and the Netherlands, as shown in Figure 5, make considerably lower contributions. The amount allocated to GCC nations showed a continuous decline until 2018.

3.2. MRIO Results for Milk and Dairy Production

The import of long-lasting milk by Qatar through land, air, and sea transportation modes is presented in Figure 6. The total quantity of long-lasting milk imported increased slightly from 121 million kg in 2015 to 126 million kg in 2016, but decreased sharply to about 54 million kg in 2017 due to the blockade. Notably, there were no long-lasting milk imports via land transport in 2018. Between 2015 and 2016, sea-based imports remained stable, then gradually increased to 14 million kg in 2017, before dropping to 1.6 million kg in 2018. As shown in Figure 6, maritime transport of long-lasting milk increased significantly, from approximately 30.9 million kg in 2015 to over 77 million kg in 2018. The embargo led to an increase in imports from foreign countries, thereby increasing the demand for air and sea transport in 2017 and 2018.
Figure 7 illustrates the carbon footprint per ton by nation between 2015 and 2018. In 2015, Saudi Arabia has the highest carbon footprint per ton of dairy and raw milk, with 142 mt CO2 eq/ton and 219 mt CO2 eq/ton, respectively (Figure 7a). One possible reason for this is the high amount of imports from Saudi Arabia to Qatar. UAE ranked second with 27 mt CO2 eq/ton of dairy and 41 mt CO2 eq/ton of raw milk, despite having lower CO2 emissions from land compared to other sources. The Netherlands ranked third with 18 mt CO2 eq/ton of dairy and 20 mt CO2 eq/ton of raw milk, in addition to around 4048 kg CO2 emissions from the sea. Egypt followed as the fourth, followed by Turkey, with a significantly lower carbon footprint than Saudi Arabia. In 2016, Saudi Arabia retained its top position with 150 mt CO2 eq/ton of dairy, 232 mt CO2 eq/ton of raw milk, and 6096 kg CO2 eq/ton of land emissions, showing a slight increase from the previous year (Figure 7a,b). The United Arab Emirates ranked second with 24k kg CO2 equivalents per ton of dairy and 36k kg CO2 equivalents per ton of raw milk, with lower CO2 emissions from land compared to other sources. The Netherlands ranked third with 18k kg CO2 eq/ton of dairy and 19k kg CO2 eq/ton of raw milk, followed by Egypt and France.
Compared to the previous year, there is a significant increase in carbon footprint in 2017, which results in a change in the rankings of nations. Saudi Arabia’s carbon footprint decreases substantially, but it still remains among the top-producing nations with 103 mt CO2 eq/ton of dairy and 66 mt CO2 eq/ton of raw milk. Land transport-related emissions are only 2645 kg CO2 eq/ton, while ocean emissions are found to be negligible. Turkey ranked second in terms of carbon emissions, with 36 mt CO2 eq/ton of raw milk and 35 mt CO2 eq/ton of dairy. The United Arab Emirates ranked third with 24 mt CO2 eq/ton of raw milk and 15 mt CO2 eq/ton of dairy, followed by the Netherlands with 14 mt CO2 eq/ton of raw milk and 15 mt CO2 eq/ton of dairy. France, Belgium, and the United States follow in ranking.
Notably, both country rankings and carbon footprint emissions change significantly in 2018 (Figure 7d), with new states emerging compared to previous years. The Netherlands had the largest carbon footprint with 24 mt CO2 eq/ton of raw milk and 26 mt CO2 eq/ton of dairy product. Oman ranked second with 17 mt CO2 eq/ton of raw milk and 11 mt CO2 eq/ton of dairy products, while Morocco ranked third with 15 mt CO2 eq/ton of raw milk and 10 mt CO2 eq/ton of dairy products. Turkey contributed 12 mt CO2 eq/ton of raw milk and 11 mt CO2 eq/ton of dairy products.
Figure 8 displays the cumulative carbon footprint impact from 2015 to 2018 using MRIO models for two products. In 2015, the carbon footprint per ton (million metric ton CO2-eq) for MRIO-Raw Milk consumption is 0.30. The value is 0.12 for MRIO-Dairy product consumption. Carbon footprint per ton by sea, land, and air are 0.07, 0.06, and 0.02, respectively. In 2016, MRIO-Raw Milk consumption is 0.31; MRIO-Dairy consumption is 0.22, with 0.07 million metric tons transported by sea, 0.07 by land, and 0.03 via air. The carbon footprint decreases substantially from more than 0.5 million metric tons in 2015 to less than 0.4 million metric tons in 2018. However, there is a significant rise in 2017 due to a crisis period, which led to a temporary scarcity of dairy products. To address the shortage, the government started importing dairy products from various countries such as Turkey and Iran, resulting in a significant amount of CO2 emissions. The reduction in carbon footprint in 2018 is not only due to changes in the food supply chain, but also the crisis, which prompted Qatar to become self-sufficient. The Baladna company quickly became one of the largest and most technologically advanced farms in the Middle East and fulfilled all of the demand for dairy products in Qatar markets, resulting in a smaller carbon footprint.

4. Conclusions

This paper examines the economic and environmental impacts of the embargo on Qatar’s food supply chain. The aim of the study is to analyze the effects of the blockade between 2015 and 2018, using the MRIO model to assess carbon footprints from freight transport operations for dairy products via various transportation modes. The study finds that Australia, India, and Turkey become Qatar’s primary food import sources in 2018, instead of the GCC countries, particularly the UAE and Saudi Arabia, which dominated imports in 2013. This decrease in food imports could be attributed to self-sufficiency initiatives after the embargo. The study also reveals significant changes in food categories and transportation modes before and after the embargo. For instance, the use of sea-based transport for long-lasting milk products increased dramatically from around 30.9 million kg in 2015 to roughly 77 million kg in 2018. In 2015, the UAE and Saudi Arabia had the largest carbon footprint compared to other countries, whereas the Netherlands led in 2018 with a carbon footprint of 24 mt CO2 eq/ton of raw milk and 26 mt CO2 eq/ton of dairy product.
Food security is still a major concern for Qatar’s National Development Plans, as it is crucial for the country’s economic independence and achieving its 2030 national vision. Qatar aims to increase domestic food and agricultural output, and the Ministry of Trade and Industry is working to enhance cooperation between the public and private sectors to make the nation one of the region’s most prominent self-sufficient nations. The 2018 Food Global Security Index (FGSI) score for Qatar, as reported by the Intelligence Unit of the Economist, is slightly higher than the previous year, with a score of 76.5 compared to 73.3 in 2017. This improvement leads to Qatar moving up from position 29 to position 22 worldwide, which was likely influenced by the challenges faced by Qatar during the blockade. The authors suggest that future research could involve the development of a global multi-regional econometric model of Qatar’s food sectors using real trade data from various sources. Our method could help improve the resilience of the food supply system in the event of future crises, such as the ongoing threats of COVID-19 and the Russia–Ukraine war. To prepare for such unexpected situations, the authors recommend the advancement of proposed analytical trade-based model for Qatar’s food value chain. Using advanced operations research methods like network optimization, simulation, and supply chain data analytics will be important for future research efforts to assess and minimize the impacts of food crises on future generations.

Author Contributions

Conceptualization, M.K. and N.A.-A.; methodology, M.K., N.A.-A. and N.C.O.; software, N.A.-A.; validation, B.Y.E., K.E. and H.A.; formal analysis, N.A.-A.; investigation, Y.K. and N.C.O.; resources, N.C.O. and Y.K.; data curation, N.A.-A. and E.F.; writing—original draft preparation, M.K., N.A.-A., E.F. and H.A.; writing—review and editing, B.Y.E., K.E., E.F., M.E.B. and Y.K.; visualization, H.A. and N.A.-A.; supervision, M.K.; project administration, M.K. and N.C.O. All authors have read and agreed to the published version of the manuscript.

Funding

This research received no external funding.

Institutional Review Board Statement

Not applicable.

Informed Consent Statement

Not applicable.

Data Availability Statement

Not applicable.

Conflicts of Interest

The authors declare no conflict of interest.

References

  1. Pinstrup-Andersen, P. Food security: Definition and measurement. Food Secur. 2009, 1, 5–7. [Google Scholar] [CrossRef]
  2. Al-Saidi, M.; Saliba, S. Water, energy and food supply security in the Gulf Cooperation Council (GCC) countries—A risk perspective. Water 2019, 11, 455. [Google Scholar] [CrossRef] [Green Version]
  3. Hertel, T.; Elouafi, I.; Tanticharoen, M.; Ewert, F. Diversification for enhanced food systems resilience. Nat. Food 2021, 2, 832–834. [Google Scholar] [CrossRef]
  4. Wang, Y.; Zhu, Y.; Zhang, S.; Wang, Y. What could promote farmers to replace chemical fertilizers with organic fertilizers? J. Clean. Prod. 2018, 199, 882–890. [Google Scholar] [CrossRef]
  5. Liu, H.; Fan, X. Value-added-based accounting of CO2 emissions: A multi-regional input-output approach. Sustainibility 2017, 9, 2220. [Google Scholar] [CrossRef] [Green Version]
  6. Egilmez, G.; Kucukvar, M.; Tatari, O.; Bhutta, M.K.S. Supply chain sustainability assessment of the U.S. food manufacturing sectors: A life cycle-based frontier approach. Resour. Conserv. Recycl. 2014, 82, 8–20. [Google Scholar] [CrossRef]
  7. Bulak, M.E.; Kucukvar, M. How ecoefficient is European food consumption? A frontier-based multiregional input–output analysis. Sustain. Dev. 2021, 30, 817–832. [Google Scholar] [CrossRef]
  8. Ahmed, J.U.; Begum, F.; Ahmed, A.; Talukder, N. A blessing inside a calamity: Baladna food industries in Qatar. Int. J. Manag. Enterp. Dev. 2020, 19, 203–216. [Google Scholar] [CrossRef]
  9. Dixon, J.; Richards, C. On food security and alternative food networks: Understanding and performing food security in the context of urban bias. Agric. Human Values 2016, 33, 191–202. [Google Scholar] [CrossRef]
  10. Yu, Y.; Feng, K.; Hubacek, K.; Sun, L. Global Implications of China’s Future Food Consumption. J. Ind. Ecol. 2016, 20, 593–602. [Google Scholar] [CrossRef] [Green Version]
  11. Amery, H.A. Food Security in Qatar: Threats and Opportunities. Gulf Insights Ser. 2019, 7, 1–6. [Google Scholar]
  12. Kucukvar, M.; Samadi, H. Linking national food production to global supply chain impacts for the energy-climate challenge: The cases of the EU-27 and Turkey. J. Clean. Prod. 2015, 108, 395–408. [Google Scholar] [CrossRef]
  13. Kajenthira Grindle, A.; Siddiqi, A.; Anadon, L.D. Food security amidst water scarcity: Insights on sustainable food production from Saudi Arabia. Sustain. Prod. Consum. 2015, 2, 67–78. [Google Scholar] [CrossRef]
  14. Manikas, I.; Sundarakani, B.; Anastasiadis, F.; Ali, B. A Framework for Food Security via Resilient Agri-Food Supply Chains: The Case of UAE. Sustainibility 2022, 14, 6375. [Google Scholar] [CrossRef]
  15. Kucukvar, M.; Onat, N.C.; Abdella, G.M.; Tatari, O. Assessing regional and global environmental footprints and value added of the largest food producers in the world. Resour. Conserv. Recycl. 2019, 144, 187–197. [Google Scholar] [CrossRef]
  16. Wald, N.; Hill, D.P. ‘Rescaling’ alternative food systems: From food security to food sovereignty. Agric. Human Values 2016, 33, 203–213. [Google Scholar] [CrossRef]
  17. McKinnon, A.C.; Piecyk, M.I. Measurement of CO2 emissions from road freight transport: A review of UK experience. Energy Policy 2009, 37, 3733–3742. [Google Scholar] [CrossRef]
  18. Nunes, R.A.O.; Alvim-Ferraz, M.C.M.; Martins, F.G.; Sousa, S.I.V. The activity-based methodology to assess ship emissions—A review. Environ. Pollut. 2017, 231, 87–103. [Google Scholar] [CrossRef] [PubMed]
  19. Bukhari, I. Turkish Diary & Poultry Products Hit Qatar Retail Shelves to Allay Supply Woes after Blockade. The Peninsula. 9 June 2017. Available online: https://thepeninsulaqatar.com/article/09/06/2017/Turkish-diary-poultry-products-hit-Qatar-retail-shelves-to-allay-supply-woes-after-blockade (accessed on 19 March 2023).
Figure 1. System boundary.
Sustainability 15 05755 g001
Figure 2. Research flow chart.
Sustainability 15 05755 g002
Figure 3. Value of imports by country from 2013 to 2018 (QR).
Sustainability 15 05755 g003
Figure 4. Top five imported categories by year (QR).
Sustainability 15 05755 g004aSustainability 15 05755 g004b
Figure 5. Contribution of Top 10 Countries by year (%).
Sustainability 15 05755 g005
Figure 6. Imported long-lasting milk by weight (kg).
Sustainability 15 05755 g006
Figure 7. Annual carbon footprint per ton (kg CO2-eq).
Sustainability 15 05755 g007
Figure 8. The total carbon footprint from 2015 to 2018 (kg CO2-eq per ton).
Sustainability 15 05755 g008
Table 1. Direct CO2 global warming potentials.
Typical TermChemical FormulaConversion Variables for the GWP over a 100-Year Horizon
Carbon dioxideCO21
MethaneCH425
Nitrous oxideN2O298
Disclaimer/Publisher’s Note: The statements, opinions and data contained in all publications are solely those of the individual author(s) and contributor(s) and not of MDPI and/or the editor(s). MDPI and/or the editor(s) disclaim responsibility for any injury to people or property resulting from any ideas, methods, instructions or products referred to in the content.

