Abstract
A common practice in the construction of residential and commercial buildings in Saudi Arabia is to insulate the outer walls and windows only. Other building components such as the roof, columns and slabs, and doors are usually neglected. Moreover, vital components such as the roof and windows are especially neglected in commercially built residential and commercial buildings. The aim of this study is to put this common impression and practice to the test by quantifying the contribution of every building component to the overall air-conditioning load of the building. The hypothesis evaluated in this paper is that despite the common practices, there could be an optimum selection of insulators for the building components that yields the lowest energy consumption and maximum savings not only in energy costs but also installation costs. The required air-conditioning load is determined using manual calculations and the HAP software package for 1022 possible configurations. The findings of the analysis point to the importance of the roof, as it is the major contributor to the thermal load, followed closely by columns and slabs, with 44.2% of the overall cooling load. It is found that a single wall consisting of 2 cm of cement plaster, 20 cm of cement–polyurethane brick, and 2 cm of cement plaster is less expensive and has higher thermal resistance than any of the more expensive double walls. The study found one scenario of possible configurations with the optimized selection of building materials and their insulation materials that provides the most effective insulation at the lowest cost.
1. Introduction
The first usual targets for insulation are those building components with the largest exposed outside surface areas: the walls. With time, the use of clay bricks and other options such as aerated bricks gained popularity in the construction of residential buildings as a better substitute for cement bricks due to their higher resistance. Investigations were conducted to characterize the thermal performance of superior brick materials and specify the advantages they provide over ordinary cement bricks [1,2,3]. With time, other options for wall insulators and wall insulation procedures were introduced, such as double walls of normal bricks sandwiching an insulating material such as polystyrene or polyurethane, and more economic single (cement or clay) bricks with an inserted insulation layer.
By altering the insulation material, concrete grade, steel reinforcement size, and sample size combinations, Thangarasu and Henderson [4] studied the thermal insulation performance of several sandwich concrete panels (SCP). The study included both the experimental testing and finite element analysis of two different combinations of insulating materials and concluded that one of their suggested combinations provided better thermal insulation. According to Bolattürk’s research [5] on the insulation thickness in concrete composite panels employing polystyrene as an insulation agent, the ideal range for insulation material thickness is between 20 and 170 mm. By altering the thickness from 50 mm to 150 mm, Kim and Allard [6] examined the thermal sensitivity of precast sandwich concrete walls. Similar to this, Ucar and Balo [7] investigated insulating materials including foam board and polystyrene and found that for the greatest performance, the insulation material thickness should be between 10.6 and 76.4 mm.
Many studies were conducted to present the economic advantage of increasing a wall’s thermal insulation performance [8,9]. Said and Racz’s work [10] is a sample of an attempt to specify economically optimum insulation thickness. Other advanced studies, such as that by Mujahid and Zedan [11], evaluated the performance of different insulation wall systems available in the construction market in Saudi Arabia and identified insulators with the best insulation-to-cost performance. Tewfik [12] dedicated his Ph.D. thesis to a comprehensive study of the common wall systems used in residential buildings in Riyadh and emphasized the importance of deficiencies in design and construction on the performance of wall thermal insulation.
On the application side, interest was placed on some building components such as windows where energy providers try to increase awareness by publishing recommendations for reflective and double-glass windows [13]. Samen et al. [14] conducted a feasibility study on the use of discarded cotton fibers in the construction of lightweight, low-thermal-conductivity laterite–cement composites for structural purposes. With a 29% inherent energy reduction versus traditional materials, the samples they created look to be a promising eco-friendly composite with good thermal comfort, a small embodied energy, and low environmental impact owing to a sustainable approach. Alaoui et al. [15] used the following two strategies: (i) an experimental investigation with the goal of identifying the thermal characteristics of the regional building materials often utilized in the southeast of Morocco, and (ii) TRNSYS simulations were performed to forecast and improve the thermal performance of two different building types in this area. According to the findings, a building made of clay and other traditional building materials offers greater thermal comfort than a brick building.
The literature review reveals noticeable improvement in the efficiency and the performance of the insulation envelope, but most of the published research does not include the contribution of all other components of the total exposed surface area of the building (especially the roof and column/slab) and the importance and the practices of insulating these components. It is also evident from the literature review that the locally available insulating materials in Saudi Arabia and their combinations have not yet been investigated in detail. This work is concerned with bridging this research gap with the analysis of the total exposed surface area of residential buildings in order to quantify the contribution of each and every component of the surface area to the overall thermal load of the building. Comparing the contributions of all components determines whether the common practices in Saudi Arabia are justified.
With regard to technical objectives, the first one is to classify, quantify, and document the different building components of residential buildings in Saudi Arabia, along with representative samples of different common thermal insulations for every component, and the thermal properties of building components and their insulators. Next, the contribution of every building component to the overall air-conditioning load of the building is determined. The aim is to determine which components should be taken into consideration (thermally effective components) and which can be neglected.
One of the main objectives of this study is to concentrate on how to select the best insulator combinations of all of the thermally effective components to yield the maximum savings in energy consumption and in construction costs as well. Finally, based on the knowledge of the thermally effective building components used in this study, and based on the optimum selection procedure of insulation suggested by this study, modifications and/or additions to the current construction standards in Saudi Arabia are suggested to help lower the national consumption of energy and to lower the insulation cost burden for all citizens.
2. Materials and Methods
Figure 1 shows the methodology adopted in this study. First of all, the building components and materials were surveyed and classified. The data were procured from various manufacturers and suppliers of those materials in Saudi Arabia.
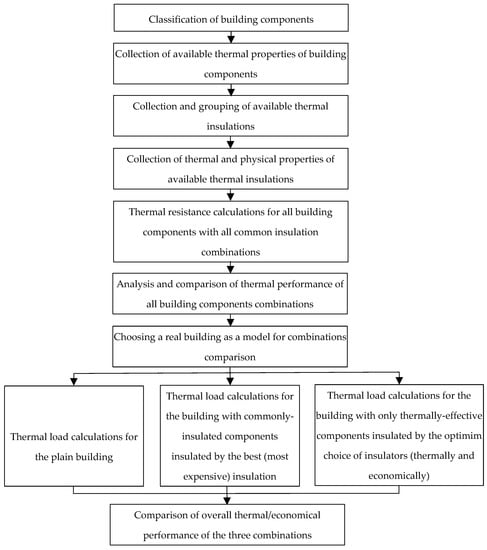
Figure 1.
Methodology adopted in this study.
Table 1 provides the physical and thermal properties of the material and insulation of walls and roofs commonly used in Saudi Arabia. Thermal conductivity, density, specific heat, and thermal resistance were tabulated for each component. The data were taken from manufacturers’ specifications. The overall thermal resistance (Rt) of the combinations was calculated. Appendix A represents a tabulation of the building components’ combinations, i.e., the matching of building components and their available insulators. It also represents the detailed component combinations, collective physical and thermal properties, and collective costs. Collective costs include the cost of the different materials of a combination and their installation cost. It should be noted that the materials’ prices and manpower costs vary with time and place. Although the relative comparison of the materials and labor cost is more stable and remains mostly unchanged for longer economic cycles.

Table 1.
Physical and thermal properties of materials and insulation of walls and roofs commonly used in Saudi Arabia.
The analysis of this research was performed with and limited by the following assumptions and constraints:
- The model used for cooling load calculations is a one-dimensional steady-state heat transfer model, which was solved using HAP software.
- Construction deficiencies such as the breaking of insulation boards during installation were not taken into consideration.
- Building components’ uniformity was assumed, i.e., neglecting the interruption of any building component such as plastering between the bricks of single walls, the imperfect match between insulation boards of double walls, and the concrete between hollow block slabs (Hordi) in Hordi roofs.
- As the building was shifted from a single-wall to a double-wall system, the column width was kept fixed even though the thickness of the columns increased.
- Changes in insulation performance over time due to aging and other environmental factors were not considered.
Figure 2 shows the studied house, which is a common example from a real medium-sized villa in Riyadh, Saudi Arabia, with an area of 375 m2 (12.5 × 30) and a total constructed area of 556 m2. The dimensions and engineering details of the ground and first floor are shown in Figure 2b,c. This chosen house represents the major trend of current houses in Saudi Arabia. The outer surface of the building is divided into distinct components according to the material used. Some of these components are familiar to public insulation practices, such as the windows, walls, and roof. Other components include different parts of the outer surface of the building that are usually not included in the insulation process, such as doors, concrete slabs and columns, window frames, and brick and concrete frames that support windows and doors.
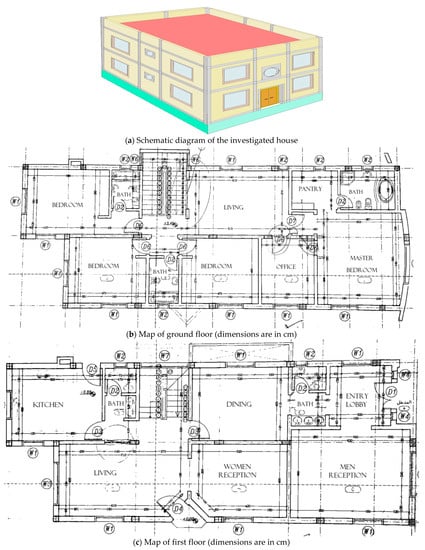
Figure 2.
A representation of the studied house. (a) Schematic diagram; (b) map of ground floor; (c) map of first floor.
For this investigation, the Hourly Analysis Program (HAP) was employed. Carrier, a provider of cooling, heating, and refrigeration systems, created this computer program. The program’s objective is to help engineers create HVAC systems for commercial buildings. It offers two tools in one: a simulation of energy use and cost computation, as well as load estimation and system design. HAP system design features and HAP energy analysis features make up the two sections of the program [16].
The following are the steps for the calculation of cooling load by HAP:
(1) Selection of city. Riyadh was selected, as the meteorological data of Riyadh were already available in the HAP database. The design dry bulb temperature for Riyadh was 45 °C and comfort conditioning requirements were kept to 24 °C and 50% relative humidity.
(2) Space properties were selected for walls, ceilings, doors, windows, partitions, etc., along with the infiltration, equipment, lighting, and occupants. The areas and thickness of each component were specified in this step.
3. Results and Discussion
3.1. Analysis of Building Components and Their Insulation
In Table 2, the partial area of the outer shell components of the studied house with their relative penetrating thermal load is listed for two situations. The two thermal situations presented in the table are the plain building (the building without any insulation) and the conventional common practice, where the latter represents the building with usually insulated components (walls and windows). The total shell surface area is about 700 m2. The total cooling load for the plain building is about 48.6 kW, and that for common-practice insulation is about 19.4 kW. So, a reduction in cooling load of about 60% is evident. Since the common practice only suggests the insulation of external walls and windows, the other dominant loads of the roof are not considered to be reduced.
Table 2.
Contribution of components of the studied house to the total exposed area.
Figure 3 shows the comparison of the areas of the studied house components. The external walls constitute the major component with more than half of the total area. The second major component is the roof with more than one-quarter of the total area. The remaining portion, which constitutes about one-fifth of the area, is shared between concrete columns and beams, windows, and doors. It seems that this area’s comparison is the real stimulant of the common practice of insulating only the walls and to some extent insulating the roof. The windows are commonly insulated because of the direct sunlight and its contribution to the thermal load.
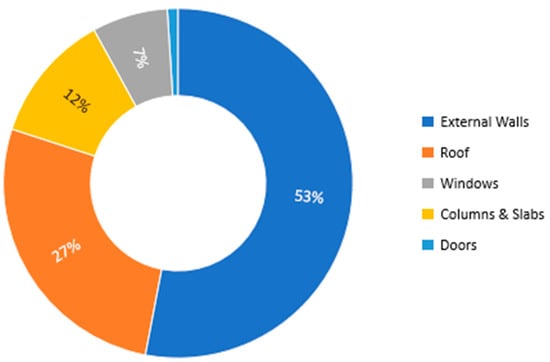
Figure 3.
Comparison of the component areas of the studied house.
The real significance of each one of these components can be made clear by comparing their individual thermal contribution to the overall thermal load. As shown in Table 2 and Figure 4, the significance of each component slightly changed from that of the area comparison. The walls decreased to slightly more than one-third of the total in terms of significance, while the roof increased to be closely competitive with walls, although its area is half of that of the walls. Windows and columns and slabs became much more significant. Doors, on the other hand, became much less significant than in the area comparison.
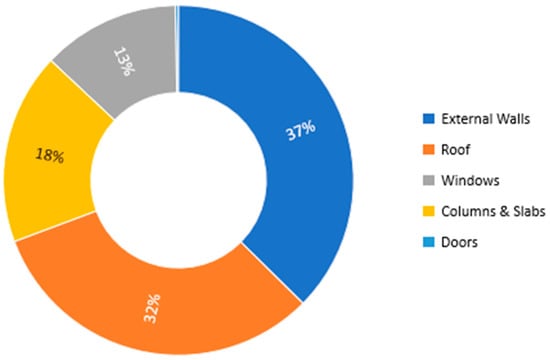
Figure 4.
Comparison of the thermal contribution of the building components of the studied house.
By now, it is clear that neglecting some of the building components in the insulation processes is justified, such as doors and less significant components. However, other components such as roofs and columns and slabs proved to be worthy to be taken into consideration.
This last thought is confirmed when a further comparison is made to show the thermal contribution of each building component after the common practice of only insulating walls and windows is put into place. Figure 5 shows the results of this comparison. Here, the roof became the major contributor to the thermal load, followed closely by columns and slabs, rising from 17.7% to 44.2% of the overall cooling load. This is very important, given the results reported in some surveys that the majority of homes in Riyadh are constructed without any form of roof insulation. Al-Juwair [17] reported that 95% of residential houses considered in his study were not using roof insulation. In other words, 95% of residential buildings lack the insulation of the components that contribute 93.6% of the cooling load.
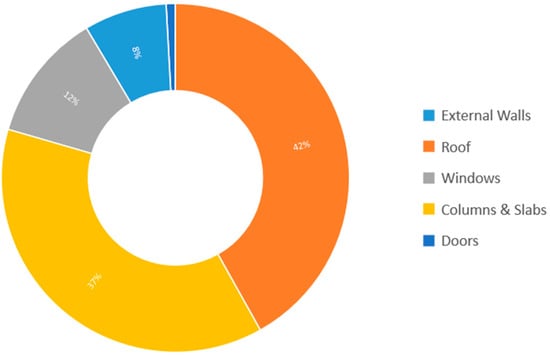
Figure 5.
Comparison of the thermal contribution of the studied house components of a real commonly insulated house in Riyadh, Saudi Arabia.
These important comparative results point to the validation of the hypothesis of this research and encourage us to move forward with challenging the common practices of residential building insulation in Saudi Arabia. It is important to note that for the sake of controlling the limit to which this study goes, components with a relative area of less than one percent of the total exposed area were ignored. These include components such as window frames, door frames, and piping spaces. The decreasing significance of the bigger contributors, i.e., the doors, supports this action.
As for the other practice of insulating the building with the most expensive insulation materials and systems in order to obtain the highest reduction in thermal load and to raise the thermal comfort to its peak, a simple comparison of the walls listed in Appendix A and Figure 6 shows that combination W6, which is a single wall (consisting of 2 cm of cement plaster, 20 cm of cement–polyurethane brick, and 2 cm of cement plaster), is less expensive and has higher thermal resistance than any of the more expensive double walls. This is also represented in Figure 6, where a comparison of the contribution of every wall to the thermal load of the building is presented. The results shown in Figure 6 are compatible with the comparative study of Mujahid et al. [11]. A minimum cooling load of 2219 W is evident for W6, whereas the maximum is 18,190 W in the case of W1. So, a huge reduction in the cooling load (almost eight times with W1) is evident in the case of W6, which consists of layers of 2 cm of cement plaster, 20 cm of cement–polyurethane brick, and 2 cm of cement plaster.
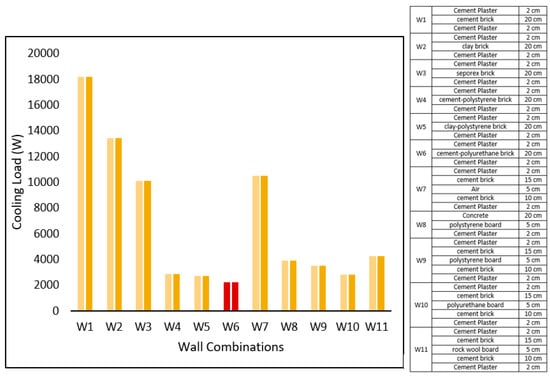
Figure 6.
Comparison of the thermal contribution of the combinations of the different wall materials and wall thermal insulators available in Saudi Arabia.
Figure 7 shows a comparison of the cooling load of various combinations of roofs. It is clear that the combination R3 (which consists of 3 cm of cement and tiles, 5 cm of sand, 7.5 cm of polyurethane board, a water insulation layer, 7.5 cm of concrete, a 20 cm concrete slab, and 2 cm of cement plaster) gives the minimum cooling load of 1.76 kW, whereas R1 gives the maximum cooling load of 15.5 kW. So, again, a reduction of about nine times is evident when roof combination R3 is used instead of R1. Roofs using other types of insulation materials, which are R2 (polystyrene), R4 (perlite), and R5 (rockwool), also perform well compared to non-insulated roofs.
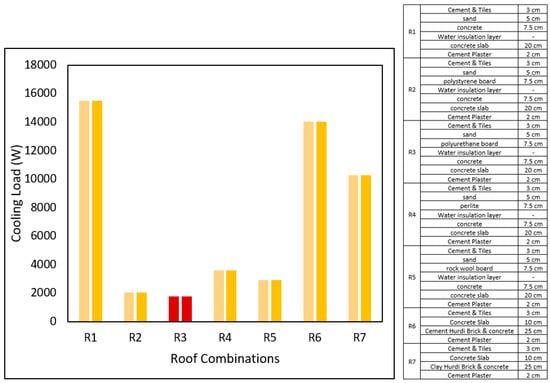
Figure 7.
Comparison of the thermal contribution of the combinations of the different roof materials and roof thermal insulators available in Saudi Arabia.
Figure 8 shows a comparison of the cooling load of various column and slab and window materials. It is clear that the column and slab combination CS2 (which consists of 2 cm of cement plaster, 30 cm of concrete, and 2 cm of cement plaster) gives the minimum cooling load of 7.3 kW. However, this reduction in cooling load (only a 17% reduction compared to CS1) is at the cost of an additional 10 cm concrete layer. Moreover, the window N4 (which consists of a clear reflective double-glazed window) gives the minimum cooling load of 3.6 kW.
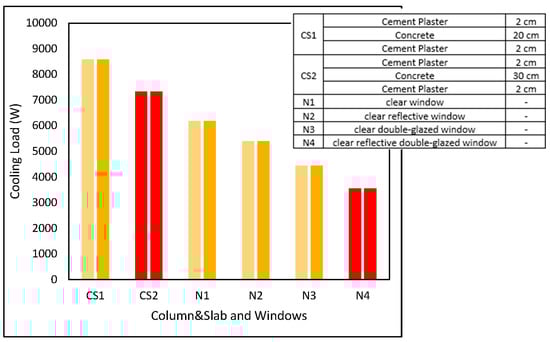
Figure 8.
Comparison of the thermal contribution of column and slab and window materials.
3.2. Cooling Load Estimation of Different Combinations
In this concluding phase of the analysis, the task is to perform complete thermal load calculations of the chosen sample building to compare the overall thermal performance of the building when it is equipped with different combinations of building materials and insulators. Many previous studies reviewed in this paper compared the different combinations of a single component. For example, some works focused on walls, others on windows, and so on. Here, we compare the whole thermal envelope in different combinations of building materials as solved by HAP. Although the previous section proved our point of challenging the common practices, in this section, a thorough comparison of the whole building with different combinations of all of the building components matched together is performed. This aim is to first prove practically the flaws of the common practices and second to pave the road for a new practice and procedure to search for an optimum selection of building materials and thermal insulators. The cooling load estimation includes the following steps:
- The overall cooling load is calculated for the building in its plain form, i.e., without any form of thermal insulation.
- The overall cooling load is calculated for the building with common insulation, i.e., with only walls and windows insulated with the common form of insulation.
- The overall cooling load is calculated for the building heavily insulated with the most expensive insulation available in the local construction market.
- A wide range of cooling load calculations are performed by matching the various combinations of all building components in search of an optimized selection of building combinations (building materials and their insulators) and an optimum match of the combinations of the different components.
The results of these four steps single out an optimum scenario of building combinations that provide the maximum insulation effect with construction costs lower than the most expensive choice in step 3.
Table 3 shows the combination matching of each of the steps above. In step 4, a full optimization procedure was performed to find the optimum scenario of building combinations among 1120 practical matching possibilities. These practical possibilities were elected among 2464 matching options where impractical matches were removed. A good example of an impractical (rejected) scenario is matching walls and columns of different thicknesses.
Table 3.
Scenarios of combinations for each of the four steps of the final phase.
Extensive calculations were performed to determine the cooling load of each scenario of building combination shown in Table 3 for 1120 possibilities. Figure 9 shows the consolidated results of these efforts.
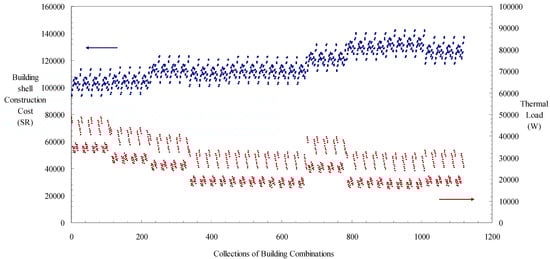
Figure 9.
Building-shell construction cost and calculated thermal load for every practical scenario of building combinations from (1 SR = 3.75 USD).
Because the doors’ significance is low, and for the sake of simplicity, we focus in Figure 10 on one-quarter of the results (255 possibilities) by showing only the results of the scenarios that include door D3 only. The figure was also rearranged to show the scenarios as their construction costs become higher. This figure sums up what this research is all about. The rightmost point refers to the scenario of the building combinations that has the most expensive insulation. Its cost comes at the top of the construction costs line, and its corresponding cooling load is shown with the same point shape and color. The orange-colored line that passes through the point of the cooling load of this scenario differentiates between those scenarios that perform better than the most expensive choice (points below the orange line) and those that perform worse (above the line). It is clear that there are many choices other than the most expensive one that perform much better with lower construction costs. We can say that we have found one scenario with the optimized selection of building materials and their insulation materials that provide the most effective insulation and cost less. Although, the word optimized seems to have a broader range than we expected; for example, one can incur a much lower cost for just a small increase in the cooling load.
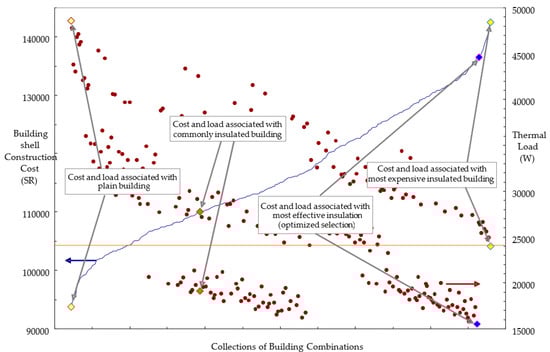
Figure 10.
Building-shell construction cost and calculated thermal load for the selected scenario of building combinations (doors are of type D3 and 1 SR = 3.75 USD).
Figure 11 is the comparison of cooling load and cost of the plain, commonly insulated, optimized, and most-expensive insulated buildings. It is clear that the less-common practice of using the most expensive insulators available in the local construction market is not justified. An educated selection of building materials and insulators leads to a better-insulated building with lower construction costs.
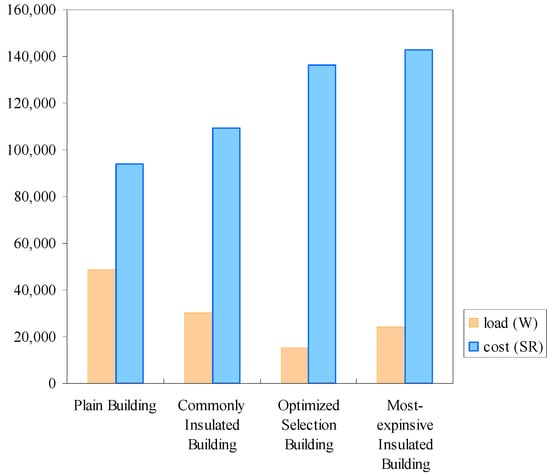
Figure 11.
Comparison of cooling load and cost of the plain, commonly insulated, optimized, and most-expensive insulated buildings (1 SR = 3.75 USD).
4. Conclusions
Based on the theory considered in this study, there may be an ideal choice of insulators for building components that result in the lowest energy consumption and the greatest possible savings in installation costs in addition to energy expenditure. Different locally available building materials and insulators were surveyed and investigated in this research. Using the HAP software program, the required air-conditioning loads were calculated for 1022 different configurations. The following are the main conclusions:
The roof is the major contributor to the thermal load, followed closely by columns and slabs, rising from 17.7% to 44.2% of the overall cooling load. In total, 95% of the residential buildings in Saudi Arabia lack the insulation of the components that contribute 93.6% of the cooling load. Those components are the roof and columns and slabs. It was also found that combination W6, which is a single wall (consisting of 2 cm of cement plaster, 20 cm of cement–polyurethane brick, and 2 cm of cement plaster), is less expensive and has higher thermal resistance than any of the more expensive double walls. The study also revealed that there are many choices other than the most expensive one that perform much better with lower construction costs. One scenario was found in this study with the optimized selection of building materials and their insulation materials that provide the most effective insulation at the lowest cost.
Author Contributions
Conceptualization, A.A.-A. and M.A.-M.; Methodology, A.A.-A. and A.E.-L.; Software, M.A.-M.; Validation, S.N.D.; Formal analysis, S.N.D.; Investigation, A.A.-A. and M.A.-M.; Resources, A.A.-A. and A.E.-L.; Data curation, A.A.-A., M.A.-M. and S.N.D.; Writing—original draft, A.A.-A. and S.N.D.; Writing—review & editing, S.N.D.; Project administration, A.E.-L.; Funding acquisition, A.E.-L. All authors have read and agreed to the published version of the manuscript.
Funding
This research was funded by the Deputyship for Research and Innovation, “Ministry of Education”, in Saudi Arabia through project no. (IFKSURG-2-1403).
Institutional Review Board Statement
Not applicable.
Informed Consent Statement
Not applicable.
Data Availability Statement
Not applicable.
Acknowledgments
The authors extend their appreciation to the Deputyship for Research and Innovation, “Ministry of Education”, in Saudi Arabia for funding this research work through project no. (IFKSURG-2-1403).
Conflicts of Interest
The authors declare no conflict of interest.
Appendix A
Table A1.
Physical and thermal properties and collective costs of components—insulation combinations (1 SR = 3.75 USD).
Table A1.
Physical and thermal properties and collective costs of components—insulation combinations (1 SR = 3.75 USD).
| Building Component | Building Combination | Combination Code | Combination Layers | Layers’ Thickness (cm) | Overall Thickness (cm) | U-Value (W/m²K) | Cost/m2 (SR) |
|---|---|---|---|---|---|---|---|
| Columns and Slabs | CnS 200 | CS1 | Cement plaster | 2 | 24 | 2.847 | 120 |
| Concrete | 20 | ||||||
| Cement plaster | 2 | ||||||
| CnS 300 | CS2 | Cement plaster | 2 | 34 | 2.443 | 180 | |
| Concrete | 30 | ||||||
| Cement plaster | 2 | ||||||
| Doors | Ordinary door | D1 | 1.12 | 200 | |||
| Polystyrene-insulated door | D2 | 0.826 | 220 | ||||
| Polyurethane-insulated door | D3 | 0.575 | 232 | ||||
| Injected-insulation door | D4 | 1.02 | 210 | ||||
| Roof | Roof 1, reinforced concrete | R1 | Cement and tiles | 3 | 37.5 | 2.216 | 227 |
| Sand | 5 | ||||||
| Concrete | 7.5 | ||||||
| Water insulation layer | - | ||||||
| Concrete slab | 20 | ||||||
| Cement plaster | 2 | ||||||
| Roof 2, polystyrene–concrete | R2 | Cement and tiles | 3 | 45 | 0.31 | 263.5 | |
| Sand | 5 | ||||||
| Polystyrene board | 7.5 | ||||||
| Water insulation layer | - | ||||||
| Concrete | 7.5 | ||||||
| Concrete slab | 20 | ||||||
| Cement plaster | 2 | ||||||
| Roof 3, polyurethane–concrete | R3 | Cement and tiles | 3 | 45 | 0.269 | 272.5 | |
| Sand | 5 | ||||||
| Polyurethane board | 7.5 | ||||||
| Water insulation layer | - | ||||||
| Concrete | 7.5 | ||||||
| Concrete slab | 20 | ||||||
| Cement plaster | 2 | ||||||
| Roof 4, perlite–concrete | R4 | Cement and tiles | 3 | 45 | 0.543 | 269 | |
| Sand | 5 | ||||||
| Perlite | 7.5 | ||||||
| Water insulation layer | - | ||||||
| Concrete | 7.5 | ||||||
| Concrete slab | 20 | ||||||
| Cement plaster | 2 | ||||||
| Roof 5, rockwool–concrete | R5 | Cement and tiles | 3 | 45 | 0.447 | 255.5 | |
| Sand | 5 | ||||||
| Rockwool board | 7.5 | ||||||
| Water insulation layer | - | ||||||
| Concrete | 7.5 | ||||||
| Concrete slab | 20 | ||||||
| Cement plaster | 2 | ||||||
| Roof 6, cement Hordi | R6 | Cement and tiles | 3 | 40 | 1.915 | 247.5 | |
| Concrete slab | 10 | ||||||
| Cement Hordi Brick and concrete | 25 | ||||||
| Cement plaster | 2 | ||||||
| Roof 7, clay Hordi | R7 | Cement and tiles | 3 | 40 | 1.412 | 303 | |
| Concrete slab | 10 | ||||||
| Clay Hordi brick and concrete | 25 | ||||||
| Cement plaster | 2 | ||||||
| Walls | Single wall 1, cement bricks | W1 | Cement plaster | 2 | 24 | 2.34 | 79.5 |
| Cement brick | 20 | ||||||
| Cement plaster | 2 | ||||||
| Single wall 2, clay bricks | W2 | Cement plaster | 2 | 24 | 1.75 | 83.5 | |
| clay brick | 20 | ||||||
| Cement plaster | 2 | ||||||
| Single wall 4, Siporex bricks | W3 | Cement plaster | 2 | 24 | 1.321 | 108 | |
| Siporex brick | 20 | ||||||
| Cement plaster | 2 | ||||||
| Single wall 5, polystyrene–cement bricks | W4 | Cement plaster | 2 | 24 | 0.398 | 101 | |
| Cement–polystyrene brick | 20 | ||||||
| Cement plaster | 2 | ||||||
| Single wall 6, polystyrene–clay bricks | W5 | Cement plaster | 2 | 24 | 0.38 | 107 | |
| Clay–polystyrene brick | 20 | ||||||
| Cement plaster | 2 | ||||||
| Single wall 7 polyurethane-cement bricks | W6 | Cement plaster | 2 | 24 | 0.308 | 106 | |
| Cement–polyurethane brick | 20 | ||||||
| Cement plaster | 2 | ||||||
| Double wall 1, air between cement bricks | W7 | Cement plaster | 2 | 34 | 1.482 | 110 | |
| Cement brick | 15 | ||||||
| Air | 5 | ||||||
| Cement brick | 10 | ||||||
| Cement plaster | 2 | ||||||
| Double wall 2, concrete and polystyrene | W8 | Concrete | 20 | 27 | 0.53 | 158 | |
| Polystyrene board | 5 | ||||||
| Cement plaster | 2 | ||||||
| Double wall 3, polystyrene between cement bricks | W9 | Cement plaster | 2 | 34 | 0.481 | 135 | |
| Cement brick | 15 | ||||||
| Polystyrene board | 5 | ||||||
| Cement brick | 10 | ||||||
| Cement plaster | 2 | ||||||
| Double wall 4, polyurethane between cement bricks | W10 | Cement plaster | 2 | 34 | 0.385 | 141.5 | |
| cement brick | 15 | ||||||
| Polyurethane board | 5 | ||||||
| Cement brick | 10 | ||||||
| Cement plaster | 2 | ||||||
| Double wall 5, rockwool between cement bricks | W11 | Cement plaster | 2 | 34 | 0.587 | 126 | |
| Cement brick | 15 | ||||||
| Rockwool board | 5 | ||||||
| Cement brick | 10 | ||||||
| Cement plaster | 2 | ||||||
| Windows | Clear window | N1 | 6.884 | 180 | |||
| Clear reflective window | N2 | 6.884 | 220 | ||||
| Clear double-glazed window | N3 | 350 | |||||
| Clear reflective double-glazed window | N4 | 380 | |||||
References
- The Research Institute. Testing of El-Maimani Red Clay Bricks to Determine Thermal Characteristics; King Fahd University of Petroleum and Minerals, Prepared for El-Maimani Red Bricks and Clay; King Fahd University of Petroleum and Minerals: Dhahran, Saudi Arabia, 1989. [Google Scholar]
- The Research Institute. Simulation of Energy and Cost Effectiveness Studies for Residential Buildings Built from Clay Brick; King Fahd University of Petroleum and Minerals, Prepared for the Committee of Clay Brick Producers in Saudi Arabia; King Fahd University of Petroleum and Minerals: Dhahran, Saudi Arabia, 1991. [Google Scholar]
- Almazroui, M. Changes in Temperature Trends and Extremes over Saudi Arabia for the Period 1978–2019. Adv. Meteorol. 2020, 2020, 8828421. [Google Scholar] [CrossRef]
- Thangarasu, A.; Henderson, J.H. Thermal and Structural Behaviour of Sandwiched Reinforced Cement Concrete Wall Panels. Mater. Sci. 2022, 28, 4. [Google Scholar] [CrossRef]
- Bolattürk, A. Determination of optimum insulation thickness for building walls with respect to various fuels and climate zones in Turkey. Appl. Therm. Eng. 2006, 26, 1301–1309, ISSN 1359-4311. [Google Scholar] [CrossRef]
- Kim, Y.J.; Allard, A. Thermal response of precast concrete sandwich walls with various steel connectors for architectural buildings in cold regions. Energy Build. 2014, 80, 137–148, ISSN 0378-7788. [Google Scholar] [CrossRef]
- Ucar, A.; Balo, F. Effect of fuel type on the optimum thickness of selected insulation materials for the four different climatic regions of Turkey. Appl. Energy 2009, 86, 730–736, ISSN 0306-2619. [Google Scholar] [CrossRef]
- Ahmad, S. Energy Saving through Thermal Insulation in Buildings. Hous. Sci. 1983, 7, 297. [Google Scholar]
- Ferieg, S.; Younis, M. Effect of Energy Conservation Measures in the Life Cycle Cost of Kuwaiti Residential Buildings. Energy Build. 1985, 8, 71. [Google Scholar] [CrossRef]
- Said, A.; Abdelrahman, M.; Racz, G. Economics of Thermal Insulation in the Eastern Province of Saudi Arabia. ASHRAE Trans. 1989, 96 Pt 1, 83–90. [Google Scholar]
- Mujahid, A.; Zedan, M. Comparison of Thermal Performance of Methods of Insulation in Buildings. Al-Mohandis 1996, 9, 3. [Google Scholar]
- Tewfik, K.M. Evaluating the Effect of Design and Construction Deficiencies on the Economic Performance of Wall Thermal Insulation Systems. Ph.D. Thesis, The University of Michigan, Ann Arbor, MI, USA, 1993. [Google Scholar]
- SCECO-Eastern Province. Insulating Glass and Its Effect in Conservation of Electricity Consumption. Arabic Booklet. Available online: https://www.se.com.sa/ar-sa/MarketingPrintMaterial/NewID/%D8%A7%D9%84%D8%AF%D9%84%D9%8A%D9%84%20%D8%A7%D9%84%D8%A7%D9%95%D8%B1%D8%B4%D8%A7%D8%AF%D9%8A%20%D9%84%D8%A7%D9%94%D9%86%D8%B8%D9%85%D8%A9%20%D9%88%D9%85%D9%88%D8%A7%D8%AF%20%D8%A7%D9%84%D8%B9%D8%B2%D9%84%20%D8%A7%D9%84%D8%AD%D8%B1%D8%A7%D8%B1%D9%8A.pdf (accessed on 20 March 2023).
- Samen, V.E.L.K.; Nemaleu, J.G.D.; Kaze, R.C.; Kammogne, F.D.; Meukam, P.; Kamseu, E.; Leonelli, C. A Low Thermal Conductivity of Lightweight Laterite-cement Composites with Cotton Wastes Fibres. Silicon 2022, 14, 8205–8222. [Google Scholar] [CrossRef]
- Lamrani Alaoui, A.; Amrani, A.; Alami Merrouni, A.; Daoudia, A.; El Hassouani, Y. Optimization of thermal efficiency in traditional clay-based buildings in hot–dry locations. Case study: The south-eastern region of Morocco. Int. J. Energy Environ. Eng. 2022, 13, 499–514. [Google Scholar] [CrossRef]
- Available online: https://www.carrier.com/commercial/en/us/software/hvac-system-design/hourly-analysis-program/ (accessed on 20 January 2023).
- The Research Institute. Simulation of Energy and Cost Effectiveness Studies for Residential Buildings Built from Clay Brick versus Other Masonry Construction, Final Report; King Fahd University of Petroleum and Minerals, Prepared for Committee of Clay Brick Producers in Saudi Arabia; King Fahd University of Petroleum and Minerals: Dhahran, Saudi Arabia, 1990. [Google Scholar]
Disclaimer/Publisher’s Note: The statements, opinions and data contained in all publications are solely those of the individual author(s) and contributor(s) and not of MDPI and/or the editor(s). MDPI and/or the editor(s) disclaim responsibility for any injury to people or property resulting from any ideas, methods, instructions or products referred to in the content. |
© 2023 by the authors. Licensee MDPI, Basel, Switzerland. This article is an open access article distributed under the terms and conditions of the Creative Commons Attribution (CC BY) license (https://creativecommons.org/licenses/by/4.0/).