
Research on Driving Factors of Forest Ecological Security: Evidence from 12 Provincial Administrative Regions in Western China


Abstract
1. Introduction
2. Methods
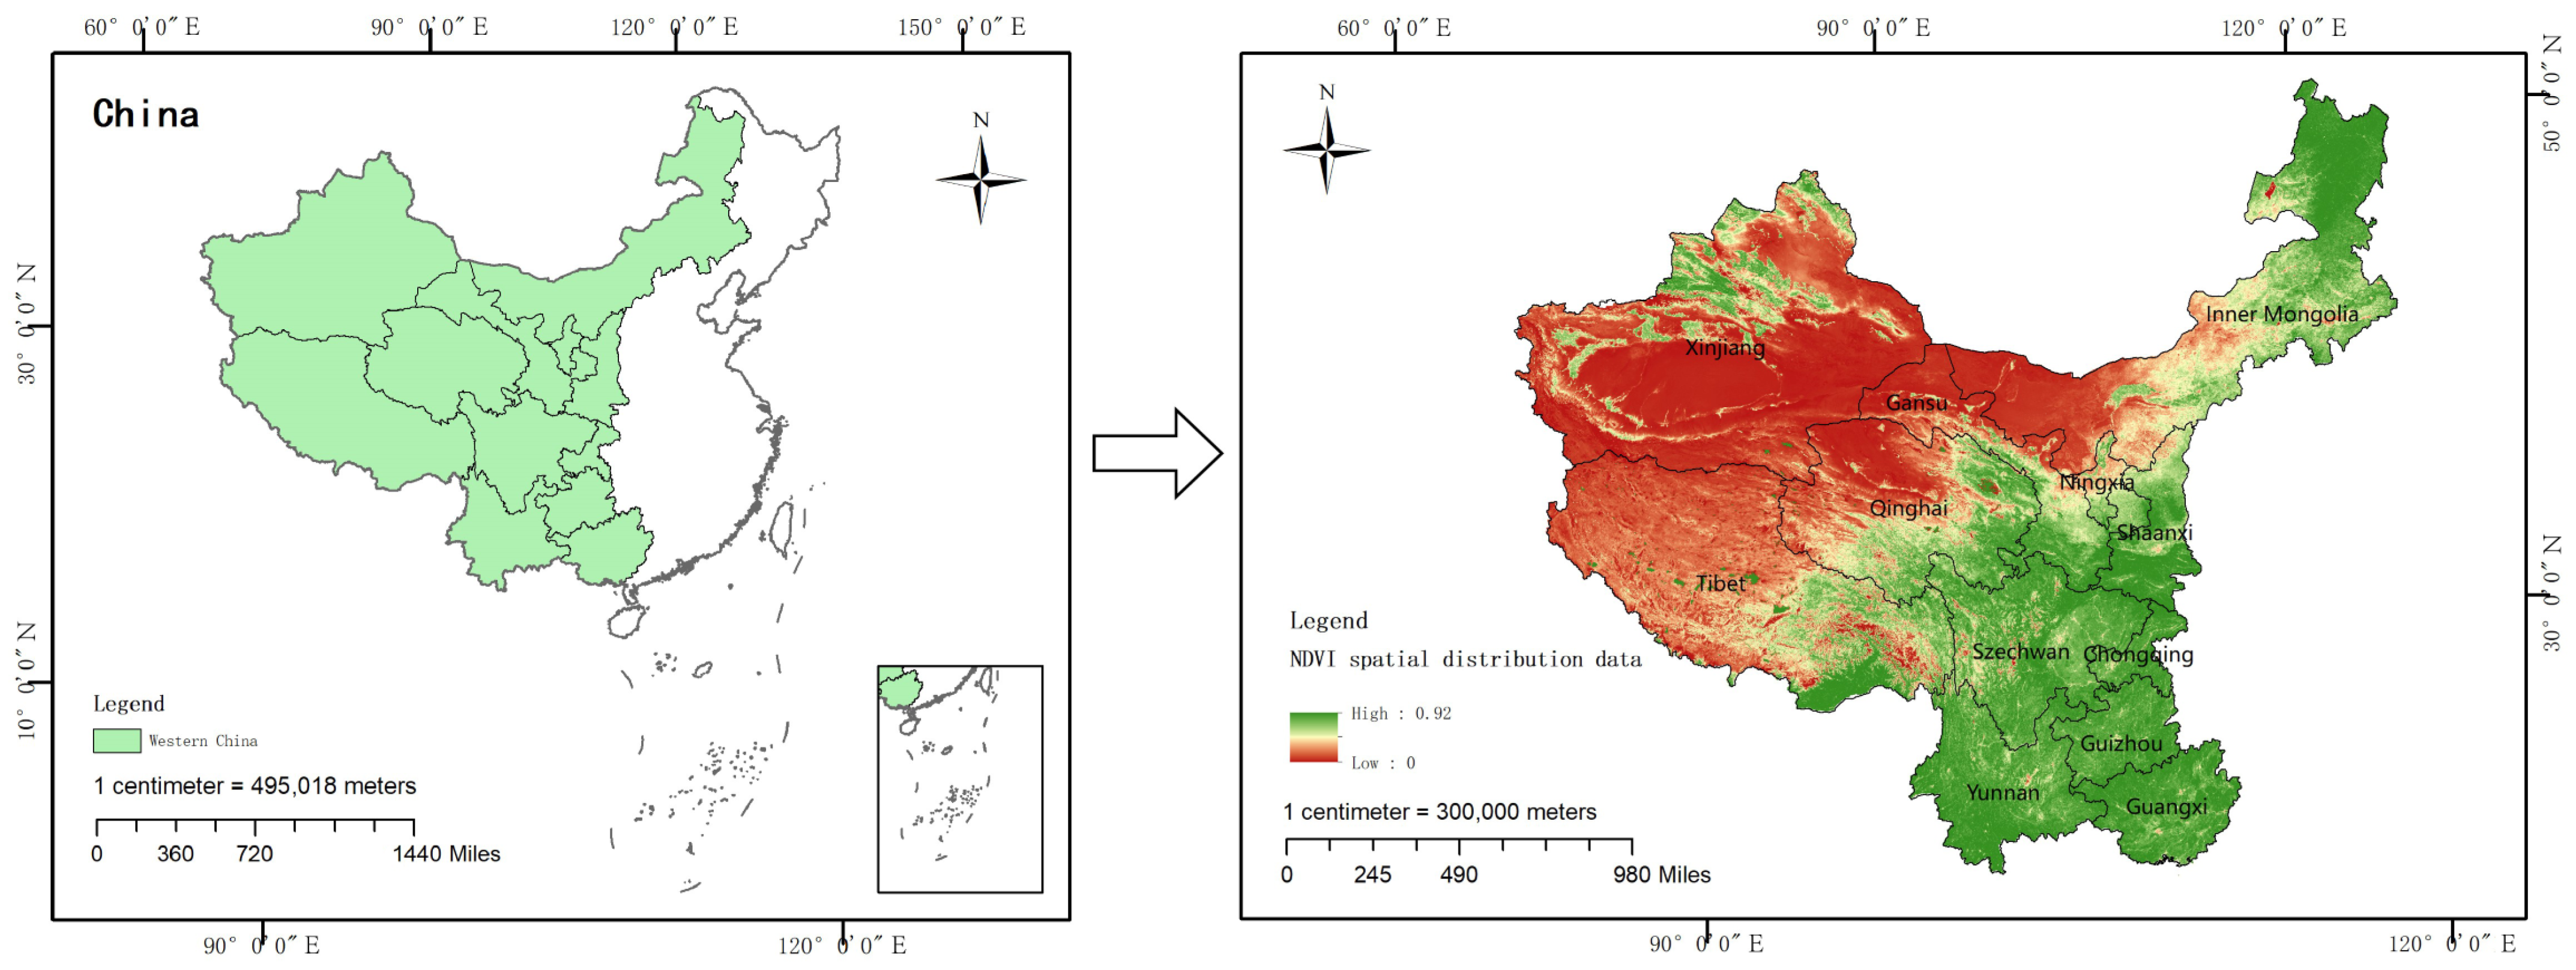
2.1. Western China
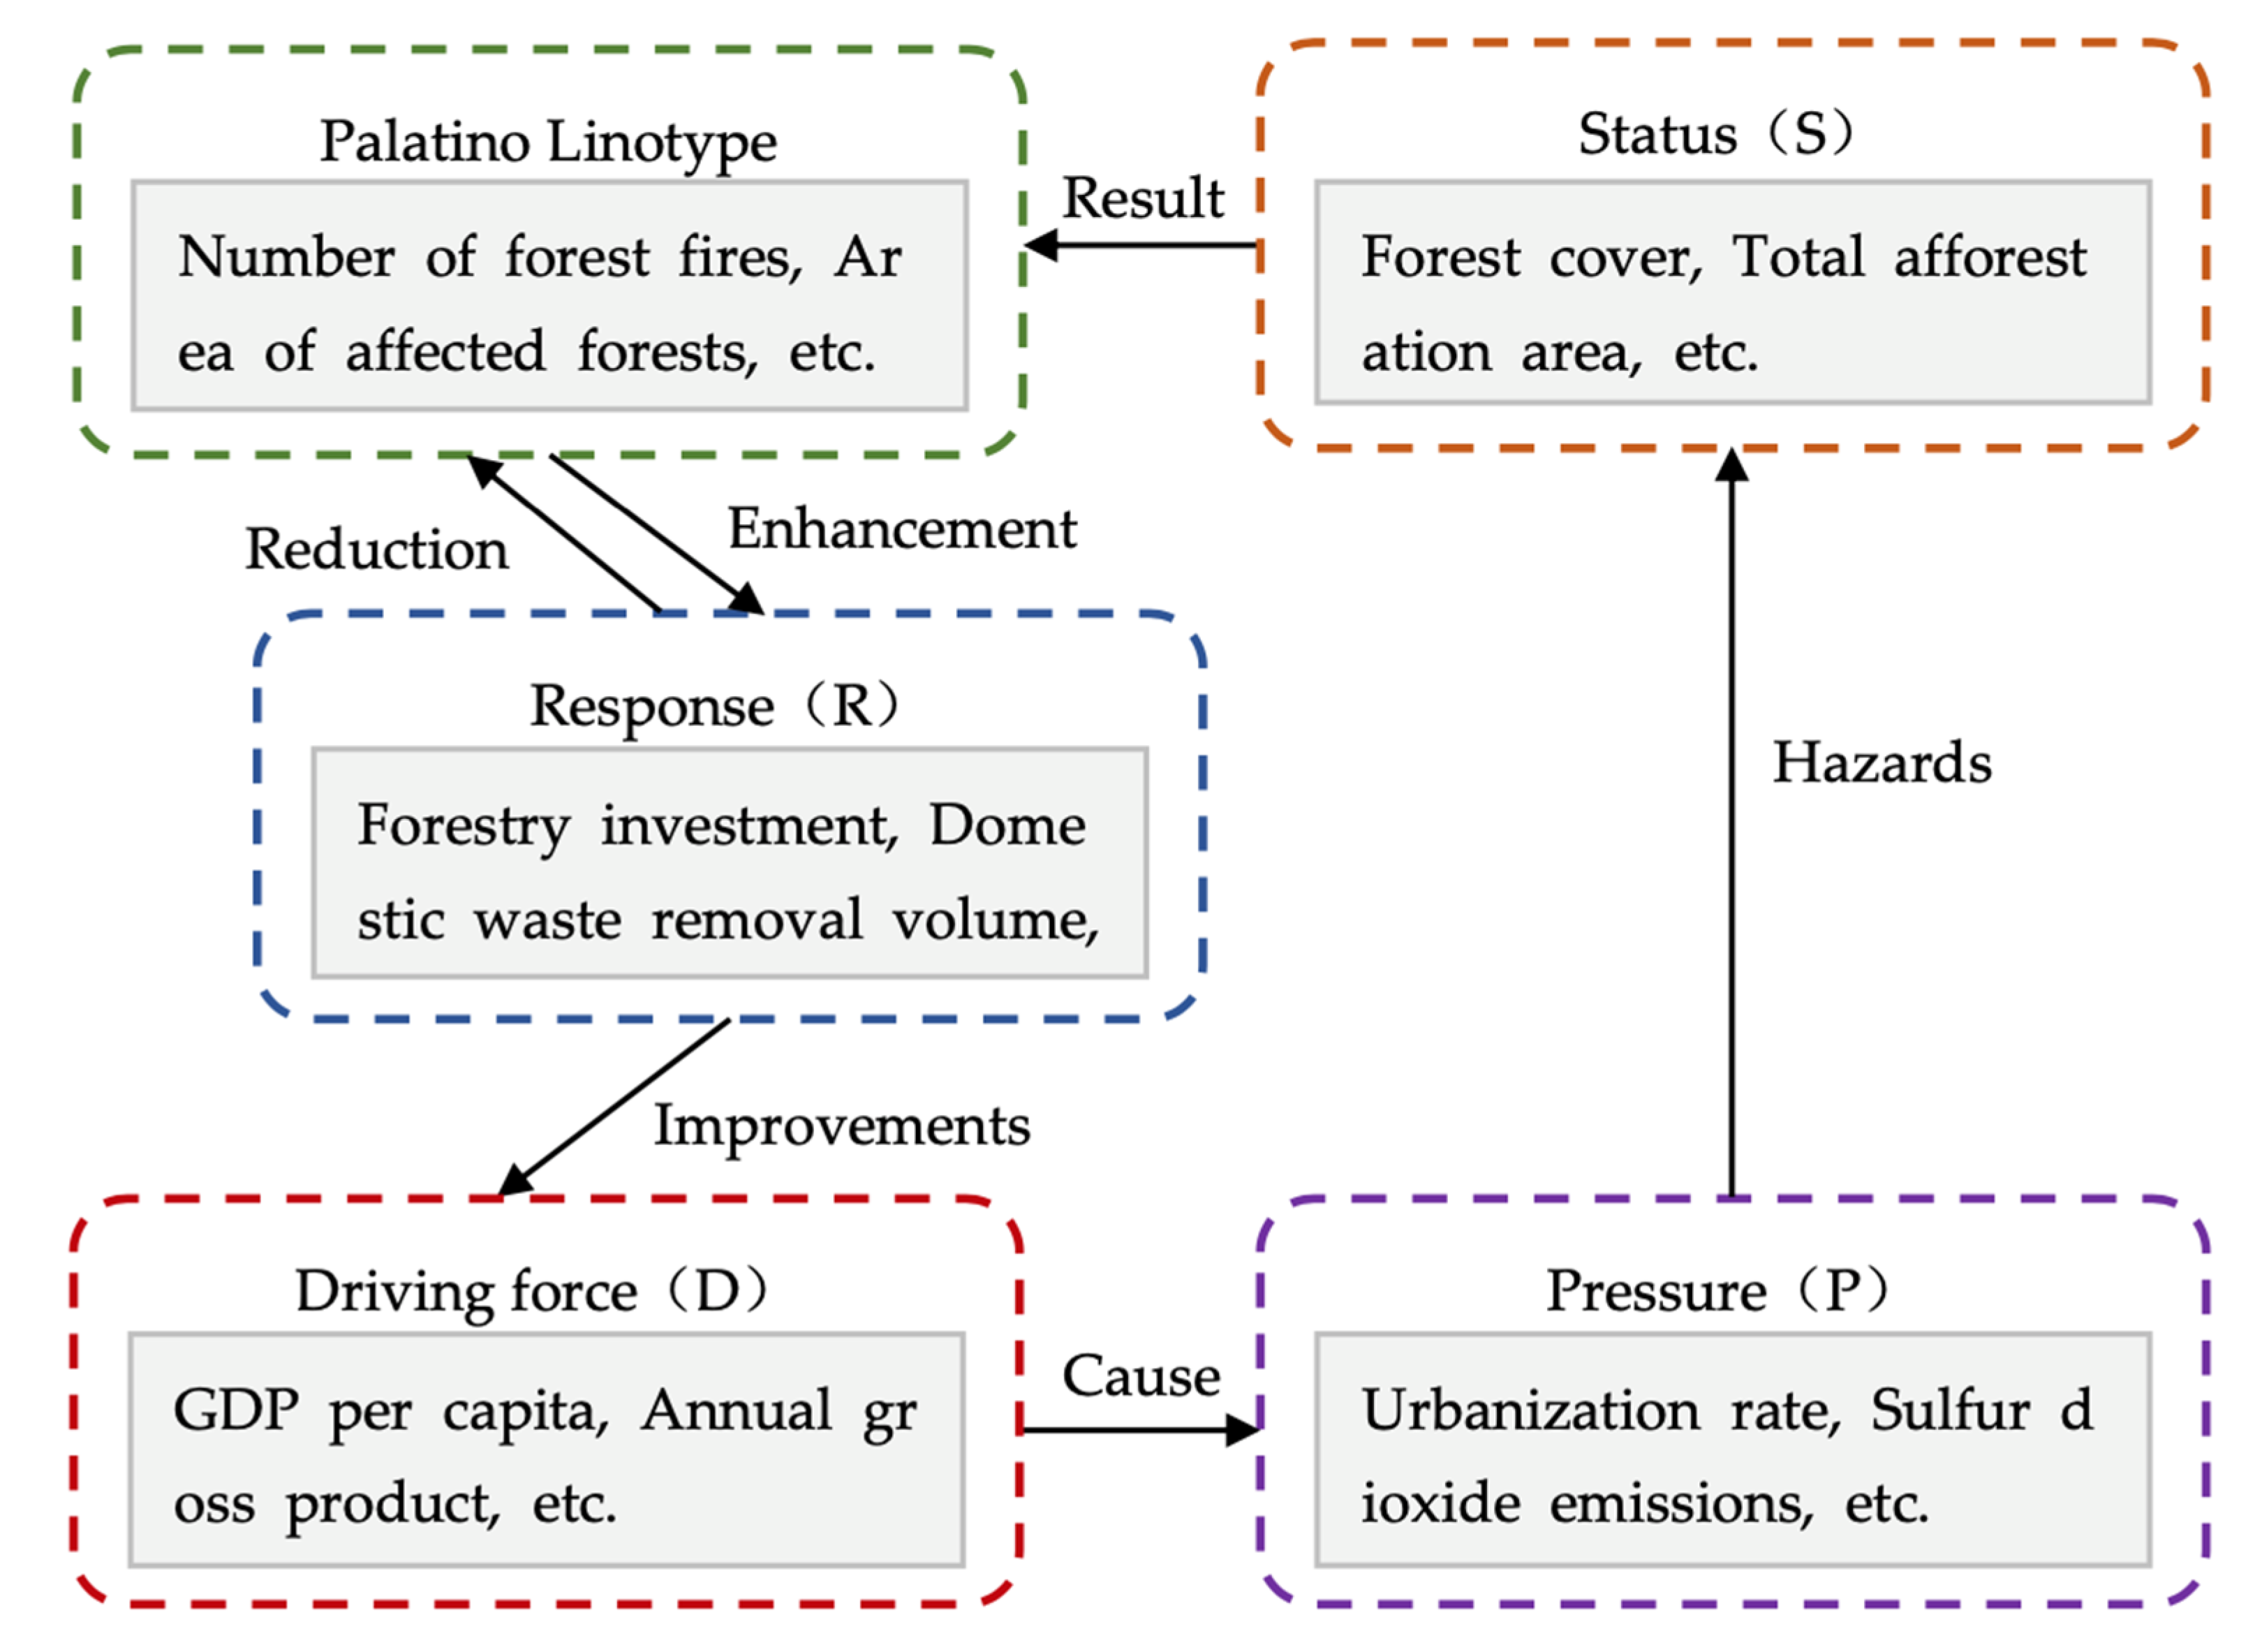
2.2. Research Methodology
3. Evaluation Index System Construction and Data Calculation
3.1. Indicator System Construction
3.2. Data Source
4. Results
4.1. Cross-sectional Comparison between Different Regions
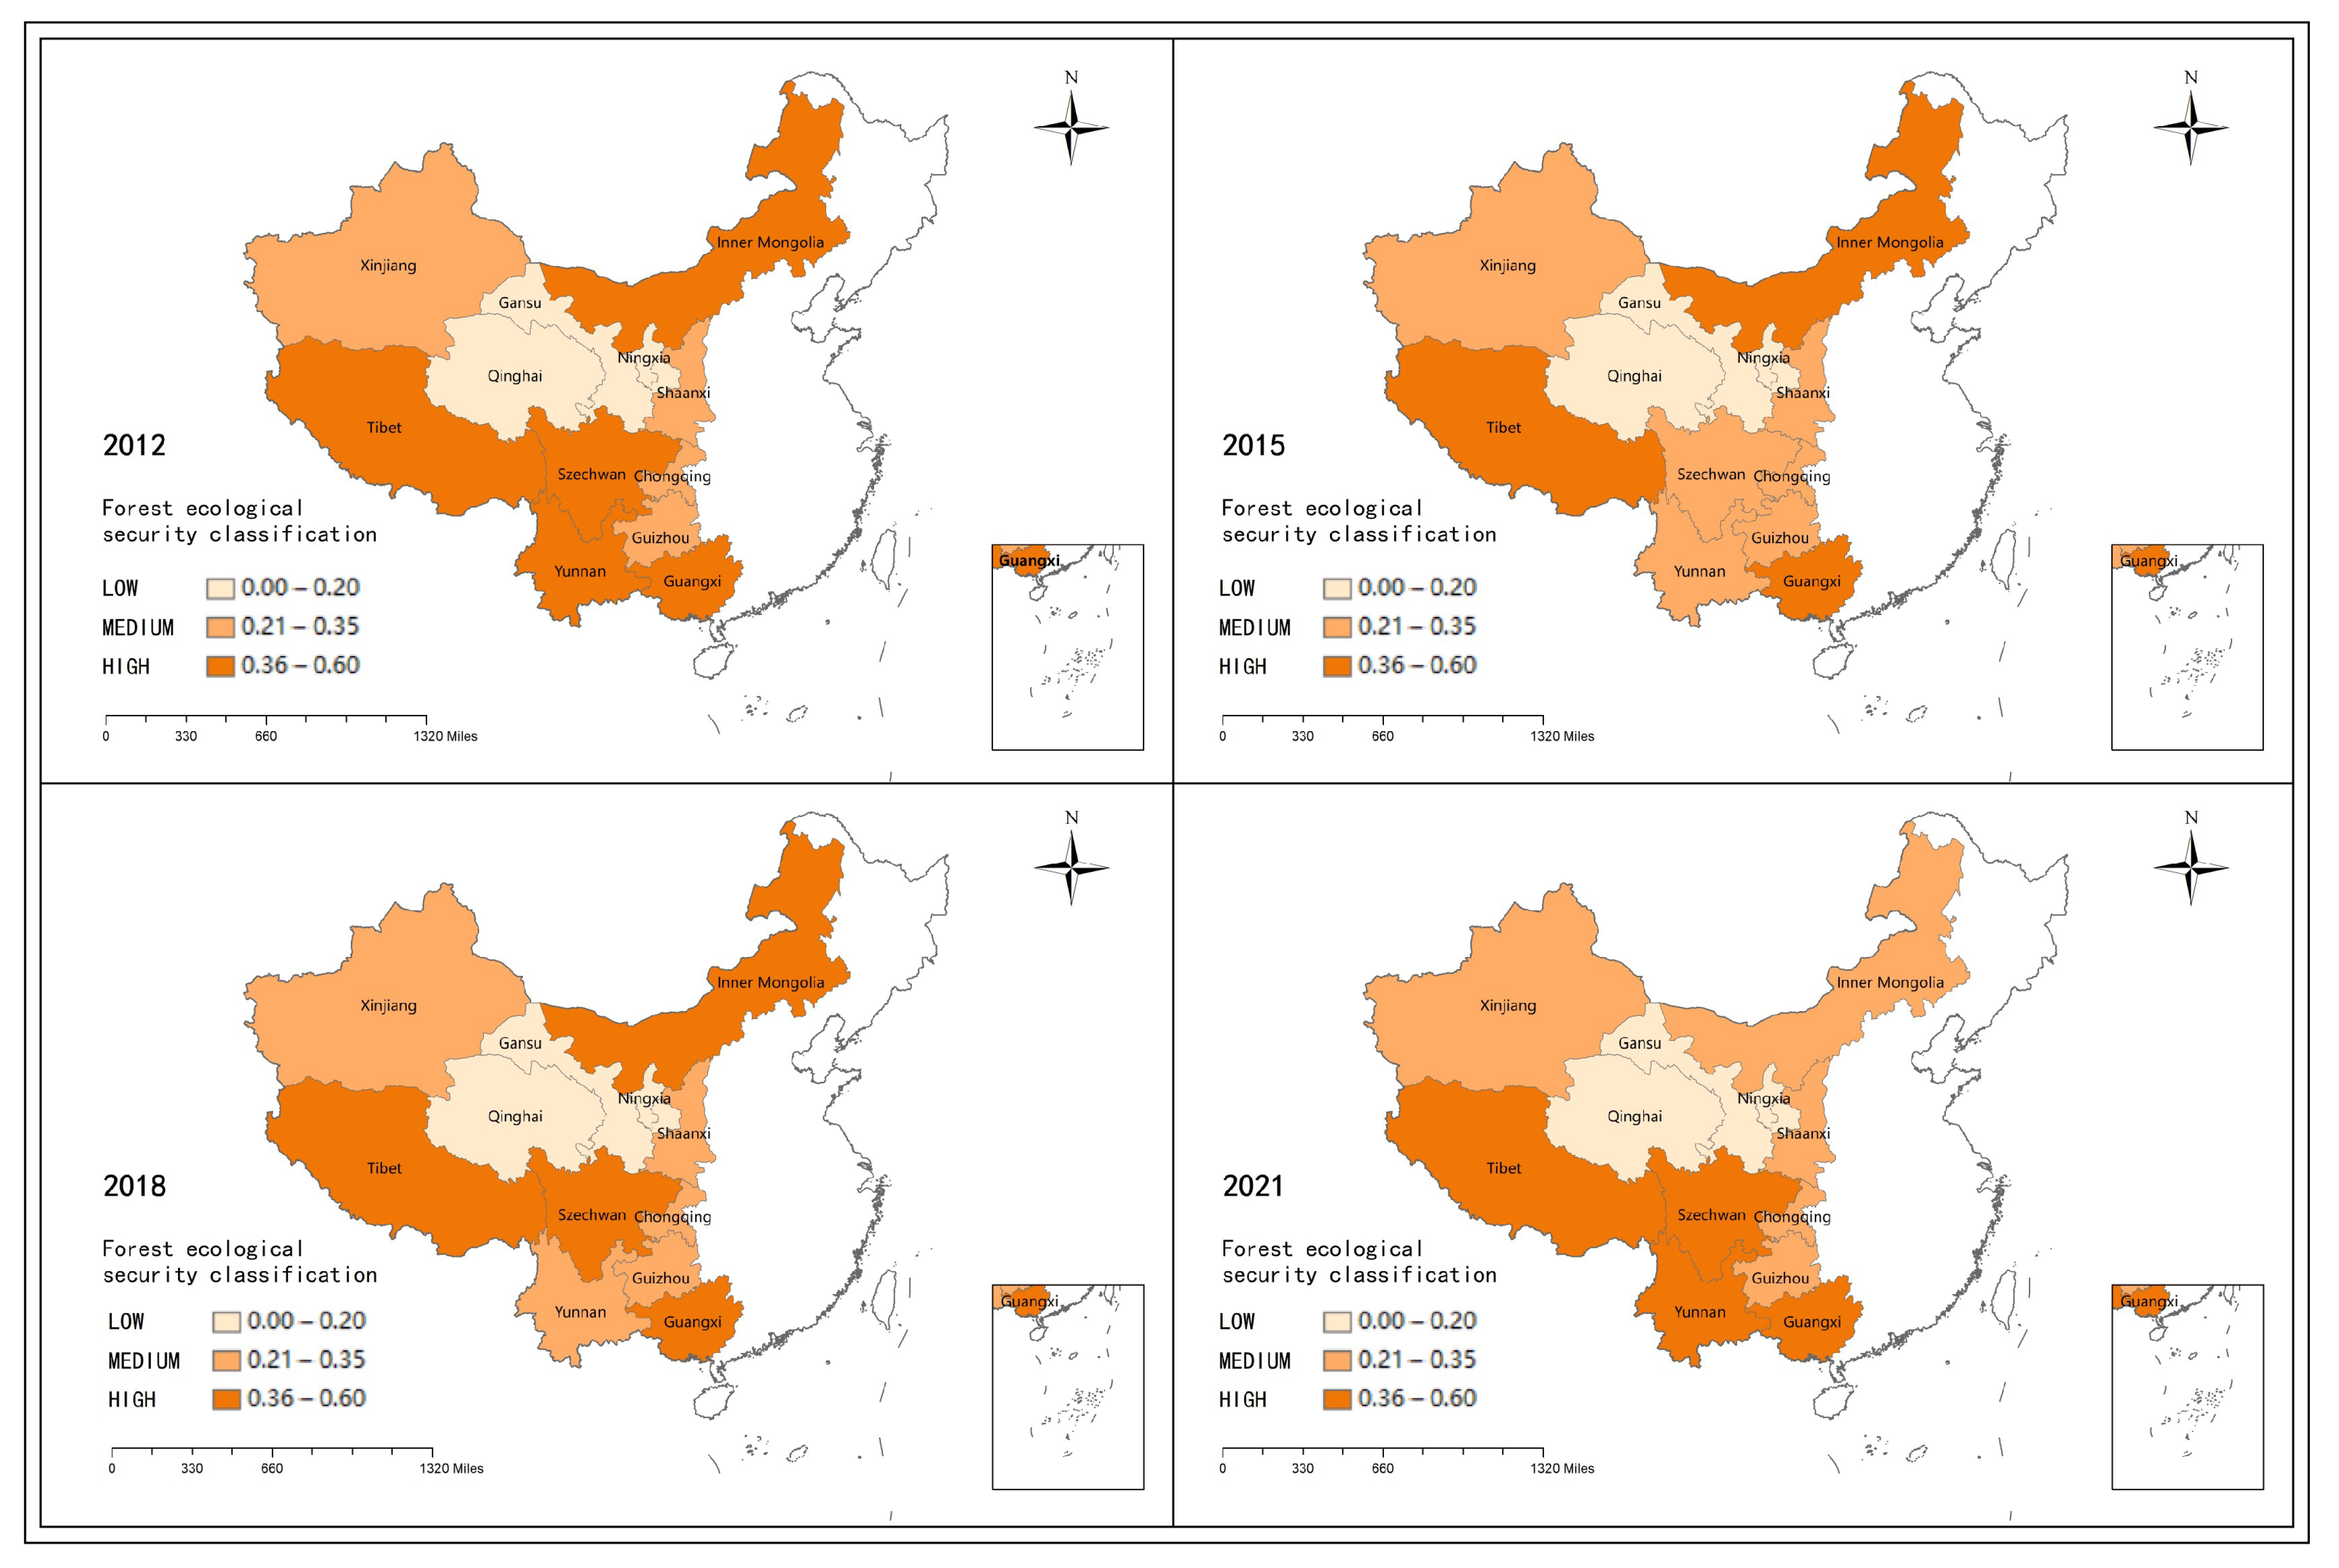
4.2. Longitudinal Comparison between Different Years
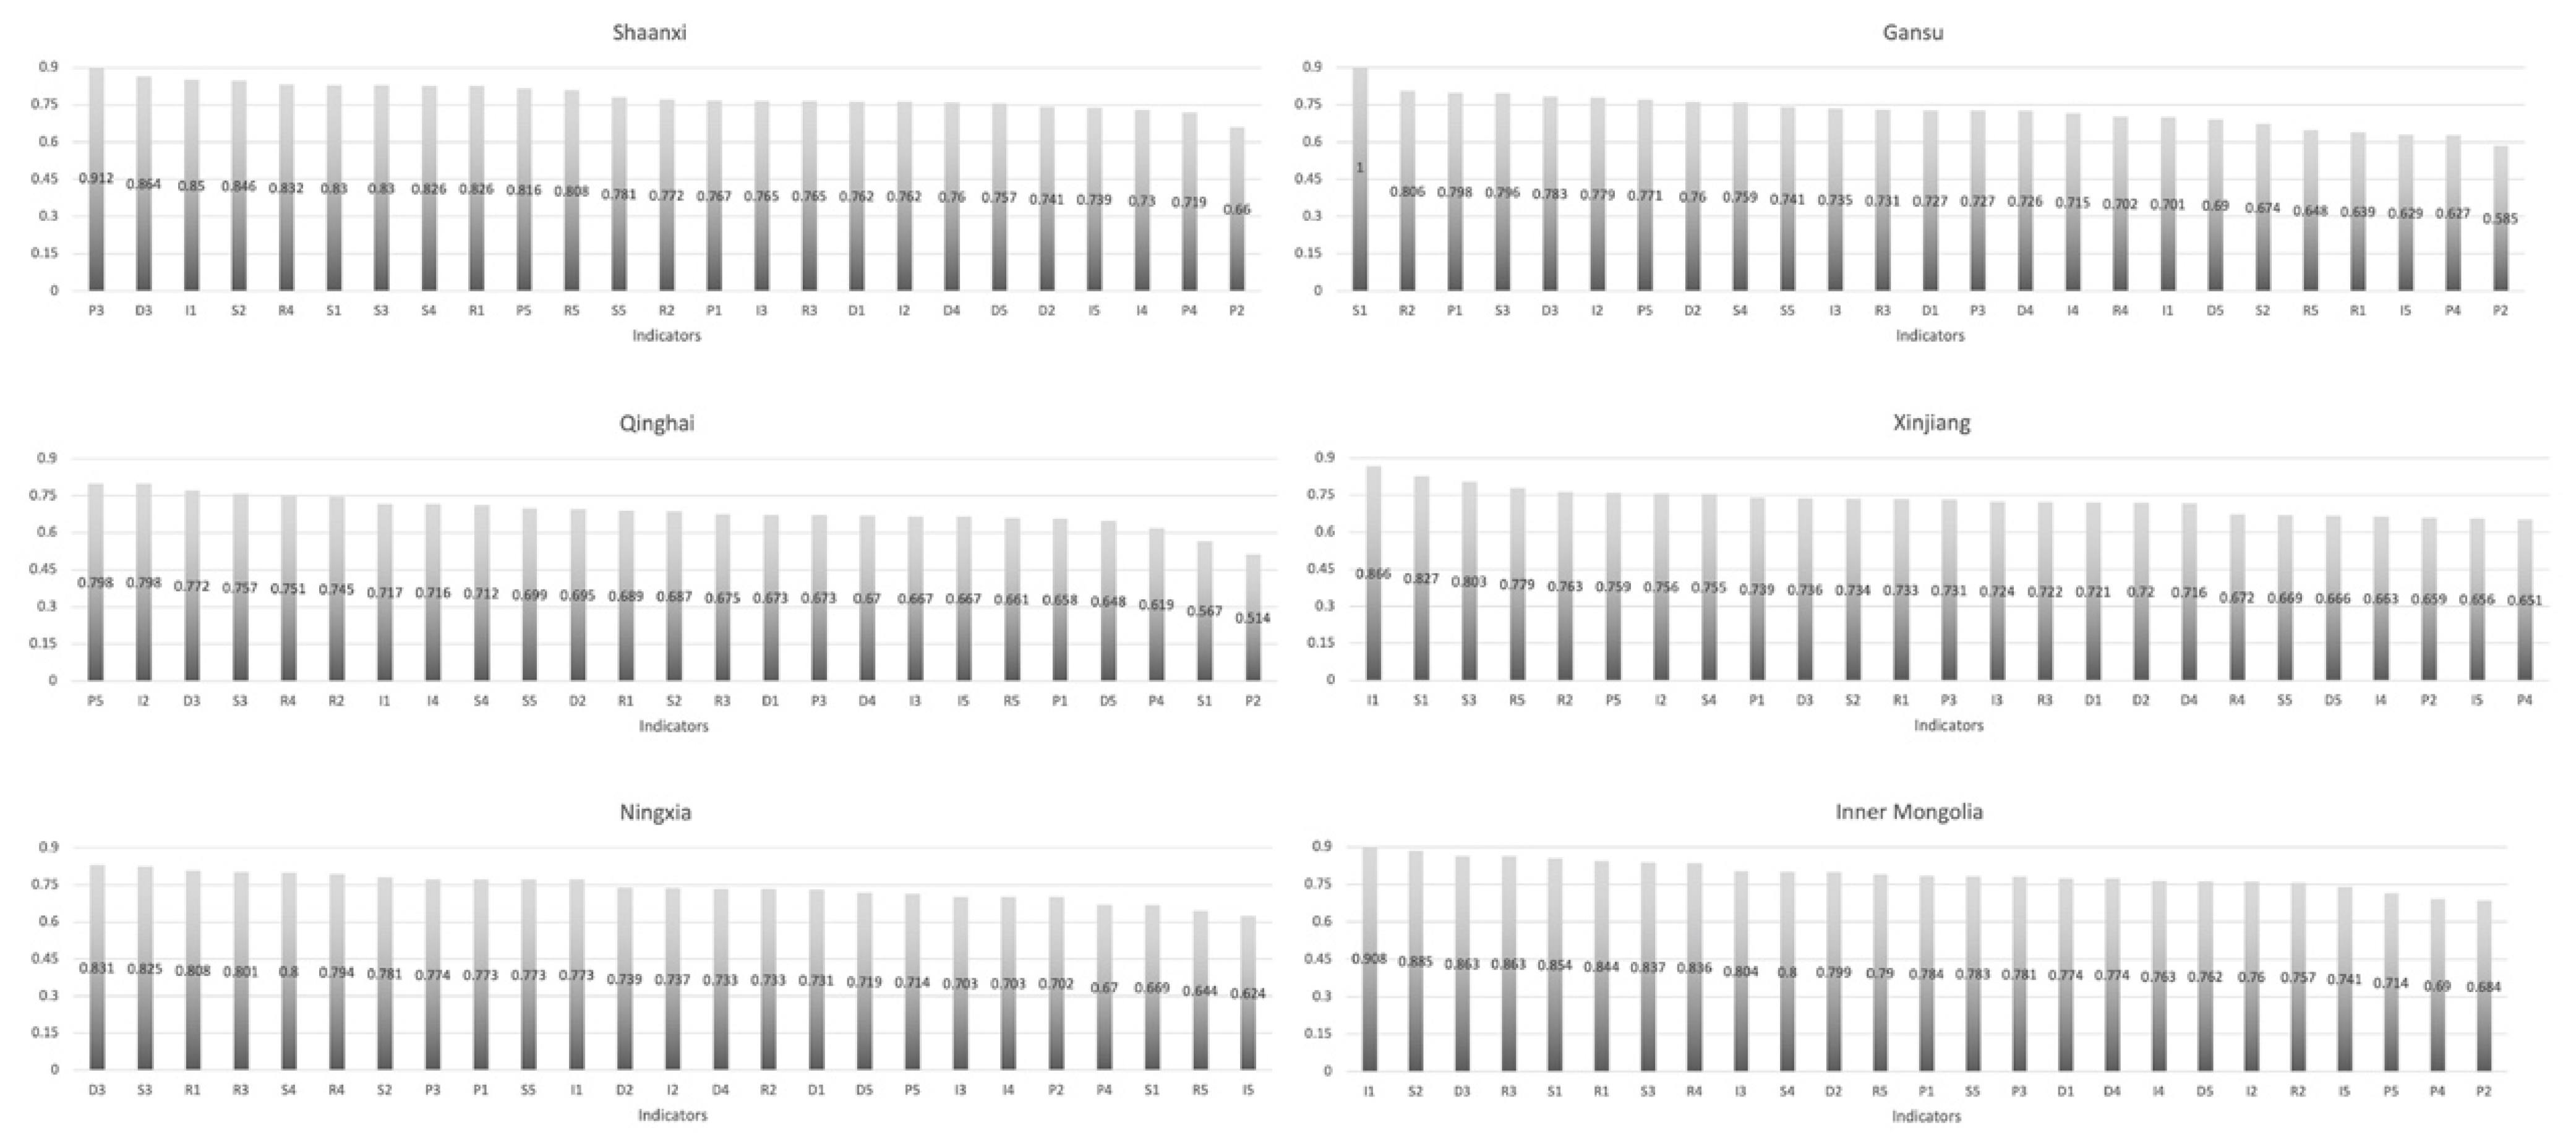
4.3. Relative Comparison of Different Indicators in the Same Region
4.4. Type Analysis of Different Regions
4.5. Evolutionary Features of Western China
5. Discussion
6. Conclusions
Author Contributions
Funding
Institutional Review Board Statement
Informed Consent Statement
Data Availability Statement
Conflicts of Interest
Appendix


References
- Owubah, C.E.; Le Master, D.C.; Bowker, J.M.; Lee, J.G. Forest Tenure Systems and Sustainable Forest Management: The Case of Ghana. For. Ecol. Manage. 2001, 149, 253–264. [Google Scholar] [CrossRef]
- Wu, F.; Gu, M.; Zhu, C.; Qu, Y. Temporal-Spatial Evolution and Trend Prediction of the Supply Efficiency of Primary Medical Health Service—An Empirical Study Based on Central and Western Regions of China. Int. J. Environ. Res. Public Health 2023, 20, 1664. [Google Scholar] [CrossRef] [PubMed]
- Guo, Y.; Geng, X.; Chen, D.; Chen, Y. Sustainable Building Design Development Knowledge Map: A Visual Analysis Using CiteSpace. Buildings 2022, 12, 969. [Google Scholar] [CrossRef]
- Guo, Y.; Wang, K.; Zhang, H.; Jiang, Z. Soundscape Perception Preference in an Urban Forest Park: Evidence from Moon Island Forest Park in Lu’an City. Sustainability 2022, 14, 16132. [Google Scholar] [CrossRef]
- Guo, Y.; Jiang, X.; Zhang, L.; Zhang, H.; Jiang, Z. Effects of Sound Source Landscape in Urban Forest Park on Alleviating Mental Stress of Visitors: Evidence from Huolu Mountain Forest Park, Guangzhou. Sustainability 2022, 14, 15125. [Google Scholar] [CrossRef]
- Morgan, E.A.; Bush, G.; Mandea, J.Z.; Kermarc, M.; Mackey, B. Comparing Community Needs and REDD+ Activities for Capacity Building and Forest Protection in the Équateur Province of the Democratic Republic of Congo. Land 2022, 11, 918. [Google Scholar] [CrossRef]
- Wang, Z.; Zhou, J.; Loaiciga, H.; Guo, H.; Hong, S. A DPSIR Model for Ecological Security Assessment through Indicator Screening: A Case Study at Dianchi Lake in China. PLoS ONE 2015, 10, e0131732. [Google Scholar] [CrossRef]
- Wolfslehner, B.; Vacik, H. Evaluating Sustainable Forest Management Strategies with the Analytic Network Process in a Pressure-State-Response Framework. J. Environ. Manage. 2008, 88, 1–10. [Google Scholar] [CrossRef]
- Uprety, Y.; Tiwari, A.; Karki, S.; Chaudhary, A.; Yadav, R.K.P.; Giri, S.; Shrestha, S.; Paudyal, K.; Dhakal, M. Characterization of Forest Ecosystems in the Chure (Siwalik Hills) Landscape of Nepal Himalaya and Their Conservation Need. Forests 2023, 14, 100. [Google Scholar] [CrossRef]
- Li, Y.; Geng, H. Evolution of Land Use Landscape Patterns in Karst Watersheds of Guizhou Plateau and Its Ecological Security Evaluation. Land 2022, 11, 2225. [Google Scholar] [CrossRef]
- Cheng, H.; Zhu, L.; Meng, J. Fuzzy Evaluation of the Ecological Security of Land Resources in Mainland China Based on the Pressure-State-Response Framework. Sci. Total Environ. 2022, 804, 150053. [Google Scholar] [CrossRef] [PubMed]
- Zhang, D.; Jing, P.; Sun, P.; Ren, H.; Ai, Z. The Non-Significant Correlation between Landscape Ecological Risk and Ecosystem Services in Xi’an Metropolitan Area, China. Ecol. Indic. 2022, 141, 109118. [Google Scholar] [CrossRef]
- Ran, Y.; Lei, D.; Li, J.; Gao, L.; Mo, J.; Liu, X. Identification of Crucial Areas of Territorial Ecological Restoration Based on Ecological Security Pattern: A Case Study of the Central Yunnan Urban Agglomeration, China. Ecol. Indic. 2022, 143, 109318. [Google Scholar] [CrossRef]
- Ma, L.; Bo, J.; Li, X.; Fang, F.; Cheng, W. Identifying Key Landscape Pattern Indices Influencing the Ecological Security of Inland River Basin: The Middle and Lower Reaches of Shule River Basin as an Example. Sci. Total Environ. 2019, 674, 424–438. [Google Scholar] [CrossRef]
- Yu, G.; Zhang, S.; Yu, Q.; Fan, Y.; Zeng, Q.; Wu, L.; Zhou, R.; Nan, N.; Zhao, P. Assessing Ecological Security at the Watershed Scale Based on RS/GIS: A Case Study from the Hanjiang River Basin. Stoch. Environ. Res. Risk Assess. 2014, 28, 307–318. [Google Scholar] [CrossRef]
- Liu, C.; Wang, C.; Li, Y.; Wang, Y. Spatiotemporal Differentiation and Geographic Detection Mechanism of Ecological Security in Chongqing, China. Glob. Ecol. Conserv. 2022, 35, e02072. [Google Scholar] [CrossRef]
- Wang, D.; Li, Y.; Yang, X.; Zhang, Z.; Gao, S.; Zhou, Q.; Zhuo, Y.; Wen, X.; Guo, Z. Evaluating Urban Ecological Civilization and Its Obstacle Factors Based on Integrated Model of PSR-EVW-TOPSIS: A Case Study of 13 Cities in Jiangsu Province, China. Ecol. Indic. 2021, 133, 108431. [Google Scholar] [CrossRef]
- Guo, S.; Wang, Y. Ecological Security Assessment Based on Ecological Footprint Approach in Hulunbeir Grassland, China. Int. J. Environ. Res. Public Health 2019, 16, 4805. [Google Scholar] [CrossRef]
- Sorge, S.; Mann, C.; Schleyer, C.; Loft, L.; Spacek, M.; Hernández-Morcillo, M.; Kluvankova, T. Understanding Dynamics of Forest Ecosystem Services Governance: A Socio-Ecological-Technical-Analytical Framework. Ecosyst. Serv. 2022, 55, 101427. [Google Scholar] [CrossRef]
- Bi, M.; Xie, G.; Yao, C. Ecological Security Assessment Based on the Renewable Ecological Footprint in the Guangdong-Hong Kong-Macao Greater Bay Area, China. Ecol. Indic. 2020, 116, 106432. [Google Scholar] [CrossRef]
- Anley, M.A.; Minale, A.S.; Haregeweyn, N.; Gashaw, T. Assessing the Impacts of Land Use/Cover Changes on Ecosystem Service Values in Rib Watershed, Upper Blue Nile Basin, Ethiopia. Trees For. People 2022, 7, 100212. [Google Scholar] [CrossRef]
- Zhang, X.; Ren, W.; Peng, H. Urban Land Use Change Simulation and Spatial Responses of Ecosystem Service Value under Multiple Scenarios: A Case Study of Wuhan, China. Ecol. Indic. 2022, 144, 109526. [Google Scholar] [CrossRef]
- Vizinho, A.; Avelar, D.; Branquinho, C.; Capela Lourenço, T.; Carvalho, S.; Nunes, A.; Sucena-Paiva, L.; Oliveira, H.; Fonseca, A.L.; Duarte Santos, F.; et al. Framework for Climate Change Adaptation of Agriculture and Forestry in Mediterranean Climate Regions. Land 2021, 10, 161. [Google Scholar] [CrossRef]
- Carr, E.R.; Wingard, P.M.; Yorty, S.C.; Thompson, M.C.; Jensen, N.K.; Roberson, J. Applying DPSIR to Sustainable Development. Int. J. Sustainable Dev. World Ecol. 2007, 14, 543–555. [Google Scholar] [CrossRef]
- Nobre, A.M. Scientific Approaches to Address Challenges in Coastal Management. Mar. Ecol. Prog. Ser. 2011, 434, 279–289. [Google Scholar] [CrossRef]
- Sarmin, N.S.; Mohd Hasmadi, I.; Pakhriazad, H.Z.; Khairil, W.A. The DPSIR Framework for Causes Analysis of Mangrove Deforestation in Johor, Malaysia. Environ. Nanotechnol. Monit. Manag. 2016, 6, 214–218. [Google Scholar] [CrossRef]
- Adams, J.B.; Rajkaran, A. Changes in Mangroves at Their Southernmost African Distribution Limit. Estuar. Coast. Shelf Sci. 2020, 247, 106862. [Google Scholar] [CrossRef]
- Hodson, M.; Marvin, S. ‘Urban Ecological Security’: A New Urban Paradigm? Int. J. Urban Reg. Res. 2009, 33, 193–215. [Google Scholar] [CrossRef]
- Yu, H.; Yang, J.; Qiu, M.; Liu, Z.J. Spatiotemporal Changes and Obstacle Factors of Forest Ecological Security in China: A Provincial-Level Analysis. Forests 2021, 12, 1526. [Google Scholar] [CrossRef]
- Wang, D.; Chen, J.; Zhang, L.; Sun, Z.; Wang, X.; Zhang, X.; Zhang, W. Establishing an Ecological Security Pattern for Urban Agglomeration, Taking Ecosystem Services and Human Interference Factors into Consideration. PeerJ 2019, 7, e7306. [Google Scholar] [CrossRef]
- Wen, J.; Hou, K. Research on the Progress of Regional Ecological Security Evaluation and Optimization of Its Common Limitations. Ecol. Indic. 2021, 127, 107797. [Google Scholar] [CrossRef]
- Yang, Y.; Song, G.; Lu, S. Assessment of Land Ecosystem Health with Monte Carlo Simulation: A Case Study in Qiqihaer, China. J. Clean. Prod. 2020, 250, 119522. [Google Scholar] [CrossRef]
- Sun, J.; Li, Y.P.; Gao, P.P.; Xia, B.C. A Mamdani Fuzzy Inference Approach for Assessing Ecological Security in the Pearl River Delta Urban Agglomeration, China. Ecol. Indic. 2018, 94, 386–396. [Google Scholar] [CrossRef]
- Hu, M.; Li, Z.; Yuan, M.; Fan, C.; Xia, B. Spatial Differentiation of Ecological Security and Differentiated Management of Ecological Conservation in the Pearl River Delta, China. Ecol. Indic. 2019, 104, 439–448. [Google Scholar] [CrossRef]
- Lu, S.; Tang, X.; Guan, X.; Qin, F.; Liu, X.; Zhang, D. The Assessment of Forest Ecological Security and Its Determining Indicators: A Case Study of the Yangtze River Economic Belt in China. J. Environ. Manage. 2020, 258, 110048. [Google Scholar] [CrossRef] [PubMed]
- Tang, X.; Guan, X.; Lu, S.; Qin, F.; Liu, X.; Zhang, D. Examining the Spatiotemporal Change of Forest Resource Carrying Capacity of the Yangtze River Economic Belt in China. Environ. Sci. Pollut. Res. Int. 2020, 27, 21213–21230. [Google Scholar] [CrossRef]
- Wang, Y.; Zhang, D.; Wang, Y. Evaluation Analysis of Forest Ecological Security in 11 Provinces (Cities) of the Yangtze River Economic Belt. Sustainability 2021, 13, 4845. [Google Scholar] [CrossRef]
- Chu, X.; Deng, X.; Jin, G.; Wang, Z.; Li, Z. Ecological Security Assessment Based on Ecological Footprint Approach in Beijing-Tianjin-Hebei Region, China. Phys. Chem. Earth (2002) 2017, 101, 43–51. [Google Scholar] [CrossRef]
- Xie, H.; He, Y.; Xie, X. Exploring the Factors Influencing Ecological Land Change for China’s Beijing–Tianjin–Hebei Region Using Big Data. J. Clean. Prod. 2017, 142, 677–687. [Google Scholar] [CrossRef]
- Lu, S.; Qin, F.; Chen, N.; Yu, Z.; Xiao, Y.; Cheng, X.; Guan, X. Spatiotemporal Differences in Forest Ecological Security Warning Values in Beijing: Using an Integrated Evaluation Index System and System Dynamics Model. Ecol. Indic. 2019, 104, 549–558. [Google Scholar] [CrossRef]
- Li, F.; Lu, S.; Sun, Y.; Li, X.; Xi, B.; Liu, W. Integrated Evaluation and Scenario Simulation for Forest Ecological Security of Beijing Based on System Dynamics Model. Sustainability 2015, 7, 13631–13659. [Google Scholar] [CrossRef]
- Chen, N.; Qin, F.; Zhai, Y.; Cao, H.; Zhang, R.; Cao, F. Evaluation of Coordinated Development of Forestry Management Efficiency and Forest Ecological Security: A Spatiotemporal Empirical Study Based on China’s Provinces. J. Clean. Prod. 2020, 260, 121042. [Google Scholar] [CrossRef]
- Pu, L.; Chen, X.; Jiang, L.; Zhang, H. Spatiotemporal Characteristics of Coupling and Coordination of Cultural Tourism and Objective Well-Being in Western China. Int. J. Environ. Res. Public Health 2022, 20, 650. [Google Scholar] [CrossRef] [PubMed]
- DellaSala, D.A.; Gorelik, S.R.; Walker, W.S. The Tongass National Forest, Southeast Alaska, USA: A Natural Climate Solution of Global Significance. Land 2022, 1, 717. [Google Scholar] [CrossRef]
- Guo, Y.; Chen, P.; Zhang, H.; Jiang, Z. Evaluation of the Perception and Experience of Rural Natural Landscape among Youth Groups: An Empirical Analysis from Three Villages around Hefei. Sustainability 2022, 14, 16298. [Google Scholar] [CrossRef]
- Runfola, D.M.; Hughes, S. What Makes Green Cities Unique? Examining the Economic and Political Characteristics of the Grey-to-Green Continuum. Land 2014, 3, 131–147. [Google Scholar] [CrossRef] [PubMed]
- Chen, J.; Li, Q.; Wang, H.; Deng, M. A Machine Learning Ensemble Approach Based on Random Forest and Radial Basis Function Neural Network for Risk Evaluation of Regional Flood Disaster: A Case Study of the Yangtze River Delta, China. Int. J. Environ. Res. Public Health 2019, 17, 49. [Google Scholar] [CrossRef]
- Wu, H.; Yu, Y.; Li, S.; Huang, K. An Empirical Study of the Assessment of Green Development in Beijing, China: Considering Resource Depletion, Environmental Damage and Ecological Benefits Simultaneously. Sustainability 2018, 10, 719. [Google Scholar] [CrossRef]
- Quinn, C.; Stringer, L.; Berman, R.; Le, H.; Msuya, F.; Pezzuti, J.; Orchard, S. Unpacking Changes in Mangrove Social-Ecological Systems: Lessons from Brazil, Zanzibar, and Vietnam. Resources 2017, 6, 14. [Google Scholar] [CrossRef]
- Rudianto, R.; Bengen, D.G.; Kurniawan, F. Causes and Effects of Mangrove Ecosystem Damage on Carbon Stocks and Absorption in East Java, Indonesia. Sustainability 2020, 12, 10319. [Google Scholar] [CrossRef]
- Baker, B.C.; Hanson, C.T. Cumulative Tree Mortality from Commercial Thinning and a Large Wildfire in the Sierra Nevada, California. Land 2022, 11, 995. [Google Scholar] [CrossRef]
- Zhang, X.; Chen, M.; Guo, K.; Liu, Y.; Liu, Y.; Cai, W.; Wu, H.; Chen, Z.; Chen, Y.; Zhang, J. Regional Land Eco-Security Evaluation for the Mining City of Daye in China Using the GIS-Based Grey TOPSIS Method. Land 2021, 10, 118. [Google Scholar] [CrossRef]
- Law, B.E.; Moomaw, W.R.; Hudiburg, T.W.; Schlesinger, W.H.; Sterman, J.D.; Woodwell, G.M. Creating Strategic Reserves to Protect Forest Carbon and Reduce Biodiversity Losses in the United States. Land 2022, 11, 721. [Google Scholar] [CrossRef]


| Target Level | Guideline Layer | Indicator Layer | Unit | Characteristic | References | Weights |
|---|---|---|---|---|---|---|
| A: Western China Forest Ecological Safety Index | D: Driving force | D1: Per capita GDP | RMB/person | + | Wu, H. et al. (2018) [48] | 0.0446 |
| D2: Annual precipitation | Millimeters | + | 0.0306 | |||
| D3: Natural population growth rate | People/square kilometer | − | 0.0251 | |||
| D4: Gross annual product | Billions of dollars | + | 0.0450 | |||
| D5: Secondary industry value added | Billions of dollars | + | 0.0458 | |||
| P: Pressure | P1: Population density | % | − | Quinn, C. et al. (2017) [49] | 0.0384 | |
| P2: Sulfur dioxide emissions | Million tons | − | 0.0760 | |||
| P3: Urbanization rate | % | − | 0.0261 | |||
| P4: Nitrogen oxide emissions | Million tons | − | 0.0585 | |||
| P5: Total energy consumption | Million tons of standard coal | − | 0.0420 | |||
| S: Status | S1: Forest cover | % | + | Rudianto, R. et al. (2020) [50] | 0.0365 | |
| S2: Total afforestation area | Thousands of hectares | + | 0.0235 | |||
| S3: Total standing wood accumulation | Billion cubic meters | + | 0.0353 | |||
| S4: Average percentage of good days | % | + | 0.0295 | |||
| S5: Water resources per capita | Cubic meter/person | + | 0.0268 | |||
| I: Impact | I1: Area of planted forests | Million hectares | + | Baker, B. et al. (2022) [51] | 0.0191 | |
| I2: Area of forest pest and rodent infestation | Million hectares | − | 0.0383 | |||
| I3: Number of forest fires | Times | − | 0.0265 | |||
| I4: Total fire area | Hectares | − | 0.0448 | |||
| I5: Area of affected forests | Hectares | − | 0.0537 | |||
| R: Response | R1: Forestry investment | Million dollars | + | Zhang, X. et al. (2021) [52] | 0.0296 | |
| R2: Closure of mountains for forestry | Thousands of hectares | + | 0.0359 | |||
| R3: Number of environmentally sound treatment plants | Seats | + | 0.0416 | |||
| R4: Domestic waste removal volume | Million tons | + | 0.0564 | |||
| R5: Industrial pollution control completed investment | Million dollars | + | 0.0705 |
| Region | Total Relative Proximity Value | Ranking | ||
|---|---|---|---|---|
| Chongqing | 0.217 | 0.068 | 0.239 | 9 |
| Szechwan | 0.177 | 0.105 | 0.372 | 5 |
| Yunnan | 0.178 | 0.111 | 0.385 | 4 |
| Guizhou | 0.203 | 0.074 | 0.268 | 6 |
| Tibet | 0.188 | 0.144 | 0.434 | 2 |
| Shaanxi | 0.206 | 0.065 | 0.240 | 8 |
| Gansu | 0.224 | 0.037 | 0.141 | 10 |
| Qinghai | 0.224 | 0.034 | 0.133 | 11 |
| Xinjiang | 0.215 | 0.076 | 0.262 | 7 |
| Ningxia | 0.231 | 0.033 | 0.124 | 12 |
| Inner Mongolia | 0.169 | 0.148 | 0.466 | 1 |
| Guangxi | 0.174 | 0.125 | 0.419 | 3 |
| Region | 2012 | Ranking | 2013 | Ranking | 2014 | Ranking | 2015 | Ranking | 2016 | Ranking |
|---|---|---|---|---|---|---|---|---|---|---|
| Chongqing | 0.223 | 9 | 0.215 | 9 | 0.219 | 9 | 0.234 | 8 | 0.231 | 8 |
| Szechwan | 0.376 | 5 | 0.348 | 5 | 0.347 | 5 | 0.310 | 5 | 0.353 | 4 |
| Yunnan | 0.445 | 1 | 0.434 | 1 | 0.453 | 1 | 0.318 | 4 | 0.290 | 5 |
| Guizhou | 0.259 | 7 | 0.237 | 8 | 0.250 | 7 | 0.283 | 6 | 0.259 | 7 |
| Tibet | 0.410 | 2 | 0.413 | 2 | 0.401 | 4 | 0.390 | 3 | 0.415 | 2 |
| Shaanxi | 0.236 | 8 | 0.242 | 7 | 0.238 | 8 | 0.221 | 9 | 0.211 | 9 |
| Gansu | 0.137 | 10 | 0.113 | 12 | 0.130 | 11 | 0.135 | 10 | 0.137 | 11 |
| Qinghai | 0.125 | 11 | 0.116 | 11 | 0.135 | 10 | 0.110 | 11 | 0.141 | 10 |
| Xinjiang | 0.274 | 6 | 0.293 | 6 | 0.288 | 6 | 0.248 | 7 | 0.261 | 6 |
| Ningxia | 0.123 | 12 | 0.120 | 10 | 0.122 | 12 | 0.102 | 12 | 0.129 | 12 |
| Inner Mongolia | 0.402 | 3 | 0.349 | 4 | 0.423 | 2 | 0.418 | 2 | 0.396 | 3 |
| Guangxi | 0.385 | 4 | 0.362 | 3 | 0.408 | 3 | 0.515 | 1 | 0.509 | 1 |
| Region | 2017 | Ranking | 2018 | Ranking | 2019 | Ranking | 2020 | Ranking | 2021 | Ranking |
| Chongqing | 0.192 | 8 | 0.232 | 7 | 0.256 | 9 | 0.268 | 8 | 0.262 | 9 |
| Szechwan | 0.279 | 4 | 0.378 | 4 | 0.369 | 4 | 0.499 | 1 | 0.386 | 4 |
| Yunnan | 0.213 | 7 | 0.271 | 5 | 0.337 | 5 | 0.400 | 4 | 0.449 | 2 |
| Guizhou | 0.245 | 5 | 0.251 | 6 | 0.273 | 7 | 0.316 | 6 | 0.287 | 7 |
| Tibet | 0.357 | 2 | 0.419 | 2 | 0.460 | 1 | 0.460 | 2 | 0.454 | 1 |
| Shaanxi | 0.190 | 9 | 0.231 | 8 | 0.306 | 6 | 0.283 | 7 | 0.289 | 6 |
| Gansu | 0.115 | 11 | 0.172 | 10 | 0.162 | 10 | 0.178 | 10 | 0.178 | 10 |
| Qinghai | 0.130 | 10 | 0.138 | 11 | 0.155 | 11 | 0.163 | 11 | 0.152 | 11 |
| Xinjiang | 0.232 | 6 | 0.228 | 9 | 0.261 | 8 | 0.242 | 9 | 0.263 | 8 |
| Ningxia | 0.105 | 12 | 0.112 | 12 | 0.146 | 12 | 0.125 | 12 | 0.143 | 12 |
| Inner Mongolia | 0.555 | 1 | 0.484 | 1 | 0.457 | 2 | 0.367 | 5 | 0.317 | 5 |
| Guangxi | 0.342 | 3 | 0.415 | 3 | 0.400 | 3 | 0.414 | 3 | 0.409 | 3 |
| Indicator Level | Chongqing | Szechwan | Yunnan | Guizhou | Tibet | Shaanxi | Gansu | Qinghai | Xinjiang | Ningxia | Inner Mongolia | Guangxi |
|---|---|---|---|---|---|---|---|---|---|---|---|---|
| D1 | 0.749 | 0.727 | 0.730 | 0.675 | 0.799 | 0.762 | 0.727 | 0.673 | 0.721 | 0.731 | 0.774 | 0.617 |
| D2 | 0.757 | 0.758 | 0.728 | 0.817 | 0.827 | 0.741 | 0.760 | 0.695 | 0.720 | 0.739 | 0.799 | 0.777 |
| D3 | 0.821 | 0.849 | 0.840 | 0.757 | 0.863 | 0.864 | 0.783 | 0.772 | 0.736 | 0.831 | 0.863 | 0.769 |
| D4 | 0.746 | 0.726 | 0.729 | 0.678 | 0.792 | 0.760 | 0.726 | 0.670 | 0.716 | 0.733 | 0.774 | 0.615 |
| D5 | 0.768 | 0.738 | 0.712 | 0.686 | 0.782 | 0.757 | 0.690 | 0.648 | 0.666 | 0.719 | 0.762 | 0.609 |
| P1 | 0.791 | 0.722 | 0.759 | 0.712 | 0.792 | 0.767 | 0.798 | 0.658 | 0.739 | 0.773 | 0.784 | 0.613 |
| P2 | 0.622 | 0.635 | 0.661 | 0.585 | 0.842 | 0.660 | 0.585 | 0.514 | 0.659 | 0.702 | 0.684 | 0.461 |
| P3 | 0.759 | 0.755 | 0.750 | 0.693 | 0.814 | 0.912 | 0.727 | 0.673 | 0.731 | 0.774 | 0.781 | 0.651 |
| P4 | 0.653 | 0.810 | 0.665 | 0.609 | 0.851 | 0.719 | 0.627 | 0.619 | 0.651 | 0.670 | 0.690 | 0.698 |
| P5 | 0.803 | 0.757 | 0.692 | 0.786 | 0.774 | 0.816 | 0.771 | 0.798 | 0.759 | 0.714 | 0.714 | 0.655 |
| S1 | 0.795 | 0.705 | 0.809 | 0.637 | 0.858 | 0.830 | 1.00 | 0.567 | 0.827 | 0.669 | 0.854 | 0.711 |
| S2 | 0.855 | 0.720 | 0.819 | 0.787 | 0.857 | 0.846 | 0.674 | 0.687 | 0.734 | 0.781 | 0.885 | 0.631 |
| S3 | 0.816 | 0.815 | 0.809 | 0.760 | 0.858 | 0.830 | 0.796 | 0.757 | 0.803 | 0.825 | 0.837 | 0.711 |
| S4 | 0.858 | 0.762 | 0.778 | 0.812 | 0.836 | 0.826 | 0.759 | 0.712 | 0.755 | 0.800 | 0.800 | 0.634 |
| S5 | 0.685 | 0.753 | 0.756 | 0.788 | 0.804 | 0.781 | 0.741 | 0.699 | 0.669 | 0.773 | 0.783 | 0.775 |
| I1 | 0.845 | 0.673 | 0.846 | 0.777 | 0.908 | 0.850 | 0.701 | 0.717 | 0.866 | 0.773 | 0.908 | 0.598 |
| I2 | 0.627 | 0.813 | 0.729 | 0.708 | 0.828 | 0.762 | 0.779 | 0.798 | 0.756 | 0.737 | 0.760 | 0.638 |
| I3 | 0.637 | 0.768 | 0.629 | 0.529 | 0.711 | 0.765 | 0.735 | 0.667 | 0.724 | 0.703 | 0.804 | 0.664 |
| I4 | 0.653 | 0.722 | 0.642 | 0.523 | 0.769 | 0.730 | 0.715 | 0.716 | 0.663 | 0.703 | 0.763 | 0.673 |
| I5 | 0.666 | 0.760 | 0.641 | 0.527 | 0.751 | 0.739 | 0.629 | 0.667 | 0.656 | 0.624 | 0.741 | 0.628 |
| R1 | 0.663 | 0.785 | 0.719 | 0.554 | 0.808 | 0.826 | 0.639 | 0.689 | 0.733 | 0.808 | 0.844 | 0.627 |
| R2 | 0.797 | 0.741 | 0.705 | 0.753 | 0.857 | 0.772 | 0.806 | 0.745 | 0.763 | 0.733 | 0.757 | 0.657 |
| R3 | 0.727 | 0.832 | 0.748 | 0.614 | 0.823 | 0.765 | 0.731 | 0.675 | 0.722 | 0.801 | 0.863 | 0.613 |
| R4 | 0.667 | 0.728 | 0.726 | 0.624 | 0.761 | 0.832 | 0.702 | 0.751 | 0.672 | 0.794 | 0.836 | 0.577 |
| R5 | 0.793 | 0.727 | 0.720 | 0.653 | 0.744 | 0.808 | 0.648 | 0.661 | 0.779 | 0.644 | 0.790 | 0.598 |
| Year | Total Relative Proximity Value | Ranking | ||
|---|---|---|---|---|
| 2012 | 0.160 | 0.115 | 0.417 | 10 |
| 2013 | 0.140 | 0.128 | 0.477 | 5 |
| 2014 | 0.116 | 0.145 | 0.556 | 1 |
| 2015 | 0.120 | 0.123 | 0.507 | 3 |
| 2016 | 0.135 | 0.097 | 0.419 | 9 |
| 2017 | 0.123 | 0.127 | 0.508 | 2 |
| 2018 | 0.126 | 0.112 | 0.470 | 7 |
| 2019 | 0.128 | 0.117 | 0.478 | 4 |
| 2020 | 0.140 | 0.125 | 0.472 | 6 |
| 2021 | 0.158 | 0.139 | 0.469 | 8 |
Disclaimer/Publisher’s Note: The statements, opinions and data contained in all publications are solely those of the individual author(s) and contributor(s) and not of MDPI and/or the editor(s). MDPI and/or the editor(s) disclaim responsibility for any injury to people or property resulting from any ideas, methods, instructions or products referred to in the content. |
© 2023 by the authors. Licensee MDPI, Basel, Switzerland. This article is an open access article distributed under the terms and conditions of the Creative Commons Attribution (CC BY) license (https://creativecommons.org/licenses/by/4.0/).
Share and Cite
Guo, Y.; Ma, X.; Zhu, Y.; Chen, D.; Zhang, H. Research on Driving Factors of Forest Ecological Security: Evidence from 12 Provincial Administrative Regions in Western China. Sustainability 2023, 15, 5505. https://doi.org/10.3390/su15065505
Guo Y, Ma X, Zhu Y, Chen D, Zhang H. Research on Driving Factors of Forest Ecological Security: Evidence from 12 Provincial Administrative Regions in Western China. Sustainability. 2023; 15(6):5505. https://doi.org/10.3390/su15065505
Chicago/Turabian StyleGuo, Yanlong, Xingmeng Ma, Yelin Zhu, Denghang Chen, and Han Zhang. 2023. "Research on Driving Factors of Forest Ecological Security: Evidence from 12 Provincial Administrative Regions in Western China" Sustainability 15, no. 6: 5505. https://doi.org/10.3390/su15065505
APA StyleGuo, Y., Ma, X., Zhu, Y., Chen, D., & Zhang, H. (2023). Research on Driving Factors of Forest Ecological Security: Evidence from 12 Provincial Administrative Regions in Western China. Sustainability, 15(6), 5505. https://doi.org/10.3390/su15065505