Abstract
Land-use changes remain a major source of terrestrial ecosystem carbon stock (TECS) change. However, existing studies estimating TECS change caused by land-use changes, considering the mixed land-use structure and its continuous structural changes in the land-use change model, are still absent. Our study first analyzed land-use changes during the years 2000–2020 in the Changsha-Zhuzhou-Xiangtan (CZX) urban agglomeration, and then simulated the multi-scenario mixed land-use structure pattern in 2030, and finally estimated its effects on TECS change. Results show that: (1) The TECS change in CZX urban agglomeration during the years 2000–2020 are trending downward, decreasing 5.62 Tg. (2) Over the past 20 years, land-use changes in CZX urban agglomeration were dominated by the increase of artificial surfaces, and the decrease of forest, farmland, and grassland, which are major sources of TECS reduction. (3) The total TECS in inertial development, cultivated land protection, and ecological priority scenarios, are 95.82 Tg, 95.97 Tg, and 97.31 Tg, respectively. Compared to TECS in 2020, the decrease is 2.61 Tg, 2.46 Tg, and 1.12 Tg, respectively. While the spatial pattern of losses in TECS is trending toward sustained expansion in the inertial development and cultivated land protection scenario, the ecological priority scenario is more concentrated. The results can provide decision support for regional carbon accounting, for the assessment of terrestrial carbon stock, and for the planning of the “dual-carbon” (refer to peak carbon and carbon neutrality in dioxide emissions) goal.
1. Introduction
Excessive emissions of greenhouse gases (CO2, CH4, N2O, etc.) will accelerate global warming, breaking ecosystem balance and seriously affecting sustainable development of human society and economy. The ‘Paris Agreement’, reached in 2015, set the long-term goal of ‘controlling the increase of global average temperature in this century by less than 2 °C compared with the pre-industrial period’, and strove to limit the increase of temperature to less than 1.5 °C [1]. As a major carbon emitter (accounting for about 27% of global carbon emissions), China contributes 8.6% of the global warming forcing effect [2]. Terrestrial ecosystem, as an important carbon sink of absorbing atmospheric CO2, offsets 7–15% of carbon emissions derived from fossil fuel combustion in China during the same period [3]. In 2020, the Chinese government announced that it will achieve a carbon peak around 2030, and will strive to achieve carbon neutrality by 2060 [4]. The terms ‘carbon emissions’ and ‘carbon emission reduction’ have attracted widespread attention in China [5]. The ‘dual-carbon’ goal will be of positive significance to the maintenance of carbon balance in China, and the mitigation of global climate warming.
Terrestrial ecosystems, as an important part of the global carbon pool, are mainly distributed in the forest, grassland, cultivated land, wetland, and desert ecosystem carbon pool [6,7]. Land-use change is the key factor related to TECS change, which it affects by changing the surface vegetation coverage and biomass [8,9,10,11,12,13]. It is not only a hot spot in the ecological environment field, but also a key point to explore the TECS change. Therefore, it is of great significance to estimate the TECS caused by land-use changes, to achieve the goal of ‘dual-carbon’.
Existing studies estimating the TECS change caused by land-use changes are mainly divided into two categories [14,15,16]: the retrospective method, and the scenario analysis method. The former explores TECS change based on the historical land-use pattern and carbon density survey/monitoring data. For example: Steven et al. pointed out that the global annual wetland carbon loss is equivalent to 5% of the total anthropogenic carbon emissions [17]; Hong et al. pointed out that China’s large-scale afforestation contributed 25% of the global land greening increment, and significantly improved the carbon sink capacity of the global terrestrial ecosystem [18]; Piao et al. found that the accelerated growth of global terrestrial ecosystem carbon sinks in the past 15 years was mainly attributed to the reduction of carbon emissions caused by land-use changes [19]; Sha et al. found that, by optimizing land-use management measures, the global terrestrial ecosystem can absorb an additional 13.74 PgC per year [20]; and Liu et al. found that the occupation of wetland by agricultural land and construction land was the main factor leading to the decrease of wetland carbon stock in China in the past 50 years [21]. The latter explores the relationship between future land-use changes and TECS, by configuring appropriate scenarios. For example: Zeng et al. evaluated the impact of global land-use changes on aboveground biomass carbon stocks under the shared socio-economic path scenarios [22]; Liu et al. evaluated the impact of future land-use changes on TECS under a representative concentration path scenario [23]; Zhang et al. studied the impact of future land-use changes on TECS in Wuhan’s metropolitan area under the ‘three-line’ constraint scenario [14]; and Zhang et al. studied TECS change under different scenarios in the Qinba Mountains [6]. In conclusion, in terms of research scope, most of the previous studies focused on regional scales such as global, regional, and provincial scales. Although there are relatively few studies on urban agglomerations, existing studies [24,25,26,27,28] have confirmed that urban expansion is the main internal driving force of regional land-use change, that is, urban expansion encroaches on high-quality cultivated land around the main urban areas. However, agricultural land expansion often encroaches on ecological land, such as forest land and garden land, to achieve the balance of occupation, resulting in TECS change. Exploring the TECS change caused by land-use changes in urban agglomerations provides guidance for maintaining carbon budget balance. In terms of methods, the InVEST model combined with the geographic simulation and optimization models, has been widely used in estimating TECS change caused by land-use changes. Although cellular automata (CA) theoretical framework models (such as FLUS, PLUS, Dyna-CLUE, and CLUMondo) have been widely used to estimate the impact of land-use changes on TECS change [29,30,31,32,33,34], existing land-use change models are usually based on the pure-cell structure (that is, a grid/cell contains only one land-use type, and the corresponding model simulates discrete changes in each cell) CA model. These models artificially make a trade-off for land-use structure in the grid/cell in their design. These trade-offs will cause error accumulation in the process of interaction simulation, further affecting the post-effect estimation and analysis of land-use changes. Unlike a pure cell, the state of a mixed-cell structure is made up of an array of continuously measured components. A mixed-cell CA model can simulate the continuous structural change of land-use mixture within each cell. In addition, mixed land-use structure is also one of the important characteristics of land-use pattern. Existing studies [35,36,37] have proposed CA models that take into account mixed land-use structure to simulate changes in land-use component and functional characteristics, and we believe the simulated results can improve the accuracy in estimating the spatio-temporal change of TECS.
Therefore, our study coupled the mixed CA model and the InVEST (Integrated Valuation of Environment Service and Tradeoffs, InVEST) model in order to estimate the spatio-temporal differences of land-use changes on TECS change in CZX urban agglomeration, under different development scenarios. The corresponding results can expand the research progress of TECS change in CZX urban agglomeration, and provide scientific suggestions for improving regional carbon sink capacity. More importantly, it provides data support for the realization of the ‘dual-carbon’ goal of CZX urban agglomeration and Hunan province.
2. Study Area and Data Sources
2.1. Study Area
The CZX urban agglomeration, including parts of districts/counties of Changsha, Zhuzhou, and Xiangtan, is the core economic area of Hunan province (Figure 1), with a total economic volume of 1.79 trillion yuan. It is located in the eastern part of central Hunan province, and had a permanent population of 14.84 million in 2021. Its area is 1.89 × 10⁴ km2, and the overall geographical condition of the vast area is that of low terrain which is suitable for urban spatial development. Currently, the CZX urban agglomeration is in the stage of rapid industrialization and urbanization which will continue in the future. The built-up area of the CZX urban agglomeration expanded by 2.72 times from the year 2000 to the year 2020, and the urban land increased by 1096.67 km2. The rapid urbanization process will inevitably drive land-use changes, thus causing the TECS change. Hence, it is important for those planning sustainable regional development to be able to estimate the TECS change caused by multi-scenario land-use change.
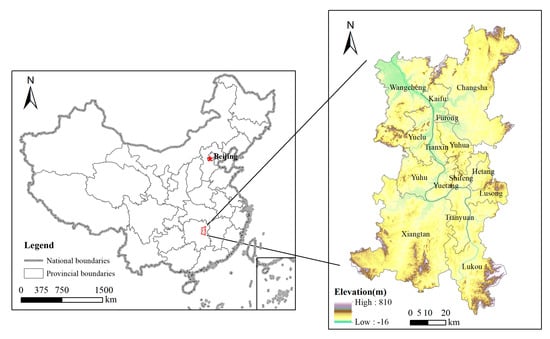
Figure 1.
Location of the CZX urban agglomeration.
2.2. Data Sources
The land-use type data in our study includes three periods of data in 2000, 2010, and 2020 with a spatial resolution of 30 × 30 m, which are derived from the GlobeLand30 datasets (http://www.globallandcover.com/ (accessed on 31 October 2019)). They include cultivated land, forest, grassland, shrub, wetland, water bodies, tundra, artificial surface, bare land, glacier, and permanent snow. The socio-economic data mainly include population and GDP in 2020 with a spatial resolution of 1 × 1 km, which are derived from the Resource and Environmental Science and Data Center of the Chinese Academy of Sciences (https://www.resdc.cn/ (accessed on 28 March 2022)). The road network data in 2020 comes from OpenStreetMap (http://westdc.westgis.ac.cn/data (accessed on 5 March 2022)). The climate and environment data include soil type, annual average temperature, annual average rainfall, and DEM data. The soil type data are derived from the HWSD v1.2 data set (http://westdc.westgis.ac.cn/data (accessed on 5 March 2022)). The annual average temperature and rainfall data in 2020 with a spatial resolution of 1 × 1 km, are derived from the Resource and Environmental Science and Data Center of the Chinese Academy of Sciences (https://www.resdc.cn/ (accessed on 28 March 2022)). DEM data is derived from geospatial data cloud (https://www.gscloud.cn/ (accessed on 17 October 2015)) with a spatial resolution of 30 × 30 m.
3. Methods
The framework of our study is divided into two parts (Figure 2): (1) Scenario setting: Based on the historical land-use pattern of CZX urban agglomeration, the Markov Chain Model (MCM) is used to predict the number of land-use types under three different scenarios (i.e., the inertial development scenario (S1), the cultivated land protection scenario (S2), and the ecological priority scenario (S3)). The continuous structural changes in land-use component in each cell, under three different scenarios, are simulated based on the mixed-cell CA (MCCA) model. (2) Estimation of TECS change: Spatio-temporal change of TECS in CZX urban agglomeration under three scenarios were estimated based on the corresponding simulation results by using the InVEST model. The detailed framework is shown in Figure 2.
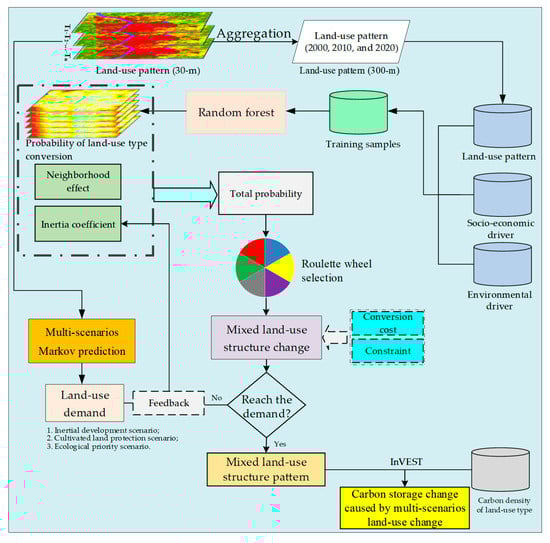
Figure 2.
Framework for estimating carbon stock changes caused by land-use changes under multi-scenarios.
3.1. Markov Chain Model
The Markov chain model (MCM) is used to predict the development trend of an event based on the historical development trajectory of an event. It has no aftereffect and is widely used in the prediction of the mount of land-use types [38,39], and in scenario setting [29,40]. The formula is as follows:
where S(T) and S(T0) represent the land-use state matrix at T and T0, respectively. Pij is the transition probability transformation matrix from land-use type i to land-use type j, which is derived from the historical land-use pattern.
3.2. MCCA Model
The MCCA model, proposed by Liang Xun et al., can simulate the mixed land-use structure and its continuous structural changes [35]. It overcomes the traditional CA model, which can only simulate the discrete changes of land-use types in each cell, thus expanding the simulation ability and practicability of the CA-based model. Specifically, the MCCA model mainly includes three parts.
3.2.1. Quantitatively Mining the Relationship between Land-Use Component Changes and Driving Variables
The MCCA model explores the quantitative relationship between land-use component changes and driving variables, based on the Rondom Forest (RF) model. The RF model can overcome the multicollinearity problem among driving factors, especially in the case of high-dimensional fitting, and has proven to be an effective method to mine the transformation rule of land-use changes [41]. The principle of RF is that for any feature A, it can be divided into two data sets D1 and D2, so that the Root Mean Square Error (MSE) of D1 and D2 and the sum of MSE of D1 and D2 are minimized. The objective function of RFR is as follows:
where xi is the feature of the ith training sample; yi is the dependent variable of the ith training sample; c1 is the sample mean of data set D1; and c2 is the sample mean of datasets D2. The processing rules of the dependent variable yi are as follows:
where PCi,k represents the component change of the k th land-use type in the ith cell in a certain period of time.
3.2.2. Adaptive Inertia Competition Mechanism Based on Roulette Wheel Selection
The adaptive inertia competition mechanism is used to drive the operation of the model to gradually move closer to the predetermined land-use demand. The formula is as follows:
where is the inertia coefficient of the kst land-use type at time t; and and represent the difference between the number of the kth land-use type at t − 1 and t − 2, and the predetermined land-use demand, respectively. In addition, the standardization is used to adjust the relative competition mechanism between multiple land-use types. The formula is as follows:
where K is the number of land-use types. Several processes between ‘top-down’, macro-scale demand control, and ‘bottom-up’, micro-scale allocation, can be realized based on the adaptive competition mechanism.
3.2.3. MCCA Model Simulation Process
Firstly, considering the probability of land-use type conversion, neighborhood effect, and inertia mechanism, the total probability of land-use type conversion capacity for each cell is obtained. The details are as follows:
where is the total probability that the i grid is converted into the kst land-use type; DPi,k is calculated by the RF model (See formulas (2) and (3) for details); and is the neighborhood effect of the kth land-use type in the ith grid, and the formula is as follows:
where Ratiok represents the proportion of land-use type k in the cell; N denotes the range of neighborhood effect, usually set to Moore neighborhood; and Wk represents the weight of neighborhood effect of land-use type k.
In order to characterize the interaction of land-use type conversion, the total probability calculated by Formula (6) is normalized (See Formula (8) for details). Secondly, the competition relationship among land-use types for each cell is quantified based on the roulette mechanism. Thirdly, when a land-use type k competition is completed, the proportion of the land-use type in the cell increases accordingly (the increase rule is shown in the Formula (9)). However, the increase of the proportion of the land-use type k means that the other land-use components decrease accordingly (the decrease rule is shown in the Formula (10)). Finally, repeat the process until the simulation process reaches the predetermined land-use demand (an error of ±1% is allowed).
where denotes the normalized value of land-use type k in the ith grid.
where denotes the increment of land-use type k in the ith grid; RA is a random value, ranging from 0 to 1; and εk denotes the step size of the quantitative change of land-use type k, defined by the user.
where denotes the reduction ratio of land-use type o in the ist cell at time t; represents the probability of the decline of the land-use type o in the ist cell at time t, and the formula is shown in Formula (11); and cono→k is the conversion matrix of land-use type, which is user-defined. cono→k = 1 means that if the land-use type o can be converted to the land-use type of type k, the conversion can occur; otherwise it cannot be converted. The rule is shown in Formula (10).
3.2.4. Performance of MCCA Model
Referring to Liang et al. [35], our study validated the performance of the MCCA model from the following three indicators: (1) Overall Accuracy (OA), which is used to quantify the consistency between the simulation results and the actual land-use pattern; (2) Mixed-cell Figure of Merit (McFoM), which is used to quantify the consistency between simulated land-use changes and actual land-use changes; and (3) Relative Entropy (RE), which is used to quantify the similarity of land-use structure (composition) between the simulation land-use changes and the actual land-use changes on the cell scale. The details refer to Liang et al.
3.3. InVEST Model
The InVEST model considers that the total carbon density of a land-use type consists of four parts: above-ground biomass carbon (AGBC) density, below-ground biomass carbon (BGBC) density, soil organic carbon (SOC) density, and dead organic matter carbon density. It is simple and versatile, and has been widely used in the estimation of terrestrial ecosystem carbon density [23,42,43,44]. The formula is as follows:
where Ci is the total carbon density of land-use type i and Ci-above, Ci-below, Ci-soil and Ci-dead are the AGBC density, BGBC density, SOC density, and dead organic matter carbon density of the ist land-use type, respectively. Ci-total and Ai are the total carbon density and area of the ist land-use type in the study area.
Because the simulation results of this paper are the structure of mixed land-use types, the carbon stock at any location is the sum of carbon stock of various land-use types. The formula is as follows:
where Ccell-total is the total carbon density at the location cell; Acell-i is the area proportion of the kst land-use type at the location cell; and K is the number of land-use types.
3.4. Scenario Settings
In order to further estimate the TECS caused by future land-use changes in CZX urban agglomeration, and referencing the previous studies [14,29,31], our study configured three scenarios to simulate the land-use component changes in 2030, to provide scientific suggestions for improving TECS in the CZX urban agglomeration.
- (1)
- Scenario 1: Inertial development scenario (S1). This scenario is based on the land-use changes of the CZX urban agglomeration from the year 2000 to the year 2020, without considering the factor of policy planning, using the MCM model (Formula (1)) to predict the number of multiple land-use types, which is the basis of other scenarios.
- (2)
- Scenario 2: Cultivated land protection scenario (S2). Reducing the occupation of cultivated land caused by urban expansion is an important measure to ensure regional food security. Based on the S1 development scenario, this scenario uses the permanent basic cultivated land protection area as the restriction condition, and modifies the transition probability matrix in the MCM model. The probability of conversion from cultivated land to construction land is 40% of the S1 scenario, reducing the occupation of cultivated land by urban expansion and implementing cultivated land protection policies.
- (3)
- Scenario 3: Ecological priority scenario (S3). Ecological protection and restoration have become an important part of spatial planning. Reserving a certain amount of ecological land for species flows and exchange among multiple ecosystems can provide a basis for sustainable regional development. With reference to previous research, this scenario is based on the S1 development scenario, and the ecological protection area is used as a restriction condition. The probability of conversion of forest land and grassland to construction land is 50% of the S1 scenario. In addition, cultivated land also has certain ecological functions. The probability of conversion of cultivated land to construction land is 70% of the S1 scenario, and the reduction will be increased to the probability of conversion of cultivated land to forest land.
4. Results and Analysis
4.1. Data Preprocessing and Model Validation
Our study divides the land-use types into six categories: cultivated land, forest land, grassland, wetland, water bodies, and artificial surfaces (also known as urban land). Using Matlab 2019 (b) software, the land-use type data of years 2000, 2010, and 2020 in the CZX urban agglomeration are aggregated into 300-m spatial resolution, and the proportion of each land-use type in each cell is obtained. With reference to previous research, the driving variables of the MCCA model are composed of a total of 13 spatial variables: population, GDP, distance to the city center, distance to the highway, distance to the main road, distance to the secondary road, DEM, slope, average annual rainfall, average annual temperature, soil oxygen content, soil fertility, and soil availability. The above spatial variables are resampled into 300-m spatial resolution data for normalization.
In order to validate the performance of the MCCA model, our study takes the mixed land-use structure change of the CZX urban agglomeration from 2010 to 2020 as the verification experiment. The sampling rate of RE is set to 10%, the number of regression trees is set to 100, the neighborhood effect is set to Moore neighborhood, the size is 3 × 3, the step size ε of multiple land-use types (See Formula (9) for details) is set to 1, and the water bodies are set as the constraint condition. Results showed that the MSE of each land-use type in the RF model was less than 0.03 (i.e., cultivated land: 0.021; forest land: 0.022; grassland: 0.023; wetland: 0.017; water bodies: 0.018; artificial surface: 0.029), indicating that the RF model can well capture the relationship between land-use type mixed structure change, and driving variables. The OA value of the MCCA model is 0.6238, the mcFoM value is 0.1216, and the average RE value is 0.7864, indicating that the model can be used to simulate the change of land-use mixed structure change in CZX urban agglomeration. The land-use conversion cost matrix under the three scenarios is shown in Table 1.

Table 1.
Land-use conversion cost matrix (1 = conversion possible; 0 = not possible).
4.2. Carbon Density Estimation of Multiple Land-Use Types
In our study, carbon density data acquisition of land-use types is key in estimating TECS change. The carbon density of land-use type in the CZX urban agglomeration was achieved referring to the field measurement data or existing research results of CZX urban agglomeration. If the data is incomplete, the measured data or existing results of the adjacent CZX urban agglomeration are selected to estimate the carbon density. Table 2 shows the carbon density data of each land-use type in the CZX urban agglomeration.
Table 2.
Carbon density of six land-use types.
Dai et al. sorted out the literature and referred to the ‘2006 IPCC National Greenhouse Gas Inventories Guide’ to estimate the carbon stock parameters of cultivated land, forest land, grassland, wetland, and water bodies in Hunan [45]. Based on the number of pixels corresponding to the first and second classifications of land-use types, Li et al. calculated that the vegetation and soil carbon density of construction land in the CZX urban agglomeration are 9.7 t/hm2 and 86.8 t/hm2, respectively. Xi et al. found that the SOC density of wetland and artificial surface in Hunan province was 12.65 t/hm2 and 41.76 t/hm2, respectively, based on the method of double-layer grid soil measurement in the geochemical survey [46]. Liu et al. estimated the AGBC and SOC density of cultivated land, forest land, grassland, and water bodies in the warm temperate zone of Hunan, by overlaying the Köppen climate zone, soil type, and land-use data [23]. They were 26.41 Mg/hm2, 44.75 Mg/hm2, 38.67 Mg/hm2, 22.32 Mg/hm2 and 43.94 Mg/hm2, 52.71 Mg/hm2, 53.70 Mg/hm2, 44.29 Mg/hm2, respectively. Although the above method can distinguish the carbon density reflected by different land-use types to a certain extent, there are still some problems. The most prominent problem is that the spatial heterogeneity of the same land type in different regions is not considered, that is, the same land-use type in different geographical and climatic conditions will also lead to differences in carbon stock. Therefore, it is necessary to eliminate outliers and to assess the average value of carbon density, by comparing and analyzing data.
4.3. Land-Use Changes in CZX Urban Agglomeration
4.3.1. Land-Use Changes of the CZX Urban Agglomeration from 2000 to 2020
The CZX urban agglomeration in 2020 is dominated by forest land and cultivated land, accounting for 50.75% and 27.27%, respectively, followed by construction land, grassland, and water bodies (13.46%, 4.91%, and 3.52%), and wetland, which is the lowest (<0.1%). In general, cultivated land, forest land, grassland, and wetland decreased from 2000 to 2020, especially grassland, forest land, and cultivated land, which were 14.51%, 10.60%, and 9.21%, respectively. The artificial surface and water area increased by 211.59% and 25.41%, respectively, reflecting the rapid urbanization process of the CZX urban agglomeration in the past 20 years. Table 3 shows, that from 2000 to 2020, the encroachment area of forest land and cultivated land was more significant, reaching 1013.39 km2 and 826.55 km2, respectively, which was 2.08 times and 1.41 times of transformed into them (487.55 km2 and 584.95 km2). The reduction in the forest land and cultivated land promoted changes in the use of other land-use types, and the area transformed into artificial surface was 324.51 km2 and 407.05 km2, respectively. The transfer-out area of forest land, cultivated land, and grassland is higher than the transfer-in area; the transfer-in and transfer-out area of wetland and water area is small; the transfer-in area of water area (101 km2) is higher than the transfer-out area (39.42 km2); and the transfer-in contribution rate is 4.6%, indicating that the CZX urban agglomeration pays attention to the protection of water areas while in the process of urbanization. The area of artificial surface increased significantly, and the area of transfer-in (825.86 km2) was much larger than that of transfer-out (26.76 km2). The contribution rate of transfer-in was 37.30%, which mainly came from cultivated land (407.05 km2) and forest land (324.51 km2). It can be seen that urbanization is the main internal driving force for land-use changes in the CZX urban agglomeration, and urban expansion directly and indirectly encroaches on cultivated land, forest land, and grassland. Figure 3 shows, from 2000 to 2020, the urban expansion of the CZX urban agglomeration is dominated by marginal and infill, with Changsha, Zhuzhou and Xiangtan as the core growth poles of urban agglomeration spatial expansion. Among them, the urban expansion of Changsha is concentrated in the northwest and south, the urban expansion of Zhuzhou is concentrated in the southwest, and the urban expansion of Xiangtan is concentrated in the north. In the past two decades, the urban spatial development of Changsha, Zhuzhou and Xiangtan has shown a trend of agglomeration, and the trend of integration is clear.
Table 3.
Land-use changes in the CZX urban agglomeration between 2000 and 2020.
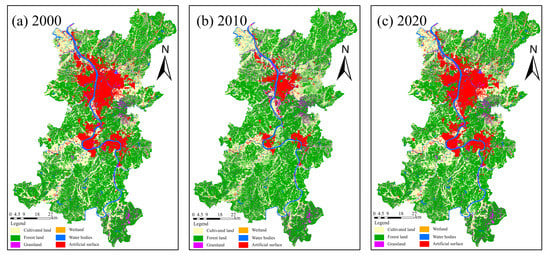
Figure 3.
Land-use pattern of the CZX urban agglomeration.
4.3.2. Land-Use Changes under Different Scenarios in the CZX Urban Agglomeration in 2030
Land-use patterns in the CZX urban agglomeration in 2030 are spatially different under each of the three scenarios (Figure 4 and Table 4). The area reduction of cultivated land under inertial development scenario (S1), cultivated land protection scenario (S2), and ecological priority scenario (S3), were 132.18 km2, 0.75 km2, and 65.73 km2, respectively. Forest land, as the main ecological land, is an important carbon pool. Its area under the S3 scenario is reduced by 255.28 km2, while under the S1 and S2 scenarios the reductions are 480.07 km2 and 460.63 km2, respectively, each of which is nearly twice that of the S3 scenario. The area reduction of grassland under S3 scenario was 30.02 km2, and there was no significant difference between the S1 and S2 scenarios (53.05 km2 and 50.20 km2), which were 1.5 times that of S3 scenario, which well-reflected the role of ecological constraints. There is no significant difference in the area changes of wetlands and water bodies in the three scenarios, indicating that under the background of ecological civilization, it has become a consensus to protect water resources such as wetlands and water bodies. Although the area of impervious surface increased under all three scenarios, the area increase under S1 scenario (618.15 km2) was much larger than that under the S2 and S3 scenarios (462.35 km2 and 301.33 km2). In addition, Figure 4 (water bodies and wetland are not presented in the figure due to insignificant changes in area) clearly demonstrates that in the inertial development scenario, the expansion of artificial surface is more disordered, showing disorderly spread, while in the S2 and S3 scenarios, urban expansion is more compact, and away from high-quality cultivated land and ecological land areas.
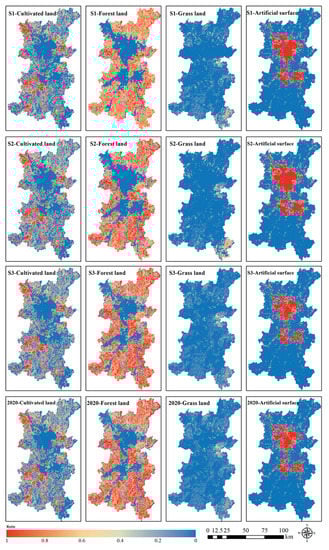
Figure 4.
Mixed land-use structure pattern of the CZX urban agglomeration under three scenarios.
Table 4.
Land-use changes during 2020–2030.
4.4. Terrestrial Ecosystem Carbon Stock Change Caused by Land-Use Changes in the CZX Urban Agglomeration
4.4.1. Terrestrial Ecosystem Carbon Stock Change Caused by Land-Use Changes during 2000–2020
TECS change caused by land-use changes between 2000 and 2020 is estimated based on historical land-use patterns and the corresponding carbon density data. Results show that the carbon stock of the CZX urban agglomeration in 2000, 2010, and 2020 were 104.05 Tg, 101.74 Tg, and 98.43 Tg, respectively, and the average carbon density was 134.46 t/hm2, 133.24 t/hm2, and 132.86 t/hm2, respectively. In the past 20 years, the carbon stock and average carbon density of terrestrial ecosystems in the CZX urban agglomeration decreased gradually, and the total carbon stock decreased by 5.62 Tg. The average annual decline was 0.28 Tg. Figure 5 shows that forest land and cultivated land were the main carbon pools of the CZX urban agglomeration, and showed a declining trend during 2000–2020. During this period, the economy was in a stage of rapid development, and the construction land expanded dramatically, resulting in a large amount of forest land and cultivated land being recategorized as construction land, which caused the decline of carbon stock of forest land and cultivated land. The area of wetland and water bodies increased slightly, and the carbon stock showed a slight upward trend, indicating that the protection of water ecosystems was emphasized in urbanization. The carbon stock and proportion of grassland also showed a downward trend. In the process of steady progress of urbanization, the greening work, such as returning farmland to forest and grassland, was effective but not enough, the low quality of natural ecosystem was clear, and the forest and grassland ecosystem appeared to reverse succession. From the analysis of the spatial change of carbon stock in the terrestrial ecosystem, the change of carbon stock showed the characteristics of agglomeration (i.e., the carbon stock decreased significantly in some areas and increased in some local areas). In general, the carbon stock of the CZX urban agglomeration decreased between 2000 and 2010, and the reduction rate between 2010 and 2020 eased slightly.

Figure 5.
Carbon stock of different land-use types in the CZX urban agglomeration (2000, 2010, and 2020).
4.4.2. Terrestrial Ecosystem Carbon Stock Change Caused by Mixed Land-Use Structure Change under Three Scenarios in 2030
The mixed land-use structure pattern under three scenarios (inertial development, cultivated land protection, and ecological priority scenarios) in the CZX urban agglomeration in 2030 were achieved based on the MCCA model. The Carbon module in the InVEST model was used to calculate the terrestrial ecosystem carbon stock and its spatial distribution under three scenarios (Table 5, Figure 6 and Figure 7). Results show that under the S1 scenario, the spatial distribution of carbon stock shows a general decrease and a sporadic increase. The overall trend is declining, and its total amount is 2.61 Tg lower than that in 2020. The continuous expansion of construction land and the gradual decrease in the amount of ecological function land, such as cultivated land and forest land, are the main reasons for the loss of the regional carbon stock. The reduction of carbon stock is most affected by the replacement of forest land. The replacement of vast forest land leads to the loss of carbon stock by 4.76 Tg. Although construction land expansion has increased carbon stock by 2.63 Tg compared with 2020, based on the overall situation, the increase in carbon stock is far less than the reduction, and the overall trend is downward. Under the S2 scenario, in order to strictly implement the protection of cultivated land, the conversion of cultivated land to other land types is limited, which is 2.46 Tg lower than that in 2020. Compared with the S1 scenario, the decreased rate of cultivated land quantity slowed down, and the carbon stock increased by 0.5 Tg. In addition, the expansion trend of construction land has been reduced to a certain extent, compared with the S2 scenario, although compared with the current situation in 2020, the increase is still 39%, indicating that the expansion of artificial surface under the protection of cultivated land will be constrained to a certain extent, reducing the occupation of forest land and grassland by urban expansion. Under the S3 scenario, although carbon stock decreased by 1.12 Tg compared with 2020, the carbon loss of terrestrial ecosystems was alleviated. Compared with the S1 scenario, the total carbon stock increased by 1.49 Tg, showing that the carbon stock of ecological land around the town increased, and the remaining areas fluctuated less. The carbon stock of ecological function land was affected by the expansion of forest land and grassland, which increased by 2.55 Tg compared with the S1 scenario. On the contrary, the growth rate of construction land is limited by ecological function land, and its carbon stock is 51.33% lower than that of S1 scenario, which is 1.35 Tg. Under this scenario, the study area effectively improved the carbon stock and carbon sink capacity of the regional terrestrial ecosystem through the management and protection of ecological land.
Table 5.
Carbon stock change of three scenarios in the CZX urban agglomeration (unit: Tg).
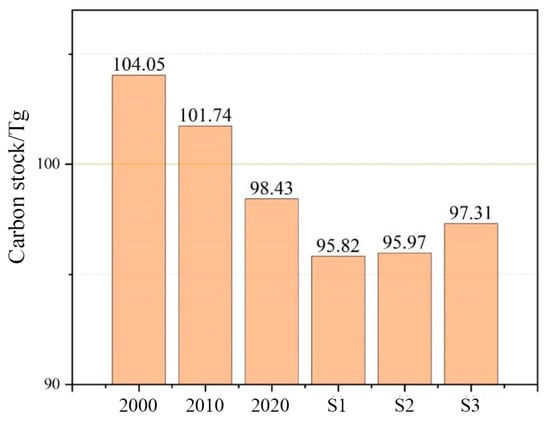
Figure 6.
Carbon stock of three scenarios in the CZX urban agglomeration.
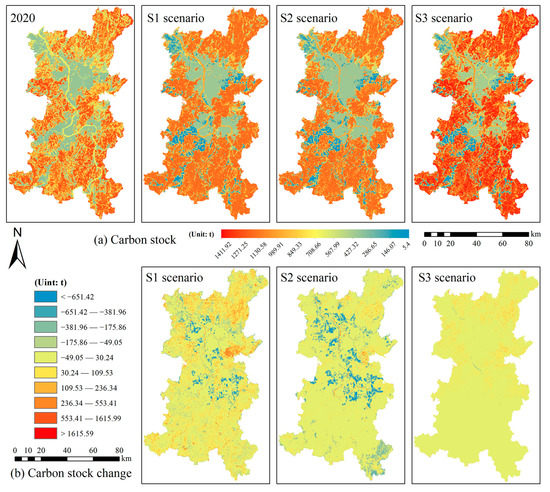
Figure 7.
Carbon stock and its changes under three scenarios in the CZX urban agglomeration.
Figure 7 shows that the spatial distribution of carbon loss under the S1 and S2 scenarios is more dispersed and shows a continuous expansion trend. The area of carbon stock loss under the S1 scenario is concentrated in the main urban area of Zhuzhou, Jiuhua district of Xiangtan, and the northwest and south of the main urban area of Changsha. There are scattered carbon stock losses in other regions, and the overall distribution of carbon losses is more dispersed. Compared with the S1 scenario, the carbon loss under the S2 scenario is mainly concentrated near the urban built-up area, such as the main urban area of Zhuzhou, Xiangtan County, Jiuhua district of Xiangtan, and the northwest and southeast of the main urban area of Changsha. The growth rate of construction land under the S3 scenario is limited by ecological function land, so the carbon loss is less. The carbon loss is mainly distributed in the northwest and central regions of the study area, and the carbon loss area is less.
In summary, no matter which scenario, the trend of urban-construction-land-expansion caused by urbanization is inevitable. If it is not restricted, it will necssarily affect the land-use structure, resulting in TECS change, which in turn affects sustainable regional development. With the backdrop of global warming and China’s ‘dual-carbon’ goal, estimating the TECS change under different scenarios can provide data support for the realization of the ‘dual-carbon’ goal of the CZX urban agglomeration and Hunan. In addition, results can be proposed for different development needs, so as to provide a reference for the realization of the regional ‘dual-carbon’ goal, in 2060.
5. Discussion
Estimating the TECS caused by land-use changes under different scenarios is the basis for achieving China’s ‘dual-carbon’ goal and optimizing the spatial layout. In the process of rapid urbanization, determining how to reduce the occupation of ecological land such as cultivated land and forest land by urban expansion, maintain the carbon sink capacity of regional terrestrial ecosystem, and construct the livable land spatial layout of ecological environment in the CZX urban agglomeration, requires exploration of the historical development characteristics of regional land-use changes and analysis of the TECS change caused by future possible land-use changes. Due to the fact that land-use changes are a complex and dynamic process, it is difficult to clearly evaluate the evolution process of land-use patterns solely by analyzing the current characteristics of historical land-use changes, which also lacks consideration of future planning objectives. The land-use pattern under different scenarios is also an effective supplement to the analysis of the current situation of land-use changes. It can provide basic data support for regional decision makers’ spatial planning, land policy planning, and the implementation of the ‘dual-carbon’ goal, and make up for the limitation of the existing policy implementation, which is limited to the analysis of historical land-use changes. Our study estimates the carbon loss of terrestrial ecosystems caused by land-use changes from 2000 to 2020 in different scenarios. Results can provide a reference for regional carbon accounting, carbon loss assessment, and the planning and implementation of the ‘dual-carbon’ goal. Compared with the existing research, our study takes into account the mixed land-use structure characteristics, and simulates the continuous structural change of land-use mixture within each cell, which improves the accuracy in estimating the spatio-temporal change of TECS. Taking land-use changes between 2000 and 2020 as an example, TECS changes, with FLUS (a common pure-cell structure CA model) [47] and the MCCA model, are estimated and compared. Results show that the MCCA model demonstrated better performance (MCCA: 0.89; FLUS: 0.85) (Note: the accuracy (i.e., 0.89 and 0.85) refers to the similarity between TECS change estimated by land-use change model and actual TECS change). In addition, the CA model based on mixed land-use structure reduces the physical memory space of simulation data on the one hand (from 30-m to 300-m, the physical memory space is reduced by 100 times), while on the other hand, it reduces the computational power of the model while retaining the detailed information of land-use change, and has certain advantages in simulation performance and simulation accuracy. Although the results have well-estimated the TECS change under different scenarios, there are still some limitations: (1) Land-use change is a complex, dynamic process. The coupling between the existing scenario setting and the existing land-use planning policy in the study area needs to be further clarified, and will be further integrated into modelling in future research. (2) There is a certain subjectivity in the selection of spatial variables and the setting of model parameters. Most of them are based on previous studies [35,47,48], and the parameters should be constantly adjusted according to regional characteristics to determine the optimal parameters. (3) At present, the estimation of TECS is mainly based on surface survey, model simulation, and remote sensing estimation [3,49]. The accuracy of surface survey is high, but the cost is huge. Remote sensing estimation data is a new direction of current research [50], but the accuracy and spatial resolution of remote sensing data will affect the results. The InVEST model is a commonly-used method in model simulation: it has easily obtained data and has high accuracy. However, it ignores the impact of vegetation types and vegetation growth on carbon density change. Additionally, the carbon density data in our study lacks verification of field measurement data, and the time effect of carbon density change is ignored. In the next step, multi-model fusion [51] is needed to revise the carbon density data of land-use types, in order to improve the accuracy of carbon density estimation.
6. Conclusions
Considering the mixed structure of land-use changes, our study uses the MCCA model to simulate the mixed land-use structure pattern under multi-scenarios in the CZX urban agglomeration in 2030, based on the historical land-use pattern in 2000, 2010, and 2020. Based on this, and combined with the InVEST model, the variation characteristics of TECS under different scenarios in the study area are estimated. The conclusions are as follows:
- (1)
- The TECS of the CZX urban agglomeration in 2000, 2010, and 2020 were 104.05 Tg, 101.74 Tg, and 98.43 Tg, respectively. The carbon stock decreased between 2000 and 2010, and the reduction rate between 2010 and 2020 eased slightly.
- (2)
- The simulated land-use pattern under the three scenarios in 2030 is spatially different. Under the inertial development scenario, the urban expansion is more intense, at 1.34 times and 2.05 times that of each of the cultivated land protection scenario and the ecological priority scenario, and the loss of cultivated land and forest land is more serious. Under the cultivated land protection scenario, the loss of cultivated land area is only 0.75 km2, and cultivated land protection is well implemented. Under the ecological priority scenario, the ecological land is well protected, and the loss of forest land and grassland is only 0.53 times and 0.56 times that of the inertial development scenario and the cultivated land protection scenario, which well reflects the role of ecological constraints. There is no significant difference in the area changes of wetlands and water bodies in any of the three scenarios. It has become a consensus to protect water resources such as wetlands and water bodies under the auspices of ecological civilization.
- (3)
- The TECS in the study area is different in the third scenario. The carbon storage under the inertial development scenario, the cultivated land protection scenario, and the ecological priority scenario, are 95.82 Tg, 95.97 Tg, and 97.31 Tg, respectively, which are 2.61 Tg, 2.46 Tg, and 1.12 Tg lower than that in 2020. Spatially, the distribution of the inertia development scenario and the cultivated land protection scenario are more dispersed and showa continuous expansion trend. Under the ecological protection scenario, the growth rate of construction land is limited by ecological function land, and the carbon loss is less and is concentrated in a specific small area.
Author Contributions
Conceptualization, W.W.; methodology, J.H., D.Y. and W.W.; software, D.Y.; validation, J.H., D.Y. and W.W.; formal analysis, J.H. and D.Y.; investigation, W.W.; resources, W.W.; data curation, W.W.; writing—original draft preparation, J.H. and D.Y.; writing—review and editing, W.W.; visualization, W.W.; supervision, W.W.; project administration, W.W.; funding acquisition, W.W. All authors have read and agreed to the published version of the manuscript.
Funding
This study was supported by National Natural Science Foundation of China (42201470).
Data Availability Statement
The datasets used and/or analysed during the current study are available from the corresponding author on reasonable request.
Conflicts of Interest
The authors declare no conflict of interest.
References
- Figueres, C.; Schellnhuber, H.J.; Whiteman, G.; Rockstrom, J.; Hobley, A.; Rahmstorf, S. Three years to safeguard our climate. Nature 2017, 546, 593–595. [Google Scholar] [CrossRef]
- Fu, B.; Li, B.; Gasser, T.; Tao, S.; Xu, J. The contributions of individual countries and regions to the global radiative forcing. Proc. Natl. Acad. Sci. USA 2021, 118, e2018211118. [Google Scholar] [CrossRef] [PubMed]
- Piao, S.; He, Y.; Wang, X.; Chen, F. Estimating carbon sinks in terrestrial ecosystems in China: Methods, progress, and prospects. Sci. Sin. (Terrae) 2022, 52, 11. (In Chinese) [Google Scholar]
- Xi, J. Address to the General Debate of the Seventy-Fifth Session of the United Nations General Assembly. Bulletin of The State Council of the People’s Republic of China. 2020. Available online: https://baijiahao.baidu.com/s?id=1678546728556033497&wfr=spider&for=pc (accessed on 23 September 2020).
- Ding, M.; Yang, X.; Zhao, R.; Zhang, Z.; XIao, L.; Xie, Z. Optimization of territorial space pattern under the goal of carbo neutrality: Theoretical framework and practical strategy. J. Nat. Resour. 2022, 37, 1137–1147. (In Chinese) [Google Scholar]
- Zhang, P.; Li, Y.; Yin, H.; Chen, Q.; Dong, Q.; Zhu, L. Spatio-temporal variation and dynamic simulation of ecosystem carbon storage in the north-south transitional zone of China. J. Nat. Resour. 2022, 5, 1183–1197. (In Chinese) [Google Scholar] [CrossRef]
- Chang, X.; Xing, Y.; Wang, J.; Yang, H.; Gong, W. Effects of land use and cover change (LUCC) on terrestrial carbon stocks in China between 2000 and 2018. Resour. Conserv. Recycl. 2022, 182, 106333. [Google Scholar] [CrossRef]
- Li, J.; Gong, J.; Guldmann, J.; Li, S.; Zhu, J. Carbon Dynamics in the Northeastern Qinghai–Tibetan Plateau from 1990 to 2030 Using Landsat Land Use/Cover Change Data. Remote Sens. 2020, 12, 528. [Google Scholar] [CrossRef]
- Zhang, D.; Zhao, Y.; Wu, J. Assessment of carbon balance attribution and carbon storage potential in China’s terrestrial ecosystem. Resour. Conserv. Recycl. 2023, 189, 106748. [Google Scholar] [CrossRef]
- Wu, W.; Xu, L.; Zheng, H.; Zhang, X. How much carbon storage will the ecological space leave in a rapid urbanization area? Scenario analysis from Beijing-Tianjin-Hebei Urban Agglomeration. Resour. Conserv. Recycl. 2023, 189, 106774. [Google Scholar] [CrossRef]
- Lai, L.; Huang, X.; Yang, H.; Chuai, X.; Zhang, M.; Zhong, T.; Chen, Z.; Chen, Y.; Wang, X.; Thompson, J.R. Carbon emissions from land-use change and management in China between 1990 and 2010. Sci. Adv. 2016, 2, e1601063. [Google Scholar] [CrossRef] [PubMed]
- Piao, S.; Fang, J.; Ciais, P.; Peylin, P.; Huang, Y.; Sitch, S.; Wang, T. The carbon balance of terrestrial ecosystems in China. Nature 2009, 458, 1009–1013. [Google Scholar] [CrossRef] [PubMed]
- Li, Y.; Liu, W.; Feng, Q.; Zhu, M.; Yang, L.; Zhang, J. Effects of land use and land cover change on soil organic carbon storage in the Hexi regions, Northwest China. J. Environ. Manag. 2022, 312, 114911. [Google Scholar] [CrossRef] [PubMed]
- Zhang, B.; Li, L.; Xia, Q.; Dong, J. Land use change and its impact on carbon storage under the constraints of “three lines”: A case study of Wuhan city circle. Acta Ecol. Sin. 2022, 42, 2265–2280. [Google Scholar]
- Chen, G.; Li, X.; Liu, X. Global land projection based on plant functional types with a 1-km resolution under socio-climatic scenarios. Sci. Data 2022, 9, 125. [Google Scholar] [CrossRef]
- Wu, S.; Hu, S.; Frazier, A.E.; Hu, Z. China’s urban and rural residential carbon emissions: Past and future scenarios. Resour. Conserv. Recycl. 2023, 190, 106802. [Google Scholar] [CrossRef]
- Temmink, R.J.M.; Lamers, L.P.M.; Angelini, C.; Bouma, T.J.; Fritz, C.; van de Koppel, J.; Lexmond, R.; Rietkerk, M.; Silliman, B.R.; Joosten, H.; et al. Recovering wetland biogeomorphic feedbacks to restore the world’s biotic carbon hotspots. Science 2022, 376, eabn1479. [Google Scholar] [CrossRef] [PubMed]
- Hong, S.; Yin, G.; Piao, S.; Dybzinski, R.; Cong, N.; Li, X.; Wang, K.; Peuelas, J.; Zeng, H.; Chen, A. Divergent responses of soil organic carbon to afforestation. Nat. Sustain. 2020, 3, 694–700. [Google Scholar] [CrossRef]
- Piao, S.; Huang, M.; Liu, Z.; Wang, X.; Ciais, P.; Canadell, J.G.; Wang, K.; Bastos, A.; Friedlingstein, P.; Houghton, R.A.; et al. Lower land-use emissions responsible for increased net land carbon sink during the slow warming period. Nat. Geosci. 2018, 11, 739–743. [Google Scholar]
- Li, X.; Zhou, Y.; Hejazi, M.; Wise, M.; Vernon, C.; Iyer, G.; Chen, W. Global urban growth between 1870 and 2100 from integrated high resolution mapped data and urban dynamic modeling. Commun. Earth Environ. 2021, 2, 201. [Google Scholar] [CrossRef]
- Liu, Y.; Xi, M.; Zhang, X.; Yu, Z.; Kong, F. Carbon storage distribution characteristics of wetlands in China and its influencing factors. Chin. J. Appl. Ecol. 2019, 30, 2481–2489. (In Chinese) [Google Scholar]
- Zeng, L.; Liu, X.; Li, W.; Ou, J.; Cai, Y.; Chen, G.; Li, M.; Li, G.; Zhang, H.; Xu, X. Global simulation of fine resolution land use/cover change and estimation of aboveground biomass carbon under the shared socioeconomic pathways. J. Environ. Manag. 2022, 312, 114943. [Google Scholar] [CrossRef] [PubMed]
- Liu, X.; Li, X.; Liang, X.; Shi, H.; Ou, J. Simulating the change of terrestrial carbon storage in China based on the FLUS-InVEST model. Trop. Geogr. 2019, 39, 397–409. [Google Scholar]
- Wang, W.; Jiao, L.; Jia, Q.; Liu, J.; Mao, W.; Xu, Z.; Li, W. Land use optimization modelling with ecological priority perspective for large-scale spatial planning. Sustain. Cities Soc. 2021, 65, 102575. [Google Scholar] [CrossRef]
- Tang, L.; Ke, X.; Chen, Y.; Wang, L.; Zhou, Q.; Zheng, W.; Xiao, B. Which impacts more seriously on natural habitat loss and degradation? Cropland expansion or urban expansion? Land Degrad. Dev. 2021, 32, 946–964. [Google Scholar] [CrossRef]
- van Vliet, J. Direct and indirect loss of natural area from urban expansion. Nat. Sustain. 2019, 2, 755–763. [Google Scholar] [CrossRef]
- Chen, G.; Li, X.; Liu, X.; Chen, Y.; Liang, X.; Leng, J.; Xu, X.; Liao, W.; Qiu, Y.A.; Wu, Q.; et al. Global projections of future urban land expansion under shared socioeconomic pathways. Nat. Commun. 2020, 11, 537. [Google Scholar] [CrossRef]
- Zhai, H.; Lv, C.; Liu, W.; Yang, C.; Fan, D.; Wang, Z.; Guan, Q. Understanding Spatio-Temporal Patterns of Land Use/Land Cover Change under Urbanization in Wuhan, China, 2000–2019. Remote Sens. 2021, 13, 3331. [Google Scholar] [CrossRef]
- Chen, L.; Cai, H.; Zhang, T.; Zhang, X.; Zeng, H. Land use multi-scenario simulation analysis of Rao River basin based on Marlov-FLUS model. Acta Ecol. Sin. 2022, 42, 3947–3958. [Google Scholar]
- Tian, L.; Tao, Y.; Fu, W.; Li, T.; Ren, F.; Li, M. Dynamic simulation of land use/cover change and assessment of forest ecosystem carbon storage under climate change scenarios in Guangdong province, China. Remote Sens. 2022, 14, 2330. [Google Scholar] [CrossRef]
- Zhu, W.; Zhang, J.; Cui, Y.; Zheng, H.; Zhu, L. Assessment of territorial ecosystem carbon storage based on land use change scenario: A case study in Qihe River Basin. Acta Geogr. Sin. 2019, 74, 446–459. (In Chinese) [Google Scholar]
- Nie, X.; Lu, B.; Chen, Z.; Yang, Y.; Chen, S.; Chen, Z.; Wang, H. Increase or decrease? Integrating the CLUMondo and InVEST models to assess the impact of the implementation of the Major Function Oriented Zone planning on carbon storage. Ecol. Indic. 2020, 118, 106708. [Google Scholar] [CrossRef]
- Liang, X.; Guan, Q.; Clarke, K.C.; Liu, S.; Wang, B.; Yao, Y. Understanding the drivers of sustainable land expansion using a patch-generating land use simulation (PLUS) model: A case study in Wuhan, China. Comput. Environ. Urban Syst. 2021, 85, 101569. [Google Scholar] [CrossRef]
- Verburg, P.H.; Soepboer, W.; Veldkamp, A. Modeling the spatial dynamics of regional land use: The CLUE-S model. Environ. Manag. 2002, 30, 391. [Google Scholar] [CrossRef] [PubMed]
- Liang, X.; Guan, Q.; Clarke, K.C.; Chen, G.; Guo, S.; Yao, Y. Mixed-cell cellular automata: A new approach for simulating the spatio-temporal dynamics of mixed land use structures. Landsc. Urban Plan. 2021, 205, 103960. [Google Scholar] [CrossRef]
- Kapitza, S.; Golding, N.; Wintle, B.A. A fractional land use change model for ecological applications. Environ. Model. Softw. 2022, 147, 105258. [Google Scholar] [CrossRef]
- Wu, X.; Liu, X.; Zhang, D.; Zhang, J.; He, J.; Xu, X. Simulating mixed land-use change under multi- label concept by integrating a convolutional neural network and cellular automata: A case study of Huizhou, China. GISci. Remote Sens. 2022, 29, 609–632. [Google Scholar] [CrossRef]
- Wang, W.; Jiao, L.; Dong, T.; Xu, Z.; Xu, G. Simulating urban dynamics by coupling top-down and bottom-up strategies. Int. J. Geogr. Inf. Sci. 2019, 33, 2259–2283. [Google Scholar] [CrossRef]
- Wang, W.; Jiao, L.; Zhang, W.; Jia, Q.; Su, F.; Xu, G.; Ma, S. Delineating urban growth boundaries under multi-objective and constraints. Sustain. Cities Soc. 2020, 61, 102279. [Google Scholar] [CrossRef]
- Cui, W.; Cai, L.; Zhang, T.; Xi, H.; Yang, F.; Chen, M. Ecological security assessment and multi-scenario simulation analysis of Zhejiang Greater Bay Area based on LUCC. Acta Ecol. Sin. 2022, 42, 2136–2148. (In Chinese) [Google Scholar]
- Yao, Y.; Liu, X.; Li, X.; Liu, P.; Hong, Y.; Zhang, Y.; Mai, K. Simulating urban land-use changes at a large scale by integrating dynamic land parcel subdivision and vector-based cellular automata. Int. J. Geogr. Inf. Sci. 2017, 31, 2452–2479. [Google Scholar] [CrossRef]
- Feng, Y.; Chen, S.; Tong, X.; Lei, Z.; Gao, C.; Wang, J. Modeling changes in China’s 2000–2030 carbon stock caused by land use change. J. Clean. Prod. 2020, 252, 119659. [Google Scholar] [CrossRef]
- Zhu, G.; Qiu, D.; Zhang, Z.; Sang, L.; Liu, Y.; Wang, L.; Zhao, K.; Ma, H.; Xu, Y.; Wan, Q. Land-use changes lead to a decrease in carbon storage in arid region, China. Ecol. Indic. 2021, 127, 107770. [Google Scholar] [CrossRef]
- Zhu, L.; Song, R.; Sun, S.; Li, Y.; Hu, K. Land use/land cover change and its impact on ecosystem carbon storage in coastal areas of China from 1980 to 2050. Ecol. Indic. 2022, 142, 109178. [Google Scholar] [CrossRef]
- Dai, Y. A Study on Evolution and Optimization of Land Ecosystem Services in Hunan Province; China University of Geosciences: Wuhan, China, 2019. [Google Scholar]
- Xi, X.; Zhang, J.; Liao, Q.; Chen, D.; Bai, R.; Huang, Z. Multi-purpose regional geochemical survey and soil carbon reserves problem: Examples of Jiangsu, Henan, Sichuan, Jilin Provinces and Inner Mongolia. Quatennary Sci. 2008, 28, 58–67. [Google Scholar]
- Liu, X.; Liang, X.; Li, X.; Xu, X.; Ou, J.; Chen, Y.; Li, S.; Wang, S.; Pei, F. A future land use simulation model (FLUS) for simulating multiple land use scenarios by coupling human and natural effects. Landsc. Urban Plan. 2017, 168, 94–116. [Google Scholar] [CrossRef]
- Zhou, S.; Peng, L. Integrating a mixed-cell cellular automata model and Bayesian belief network for ecosystem services optimization to guide ecological restoration and conservation. Land Degrad. Dev. 2022, 33, 1579–1595. [Google Scholar] [CrossRef]
- Kang, F.; Li, X.; Du, H.; Mao, F.; Zhou, G.; Xu, Y.; Huang, Z.; Ji, J.; Wang, J. Spatiotemporal Evolution of the Carbon Fluxes from Bamboo Forests and their Response to Climate Change Based on a BEPS Model in China. Remote Sens. 2022, 14, 366. [Google Scholar] [CrossRef]
- Li, Y.; Han, N.; Li, X.; Du, H.; Mao, F.; Cui, L.; Liu, T.; Xing, L. Spatiotemporal Estimation of Bamboo Forest Aboveground Carbon Storage Based on Landsat Data in Zhejiang, China. Remote Sens. 2018, 10, 898. [Google Scholar] [CrossRef]
- Xu, L.; Yu, G.; He, N. Changes of soil organic carbon storage in Chinese terrestrial ecosystems from the 1980s to the 2010s. Acta Geogr. Sin. 2018, 73, 2150–2167. [Google Scholar]
Disclaimer/Publisher’s Note: The statements, opinions and data contained in all publications are solely those of the individual author(s) and contributor(s) and not of MDPI and/or the editor(s). MDPI and/or the editor(s) disclaim responsibility for any injury to people or property resulting from any ideas, methods, instructions or products referred to in the content. |
© 2023 by the authors. Licensee MDPI, Basel, Switzerland. This article is an open access article distributed under the terms and conditions of the Creative Commons Attribution (CC BY) license (https://creativecommons.org/licenses/by/4.0/).