1. Introduction
The productive utilization of distributed renewable energy and electric vehicles (EVs) is an effective way to reduce the fossil rate of primary energy [
1,
2,
3,
4,
5,
6]. In recent years, the development of charging infrastructure is accelerating due to the rapid popularity of EVs [
7]. However, the current charging stations are mainly DC charging piles with fast charging speeds and high power. When a large number of EVs are connected, it will cause an impact on the power grid in a short time. As the charging demand continues to increase, the charging behavior of EVs will have a greater impact on the power grid [
8,
9,
10]. A quantitative indicator model was established in [
8], which can be used to effectively evaluate the impact of electric vehicles that are connected to the distribution network in the form of V2G on power quality. The impact of electric vehicle charging on the grid can be reduced by, for example, installing energy storage or by optimizing power conversion devices [
9,
10]. In addition, as a typical representative of renewable energy, photovoltaic (PV) power generation is attracting increasing attention [
11,
12,
13,
14]. In the 2021 United Nations Climate Change Conference, the Glasgow Climate Pact, which was aimed at staving off dangerous climate change, was announced. The various ways that it is possible to improve energy efficiency and reduce CO
2 emissions should be considered. By configuring a photovoltaic power generation system into the charging station system, both economic benefits can be gained and energy consumption can be improved. However, it is still a challenge to determine how to ensure that charging efficiency, economic benefits, and reducing the impact on the grid can be accomplished at the same time. If a certain scale of PV generation system and energy storage (ES) system can be configured according to local conditions and combined with charging stations, namely the integrated PV and energy-storage charging station (PES-CS), the above problems will be effectively solved.
The PES-CS is a somewhat asset-heavy investment, so the economic indicator is the main concern [
15,
16,
17]. For a typical PES-CS system, on the one hand, if the photovoltaic capacity configuration is too large, the photovoltaic power generation will not be fully utilized by the EVs; thus, more photovoltaic power will be sent to the grid to earn small fees and more land rent will be wasted. On the other hand, if the photovoltaic capacity configuration is too small, the photovoltaic output will not be able to meet the EV charging demand, which will cause the PES-CS to purchase more electricity from the grid, thus affecting its economics. By properly configuring the size of the energy storage system, the utilization rate of PV can be effectively increased [
15,
17,
18]; at the same time, the distribution capacity and peak power output of PES-CS and its friendliness with the grid can be improved. However, the current cost of batteries is relatively high, accounting for about 55–65% of the cost of ES systems. Furthermore, the charge and discharge times of energy storage restrict its life cycle. The PES-CS is an actual investment project, so the energy storage investment cost should be as low as possible, which is conducive to the payback period of the project investment. From another perspective, energy storage is mainly conducted to cooperate with photovoltaics to maximize the benefits of renewable energy. Therefore, at present, how to rationally allocate capacity and establish an effective economic model is an important issue that needs to be studied.
When considering the optimal capacity allocation of PES-CS, the conventional capacity allocation method mainly aims at the lowest cost, highest benefit and return on investment, and smallest capacity. To improve the power system resilience, an optimal sizing and siting scheme for the battery storage and photovoltaic generation is proposed, and three main objectives are carried out, namely, (1) investment and operation costs; (2) capacity accessibility for electricity demand; and (3) capacity accessibility for non-black-start generating units [
19]. The system value evaluation method for ES is presented in [
20]. However, in the calculation cases, the installed energy storage capacity of the node is provided in advance, and then the system value of energy storage is calculated. In [
21], a sparrow search algorithm (SSA)-based EV charging station with integrated wind power, an energy storage capacity configuration model, and a corresponding operation strategy was introduced, which considered benefits and losses to an extent. Extreme fast charging (XFC) stations integrated with energy storage systems and photovoltaic panels in the distribution networks were presented in [
22]. The Monte Carlo simulation tool was used to estimate the charging demand of XFC stations while considering the EV scale, types of EV models, charging curves, port availability, and maximum waiting time. Moreover, the optimal configuration of multiple XFC stations at the distribution network level was discussed. In [
23], a two-layer optimal configuration model of electric/thermal hybrid energy storage was proposed in a park integrated energy system with respect to battery life loss; it ignores the influence of uncertain factors, such as renewable energy and load. To obtain the optimized comprehensive operation effect, a suitable energy management scheme and model was presented in [
24], which considers the multi-objective optimization problem that has been formulated to minimize the operating cost, pollutant treatment cost, and carbon emissions cost. In particular, when studying the economic benefits and capacity configuration of charging stations, most of the economic models and capacity models are established using assumptions or survey data; they are rarely formed using the practical operating power data of EV charging stations.
In this study, a historical data-driven search algorithm was proposed for building a capacity allocation model for electric vehicle charging stations, which determines the capacity ratio of photovoltaic and energy storage by analyzing historical data and considers a target of maximizing economic benefits. To verify the accuracy of the proposed capacity model, the practical history data of charging stations was used in an actual application scene, and after the proposed configuration was put into operation for three months, the generated data was statistically analyzed. The results show that the proposed capacity allocation model features high efficiency, and it can be applied to evaluate the subsequent economic benefits of the EV charging station effectively.
3. Restrictions
The following factors should be considered for the restrictions, such as the maximum charging power, power balance constraint, photovoltaic power usage, charge and discharge power constraints of ES, ES-rated capacity constraint, and input–output model calculation constraints. The comprehensive constraints can be expressed as follows
where
is the maximum charging power of the charging station,
is the maximum PV generation power,
is the maximum generation power of ES, and
is the maximum distribution power.
is the active load power, and
,
, and
are the active power of the PV generation, ES generation, and active power injected by the grid, respectively.
and
are the instantaneous charging and discharging power of the energy storage system, respectively.
and
are the maximum charging and discharging power of the energy storage system, respectively.
is the charge state of the ES system, and
is the highest charge state of the ES system.
In order to maximize the benefits of the PV system, all PV power is used for charging piles, and the remaining power is stored in the energy storage system. Moreover, to ensure the normal operation of the ES system and prolong its service life, overcharging or over-discharging should be avoided. A fast charging station is a charging place with a certain area and distribution capacity that can be used for the emergency charging of EV conveniently and quickly. The operating cycle of the whole system is set to 10 years, N = 10.
4. The Proposed Capacity Allocation Method
Currently in the charging operation market, especially for the C-side charging market, because it is impossible to effectively predict the accuracy of the charging capacity of a new solar-storage charging station after completion, the charging part will first be built separately. Then, the charging operation data is used to decide whether to add PV and ES equipment or to expand the capacity of the entire charging station to meet the charging demand and improve economic benefits. To verify the feasibility of the revenue model, in this study, the ES and PV were added to an existing charging station. In the verification part, the charging operation data and economic benefit data before and after the increase were compared.
4.1. Main History Data of Charging Station
The open data provided by one of the EV charging operation companies was applied for analysis and processing. The main parameters are shown in
Table 1.
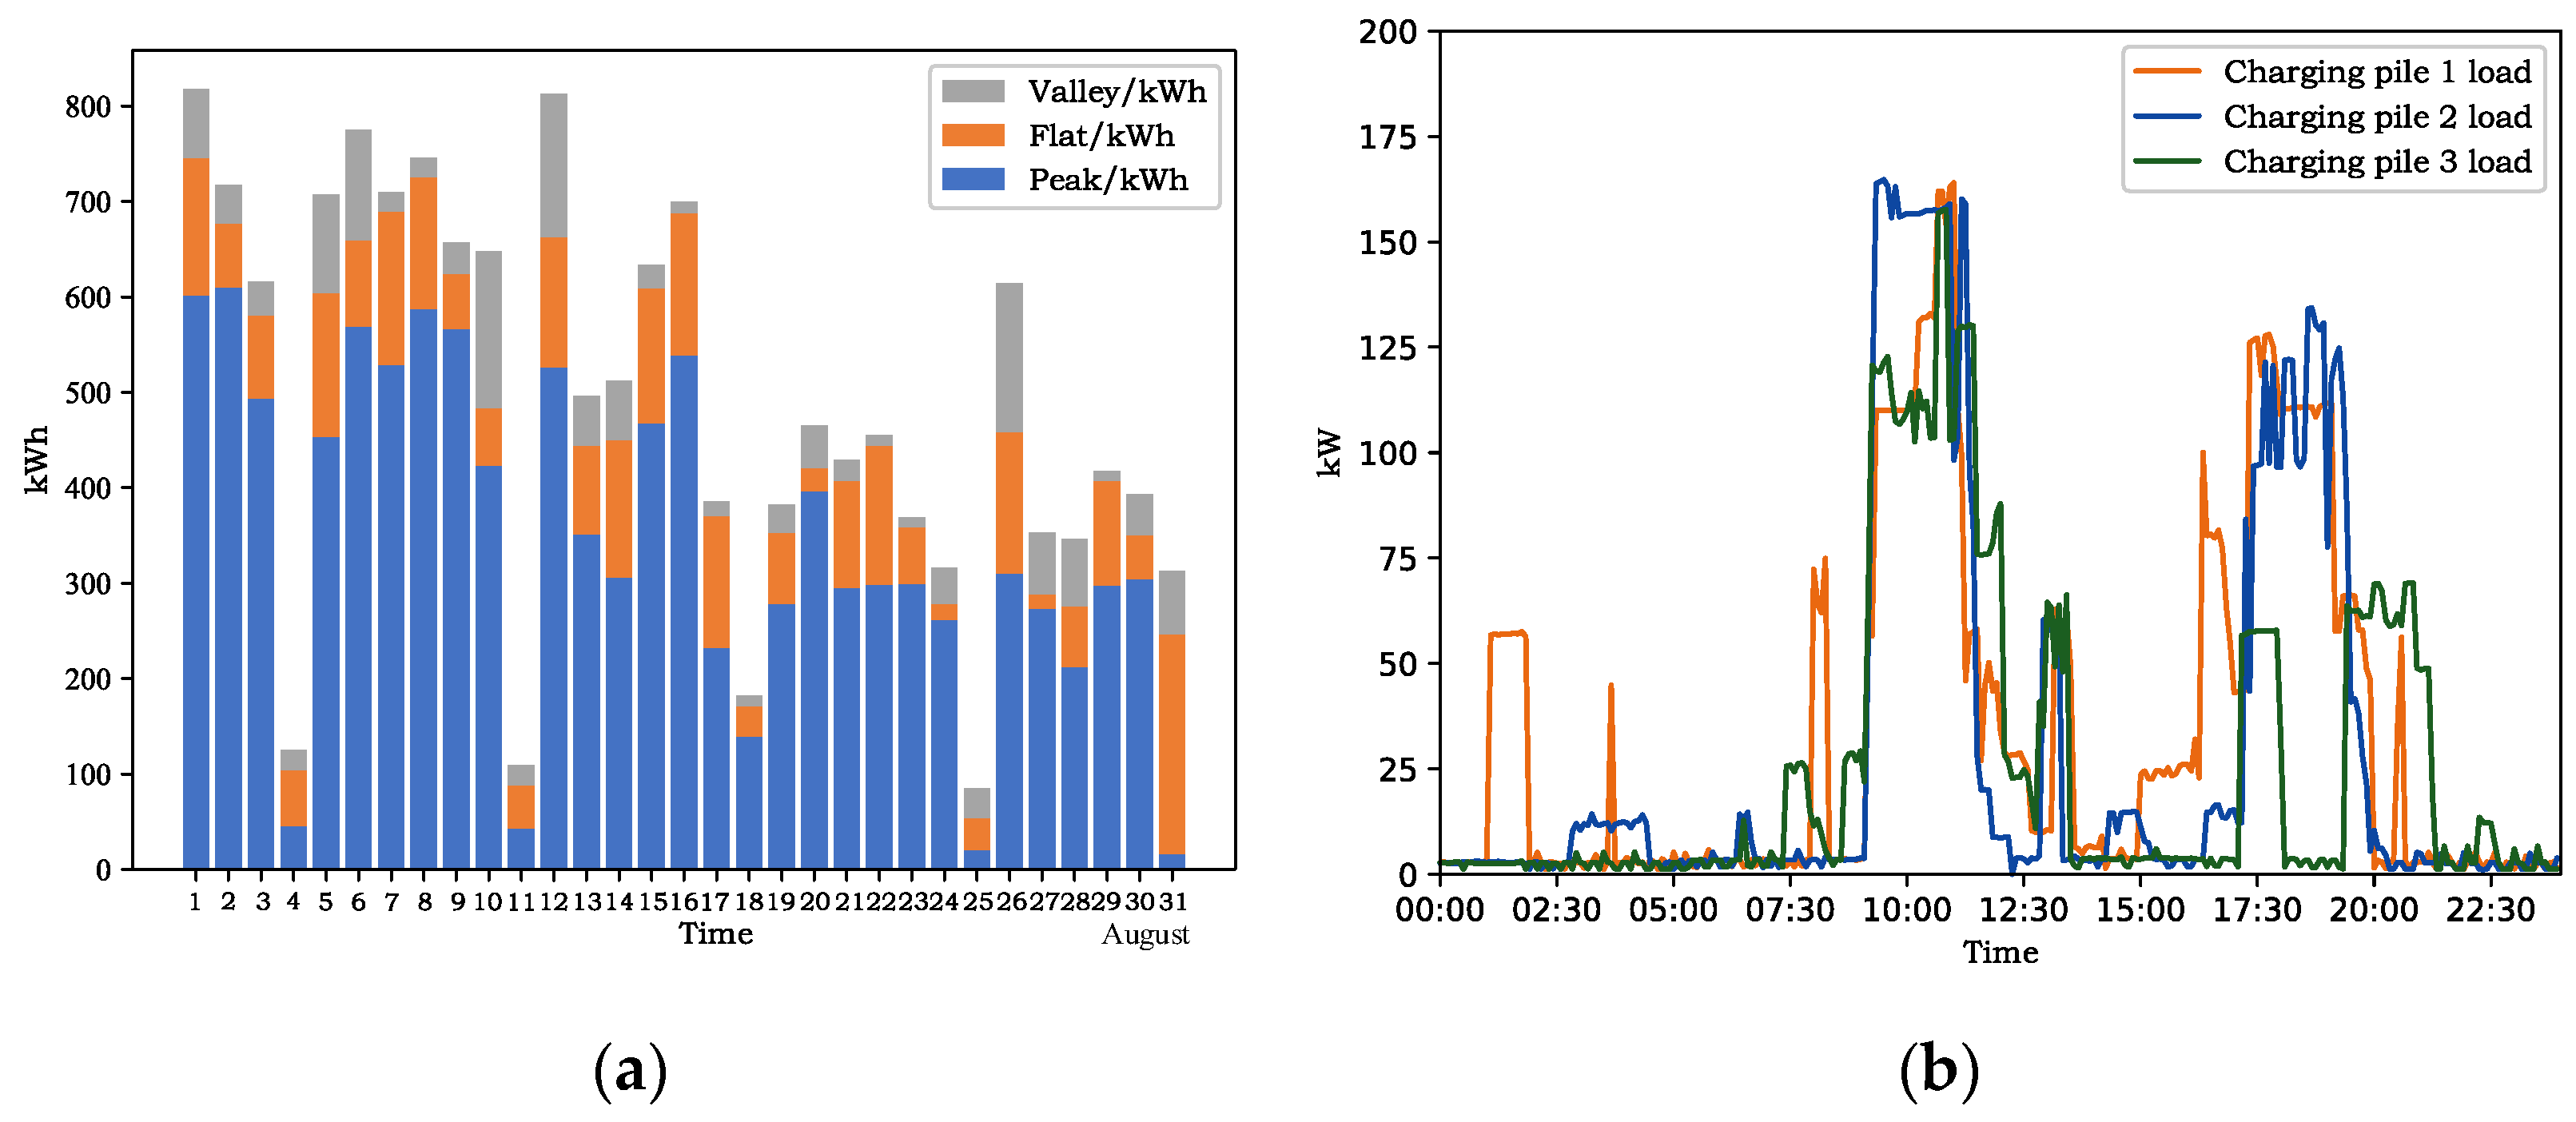
The existing charging data and load curve of the charging station were analyzed, and the required data were visualized after data preprocessing. According to the industrial electricity peak-to-valley electricity price policy, the charging data of a whole month will be counted.
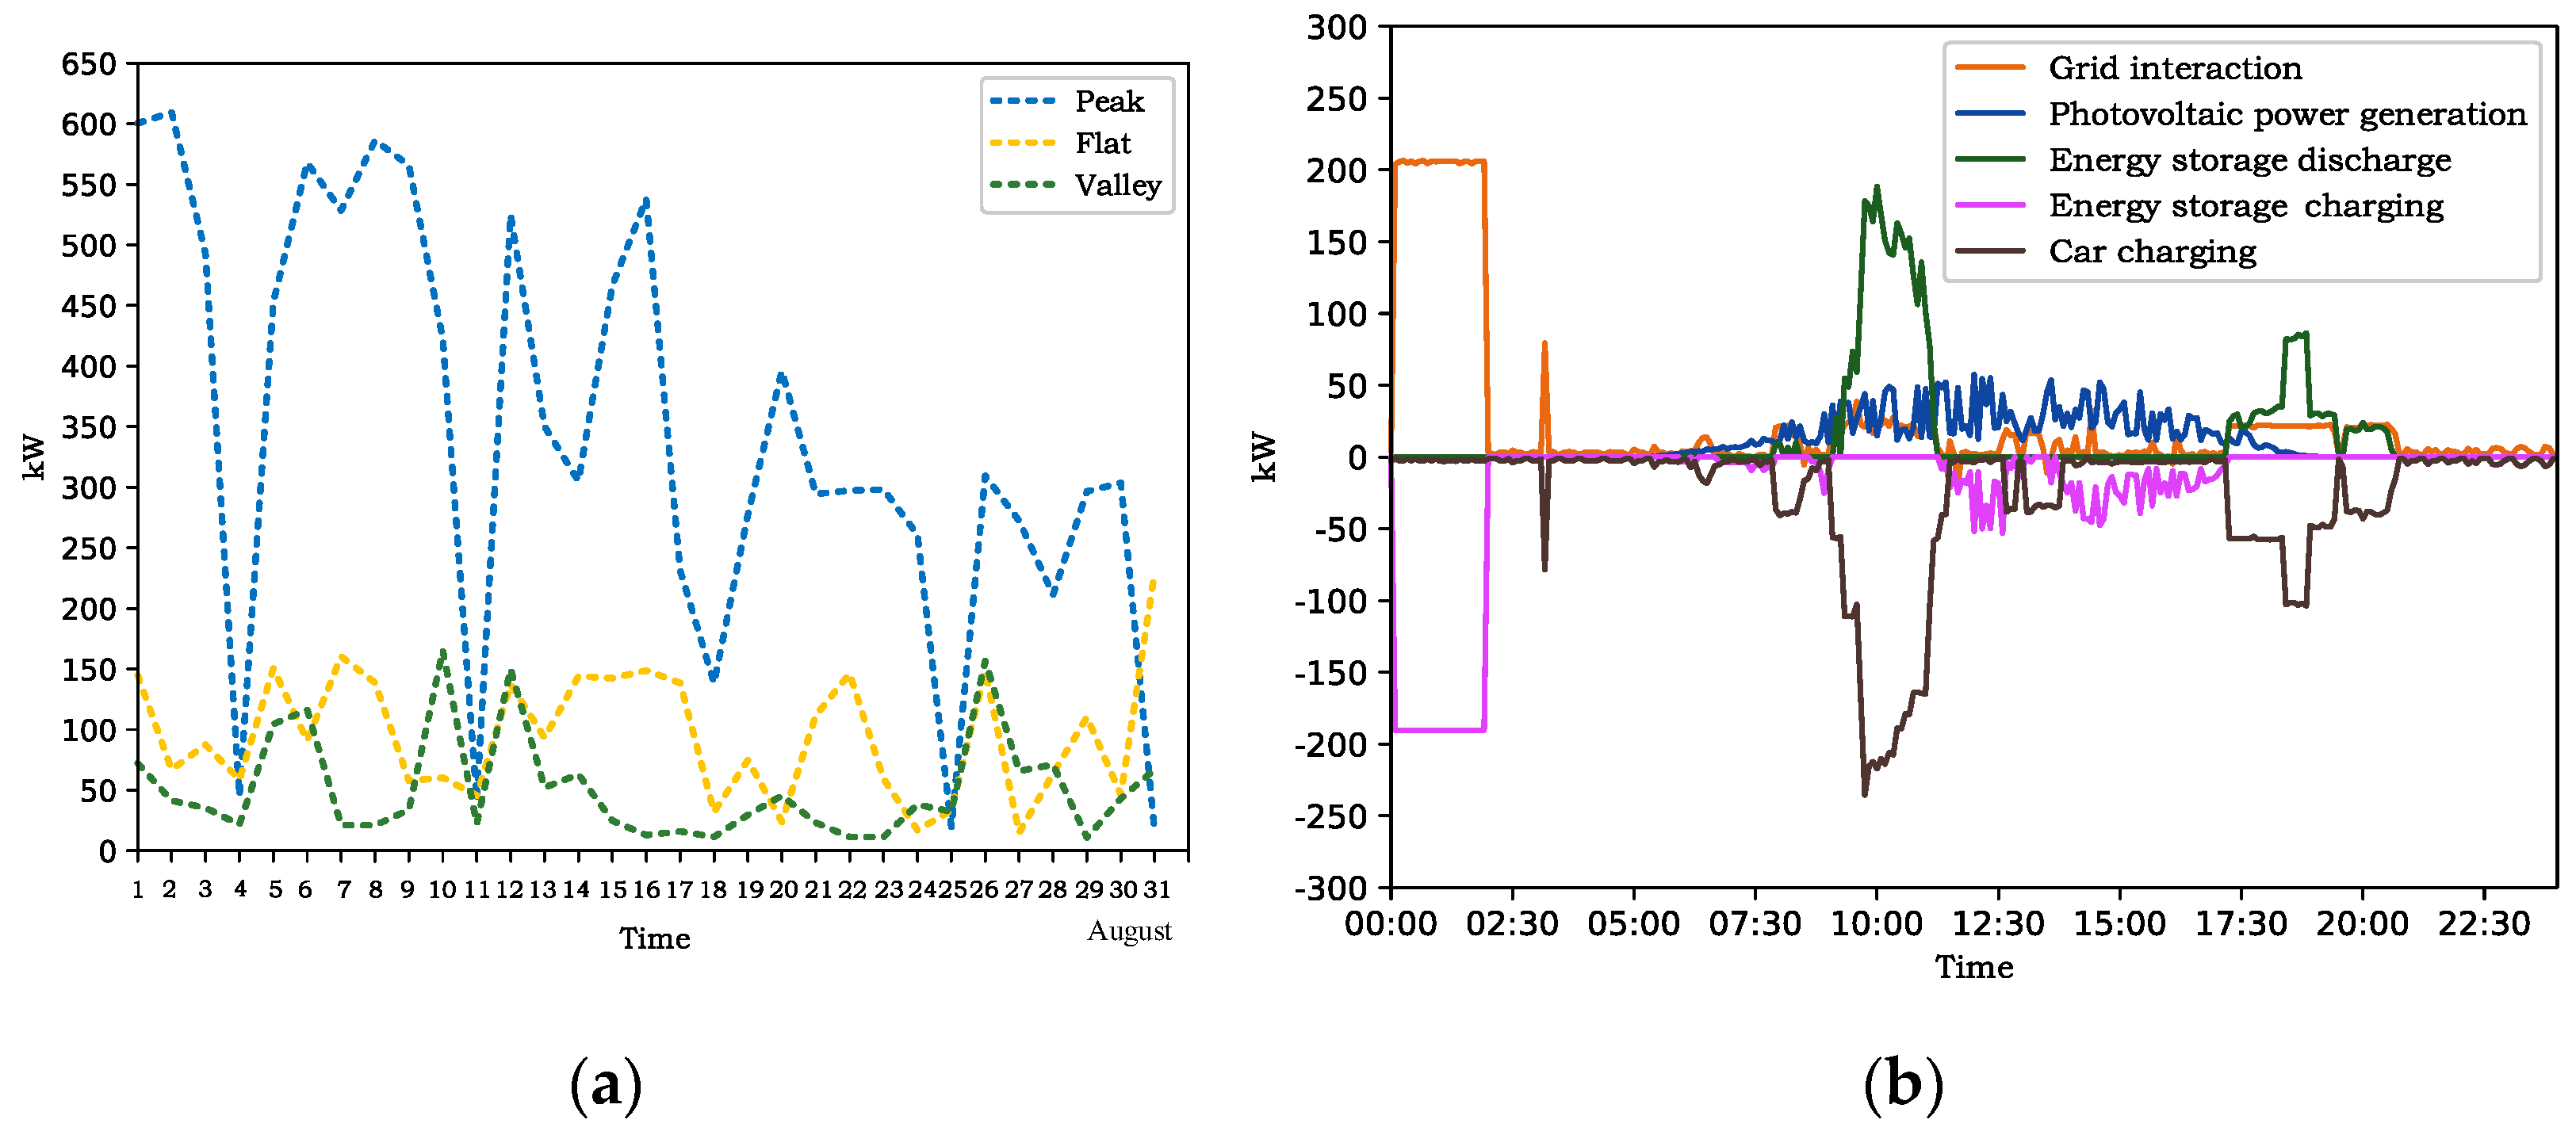
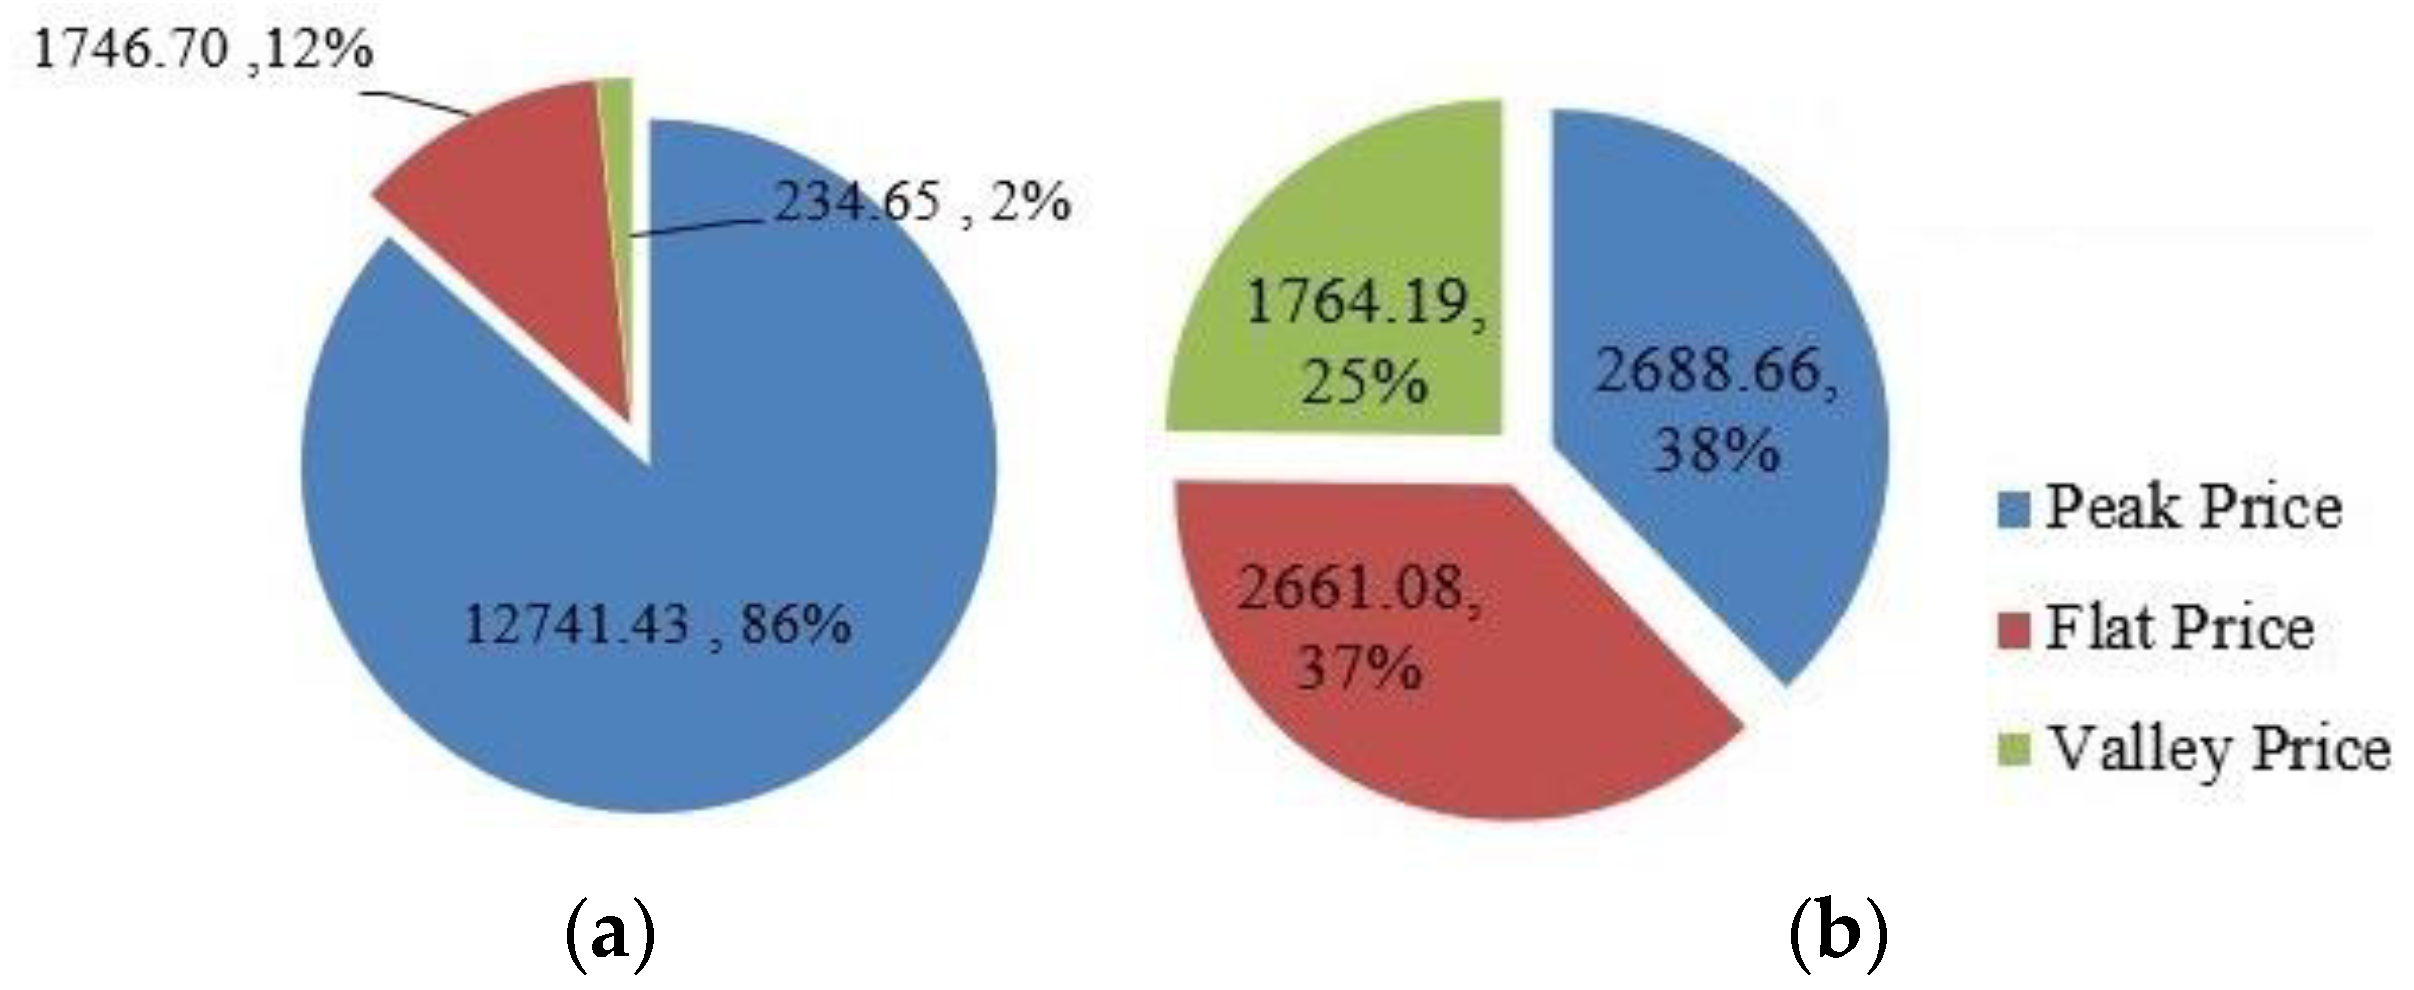
Figure 2a and
Table 2 summarize the daily peak-to-valley electricity consumption and its proportion of the charging station within a month. In
Figure 2, the proportion of the daily peak-to-valley electricity is specifically counted, where the daily peak charging accounts for the majority, the charging capacity is at the peak from Monday to Saturday, and the demand for the charging capacity will decrease on Sunday. The low demand of electricity load on Sunday will have a certain impact on the energy storage and the fixed capacity of the photovoltaic, resulting in a situation where the economic benefit on Sunday is lower than the normal level.
Table 2 specifically lists statistics on the proportion of the charging capacity of the charging pile in the peak-flat-valley period in a month. It can be seen from the table that the monthly charging capacity reached 15,280 kWh, and the peak section consumption accounted for 70.2% of the capacity. It can be seen that the charging station is suitable for peak shaving and valley filling by using the energy storage system. In
Figure 2b, the sampling frequency is 5 min. It can be seen that the maximum charging power point (225.78 kW) and charging peak period appeared at 9:00–12:00 and 17:00–20:00. If the photovoltaic and energy storage are added, the output power can support the charging of the EV, which can effectively relieve grid pressure.
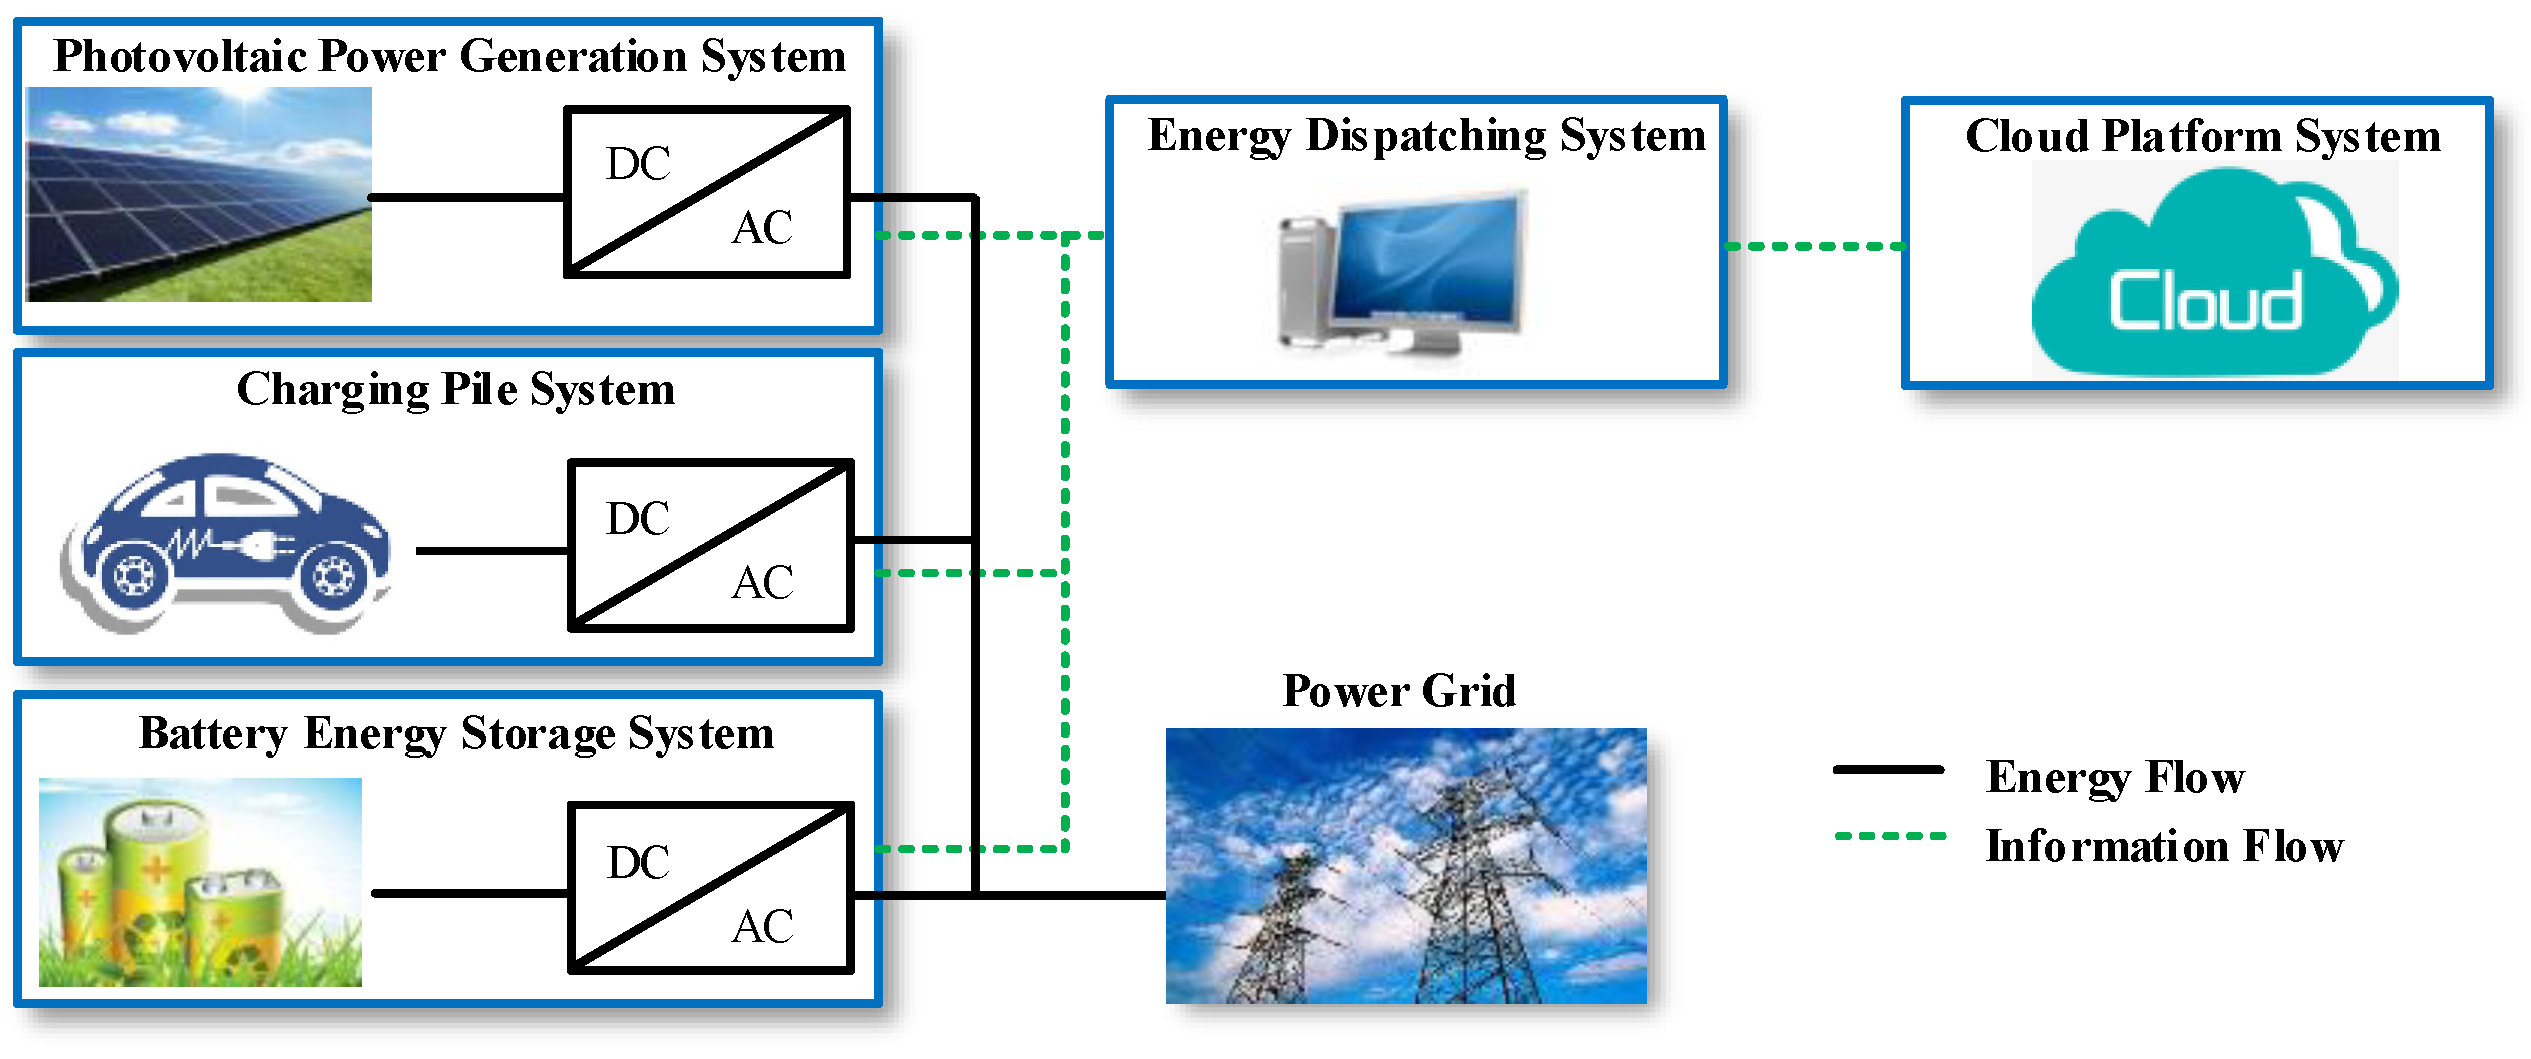
4.2. PES-CS Scheduling Strategy
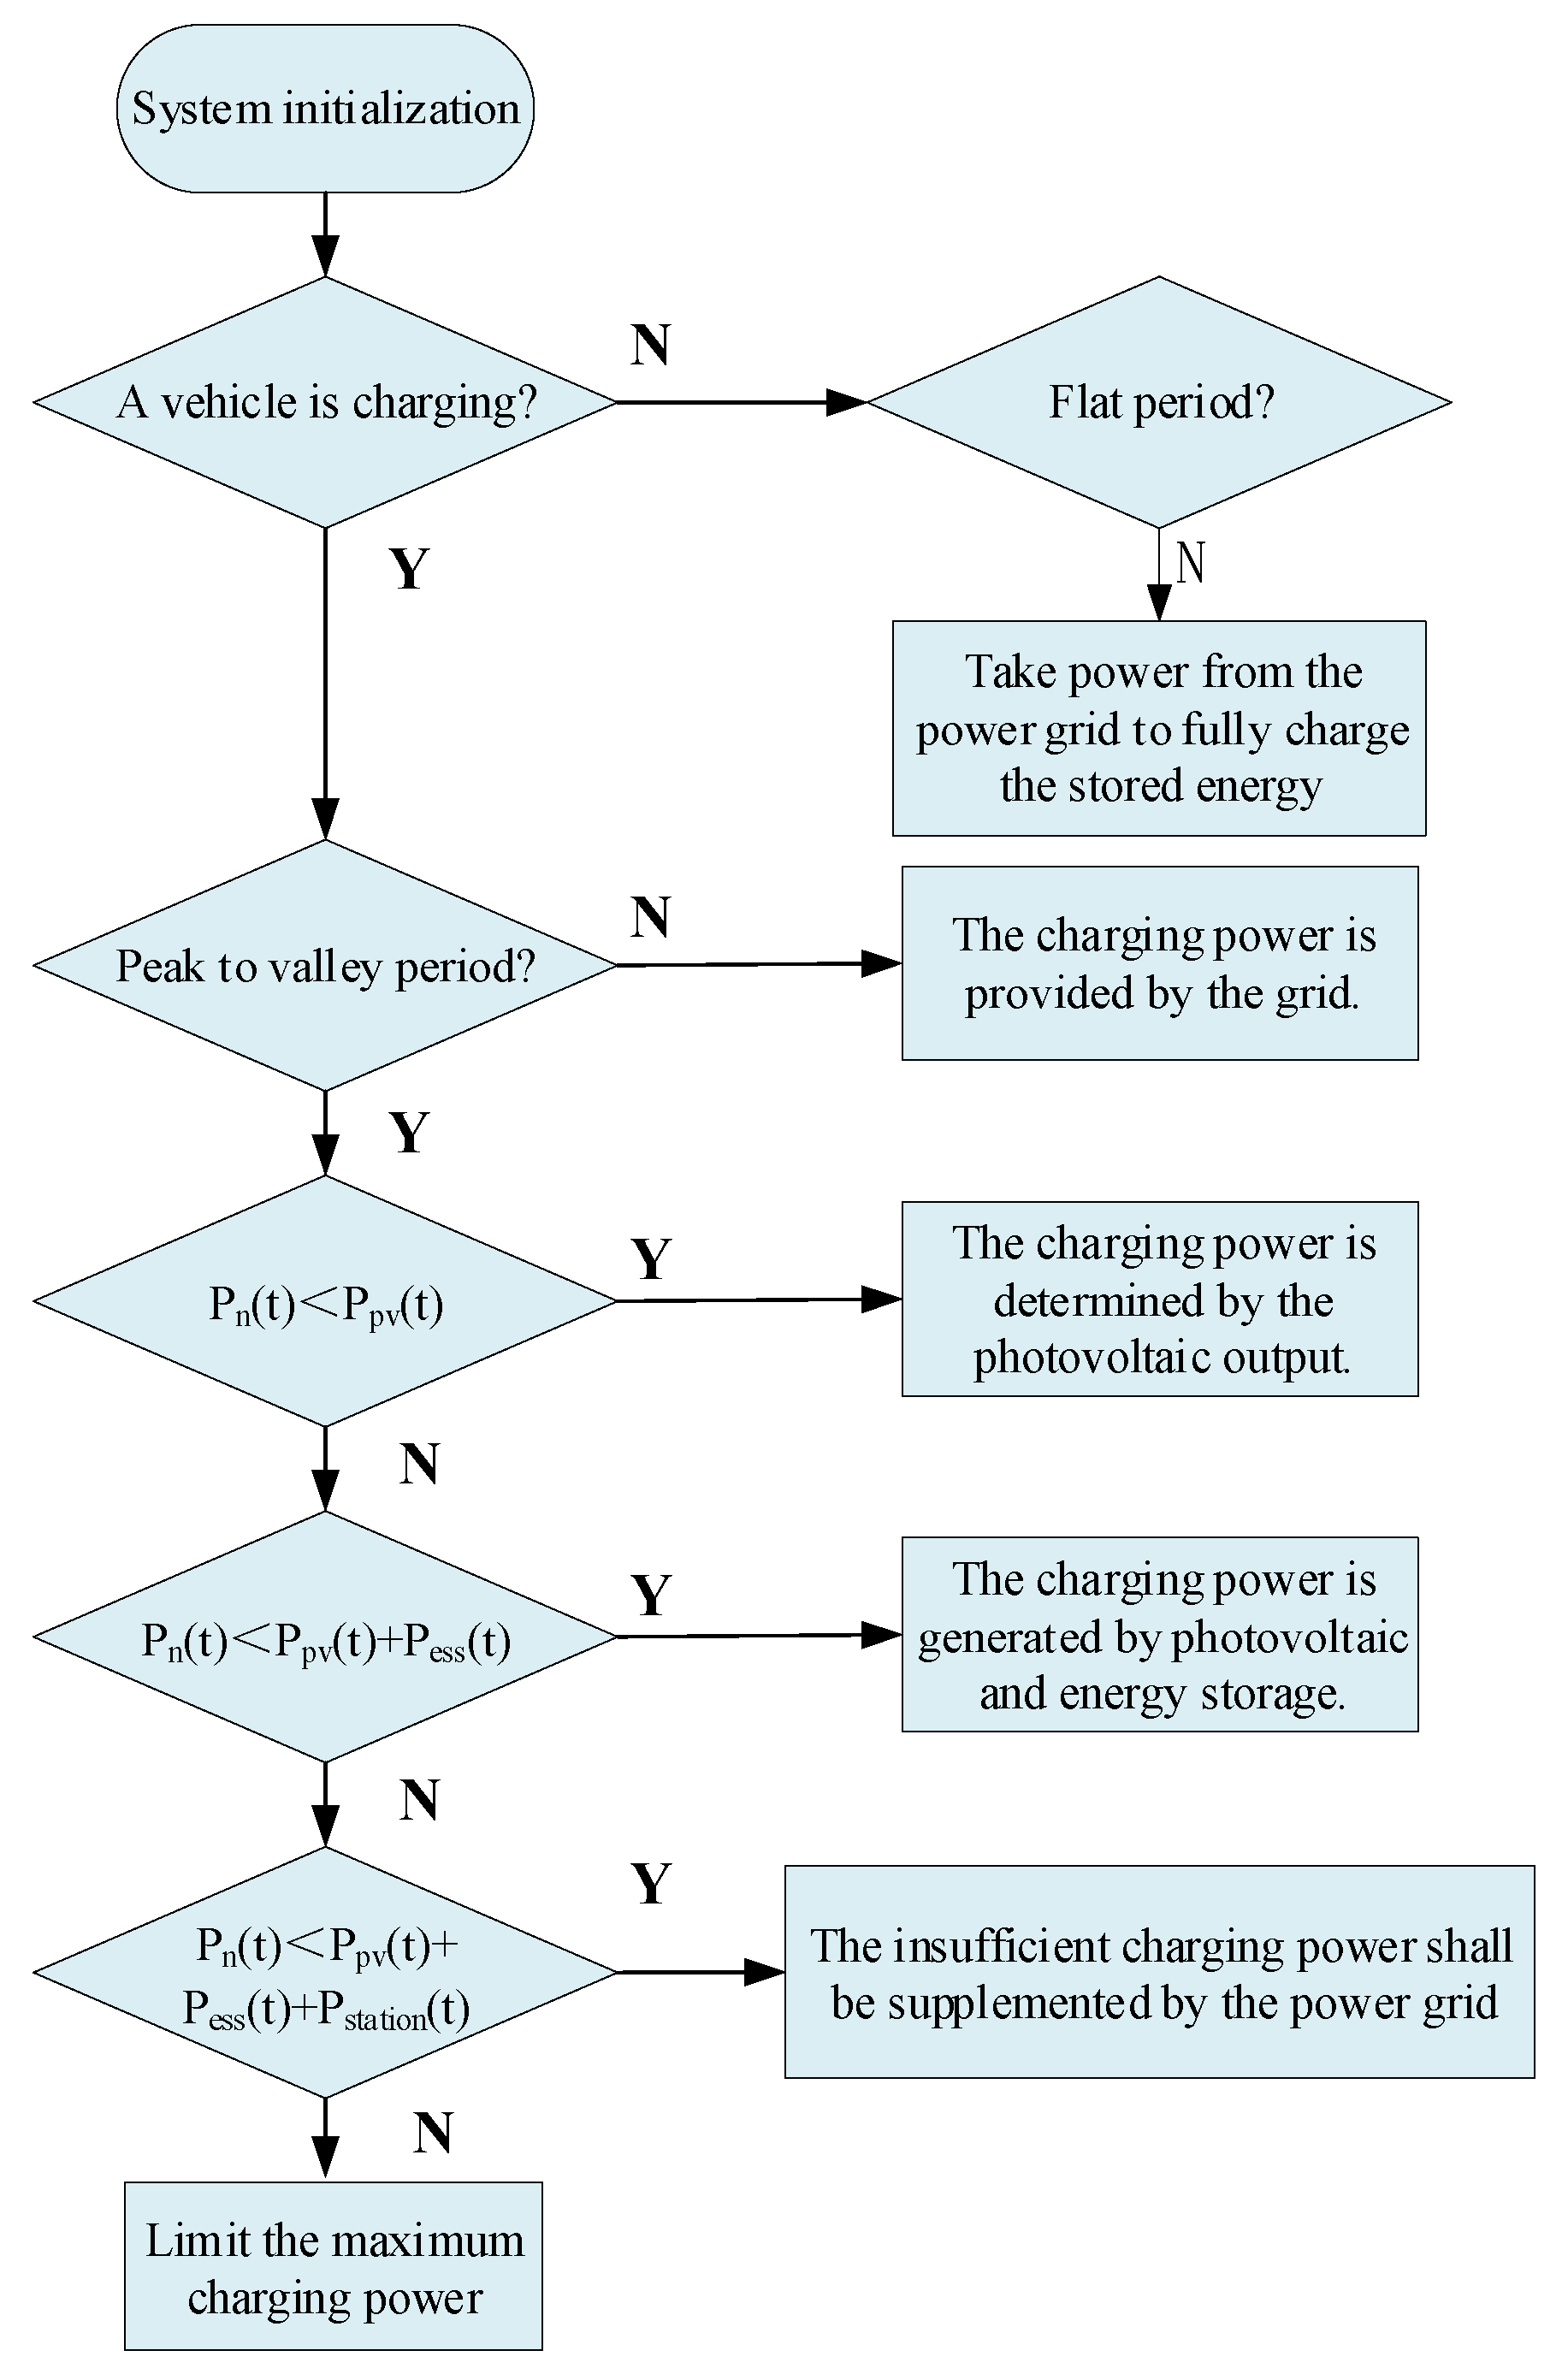
The photovoltaic on-grid price is much lower than the purchase price of the charging station at the peak period. At the same time, in order to maximize the benefits, the process of charging control follows the following principles: ① The PV generation system will give priority to the use of charging piles, and the surplus electricity will be placed into the energy storage battery; then, the surplus electricity will be connected to the grid; ② when the PV generation system cannot meet the charging demand, the power in the energy storage system is given priority when the price of electricity is high, and the power grid is given priority when the price of electricity is low; and ③ the energy storage battery will be charged when there is no vehicle charging in the valley time.
The ES unit adjusts the mismatch between the supply and demand of power generation, reduces PV power abandonment, and at the same time uses the peak and valley electricity price to reasonably dispatch the energy storage system, which improves the economy of the system. However, the whole life cycle economy of the ES system is closely related to its operation control and service life. To quantitatively evaluate the whole life cycle economic benefits of the system, the modeling of the distributed photovoltaic and ES system is studied, and the net present value income of the whole life cycle of the system under different power price schemes, energy storage capacity, and unit capacity cost factors is analyzed. The charging control flow is shown in
Figure 3.
4.3. Initial Configuration for PV and Energy Storage Capacity
Determining the functions of photovoltaic capacity and energy storage capacity based on the big data of charging station operation is a highly complex nonlinear problem. To ensure that meets the financial requirements, it is also necessary to ensure that the value of meets the power design requirements of the station. For such complex problems, the search algorithm has been shown to be effective for finding optimal or near-optimal solutions. Therefore, a search algorithm based on historical data was designed to efficiently explore the solution space of the problem. The solution in the search space was represented by two parameters . The specific steps are described as follows:
Step 1: Determine the PV capacity configuration range: (a) The site area
determines the maximum value of
. Other factors such as temperature, light intensity, ambient temperature, and humidity were not controlled; therefore, these factors are not discussed in this paper. Because the system is equipped with ES, the PV adopts the mode of self-generation and self-use, and its electricity can be completely absorbed. (b) The data of electricity consumption
and
in peak and flat sections should be greater than the daily PV power generation. According to (a) and (b), the installed capacity
range of PV can be determined as
where
is the installation coefficient, generally equaling 1.
For the above existing charging station, the site area is 600 m
2, 60 kWh PV modules can be installed, and the daily average
is (10718 kWh + 2979 kWh)/31 = 441.8 kWh. It can be seen from the above analysis that the maximum PV installation capacity
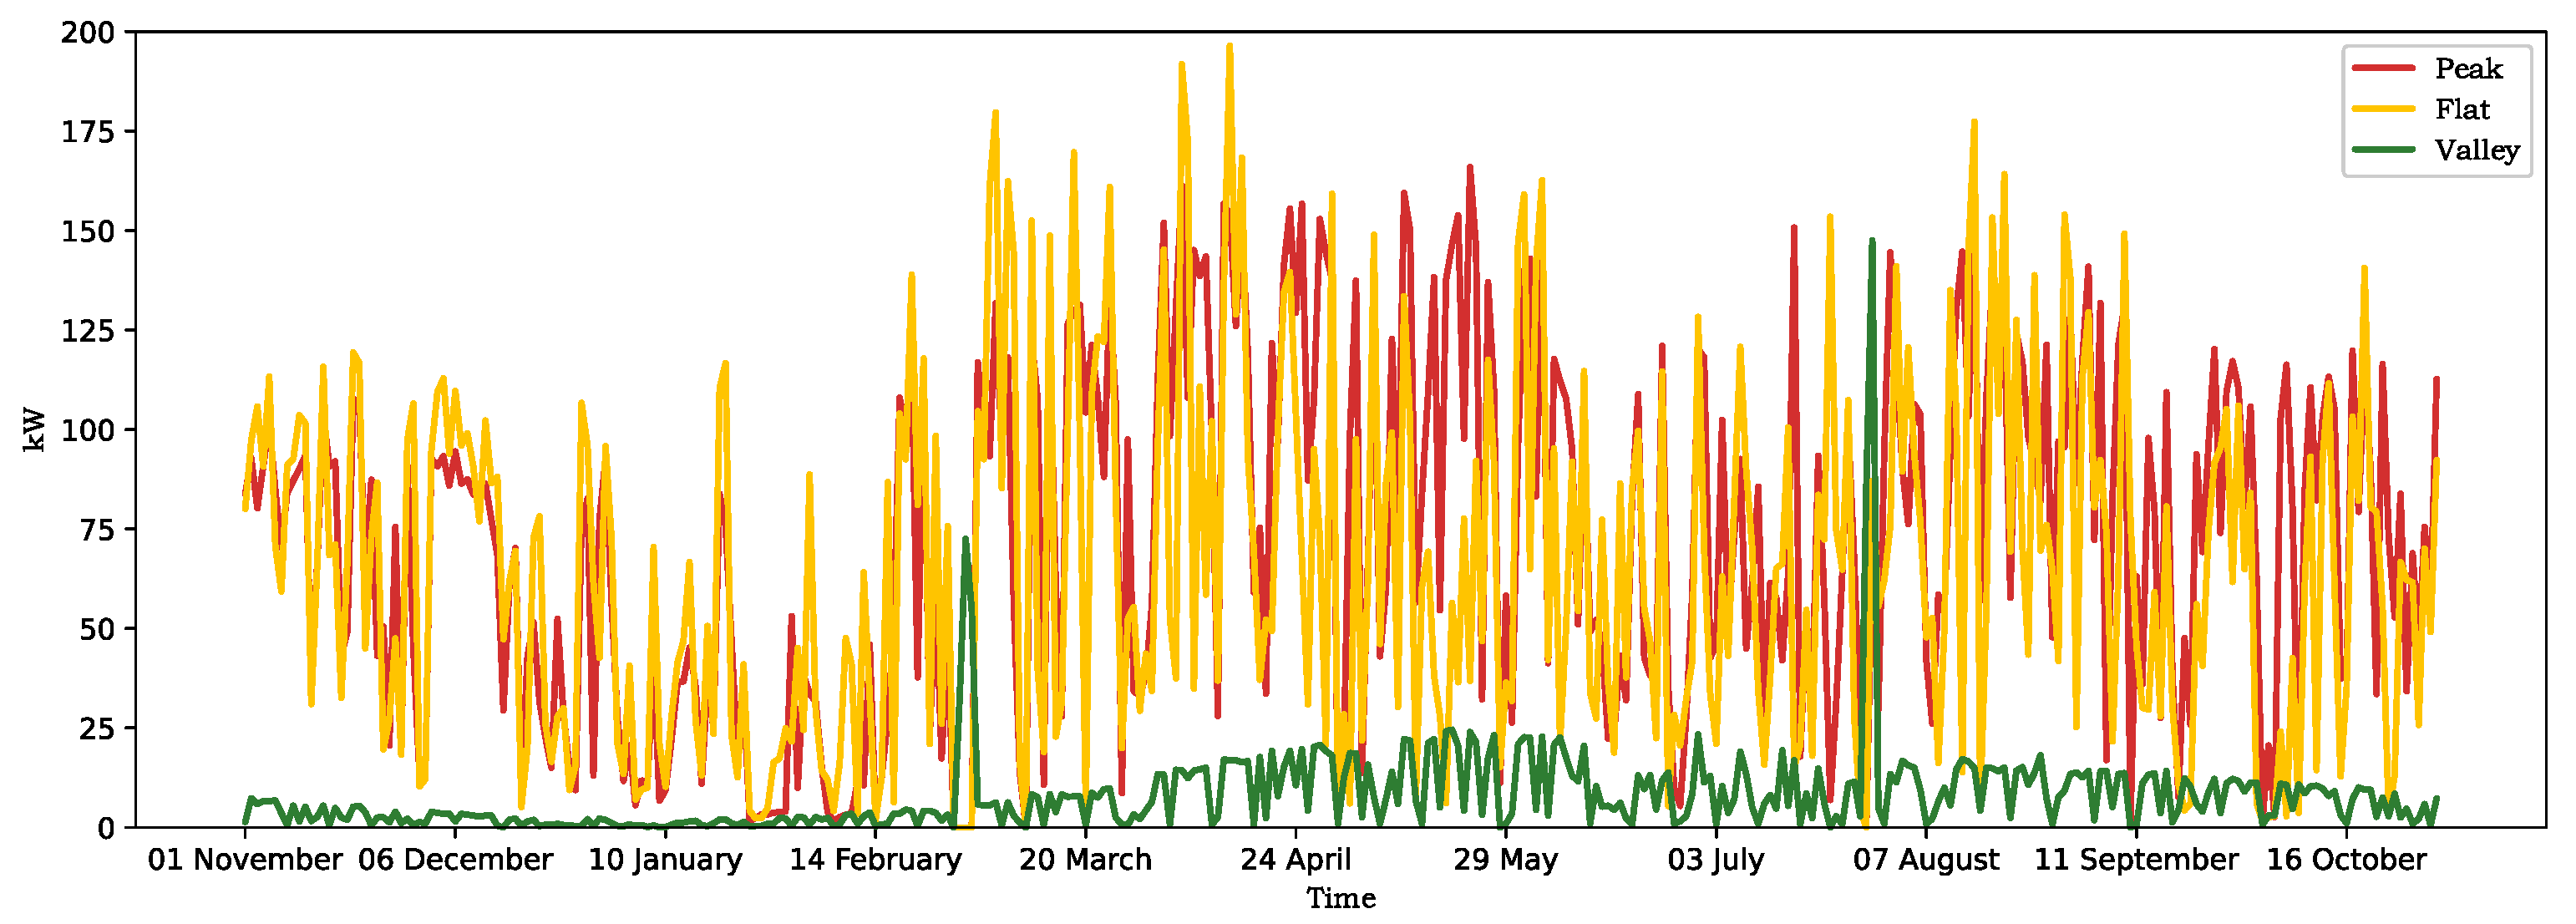
is 60 kWh, so the site area is the biggest limiting factor. The 60 kW photovoltaic data for 12 months was analyzed, as shown in
Figure 4.
From the above data, it can be seen that the maximum power generation in the daily peak period is 165.91 kWh, which occurred in April–May, and the average daily peak power generation is 72.1 kWh. The maximum power generation of the daily flat section is 196.5 kWh, and the average daily flat section power generation is 65.7 kWh. The maximum daily power generation is 367.5 kWh, which appeared in April, and the average daily power generation is 145.8 kWh.
Step 2: Determine the energy storage configuration capacity and battery type: The value of energy storage capacity
is determined by two parameters, namely the daily peak power consumption
of the charging pile and the daily photovoltaic power generation
. According to the installed power
and the above 60 kW daily PV generation data, it can be seen that the energy storage capacity that satisfies the following ranges is
If the photovoltaic power generation can be fully used for the vehicle charging during 12:00–17:00 pm, and the charging efficiency of the charging pile, photovoltaic power generation, and charging and discharging of the energy storage converter are , and if the discharge depth is 80%, then the energy storage capacity 446 kWh ≤ ≤ 546 kWh.
Step 3: Determine the maximum power of the power conversion system: The power conversion system (PCS) is one of the key core devices in the energy storage system, which is located between the power grid and the energy storage battery and controls the charging and discharging process of the energy storage battery. The maximum power value of the
is determined by
, the charge and discharge rate characteristics of the energy storage battery, and the maximum peak charging power parameter
of the charging station. It can be seen from
Figure 2 that the maximum peak power of the charging station is 225.78 kW, and the peak charging interval is between 9:00–11:30 and 18:00–20:30.
4.4. Optimal Solution Calculation
According to the above analysis and calculation process, a data set of
can be obtained, and through the search algorithm based on historical data, a set of values that satisfy
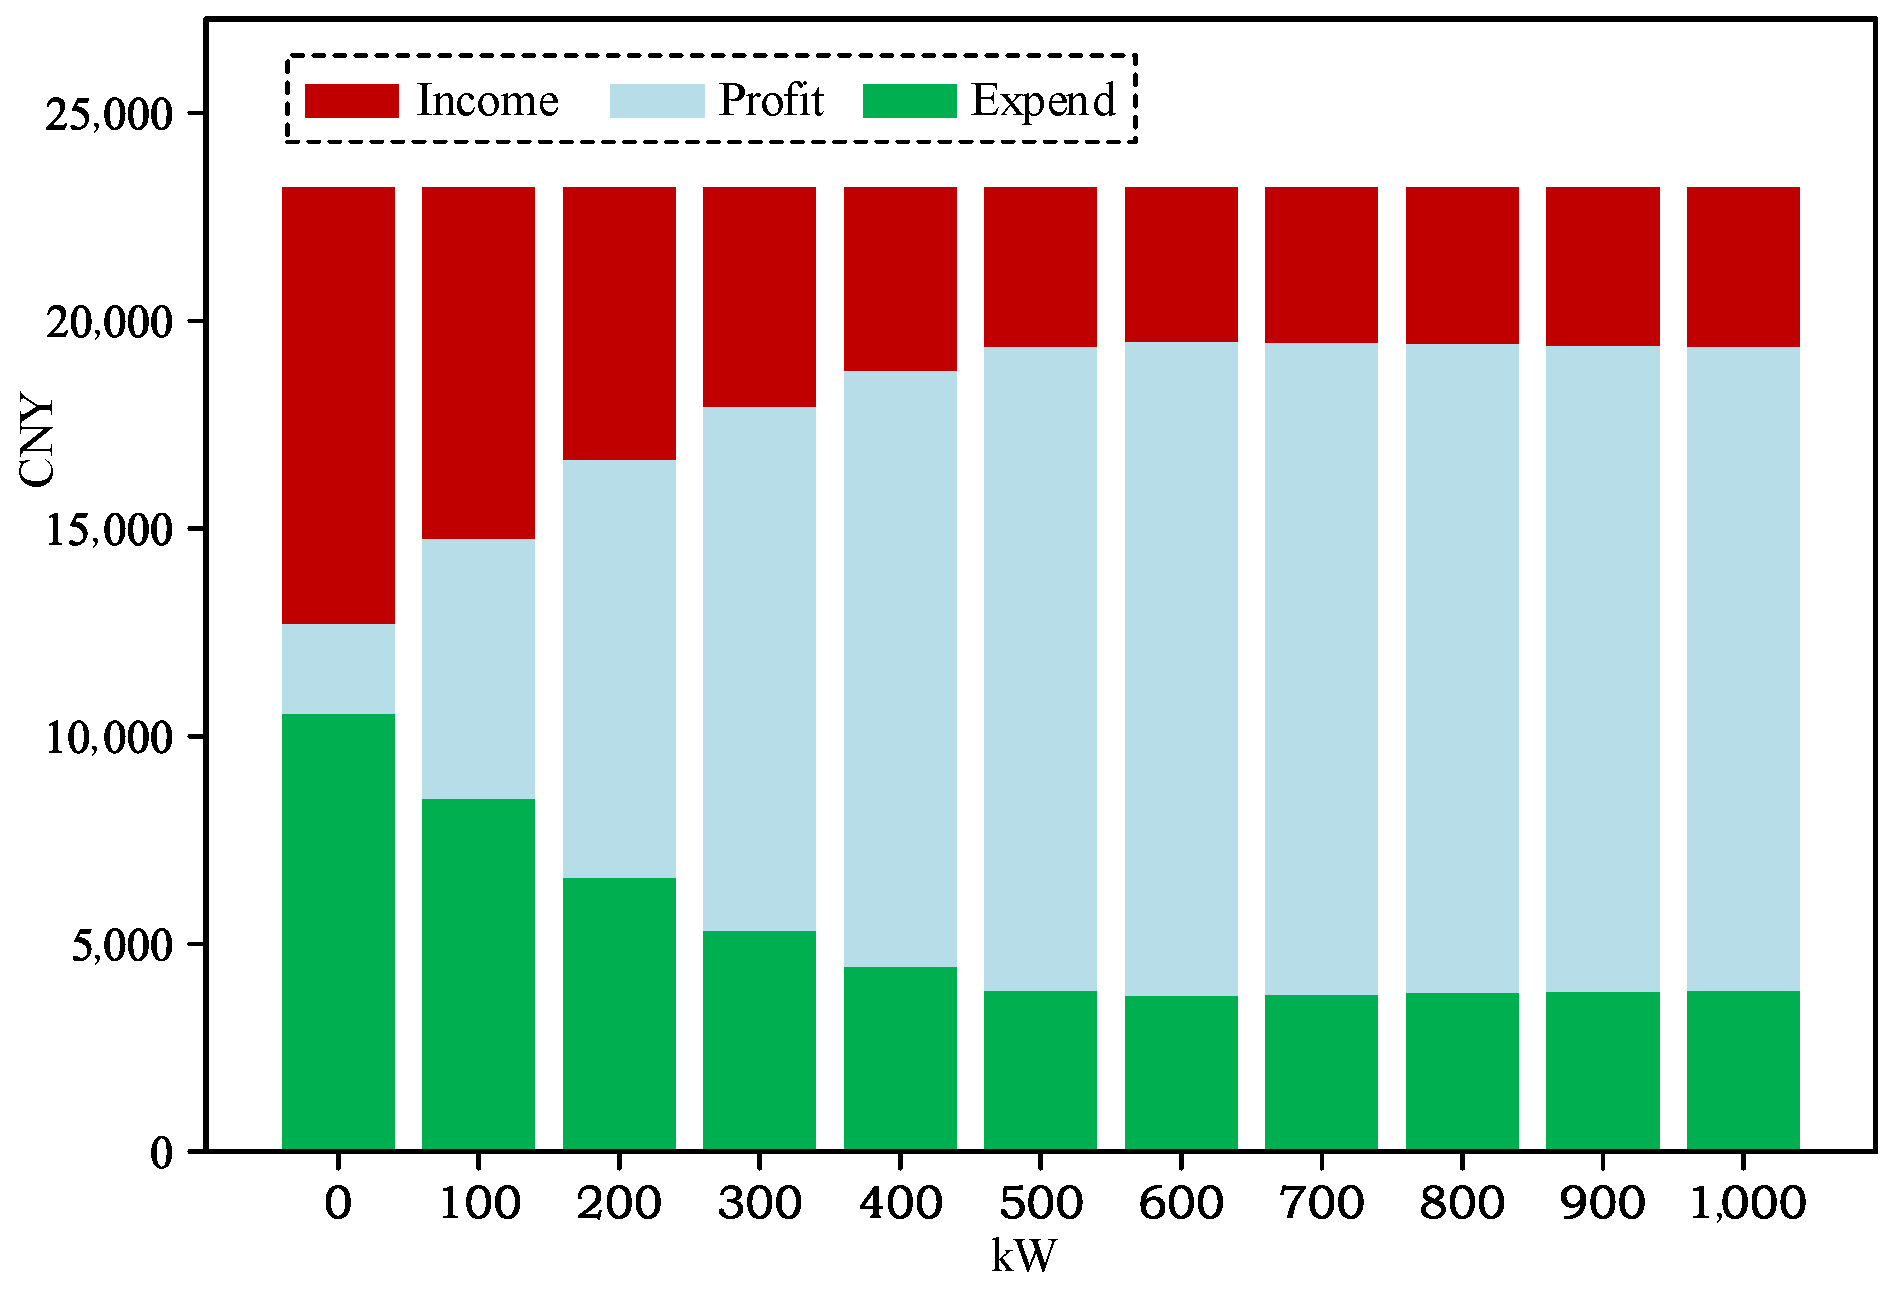
in this data set can be found so as to meet the goal of maximizing the overall investment benefit of PES-CS. In the calculation of this model, photovoltaic power generation is simplified as the average daily power generation in each period, and the service fee per kWh of charging is CNY 1.5. The energy storage price is 1.75 CNY/Wh. Based on the above historical data, the profit cost changes are simulated in the range of PV 60 kW and 0–1000 kW energy storage. The power purchase cost and profit income are shown in
Table 3.
As shown in
Table 3, with the change in the energy storage, the income remains unchanged. The reason is that the daily external power load is constant, so the daily income is fixed, and the change of its profit mainly depends on the daily power load. The power purchase cost is affected by the energy storage and photovoltaic. In this case, because the capacity of the photovoltaic has been determined to be 60 kW, the daily profit is directly affected by the capacity of the energy storage. It can be found in
Table 3 that with the expansion of energy storage, the cost of electricity purchase significantly decreases. When the energy storage is expanded to 600 kW, the electricity purchase reaches a lower value, which is 64.53% lower than that of when the energy storage facilities are not added. However, when the energy storage is further expanded to 800 kW, the cost of energy storage begins to rise. The reason is that when the energy storage expands, more electricity needs to be purchased in order to fully charge the energy storage at night when the power is flat. When the energy storage increases to 1000 kW, due to the great excess of energy storage, the previously full-charged energy storage has not been fully consumed, resulting in a significant increase in the cost of electricity purchase compared with the 800 kW energy storage period, and the required electric energy purchased every night compared with the 600 kW energy storage period has not been significantly reduced. It fell by 4%, but the cost of energy storage increased by 40%, so it can be judged that the capacity of energy storage is too large.
Figure 5 shows the changes in the profit and cost of energy storage with the expansion of energy storage within 0–1000 kW. When the energy storage capacity increased from 0 to 400 kW, the proportion of profit area in the overall revenue significantly increased, but after 500 kW, the reduction in the power purchase cost began to slow down. When the energy storage continued to increase, the proportion of power purchase cost to the overall revenue remained basically unchanged. Because the total revenue was also constant, the profit was basically unchanged.
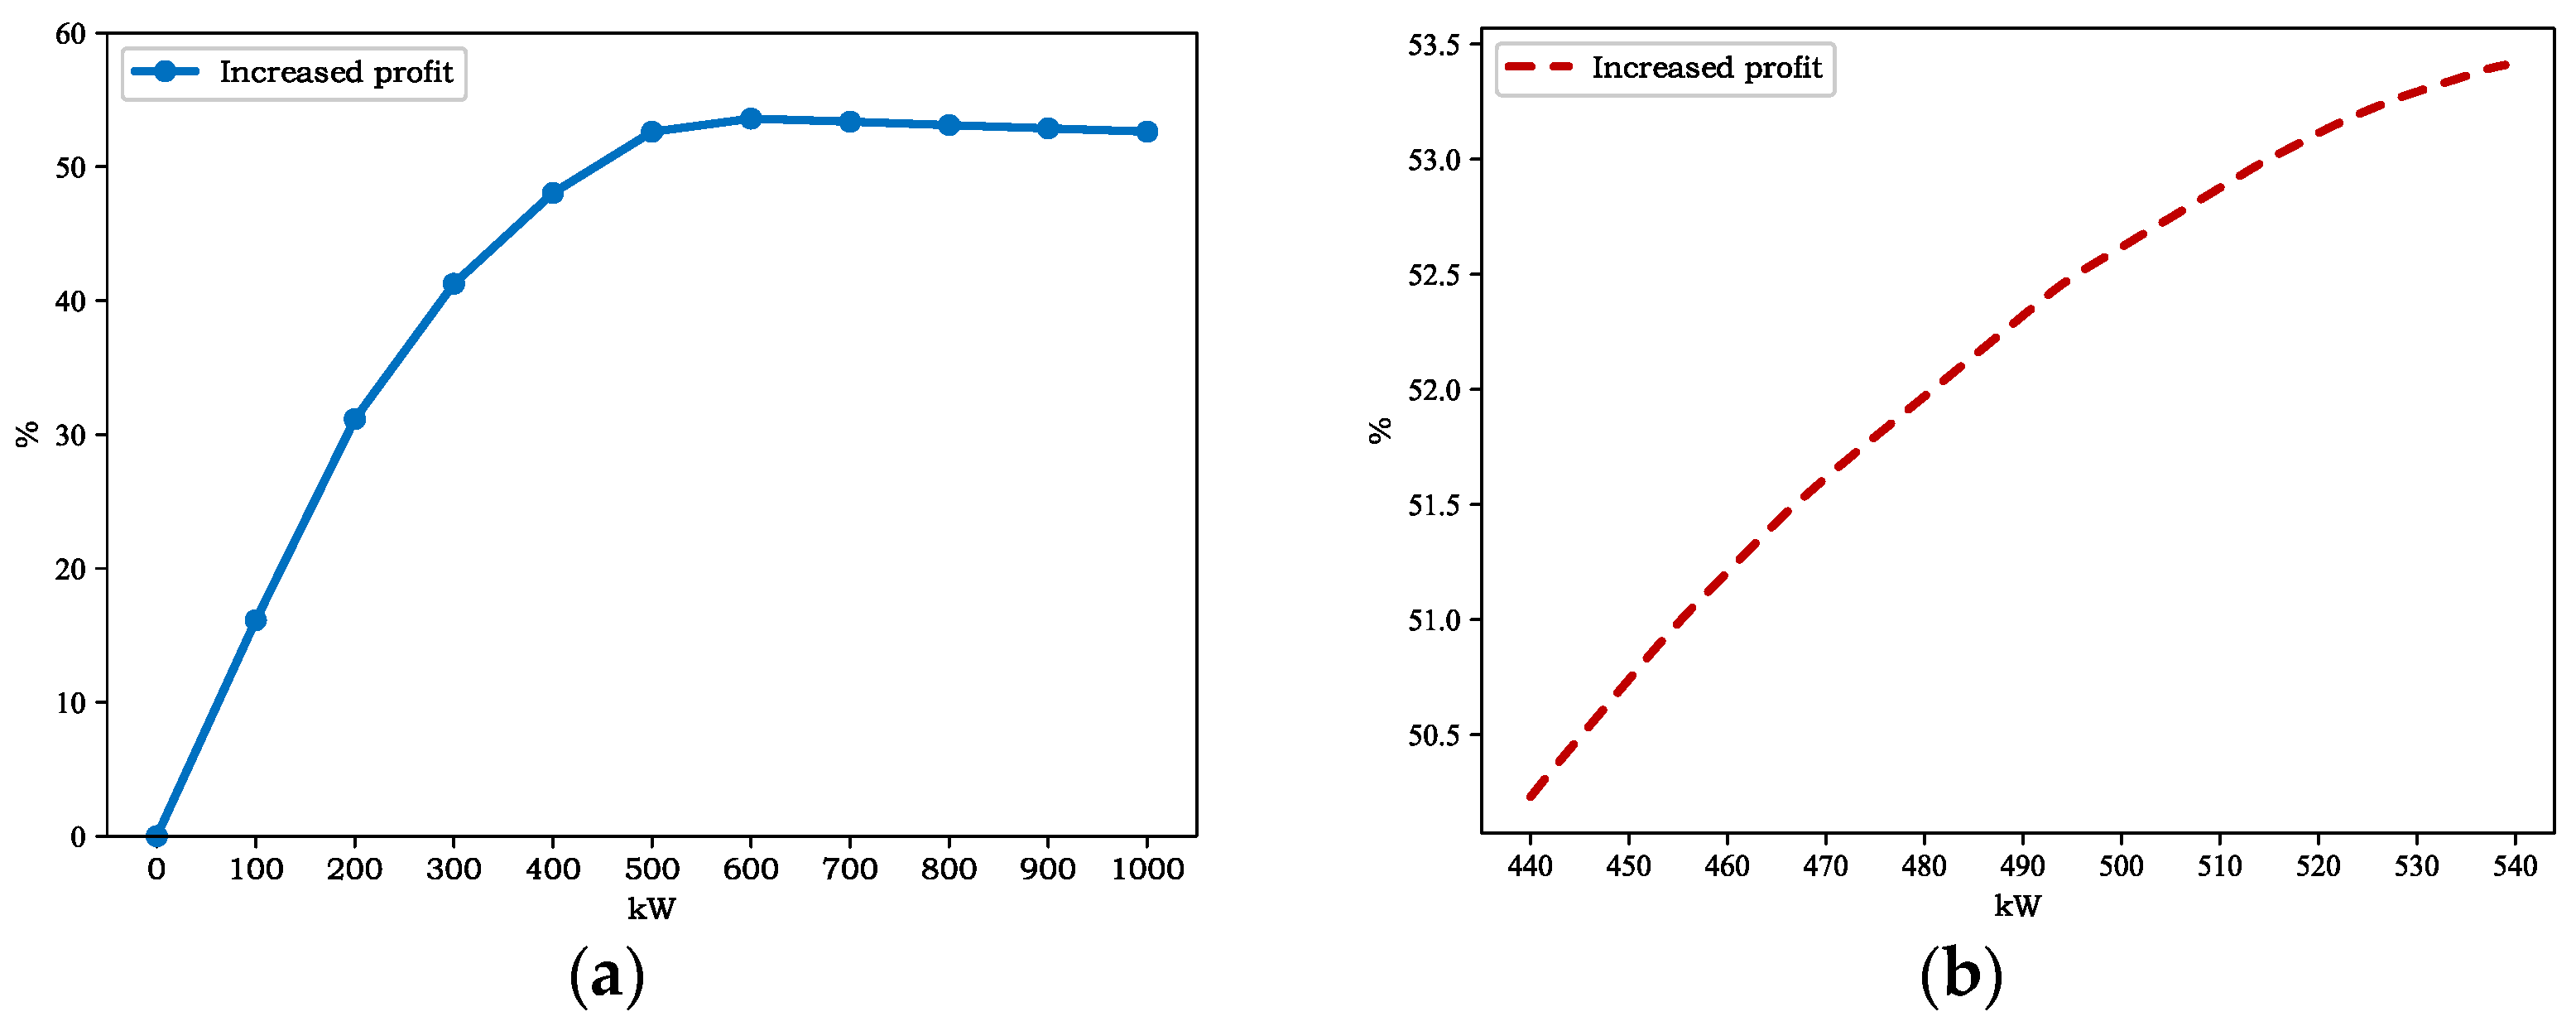
It can be seen from the broken line chart in
Figure 6 that with the increase in energy storage, the profit firstly rose rapidly compared with the case of no energy storage, then reached a peak value, and then stabilized at about 53%; however, when the energy storage exceeded 600 kW, its profit margin would decline to a certain extent. The reason is that when the size of the energy storage exceeds a certain threshold, the cost of filling the energy storage on the first day will increase. Combined with the daily photovoltaic power generation, after the daily external electrical load is met, a large amount of energy will remain in the energy storage. However, due to the limitation of the scheduling strategy, the energy storage still needs to be fully charged at night so that additional energy that will not be consumed will be purchased every day to fully charge the energy storage, resulting in a decrease in profit margins; meanwhile, the additional energy purchased every day will not be much, so the profit decreases but still basically remains at 53%. It can be seen from the above analysis that the energy storage was far in excess when it was greater than 600 kW. Based on the search algorithm strategy, the energy storage interval needs to be narrowed according to the condition
in Step 2. Therefore, the energy storage range was reduced to a range of 440 kW–540 kW. In this interval, after partially enlarging the profit margin curve, it can be seen that when the energy storage size was 500 kW, the energy storage increased by 40 kW, the cost increased by CNY 70,000, and the profit increased by only 0.1%. Compared with 500 kW, the profit increased by CNY 102. Combining the principles of return on investment and economy, the maximum profit can be obtained when the energy storage is configured with 500 kW. Therefore, it is predicted that when the 500 kW energy storage is configured, the charging station will obtain the maximum profit every day, with an average monthly profit of CNY 19,356.8, which is an increase of about 52.5% compared with the increase in profit without energy storage.
Table 4 shows the comparison of daily electricity purchases before and after adding 500 kW of energy storage. Before adding energy storage, during the photovoltaic power generation, if the external power load demand is greater than the photovoltaic power generation capacity, the resulting power load gap will be supplemented by directly purchasing power from the grid. If the external power load is less than the photovoltaic power generation capacity, the extra electrical power will be sold online. After the energy storage is added, the surplus of photovoltaic power generation can be stored in the energy storage and used for the external power load in the next stage. Therefore, after adding energy storage, the monthly purchase of electricity could be reduced by about 1200 kW; at the end of the monthly dispatch, there was still 335 kW of energy storage remaining in the energy storage, and the total monthly purchase of electricity could be reduced by about 1535 kW. Furthermore, after the addition of energy storage, the monthly demand for peak electricity purchases dropped by about 100%, the demand for flat electricity purchases dropped by 86%, and the demand for valley electricity purchases increased by 617%, which greatly reduced the demand for grid electricity during the daytime peak and flat electricity period.
At present, the world’s electricity is still dominated by thermal power generation, especially in developing countries, which consumes about 0.33 kg of coal and 0.275 m
3 of natural gas per kilowatt-hour of electricity. The calorific value and carbon emission coefficient of traditional fossil energy are shown in
Table 5. Through the introduction of energy storage equipment, the monthly charging station can reduce the use of coal by about 506 kg, natural gas by about 427 m
3, and reduce carbon emissions by about 344–384 kg per day. It can reduce coal consumption by 6072 kg or natural gas by 5124 m
3 per year and reduce carbon emissions by about 4000 tons per year.
6. Conclusions
As one of the representative forms of charging stations for electric vehicles in the future, the PES-CS system is attracting increasing attention. In this paper, we discuss how to improve the comprehensive economic benefits of PES-CS. The analysis method used in this paper is as follows: ① Firstly, by taking the net present value (NPV) and investment payback period as evaluation indicators, the economic benefit model of the charging stations is established; ② then, by analyzing the operation data of the existing charging station, the initial capacity configuration is obtained; ③ finally, the given capacity configuration is verified according to the actual applied three-month operation data. The results show that with a reasonable configuration of photovoltaic and energy storage capacity (60 kW/500 kW), a high utilization rate of photovoltaic power generation and good profit of the entire charging station (increased by 51.68%) can be guaranteed.
The main contributions of the paper can be summarized as follows. Based on the established unified economic benefit model, through the comprehensive comparison and analysis of the complex PES-CS historical operation data, the photovoltaic energy storage capacity allocation method was proposed, which is aimed at maximizing economic benefits. The proposed method can provide a theoretical and practical basis for newly planned or improved large-scale charging stations in the future.


