Article

Energy and Exergy-Based Efficiency, Sustainability and Economic Assessment towards Improved Energy Management of a Thermal Power Plant: A Case Study

by
Md Hasan Maruf
1,
Sameya Afrin July
1,
Mamun Rabbani
2,
Shafrida Sahrani
3,
Molla Shahadat Hossain Lipu
1,*,
Mahidur R. Sarker
3,*,
Ratil H. Ashique
1,
Md. Shahrial Kabir
1 and
A. S. M. Shihavuddin
1
1
Department of Electrical and Electronic Engineering, Green University of Bangladesh, Dhaka 1207, Bangladesh
2
Department of Biomedical Physics and Technology, University of Dhaka, Dhaka 1000, Bangladesh
3
Institute of IR 4.0, Universiti Kebangsaan Malaysia, Bangi 43600, Malaysia
*
Authors to whom correspondence should be addressed.
Sustainability 2023, 15(6), 5452; https://doi.org/10.3390/su15065452
Submission received: 2 February 2023 / Revised: 8 March 2023 / Accepted: 11 March 2023 / Published: 20 March 2023

Abstract

:
This paper explores the energy management of a natural gas-based thermal power plant, with a focus on improving its efficiency, sustainability, and economic feasibility. The study uses the Ashuganj Power Station Company Limited (APSCL) in Bangladesh as a case study. To evaluate the efficiency of the APSCL, both energy and exergy perspectives are considered, and sustainability is assessed through exergetic parameters. The plant’s economic feasibility is analyzed based on its fuel costs and operational losses. The results of the study indicate that the energy and exergy efficiencies of the APSCL vary from 32.97% to 33.21% and from 32.63% to 32.87%, respectively, for steam turbines and from 39.77% to 56.98% and from 39.36% to 56.40%, respectively, for combined cycle power plants (CCPP) during 2016–2021. The slightly lower efficiency in exergy calculations accounts for the system loss incurred over time, which is often omitted in efficiency calculations using energy parameters. To measure the sustainability of the APSCL, eight key indicators are used: the depletion number, exergy sustainable index, cumulative exergy loss, relative irreversibility, lack of production, the wasted exergy ratio, environmental effect factor, and improvement potential. The results indicate that APSCL still has opportunities for improvement in terms of sustainability, with 50% of the fuel being depleted in the plant, contributing to a sustainable index of 2.00 and cumulative exergy loss varying between 48.59 and 21.17. Regarding financial costs and losses, APSCL has experienced an increasing trend in the price of electricity generated. However, by implementing intelligent maintenance practices and upgrading equipment in a timely manner, it is possible to minimize costs and increase exergy output, reducing the per-unit fuel requirement for electricity production and the global carbon footprint significantly.

1. Introduction

Today’s global infrastructure development heavily relies on a consistent and uninterrupted supply of power. Any disruption in the power supply can have a significant impact on the economy [1]. With the increasing automation of various aspects of our lives, the demand for an uninterrupted power supply continues to grow. In order to meet this growing demand, countries are diversifying their methods and sources of power generation to keep the price of power affordable. The type and availability of natural resources in a given country play a major role in determining its energy production methods [2]. Despite efforts to shift towards sustainable energy sources, fossil fuel-based energy production still dominates global energy production.
Currently, fossil fuels, such as oil, coal, and gas, remain the primary sources of energy in power generation methods [3]. As a result, thermal power plants are prevalent in the power generation sector. Bangladesh, for instance, has significant reserves of natural gas, making natural gas-fired thermal power plants the country’s primary mode of power generation. Approximately 63% of the total power generated in Bangladesh comes from natural gas-based thermal power plants [4]. The sustainability of the power generation sector in the country is heavily dependent on the performance of these gas-fired thermal plants. Therefore, it is crucial to conduct an analysis to determine the efficiency and sustainability of gas-fired thermal plants. Additionally, effective generation from these plants also plays a crucial role in determining the pricing of electricity [5].
The most common method of analyzing the efficiency of power generation units involves comparing energy output to energy input. However, this approach only provides a partial understanding of the system’s performance, as some of the output energy may not be fully converted into useful energy due to the thermodynamic irreversibility of the system. To gain a more comprehensive view of the entire power conversion process, an exergy analysis is necessary. This method takes into account the thermodynamic irreversibility associated with the generation process, as dictated by the second law of thermodynamics [6]. While the first law of thermodynamics is concerned with work potential and the high quality of energy [7], the second law introduces the concept of entropy transport and its relationship with heat transport and entropy generation effects [8]. In practical terms, this means that 100% of the generated heat cannot be converted into 100% of the work [9]. Thus, a certain amount of heat and its equivalent energy will always remain unconverted. Based on these principles, exergy can be defined as the maximum valuable work that can be obtained from a mechanical or electrical system when it is thermodynamically balanced with the environment [10]. An exergy-based analysis provides a more meaningful evaluation of the efficiency and sustainability of power plants.
Environmental analysis is critical in understanding the impact of power generation losses on the environment and identifying areas for future improvement. Economic analysis helps determine the financial losses faced by the generation sector. According to the Environmental Protection Agency (EPA) in the USA, sustainability is crucial, as everything humans and animals require for survival and well-being depends directly or indirectly on the natural environment. In the power generation sector, sustainability involves maintaining a protective harmony to support safe power generation for the present and future, benefiting both humans and nature. The thermal effects of electromagnetic fields on power plant activity are a growing concern. Therefore, assessing the economic feasibility of thermal power plants is crucial in understanding production, costs, and demand.
Table 1 presents exergy analyses conducted for various sectors in different countries. The research conducted in [11] focused on the power generation sector in Bangladesh, where gas, fuel oil, high-speed diesel, coal, superior kerosene oil, and hydropower were used as energy sources. The study found that energy and exergy efficiencies varied from 34.9% to 36.3% and 35% to 39.2%, respectively. Chowdhury et al. [12] examined the residential sector and found energy and exergy efficiencies ranging from 25.54% to 37.77% and 6.35% to 9.04%, respectively. A study of Iran’s agriculture sector [13] compared the thermodynamic-economic and ecological sustainability of two canola production systems and found that the traditional system was twice as sustainable as the commercial system. Energy and exergy-based analyses of a coal-fired steam power plant were conducted by the authors in [7], which found a 0.277% increase in energy efficiency and a 0.255% increase in exergy efficiency with moderate temperature ammonia turbine and ammonia fraction, and a minimum bottoming cycle output. The authors in [14] analyzed energy utilization in Nigeria’s transportation sector and found overall energy and exergy efficiencies of 17.11% and 15.97%, respectively. Another study [15] investigated the efficiency improvement analysis of power generation sectors in Turkey, which focused on vapor and gas, cogeneration, and geothermal power cycles, and gave different cycle designs [16]. The authors found that the energy and exergy efficiencies of the Turkish utility sectors ranged from 32.64% to 45.69% and from 32.20% to 46.81%, respectively. Overall, exergy analysis provides a comprehensive evaluation of sustainability and efficiency in different sectors across various countries.
To date, there has been no exergy-based analysis conducted on the sustainability and efficiency of a specific power generation method in Bangladesh. Given the substantial contribution of natural gas-based thermal power plants to the country’s generation sector, it would be valuable to assess the sustainability and efficiency of such plants to improve overall generation forecasting and maintenance scheduling.
In this paper, an exergetic and sustainable analysis was conducted to assess the efficiency and economic feasibility of natural gas-based thermal power plants. The study focuses on the Ashuganj Power Station Company Limited (APSCL), which contributes approximately 17% of Bangladesh’s total energy generation capacity. The APSCL plant has an installed capacity of 1876 MW, but during the analysis, the operational capacity was found to be 1627 MW.
This work aims to compare established efficiency calculations using energy parameters with exergetic efficiency calculations and propose a realistic estimation of system efficiencies in terms of exergy. It also aims to analyze the sustainability of fossil fuel-based power plants using exergy-oriented sustainability parameters, using APSCL (2016–2021) as a case study. The economic feasibility of APSCL is also examined in terms of the losses incurred over the operational years to identify trends. Finally, recommendations for future adaptation and maintenance are presented based on a data-driven understanding of the impact of the yearly deterioration of different parts of the plants.
The paper is arranged in the following order. Section 2 outlines the description of the power plant, while Section 3 introduces the reader to exergetic sustainability parameters. Section 4 narrates the methods and procedures of the study. Section 5 presents the results, and Section 6 highlights the critical discussion, concerns, issues, and challenges. Section 7 gives the concluding remarks.

2. Description of the Power Plant: Case Study

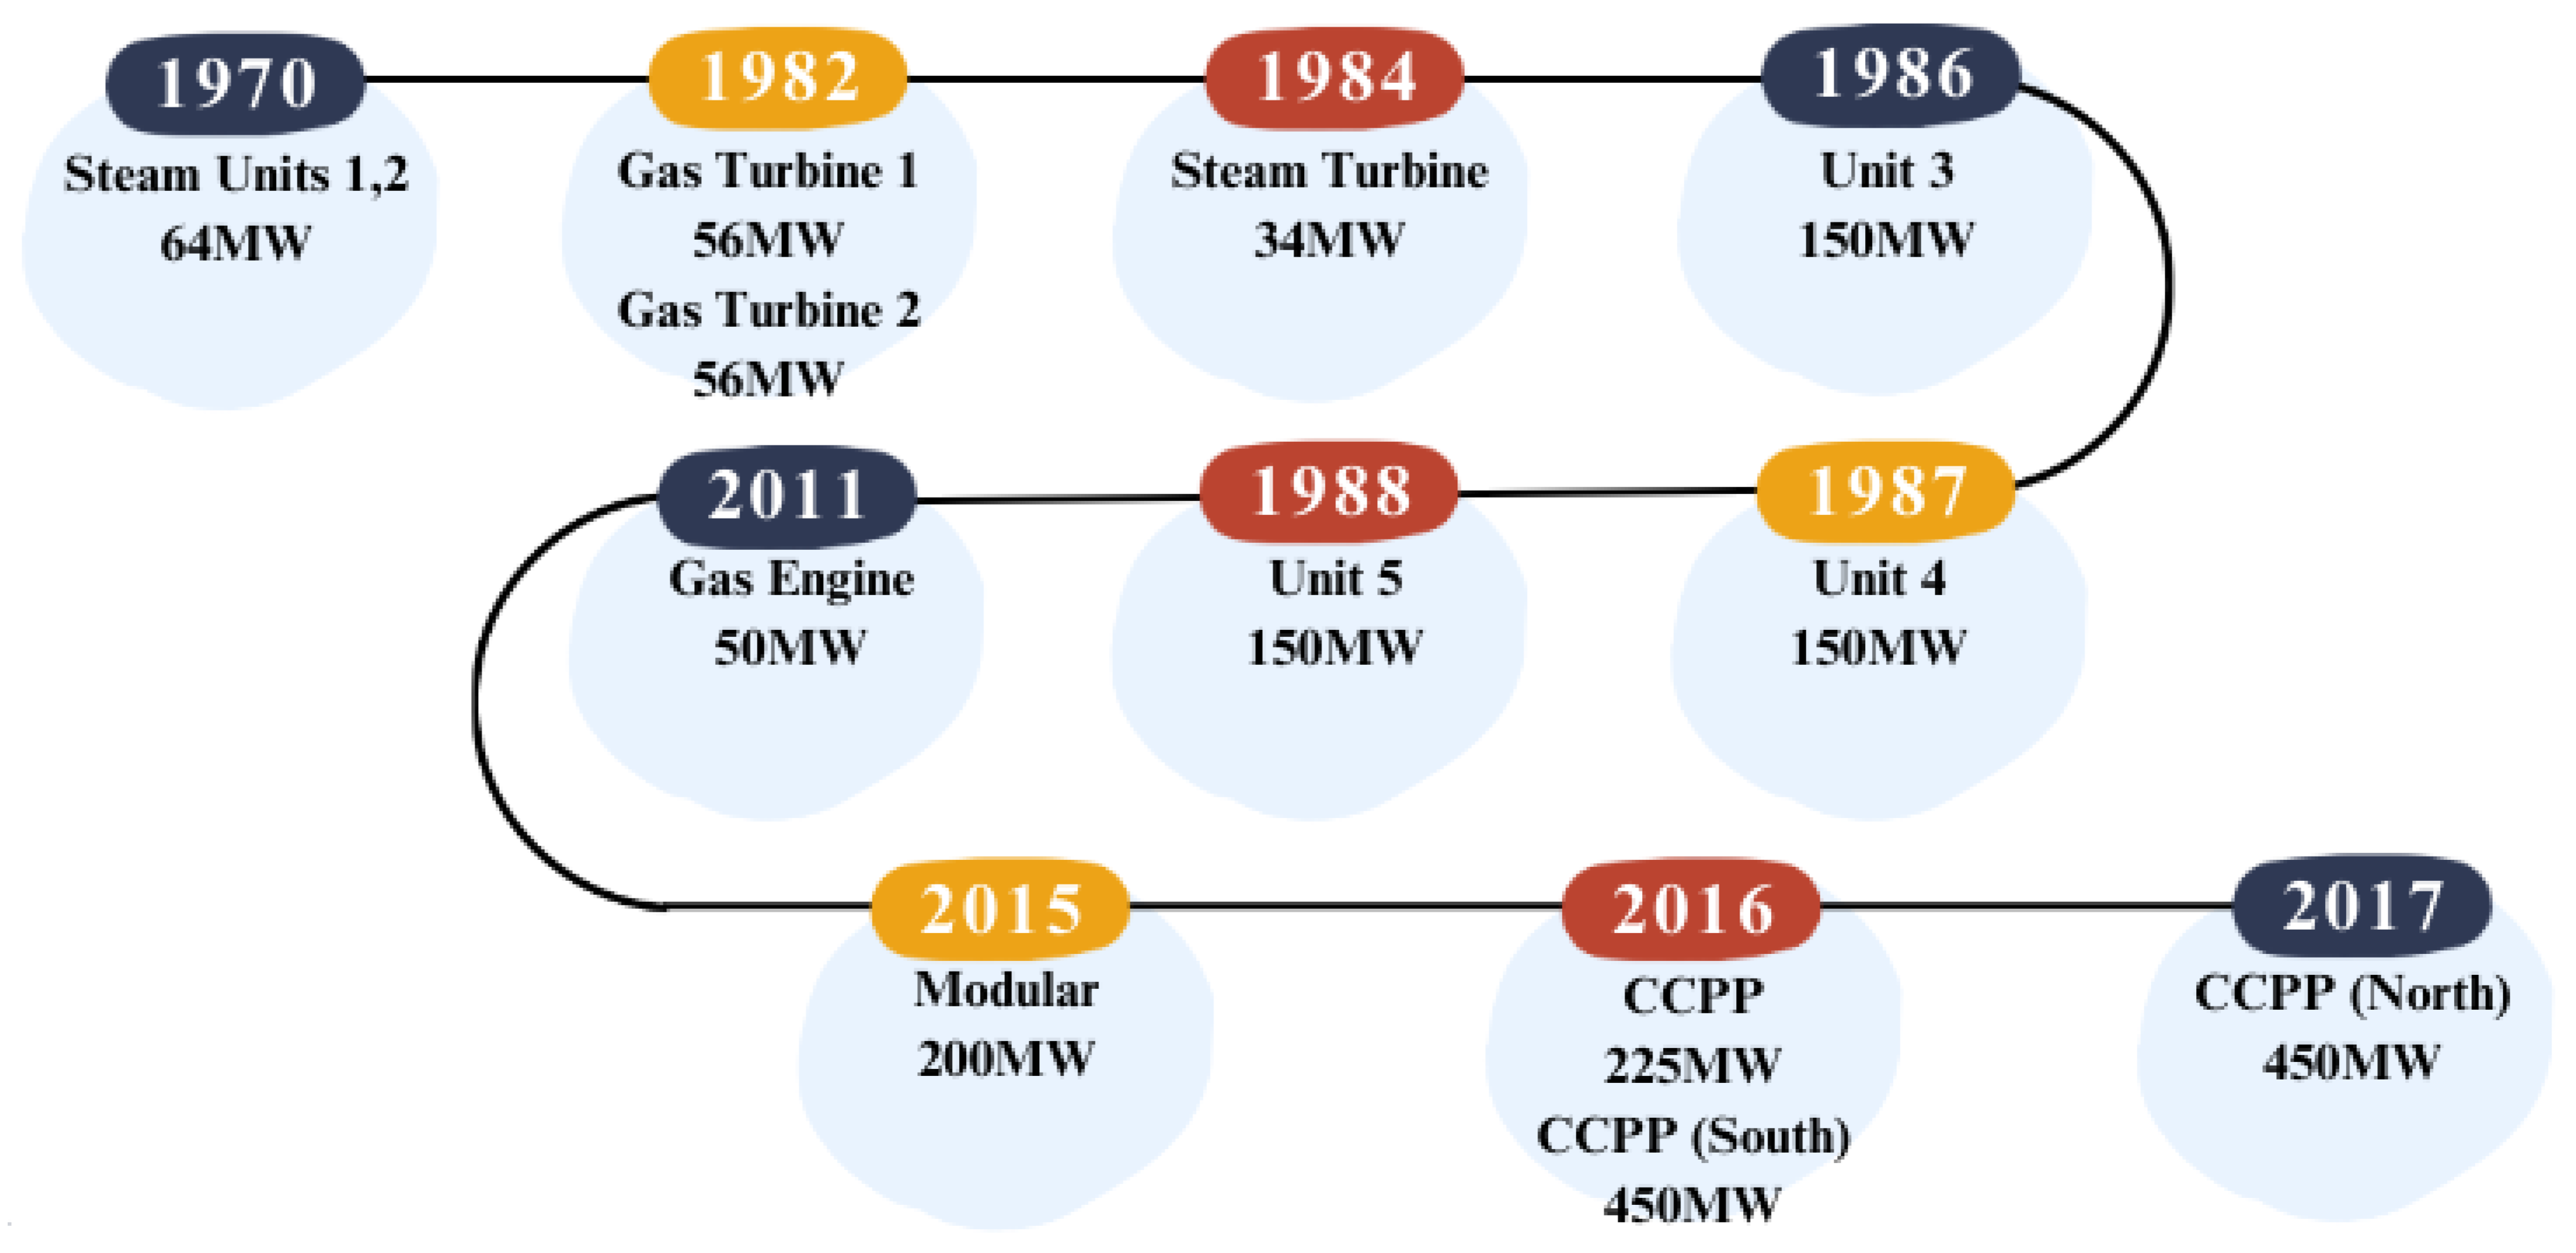
The location of Ashuganj thermal power plant is in the Brahmanbaria district in the Chittagong division in Bangladesh, situated in the Meghna River delta. The decision to establish a thermal power plant in Ashuganj was based on the availability of labor, transportation for heavy instruments, a fuel source, and other necessary supplies. In 1966, a foreign construction company was contracted to build the power plant with financial assistance from the German government. The facility has multiple units, including two steam units of 64 MW commissioned in 1970, two gas turbine units GT-1 and GT-2 of 56 MW each commissioned in 1982, a steam turbine of 34 MW and waste heat recovery boiler commissioned in 1984, and three 150 MW units (Units 3, 4, and 5, commissioned in 1986, 1987, and 1988, respectively). Additionally, a 50 MW gas engine was commissioned in 2011, a 200 MW modular plant in 2015, a 225 MW CCPP in 2016, Ashuganj CCPP (South) in 2016, and Ashuganj CCPP (North) in 2017. The procurement of different plants and equipment was done through international financial assistance. The plant’s installed capacity is 1876 MW, but currently, it operates at a capacity of 1627 MW. Ashuganj Thermal Power Plant was initially registered as a private limited company under the Companies Act 1994 on June 26, 2000, and was later transformed into a public limited company on March 1, 2003, named Ashuganj Power Station Company Limited (APSCL). The power plant covers around 311 acres of land on the northeastern side of the Meghna Railway Bridge. Figure 1 shows a timeline of APSCL’s expansion.
The scope of this study is limited to six units of APSCL, with a total capacity of 1391 MW. Among these units, three (Units 3, 4, and 5) are considered a single entity. The remaining three units are a 225 MW Combined Cycle Power Plant (CCPP), a 450 MW CCPP South, and a 450 MW CCPP North, with current capacities of 450 MW, 221 MW, 360 MW, and 360 MW, respectively [17]. These units generate electricity through both thermal power generation and combined cycle power generation. The primary fuel source for all units is natural gas, which is supplied from the nearby Titas gas field. The plant utilizes water from the Meghna River for steam generation and cooling purposes [18].
APSCL employs three distinct methods for power generation: steam turbine power plant, gas turbine power plant, and combined cycle power plant. The Combined Cycle Power Plant (CCPP) is particularly noteworthy, as it allows for the maximum utilization (up to 50%) of a single fuel source for power generation by utilizing both a gas turbine (GT) and a steam turbine (ST). This plant relies on a variety of equipment, including compressors, combustion chambers, GTs, STs, and diesel engines. During operation, the GT and ST function based on the Brayton Cycle and the Rankine Cycle, respectively. CCPP’s crucial component is the Heat Recovery Steam Generator (HRSG), which connects every gas turbine. The exhaust gas generated by the turbine in the ST section is utilized for steam production. The evaporative capacity of this process is 126 t/h, while the steam pressure is maintained at 39 bar. The turbine speed is set at 3000 rpm, while the flue gas temperature is recorded at 1010 °C. In Units 2, 3, 4, and 5, exhaust gas is utilized to increase the feed water’s temperature from 55 °C to 66 °C. The exhaust steam generated from the HP turbine, which has a temperature range of 335–522 °C, and a pressure of 135 bar, is utilized to superheat the steam. These units are equipped with nine furnaces with temperatures ranging between 1200 °C and 1500 °C. The HP, IP, and LP turbine’s pressure and temperature are recorded at 135 bar and 520 °C, 35 bar and 520 °C, and 90 °C, respectively [18].

3. Efficiency and Sustainability Parameters

Thermal power generation involves the utilization of natural resources to produce chemical energy, which is then converted into mechanical energy and eventually transformed into electrical energy. The natural resources used in this process may include gas, coal, and oil, among others. The calorific value of a fuel refers to the amount of heat that it can produce. The energy input and output of a thermal power station can be expressed mathematically using the following formula [19]:
Maximum   Possible   Output = Plant   Factor × Plant   Capacity   kW ×   Time   hour
Plant   Input = Total   fuel   consumption   value   m 3 ×   Calorific   value   kcal m 3
Total fuel consumption value = maximum Possible Output ×Fuel Consumption Value for per unit generation
The maximum potential output of a thermal power station can be calculated by multiplying the plant factor, plant capacity, and operational hours, as represented by Equation (1). The plant input value, which is the total fuel consumption, can be calculated using Equation (2) by multiplying the fuel consumption with the fuel’s calorific value. The total fuel consumption value can be determined using Equation (3). Equation (4) represents the plant output value, measured in kWh. To represent the plant output value in kcal, it should be multiplied by 860 [20].
Plant   Output = Total   Energy   Generation   Over   a   Period   in   kWh   × 860

3.1. Efficiency Analysis

Efficiency is measured by comparing the output energy to the input energy in a given system. In thermodynamics, efficiency is the ratio of desired output to required input, and it helps to understand the system’s behavior [21]. The efficiency analysis procedure is the same for both energy and exergy for a reversible design [6].
Energy   Efficiency ,   η = Total   Energy   Produce   in   a   System Total   Energy   Provided   in   a   System
Exergy   Efficiency ,   ϕ = Total   Exergy   Produce   in   a   System Total   Exergy   Provided   in   a   System
The exergy input and output values are determined by multiplying the corresponding energy values with the fuel-energy grade function, or exergy factor, shown in Table 2.

3.2. Sustainability Analysis

In power generation, sector sustainability means a system of environmental, economic, and social stability. Sustainable energy can be utilized repeatedly without putting a source in danger of getting depleted, expiring, or vanishing [22]. Sustainability analysis is necessary to maintain a system’s quality, service, and financial positions. Sustainability is quantified using some parameters called “exergetic sustainability parameters”. Such parameters and their relations with the power generation section are shown in Table 3.

4. Methods to Assess the Performance of Thermal Power Plant

This section explains the various procedures to examine the performance and efficiency of the thermal power plant, including data collection, data validation, efficiency estimation, sustainability indicators, and environmental exergy loss [23]. Bangladesh Power Development Board (BPDB) publishes an annual report that contains information on energy generation and consumption in the utility sector. APSCL is owned and controlled by BPDB [24]. Most of the required data for this work was collected from the annual report of BPDBs. Some values were available on the website of the APSCL.
In some cases, data were obtained directly from the plant. The plants’ input and output were obtained from the annual report and used to calculate efficiency. Exergy input and exergy output values were calculated from corresponding energy values using the fuel-energy grade function of natural gas. Various aspects of natural gas-fired thermal power plants are evaluated in this section. This station uses natural gas as fuel, and the calorific value of the gas is 8354.0272 Kcal/m3 (collected directly from the APSCL). The analysis comprises from 2016–2017 to 2020–2021. The study focuses on determining the plant’s efficiency, sustainability, and economic feasibility based on the parameters discussed in the parameters for analysis. Exergetic sustainability parameters were analyzed from exergy values. Fuel costs and financial losses were calculated to determine the economic feasibility of the plant. Figure 2 describes the overall methodology of this research work.

5. Results and Analysis

The energy value is converted into exergy by multiplying the fuel-energy grade function based on plant fuels described in the previous section. From the primary data obtained for the plant, the plant’s input and output are determined using Equations (1)–(4). As the plant’s energy input and output values are pretty significant, they are converted into petajoules (PJ) divided by 2.39 × 10¹¹. Exergy input and output for the plants have been calculated by multiplying the energy parameters with the corresponding fuel exergy factor mentioned in Table 2. Energy and exergy input and work throughout the operational years for the different types of generation units in APSCL are shown in Table 4 and Table 5.

5.1. Efficiency Analysis

Efficiency analysis has been carried out using the energy and exergy values as mentioned in Table 4 and 
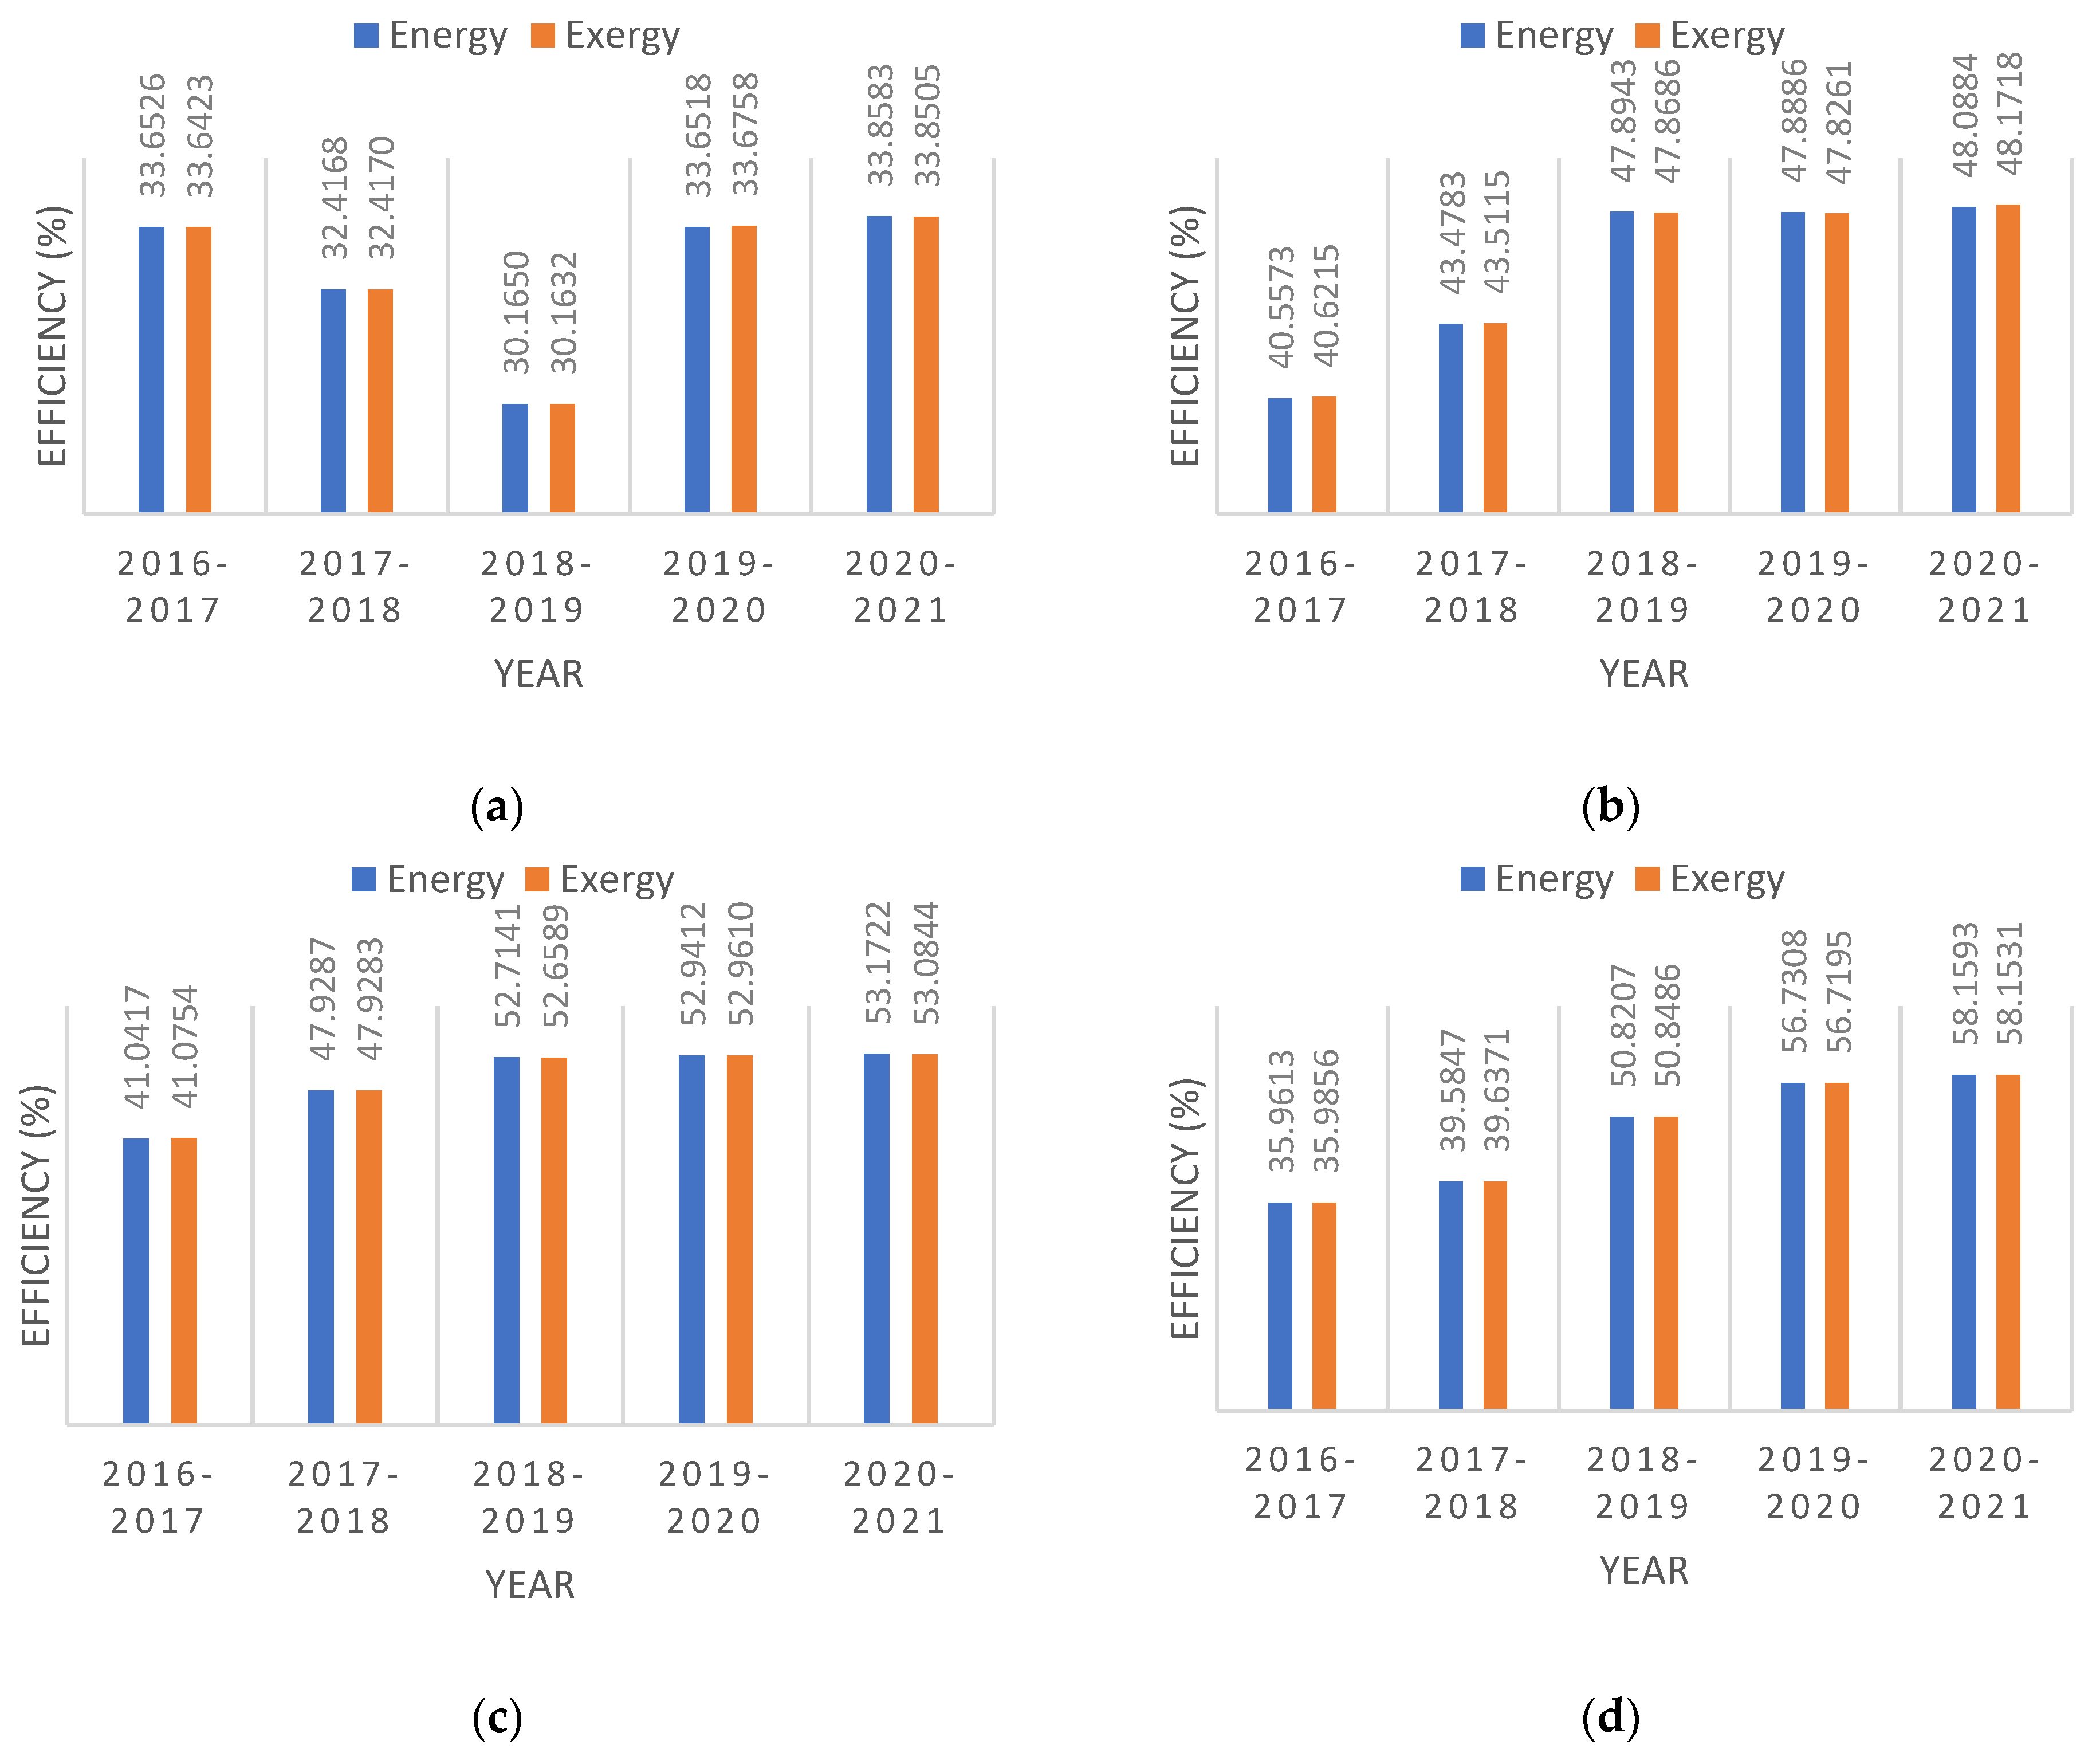
Table 5 using Equations (5) and (6). A year-wise comparison of energy and exergy efficiency for different units of APSCL is shown in Figure 3. Figure 3a shows that the efficiencies of Units 3, 4, and 5 decreased gradually from 33% during 2016–2017 to 30% during 2018–2019. Being the oldest plants at APSCL, it is expected that these units will degrade with time. However, proper maintenance and overhauling cause an increase in efficiency, evident from the increased efficiencies observed during 2019–2020 and 2020–2021. However, the maximum efficiency obtained from the units peaked at around 33%, showing that two-thirds of the input fuel is either converted into waste energy or lost as heat energy. Such low-yielding units take a toll on the overall efficiency of the plant.
Figure 3b–d illustrate the efficiency trends for the three CCPP units commissioned at APSCL from the years 2016–2017 up to 2020–2021. As CCPPs use gas and steam turbines, the residual heat from the gas turbine is redirected to the steam turbine, resulting in more power generation. The efficiencies of the CCPPs were 36–41% in 2016–2017. However, it is seen to increase in the following years, showing efficiencies of around 48–58%. A proper synchronization between the two parallel generation systems of CCPPs results in higher efficiencies exceeding 50%.
A comparison between the overall and exergy efficiencies shows that for almost every instance, the exergy efficiency is slightly different than the energy efficiency—this slight difference in efficiency during exergy calculations results from considering the thermodynamic irreversibility of the generation systems. The traditional efficiency calculations using energy parameters do not consider these irreversibilities. Hence, exergy efficiency is expected to reflect the actual efficiency of the power generation units.

5.2. Sustainability Assessment

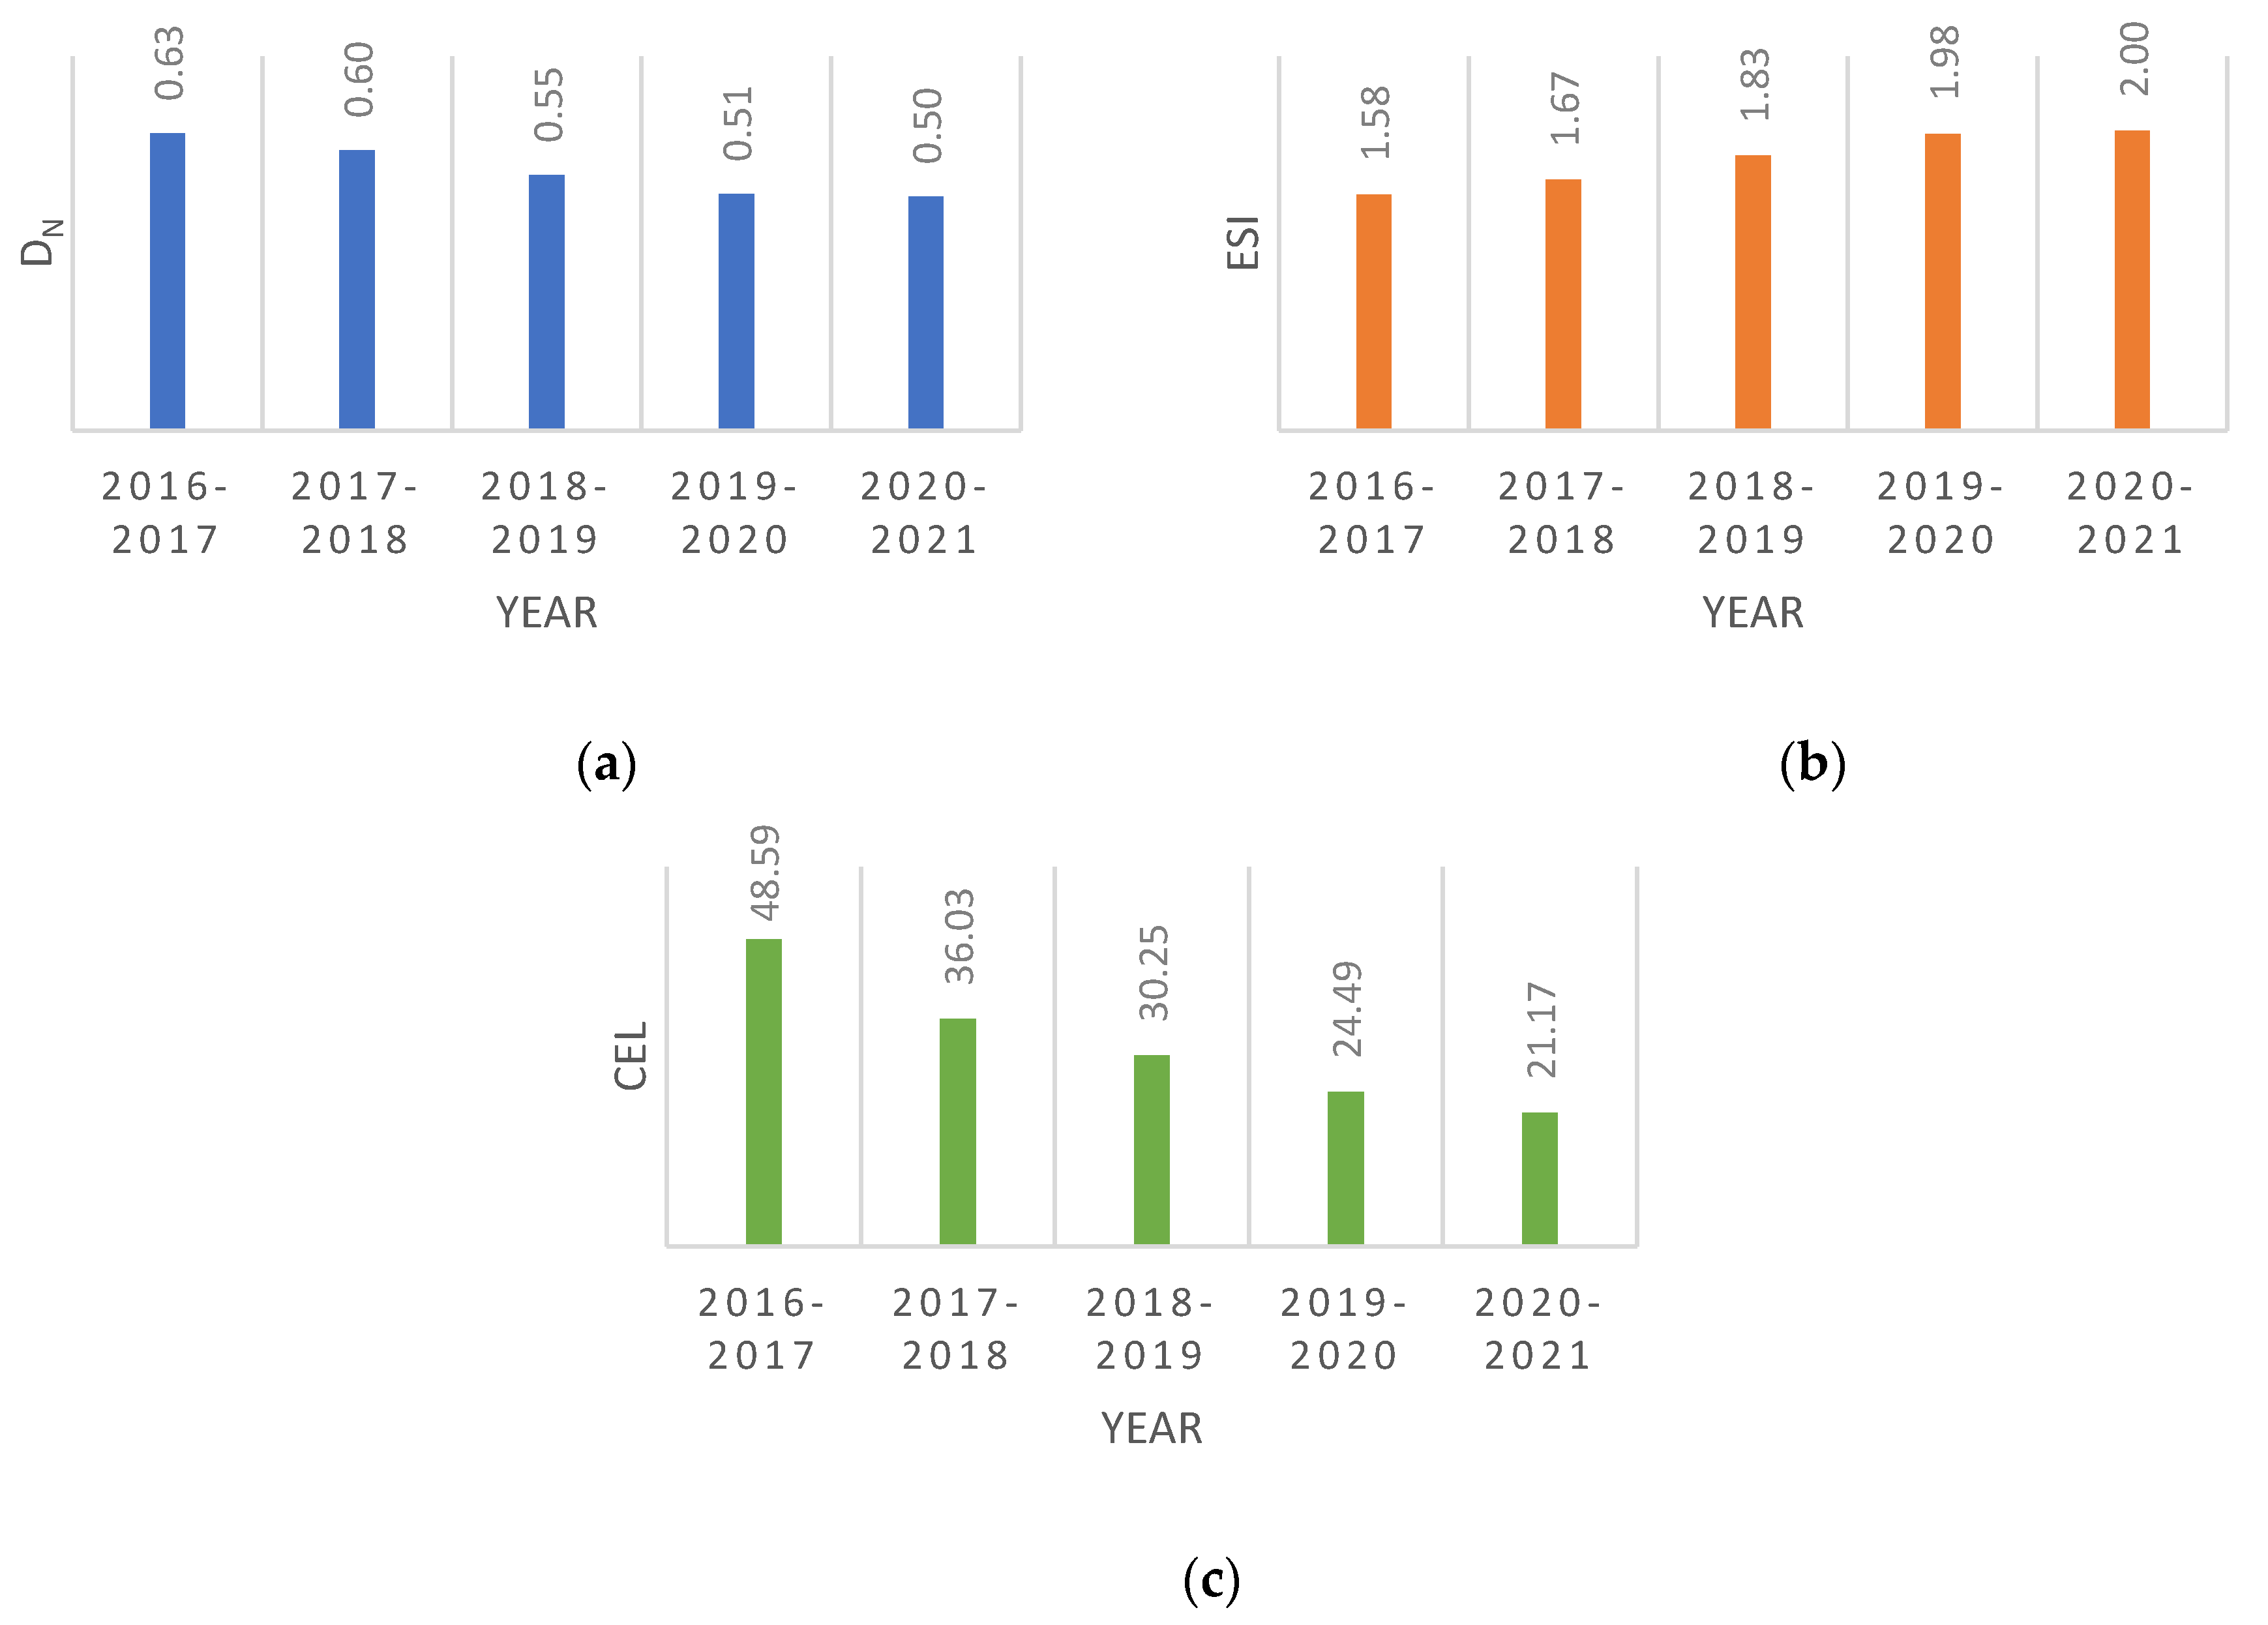
All the sustainable indicators are calculated using formulas explained and shown in the parameters for the analysis section. In Figure 4, DN, ESI, and CEL are shown. The depletion number indicates how much fuel is depleted in a system. Old technology and instruments are mainly responsible for high depletion numbers. During 2016–2017, APSCL had a high depletion number of around 0.63. It indicates 63% of the fuel is depleted in the plants. The value became 0.50 in 2020–2021, which made the system’s fuel depletion rate lower, and a lower DN is preferred for sustainable power generation.
ESI, or exergy sustainable index, is only one sustainable parameter that indicates higher sustainability in the generation sector. ESI and efficiency can be increased by reducing exergy losses. ESI is inversely proportional to the depletion number. Therefore, the lower value of the depletion number indicates a higher value of ESI, and the lower value of ESI indicates more loss. To achieve the higher value of ESI needs a lower depletion number. The FY 2020–2021 has a higher value of ESI, which is 2.00.
Cumulative exergy loss (CEL) is another sustainability parameter with a high value that indicates the lower sustainability of the generation system. CEL is proportional to exergy loss and inversely proportional to RI. CEL is calculated using mathematical expression shown in Table 3. and for the FY 2020–2021, it is about 21.17 petajoule. A comparative picture of these parameters over the operational years is shown in Figure 4.
Relative irreversibility is proportional to the ratio of exergy consumed and CEL, shown in Table 6. The higher RI is mainly responsible for energy loss from power stations due to old equipment and technology. RI is calculated for APSCL using mathematical expression shown in Table 3. The maximum RI for APSCL is 0.40, which occurred in 2016–2017 at Units 3, 4, and 5. RI varies from 0.40 to 0.22 for the same units; this lower value proves APSCL applied modern techniques for generating electricity. However, 225 MW CCPP and CCPP South’s RI increased. The exergy input and output also increased for these two CCPP units, as observed in Table 1 and Table 2.
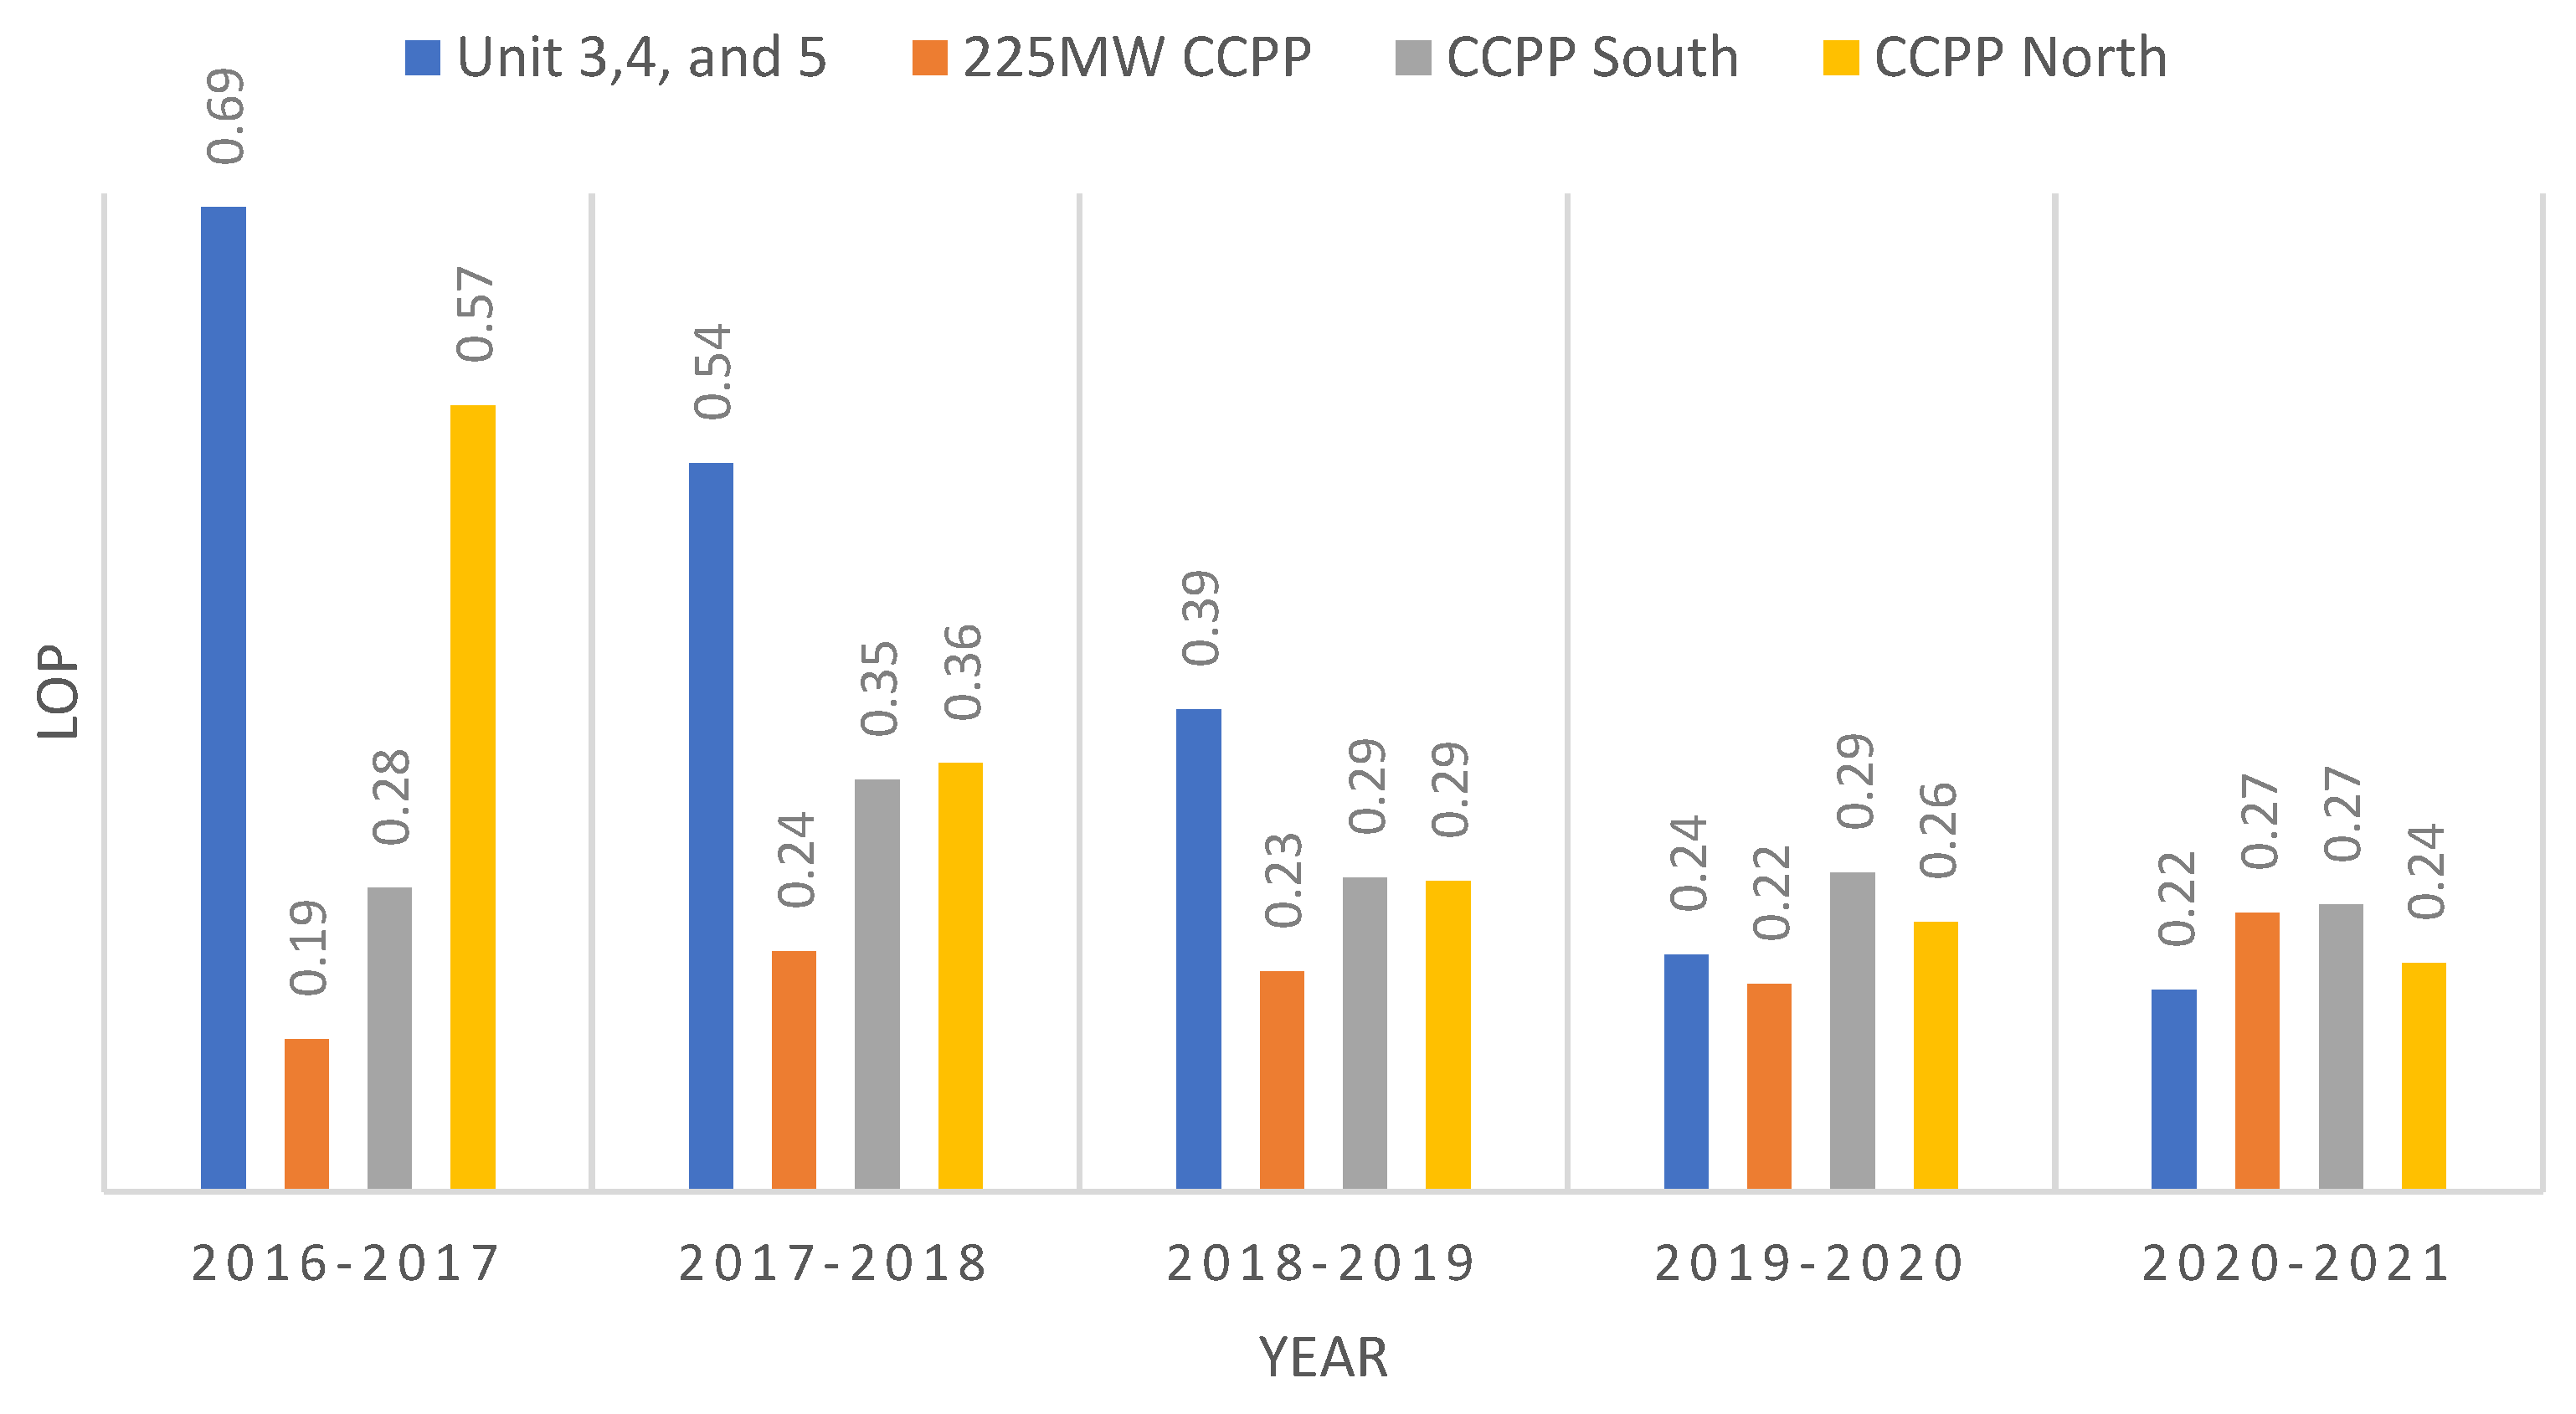
Lack of production (LOP) is the ratio of the output energy of the entire power plant to the energy that has degraded in one type of plant. LOP signifies the station’s inability to translate input into output. The LOP values in Units 3, 4, and 5 are acceptable, but the LOP at the 225 MW CCPP and CCPP South has increased. The value of CCPP North ranges between 0.40–0.22 and 0.33–0.24 for Units 3, 4, and 5, while the value of CCPP South fluctuates between 0.11–0.27 and 0.16–0.27. Figure 5 shows the LOP profile, with a lower value of LOP indicating more sustainability.
Environmental effect factor (EEF) and waste exergy ratio (WER) are two sustainability indices that are determined using mathematical expression shown in Table 3. The values are presented in Table 7. In FY 2016–2021, WER and EEF change by 0.25–0.11 and 0.75–0.33, 0.07–0.13 and 0.17–0.28, 0.10–0.14 and 0.25–0.26, 0.21–0.20 for Units 3, 4, and 5, 225 MW CCPP, CCPP South, and CCPP North, respectively. Lower values of WER and EEF are preferred for higher sustainability.
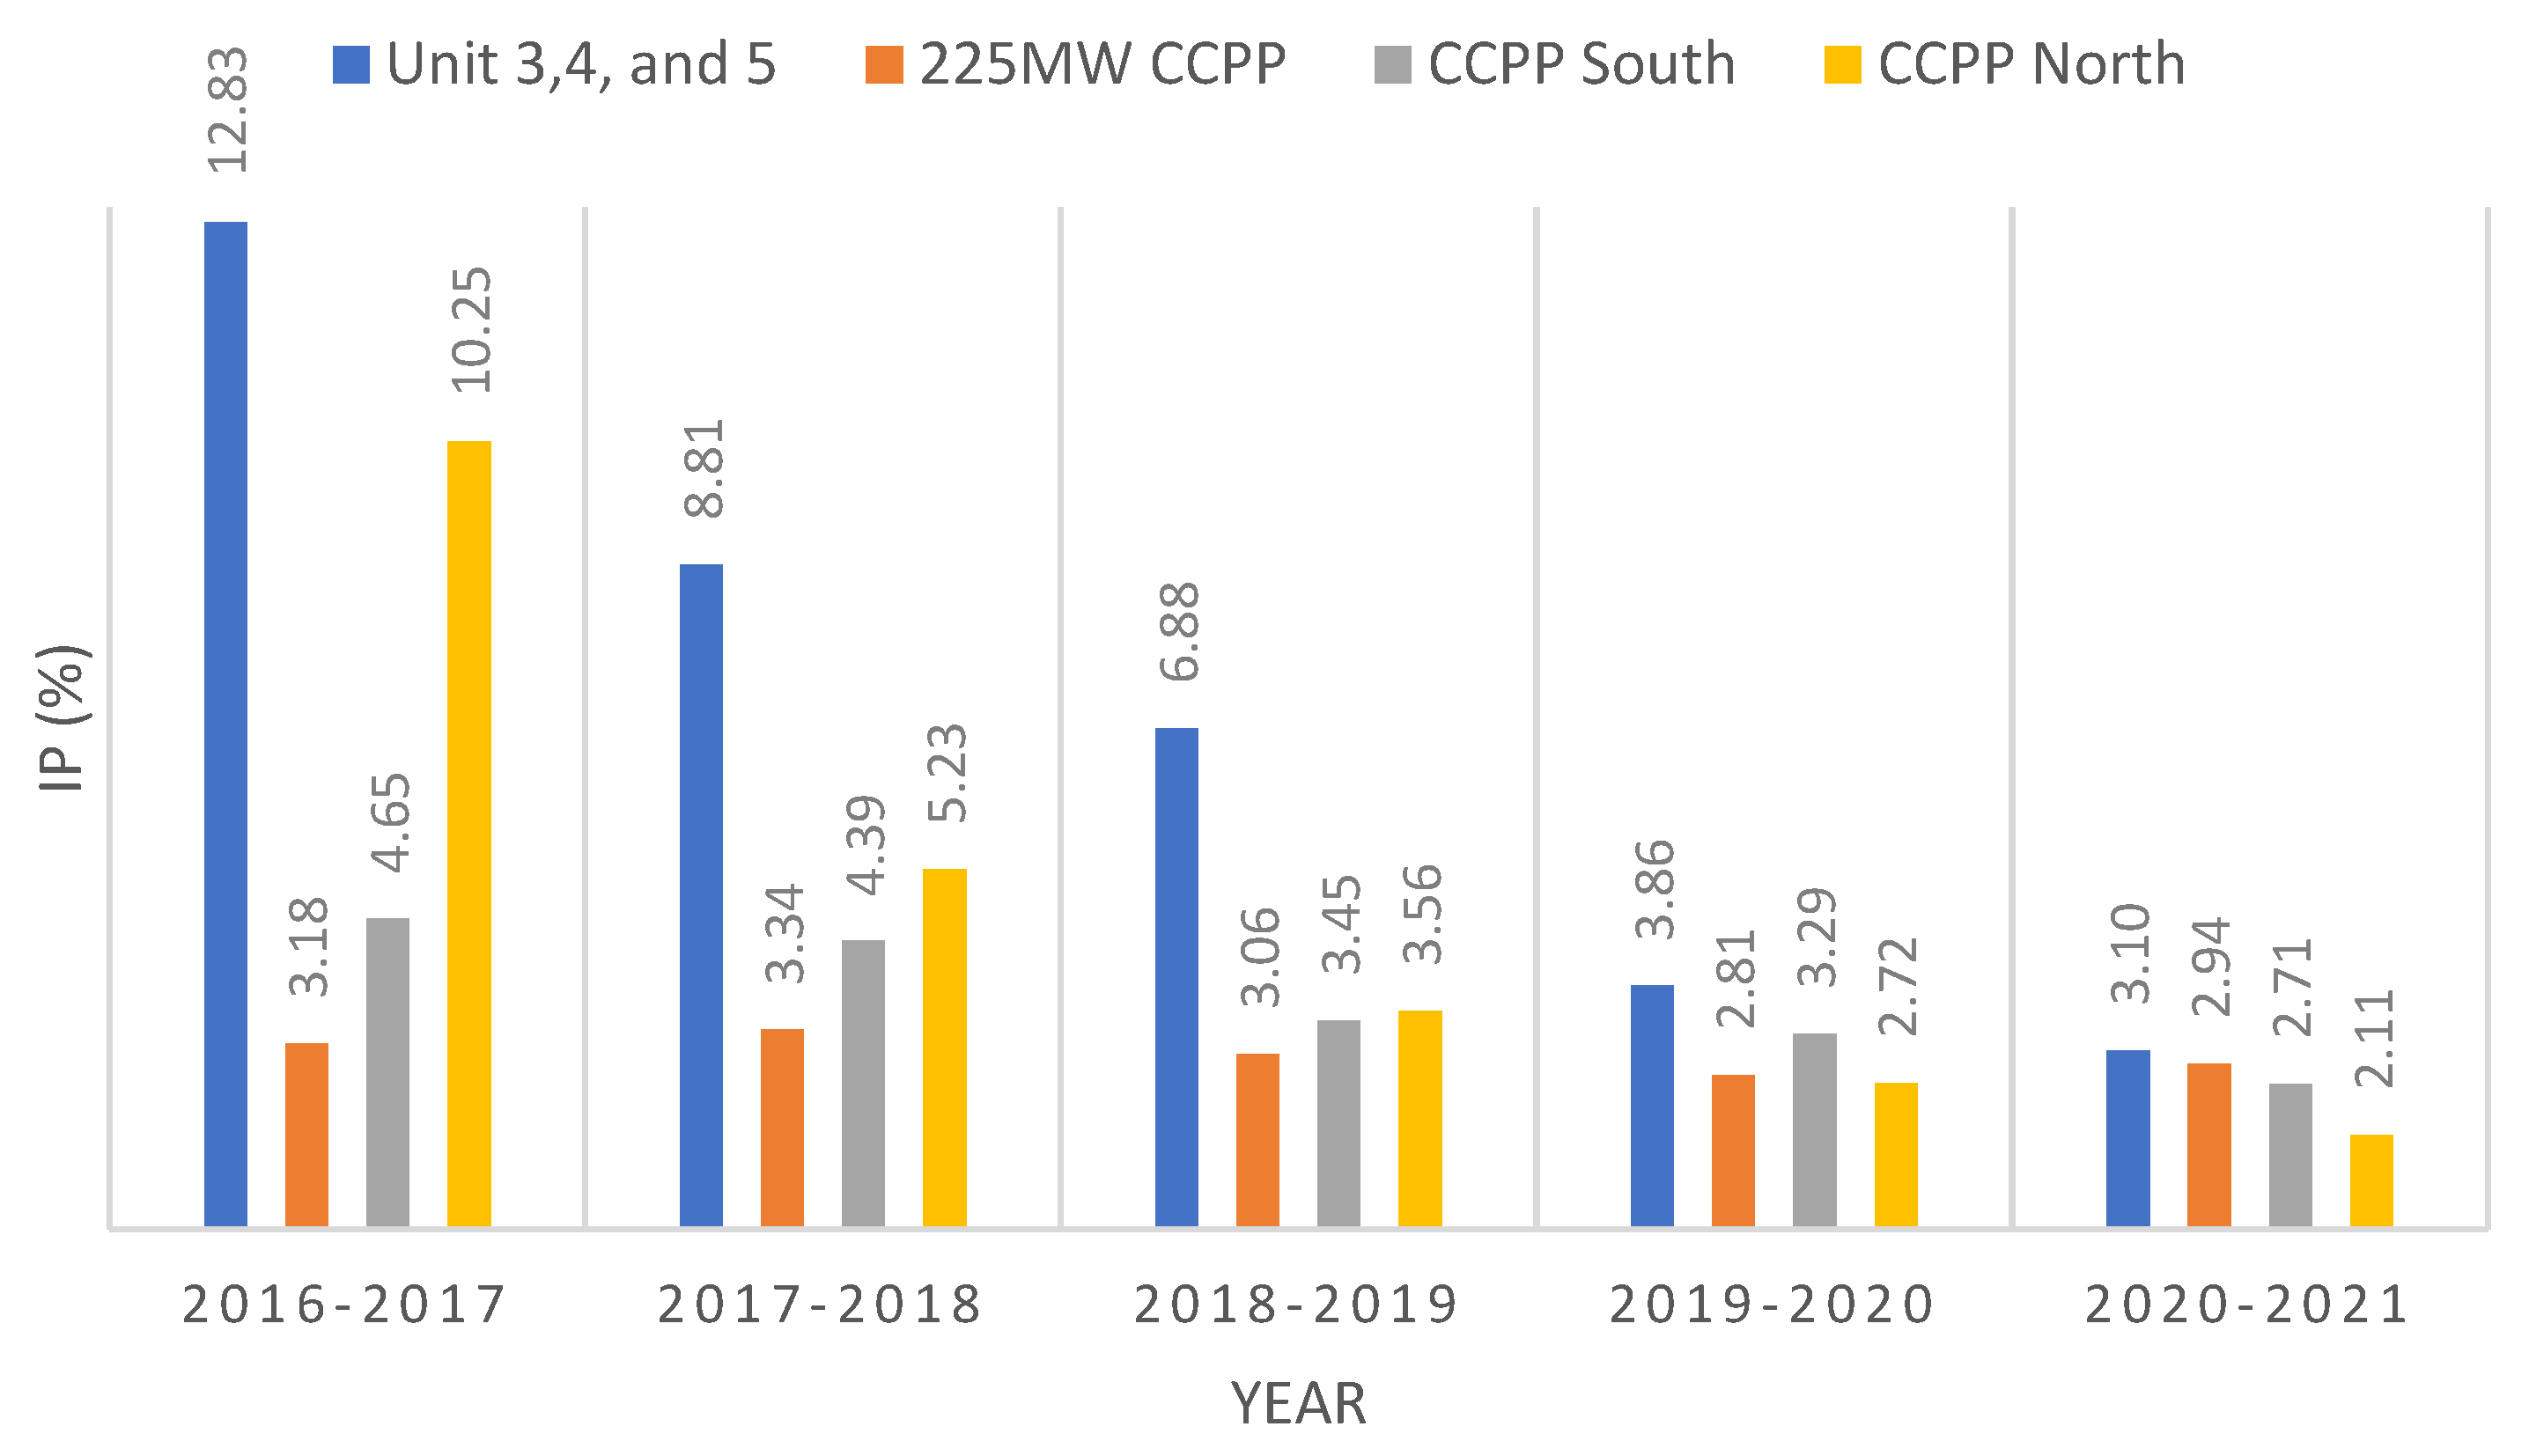
The value of improvement potential (IP) is shown in Figure 6. IP varies by 12.83–3.10, 3.18–2.94, 4.65–2.71, 10.25–2.11 for Units 3, 4, and 5, 225 MW CCPP, CCPP South, and CCPP North, respectively. The values clearly show that APSCL is improving its system, and all the values indicate higher sustainability. It is evident from Figure 6 that IP has changed over the years.
Due to irreversibility, every unit has some environmental exergy losses. The environmental exergy loss of APSCL is shown in Table 8. This loss can be addressed through advanced technological uses, innovative recycling processes, and concurrent maintenance practices. However, other units are much better than Units 3, 4, and 5 because, in Units 3, 4, and 5, environmental exergy loss increased by 1.67–2.99 over the year. Those three units are the oldest, and for this reason, loss in these units may increase over the years, and these may need to be replaced with some instruments or designs to lower environmental exergy loss.

5.3. Economic Feasibility Investigation

Although many types of fossil fuels are used as fuel in thermal power plants, natural gas-based plants are seen widely due to the availability of this resource. Most of the power plants are erected for commercial purposes. Hence, the economic feasibility of a specific type of power plant is an issue while planning future expansions. To enumerate the economic feasibility, a couple of parameters are proposed. These parameters help in comparing different methods of generation and different types of fuel used over time.
Any power station has three types of cost to consider: per capita cost, operational and maintenance cost, and fuel cost [25]. Per capita cost implies the cost of generating electricity per person in the country. A country with a large population and low to moderate power generation capacity is expected to have a high per capita generation cost. Operational and maintenance cost for any power plant is the overhead costs that should be expended over time. As plants grow old, their performances also degrade, and for that, operational and maintenance costs increase.
In some cases, impurities in fuel also cause down-performance in generation units, causing a rise in operational costs. The price of energy consumed by any generation plant is known as fuel cost. Thermal power stations have the highest fuel cost compared to other power plants. This is mainly because thermal power plants have high irreversibility and produce waste heat in the surrounding environment, which cannot be converted into useful energy output [26]. The rising fuel prices, high maintenance costs due to age-old generation units, and an ever-increasing consumer market impact electricity costs.

5.4. Generation

Although natural gas is one of the prime natural resources of Bangladesh, the per capita power generation is relatively high due to a large consumer market for electricity. Countries like Bangladesh have higher operational costs in gas-based thermal power plants. Moreover, operation and maintenance for worn-out generation units and incomplete combustion of fuels tolls upon the economic feasibility of gas-based power plants.
APSCL supplied gas from Bakhrabad Gas Distribution Company Limited, the primary fuel for electricity generation [18]. In Bangladesh, the natural gas price varies from around 70.00 to 89.49 BD TK/1000 Cft [27]; the fuel cost of this power station has been increasing over the years, as shown in Figure 7.
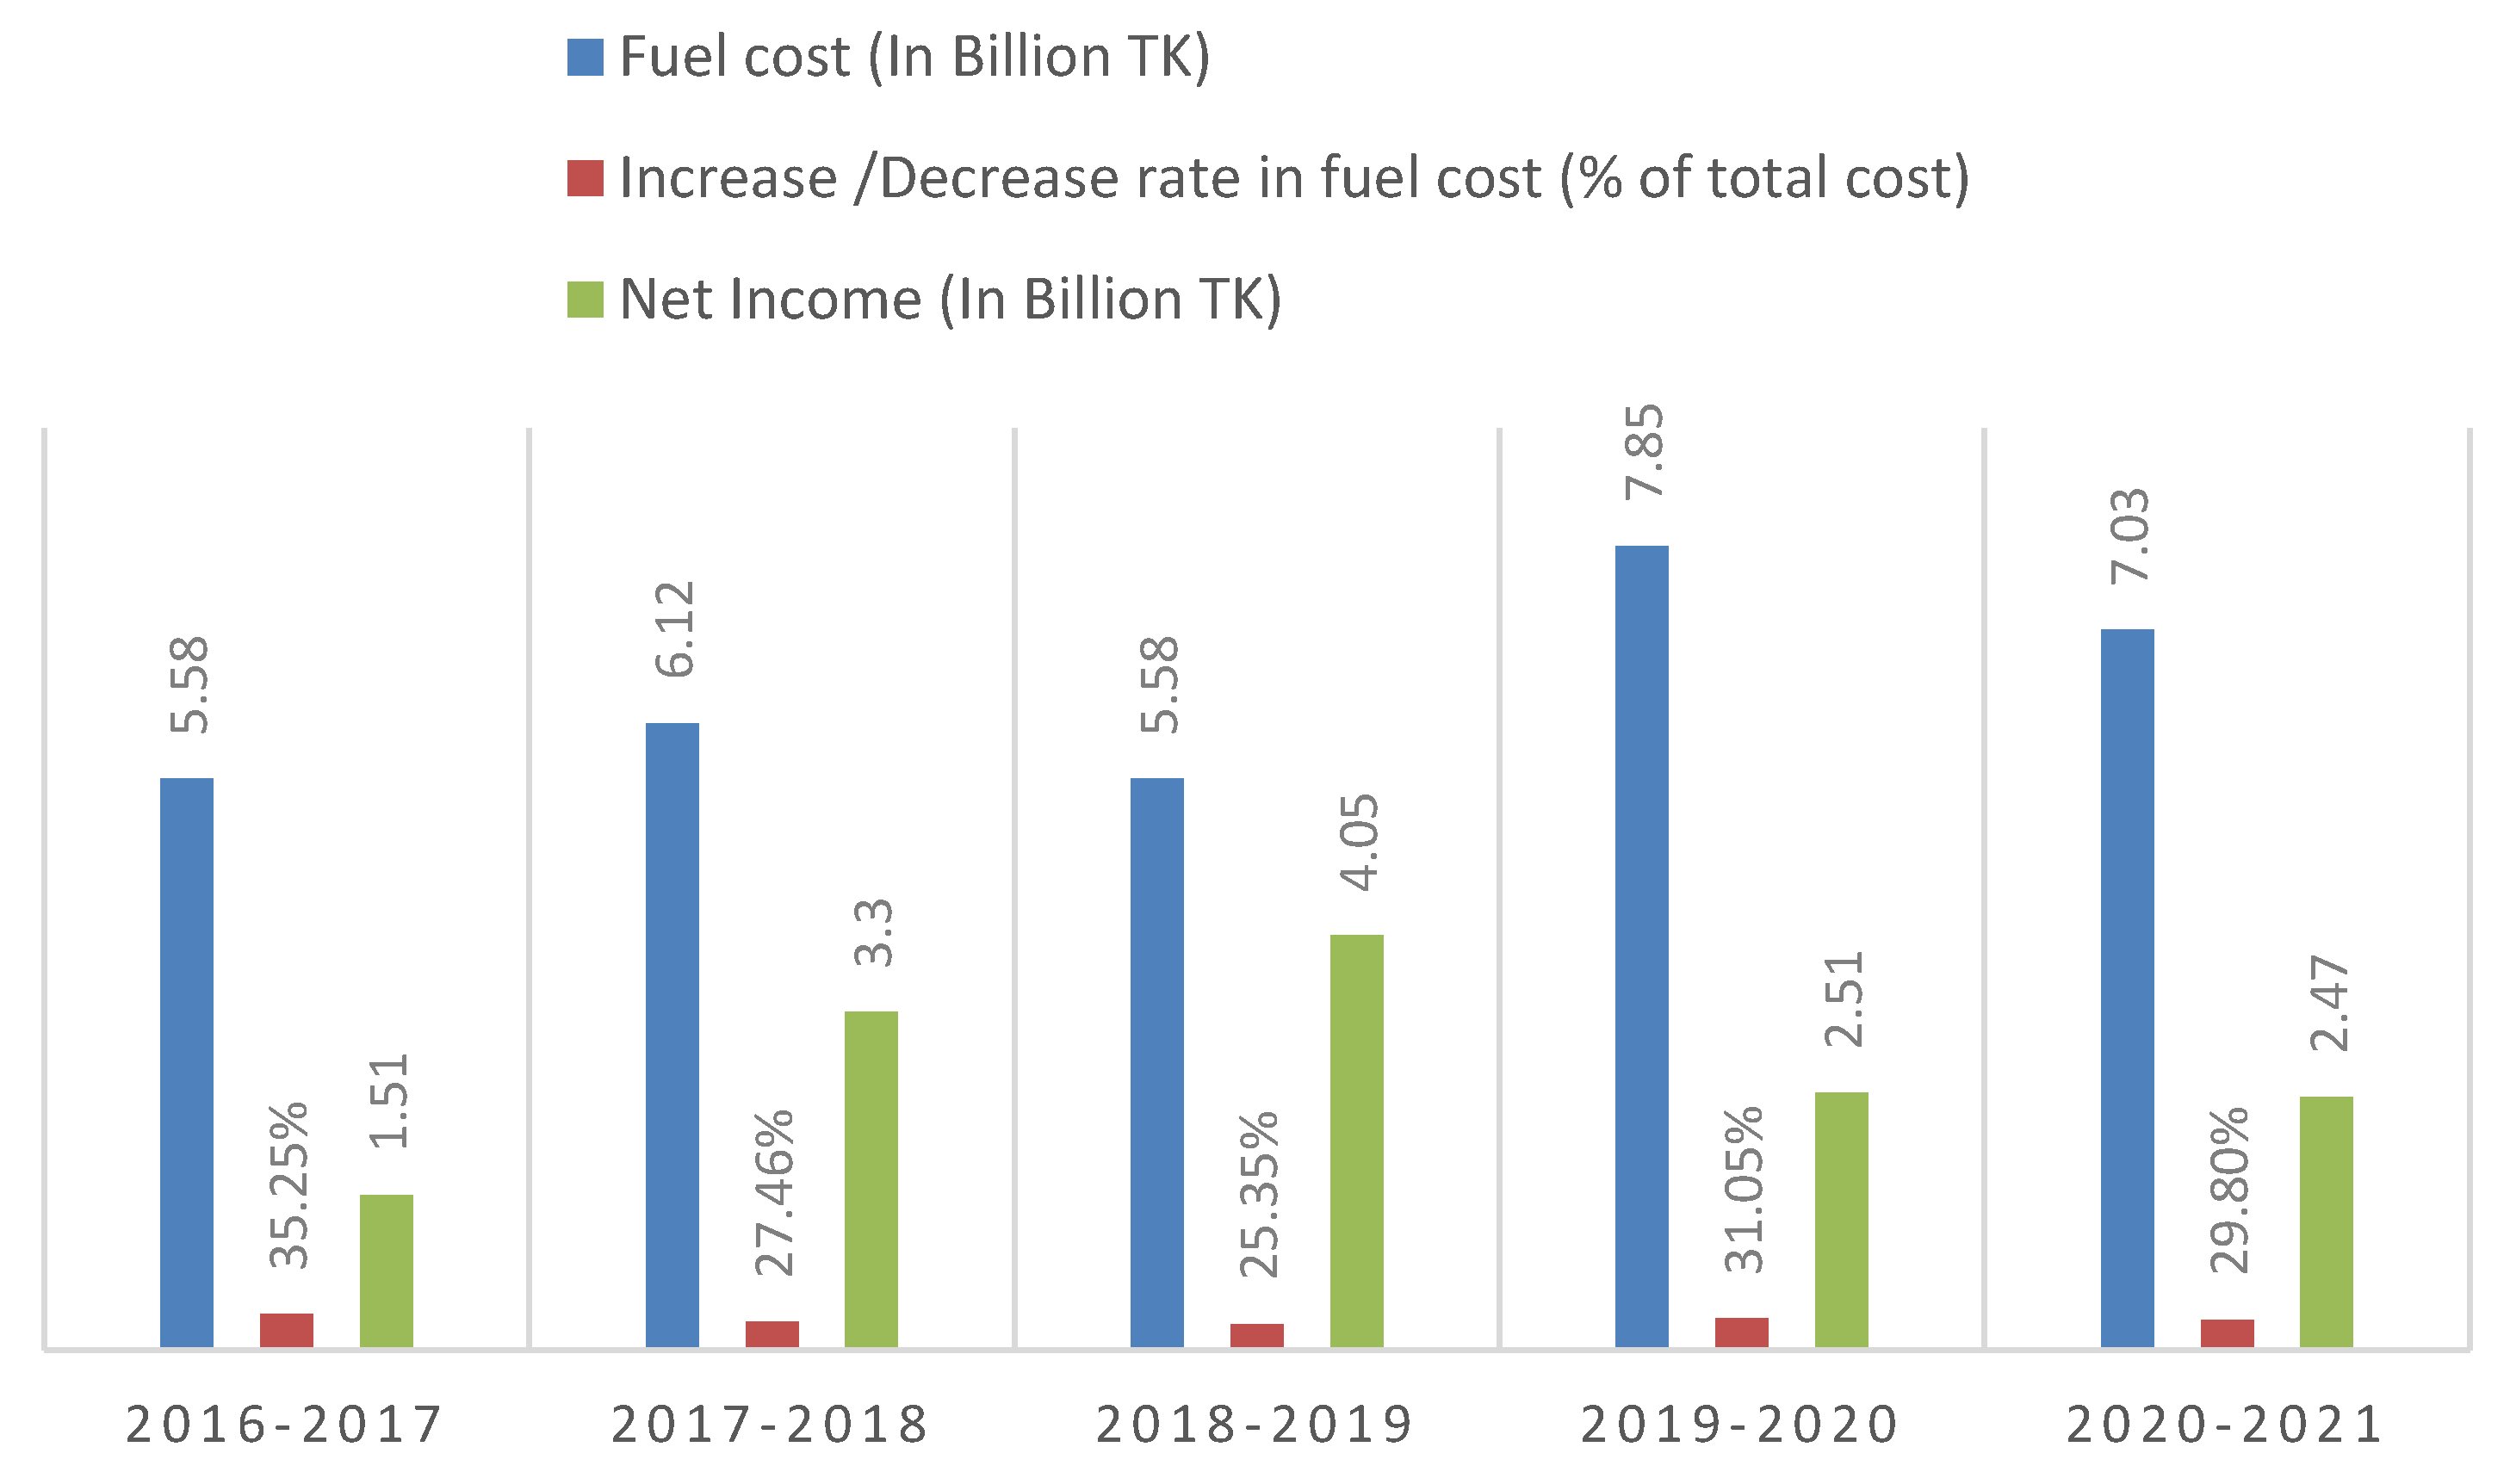
Figure 7 shows that fuel costs have increased over the years in the APSCL. The financial year 2019–2020 had the highest fuel cost, around 7.85 billion [24], while the costs for this were 31.05% of the total company’s cost compared to the previous year, thus the company’s net income was around 2.51 billion TK for the year. During 2020–2021, costs decreased by 29.80%, and net income was around 2.47 million TK. It is noticeable from Figure 7 that a significant portion of the cost of power plants is fuel cost. The reason for the vast fuel price and its increasing/decreasing rate, and consequently companies’ income, depends on the electricity demand and the electricity rate.

6. Discussion, Key Challenges, and Suggestions

Table 9 lists the sustainability parameters for CCPP North in the years 2017–2018 and 2019–2020. In this example, all the sustainability indicators are lower in the second year than the previous year. Efficiency improved in 2019–2020, and sustainability metrics also changed; LOP, WER, EEF, IP, and EEL decreased, and RI’s value also increased in comparison to other units. Although being calculated for entire power plants, DN, ESI, and CEL show a clear downward trend from 2017 to 2020: DN fell from 0.60 to 0.51; ESI rose from 1.67 to 2.00%; and CEL fell from 36.03 to 24.49. Several techniques are used by each sustainable metric to demonstrate unit sustainability. It’s obvious that this unit was more effective in 2019–2020 than in 2017–2018.
The country’s power sector should diversify its fuel sources and look into utilizing renewable energy sources rather than relying just on one kind of power plant to produce electricity. Nonetheless, after studying the plant’s economic analysis, the authors have the following recommendations:
  • From the overall fuel cost analysis of the APSCL from 2016 to 2021, it can be observed that the yearly fuel cost increased from 5.58 billion to 7.03 billion TK, although the plant has the same capacity. This is not only financially threatening but also environmentally damaging. This is primarily caused by the facilities’ poor maintenance and the deterioration of existing installations. Periodic inspection and maintenance and up-gradation of equipment to high-efficiency generation units could solve this problem.
  • From an exergetic point of view, the amount of heat lost in the environment due to irreversibility has a toll on the input fuel used; hence high irreversibility results in increased fuel expenses. Using graded lubricants in the generation unit could reduce irreversibility in the plant. Moreover, the humane factor should also be considered in lowering financial losses.
  • Training staff members on efficient operation, planning, and repair of faulty parts could significantly improve the plant’s overall performance. Besides intelligent supply chain management, the use of digital technology for monitoring could enhance the output from investment.
  • Another factor that the management of power plants should monitor routinely is the plant’s carbon footprint and other environmental hazards. All these factors together would present an efficient, sustainable, and feasible system with less impact on the environment.
  • Also, the correlation between such activities with the exergetic analysis and sustainability measures can present valuable guidelines regarding investment and policy decisions at the plant, national and global levels.
  • Fuel cost is one of the most crucial power plant costs. For fossil-fired plants, it dominates the total cost. The transportation and storage system of the fuel is one of the main factors for high prices, and it may be the reason for the higher cost of generating electricity.
  • The effectiveness of a power plant is mainly measured financially. A plant’s effectiveness depends on its efficiency. Most thermal power plants are not economical, but efficiency is the main factor that represents energy cost.

7. Conclusions

This study aimed to assess the efficiency, sustainability, and economic feasibility of gas-fired power plants in Bangladesh, focusing on the case of APSCL and utilizing exergetic parameters. The analysis of temporal data revealed that the efficiency of the power plants declined over time due to a lack of proper maintenance and equipment upgrades, which resulted in reduced profitability. Despite the high exergy and environmental exergy losses caused by irreversibility, sustainability indicators, such as DN, ESI, CEL, RI, LOP, WER, EEF, and IR, remained favourable from 2016–2021. The study also identified that the economic feasibility of APSCL was impacted by fuel costs and the station’s generation capacity. The data showed that in 2019–2021, the plant’s production capacity decreased, while fuel consumption remained constant, leading to an increase in losses. Additionally, fuel prices gradually increased, impacting the cost per capita of power generation, and further adding to the financial burden. Overall, while natural gas-based power plants are considered sustainable in the long run, they can pose financial challenges due to high overhead maintenance and operation costs. Furthermore, dependence on fuel prices can lead to increased electricity prices or accumulated losses. To ensure the long-term sustainability and returns on investments in thermal power plants in Southeast Asian countries, such as APSCL in Bangladesh, it is crucial to implement forward-looking maintenance and cost-effective fuel-sourcing strategies. In conclusion, the study highlights the importance of a holistic approach towards assessing the sustainability, efficiency, and economic feasibility of power plants to inform decision-making and guide maintenance and investment strategies.

Author Contributions

Conceptualization, M.H.M. and S.A.J.; methodology, S.A.J. and M.R.; writing—original draft preparation, S.A.J. and M.R.; writing—actual draft preparation, M.H.M., S.A.J. and M.R.; writing—review and editing, S.S., M.R.S., M.S.H.L., R.H.A., M.S.K. and A.S.M.S.; supervision, M.H.M.; project administration, S.S., M.R.S. and M.S.H.L.; funding acquisition, S.S. All authors have read and agreed to the published version of the manuscript.

Funding

The authors would like to thank the Universiti Kebangsaan Malaysia (UKM) for supporting this research through the Geran Galakan Penyelidik Muda GGPM-2022-064.

Institutional Review Board Statement

Not applicable.

Informed Consent Statement

Not applicable.

Data Availability Statement

Not Applicable.

Acknowledgments

The authors acknowledge the Green University of Bangladesh for providing laboratory facilities to conduct this research.

Conflicts of Interest

The authors declare no conflict of interest.

Abbreviation

APSCLAshuganj Power Station Company Limited
BPDBBangladesh Power Development Board
CCPPCombined Cycle Power Plant
CELCumulative Exergy Loss
EEFEnvironmental Effect Factor
EELEnvironmental Exergy Loss
ESIExergy Sustainable Index
GTGas Turbine
HPTHigh-Pressure Turbine
HRSGHeat Recovery Steam Generator
IPImprovement Potential
IPTIntermediate Pressure Turbine
LOPLack of Production
LPTLow-Pressure Turbine
PJPetajoules Unit
RIRelative irreversibility
STSteam Turbine
WERWaste Exergy Loss
ηEnergy Efficiency
ϕExergy Efficiency
EղeOverall Energy Efficiency
EϕeOverall Exergy Efficiency
DNDepletion Number

References

  1. Dehghan, H.; Amin-Naseri, M.R.; Nahavandi, N. A system dynamics model to analyze future electricity supply and demand in Iran under alternative pricing policies. Util. Policy 2021, 69, 101165. [Google Scholar] [CrossRef]
  2. Yemelyanov, O.; Symak, A.; Petrushka, T.; Vovk, O.; Ivanytska, O.; Symak, D.; Havryliak, A.; Danylovych, T.; Lesyk, L. Criteria, Indicators, and Factors of the Sustainable Energy-Saving Economic Development: The Case of Natural Gas Consumption. Energies 2021, 14, 5999. [Google Scholar] [CrossRef]
  3. Kanwal, S.; Mehran, M.T.; Hassan, M.; Anwar, M.; Naqvi, S.R.; Khoja, A.H. An integrated future approach for the energy security of Pakistan: Replacement of fossil fuels with syngas for better environment and socio-economic development. Renew. Sustain. Energy Rev. 2022, 156, 111978. [Google Scholar] [CrossRef]
  4. Maruf, M.H.; ul Haq, M.A.; Dey, S.K.; Al Mansur, A.; Shihavuddin, A.S.M. Adaptation for sustainable implementation of Smart Grid in developing countries like Bangladesh. Energy Rep. 2020, 6, 2520–2530. [Google Scholar] [CrossRef]
  5. Looney, B. Statistical Review of World Energy globally consistent data on world energy markets. Authoritative Publ. Field Energy Rev. World Energy Data 2021, 70, 8–20. [Google Scholar]
  6. Maruf, M.H.; Rabbani, M.; Ashique, R.H.; Islam, M.T.; Nipun, M.K.; Haq, M.A.U.; Al Mansur, A.; Shihavuddin, A.S.M. Exergy based evaluation of power plants for sustainability and economic performance identification. Case Stud. Therm. Eng. 2021, 28, 101393. [Google Scholar] [CrossRef]
  7. Singh, O.K.; Kaushik, S.C. Energy and exergy analysis and optimization of Kalina cycle coupled with a coal fired steam power plant. Appl. Therm. Eng. 2013, 51, 787–800. [Google Scholar] [CrossRef]
  8. Lara, Y.; Petrakopoulou, F.; Morosuk, T.; Boyano, A.; Tsatsaronis, G. An exergy-based study on the relationship between costs and environmental impacts in power plants. Energy 2017, 138, 920–928. [Google Scholar] [CrossRef] [Green Version]
  9. Cheng, Q.L.; Yu, T.; Xiang, X.Y. The thermodynamic background of exergy transfer. In Proceedings of the 2010 Asia-Pacific Power and Energy Engineering Conference, Chengdu, China, 28–31 March 2010; Volume 21, pp. 155–159. [Google Scholar] [CrossRef]
  10. Esily, R.R.; Chi, Y.; Ibrahiem, D.M.; Amer, M.A. The potential role of Egypt as a natural gas supplier: A review. Energy Rep. 2022, 8, 6826–6836. [Google Scholar] [CrossRef]
  11. Hossain, S.; Chowdhury, H.; Chowdhury, T.; Ahamed, J.U.; Saidur, R.; Sait, S.M.; Rosen, M.A. Energy, exergy and sustainability analyses of Bangladesh’s power generation sector. Energy Rep. 2020, 6, 868–878. [Google Scholar] [CrossRef]
  12. Chowdhury, T.; Chowdhury, H.; Chowdhury, P.; Sait, S.M.; Paul, A.; Ahamed, J.U.; Saidur, R. A case study to application of exergy-based indicators to address the sustainability of Bangladesh residential sector. Sustain. Energy Technol. Assess. 2020, 37, 100615. [Google Scholar] [CrossRef]
  13. Amiri, Z.; Asgharipour, M.R.; Campbell, D.E.; Armin, M. Extended exergy analysis (EAA) of two canola farming systems in Khorramabad, Iran. Agric. Syst. 2020, 180, 102789. [Google Scholar] [CrossRef]
  14. Badmus, I.; Osunleke, A.S.; Fagbenle, R.O.; Oyewola, M.O. Energy and exergy analyses of the Nigerian transportation sector from 1980 to 2010. Int. J. Energy Environ. Eng. 2012, 3, 1–7. [Google Scholar] [CrossRef] [Green Version]
  15. Kanoglu, M.; Dincer, I.; Rosen, M.A. Understanding energy and exergy efficiencies for improved energy management in power plants. Energy Policy 2007, 35, 3967–3978. [Google Scholar] [CrossRef]
  16. Utlu, Z.; Hepbasli, A. Assessment of the Turkish utility sector through energy and exergy analyses. Energy Policy 2007, 35, 5012–5020. [Google Scholar] [CrossRef]
  17. Bangladesh Energy Situation-Energypedia. Available online: https://energypedia.info/wiki/Bangladesh_Energy_Situation#Production (accessed on 9 April 2022).
  18. Ashuganj Power Station Company Ltd. Available online: http://www.apscl.gov.bd/site/page/4f8746c6-29b2-434b-8151-8e0c5acd4f5f/- (accessed on 11 November 2022).
  19. Rajput, R.K. Power Plant Engineering; Laxmi Publications: Delhi, India, 2023. [Google Scholar]
  20. Drbal, L.; Westra, K.; Boston, P. Power Plant Engineering; Springer Science&Business Media: Berlin/Heidelberg, Germany, 2012. [Google Scholar]
  21. Junejo, F.; Saeed, A.; Hameed, S. 5.19 Energy Management in Ocean Energy Systems; Elsevier: Amsterdam, The Netherlands, 2018. [Google Scholar]
  22. dos Santos Mascarenhas, J.; Chowdhury, H.; Thirugnanasambandam, M.; Chowdhury, T.; Saidur, R. Energy, exergy, sustainability, and emission analysis of industrial air compressors. J. Clean. Prod. 2019, 231, 183–195. [Google Scholar] [CrossRef]
  23. Ehsan, A.; Saffari, H. Experimental analysis of dropwise condensation heat transfer on a finned tube: Impact of pitch size. Proc. Inst. Mech. Eng. Part A J. Power Energy 2022, 236, 752–759. [Google Scholar]
  24. Bangladesh Power Development Board. Available online: http://119.40.95.168/bpdb/new_annual_reports (accessed on 11 November 2022).
  25. Munir, M.T.; Yu, W.; Young, B.R. Can exergy be a useful tool for the dairy industry? In Computer Aided Chemical Engineering; Elsevier: Amsterdam, The Netherlands, 2014; Volume 33, pp. 1129–1134. [Google Scholar]
  26. Almansoori, M.H.; Dadach, Z.E. Exergy efficiency and environmental impact of electricity of a 620 MW-natural gas combined cycle. J. Power Energy Eng. 2018, 6, 1–21. [Google Scholar] [CrossRef] [Green Version]
  27. Imam, M.T.; Maruf, M.H.; Al Mansur, A.; Shihavuddin, A.S.M. Reducing levelized cost of energy using gas generator in off-grid wind-PV hybrid system. In Proceedings of the 2021 3rd International Conference on Sustainable Technologies for Industry 4.0 (STI), Dhaka, Bangladesh, 18–19 December 2021; pp. 1–6. [Google Scholar]
Figure 1. Yearly record of the establishment of APSCL with generation capacity at a glance.
Sustainability 15 05452 g001
Figure 2. An overall methodological framework to assess the performance of a thermal power plant.
Sustainability 15 05452 g002
Figure 3. Energy and exergy efficiencies of different units calculated during 2016–2021 (a) Units 3, 4, and 5, each 150 MW, (b) 225 MW CCPP, (c) 450 MW CCPP South, (d) 450 MW CCPP North.
Sustainability 15 05452 g003
Figure 4. DN, ESI, and CEL of the plants from 2016–2021. (a) Depletion Number (DN); (b) Exergy Sustainable Index (ESI); (c) Cumulative Exergy Loss (CEL).
Sustainability 15 05452 g004
Figure 5. LOP of the plants for the different units of APSCL from 2016–2021.
Sustainability 15 05452 g005
Figure 6. IP of the plants from 2016–2021.
Sustainability 15 05452 g006
Figure 7. Financial overview of the APSCL from FY 2016 to 2021.
Sustainability 15 05452 g007
Table 1. This study regarding the sectorial exergy analysis.
CountryFieldsAnalyzed YearRefs.
BangladeshGeneration Sector2020[11]
BangladeshResidential2020[12]
IranAgriculture2020[13]
IndiaGeneration Sector2013[7]
NigeriaTransport2012[14]
TurkeyGeneration Sector2007[15]
TurkeyUtility Sector2007[16]
Table 2. Values of exergy factor for a different fuel.
FuelExergy Factor
Natural gas0.93
Oil, petroleum products1.06
Biofuel1.11
Diesel1.07
Coal1.06
Table 3. Relations between sustainability indicators and their parameters in the generation sector.
Parameters Sustainability Indicators
Depletion Number (DN)   D N = Exergy   Decayed   Exergy   Input
  • Amount of fuel depleted in the plants.
  • Lower DN suggests less fuel depleted in the plants.
  • Lower DN has a positive impact on exegetic sustainability.
  • Indicates systems’ fossil fuel utilization rate.
Exergy Sustainable Index (ESI) ESI = 1 D N
  • Measures the quality of the process in the transfer of mass and conservation principle.
  • A high ESI means the system has more stability or sustainability.
Cumulative Exergy Loss (CEL) CEL =   Exergy   Generated     D N
  • Indicates overall exergy loss in a system.
  • Helps to understand systems’ irreversibility.
  • Sustainability will increase if CEL decreases.
Relative Irreversibility (RI) RI = D N CEL
  • Shows the system’s irreversibility. Irreversibility describes the amount of exergy destroyed or wasted work potential in a compact design.
  • It shows irreversibility is responsible for exergy loss as well as sustainability.
Lack of Production (LOP) LOP = D N   in   One   Type   of   Plant Whole   System s   Exergy   Output
  • It shows the incapability of the power station to convert the input to output.
  • A power station’s incapability decreases sustainability.
Waste Exergy Ratio (WER) WER = D N   in   One   Type   of   Plant Whole   System s   Exergy   Input
  • This shows which plant is wasted less exergy than other plants.
  • Indicates which plants are more sustainable and waste less exergy.
Environmental Effect Factor (EEF)   EEF = Waste   Exergy   Ratio   Exergy   Efficiency
  • Indicates the impact of wasted exergy on the environment.
  • EEF needs to reach lower to achieve higher sustainability.
Improvement Potential (IP) IP = 1 ϕ × Exergy   Input Exergy   Output
  • IP shows a power station either needs improvement or does not achieve sustainability.
  • Its higher value indicates the system needs improvements.
Environmental Exergy Loss (EEL) EEL = CEL Input   Exergy
  • Indicates the amount of lost exergy in the environment when a system is in the working period.
Table 4. Energy input and output for the different units of APSCL. All data are in the PJ unit.
YearsUnits 3, 4, and 5225 MW CCPPCCPP SouthCCPP North
InputOutputInputOutputInputOutputInputOutput
2016–201731.3210.549.693.9314.405.9126.899.67
2017–201820.736.7211.274.9017.388.3315.416.10
2018–201915.154.5712.115.8016.588.7415.848.05
2019–20209.423.1711.135.3315.988.4615.608.85
2020–20217.622.5811.775.6613.247.0412.937.52
Table 5. Exergy input and output for the different units of APSCL. All data are in the PJ unit.
YearsUnits 3, 4, and 5225 MW CCPPCCPP SouthCCPP North
InputOutputInputOutputInputOutputInputOutput
2016–201729.139.809.013.6613.395.5025.019.00
2017–201819.286.2510.484.5616.177.7514.335.68
2018–201914.094.2511.265.3915.428.1214.737.49
2019–20208.762.9510.354.9514.867.8714.518.23
2020–20217.092.4010.945.2712.326.5412.026.99
Table 6. RI of the plants from 2016–2021.
YearsUnits 3, 4, and 5225 MW CCPPCCPP SouthCCPP North
2016–20170.400.110.160.33
2017–20180.360.160.230.24
2018–20190.330.190.240.24
2019–20200.240.220.290.26
2020–20210.220.270.270.24
Table 7. WRI and EEF of the plants from 2016–2021.
YearsUnits 3, 4, and 5225 MW CCPPCCPP SouthCCPP North
WEREEFWEREEFWEREEFWEREEF
2016–20170.250.750.070.170.100.250.210.58
2017–20180.220.670.100.230.140.290.140.36
2018–20190.180.590.110.220.130.250.130.26
2019–20200.120.360.110.230.140.270.130.23
2020–20210.110.330.130.280.140.260.120.20
Table 8. Environmental exergy loss of the plants.
YearsUnits 3, 4, and 5225 MW CCPPCCPP SouthCCPP North
2016–20171.675.393.631.94
2017–20181.873.442.232.51
2018–20192.152.691.962.05
2019–20202.792.371.651.69
2020–20212.991.931.721.76
Table 9. Comparing the values of different sustainability parameters in a single unit with two different years.
Sustainability ParametersCCPP NorthPreferred Values
2017–20182019–2020
Efficiency (Exergy)38.41%55%Higher
RI0.240.26Lower
LOP0.360.26Lower
WER0.140.13Lower
EEF0.360.23Lower
IP5.232.72Lower
EEL2.511.69Lower
Disclaimer/Publisher’s Note: The statements, opinions and data contained in all publications are solely those of the individual author(s) and contributor(s) and not of MDPI and/or the editor(s). MDPI and/or the editor(s) disclaim responsibility for any injury to people or property resulting from any ideas, methods, instructions or products referred to in the content.

